KFF designs, conducts and analyzes original public opinion and survey research on Americans’ attitudes, knowledge, and experiences with the health care system to help amplify the public’s voice in major national debates.
How State Policies Shape Access to Abortion Coverage
Editorial note: Updated July 24, 2026 with new updates for Pennsylvania.
State and federal efforts to limit abortion coverage began soon after the 1973 Supreme Court’s Roe v Wade decision. In 1977, the Hyde Amendment banned federal funding for abortion, with exceptions for pregnancies that endanger the life of the woman, or result from rape or incest. Some states use their own funds to cover other medically necessary abortions for their Medicaid enrollees or have been compelled to do so by the courts. The passage of the ACA in 2010 led to renewed legislative efforts to limit abortion coverage, this time in private insurance plans. The ACA maintains the Hyde Amendment’s limits, and permits states to ban abortion coverage from Marketplace plans. Since 2010, many states have enacted private plan restrictions and also banned abortion coverage from Marketplace plans, some of which are more restrictive than the Hyde limitations. A handful of states, however, have enacted laws that require private plans to cover abortion and state funds to cover abortions for Medicaid enrollees.
The interactive map below shows the increase in states with laws restricting abortion coverage for Medicaid and private insurance enrollees in 2010 compared to the present.
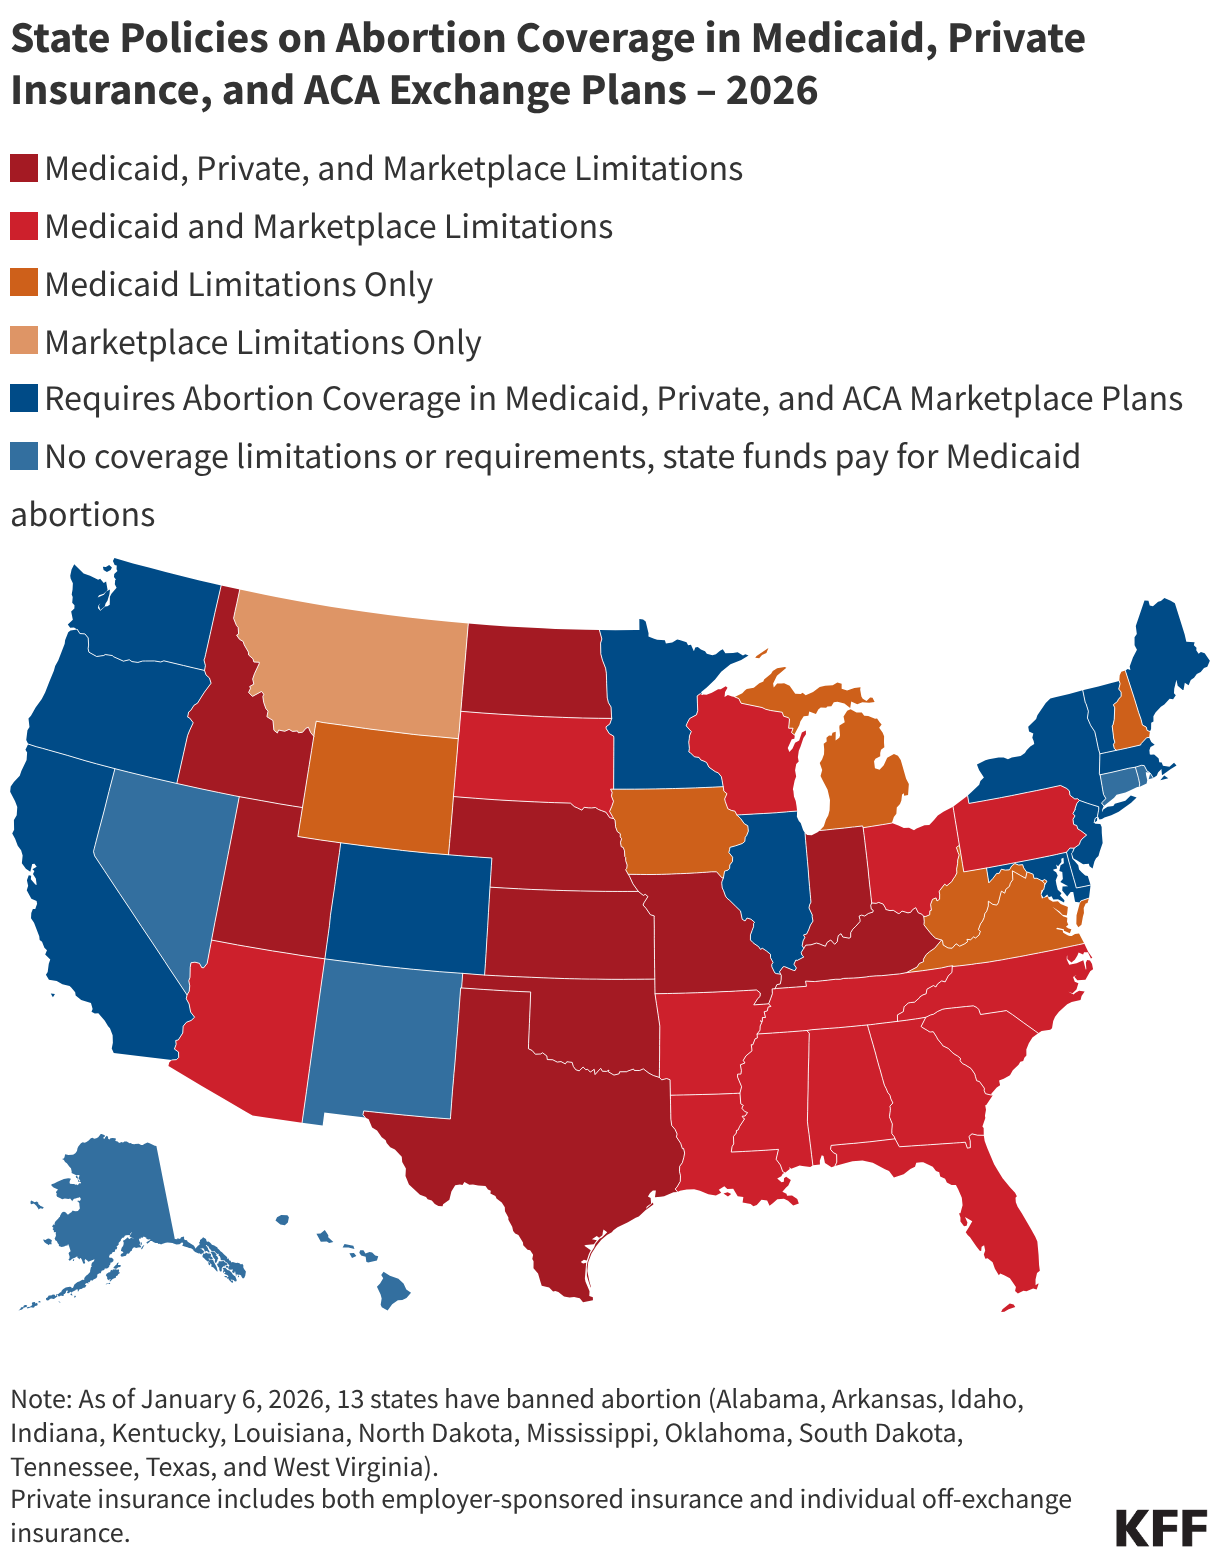
On June 24, 2022, the Supreme Court overturned Roe v. Wade, eliminating the federal constitutional standard that had protected the right to abortion. States can now set their own policies to ban or protect abortion. As of January 6, 2026, 13 states have banned abortion (Alabama, Arkansas, Idaho, Indiana, Kentucky, Louisiana, North Dakota, Mississippi, Oklahoma, South Dakota, Tennessee, Texas, and West Virginia). For more details about legal status of abortion in states, please visit our Abortion in the United States Dashboard.
Medicaid Coverage Limitations (29 states & DC) - State limits Medicaid coverage of abortion to the Hyde Amendment restrictions (only allowed in the cases of rape, incest or life endangerment).
Private Insurance Coverage Limitations (10 states) - State has a law that prohibits coverage of abortions from being included in private insurance policies sold in the state (with certain exceptions). Private insurance includes individual, small group, and large group. Some states may allow abortion coverage to be purchased as a rider.
State Marketplace Coverage Limitations (25 states) - State has a law that prohibits plans sold on state Marketplaces from covering abortion (with certain exceptions).
No Coverage Limitations(6 states) - State does not limit coverage of abortion in private insurance or the state Marketplace and the state does not ban the use of state funds (non-federal) to pay for abortion for Medicaid enrollees in circumstances outside of those allowed by the Hyde Amendment.
Requires Abortion Coverage in Private and ACA Marketplace Plans and for Medicaid Enrollees (13 states) - State requires all fully-insured group plans and individual plans to include abortion coverage and state funds to cover abortion for Medicaid enrollees. Ten of these states require no cost-sharing for abortion—Illinois and Minnesota allow cost sharing if there is cost-sharing for similar services in the plan and Delaware prohibits cost-sharing for abortions up to $750.
Medicaid Work Requirements: Federal Outreach Requirements and State Plans
The 2025 reconciliation law requires 44 states to condition Medicaid eligibility for adults in the Affordable Care Act (ACA) Medicaid expansion group and certain enrollees in 1115 waiver programs, including in non-expansion states (Georgia, Tennessee, and Wisconsin), on meeting work requirements starting January 1, 2027. Implementing work requirements will require complex changes to eligibility and enrollment systems and processes. States will also need to conduct targeted outreach and education to enrollees and potential applicants as well as broader outreach to providers and managed care plans to inform them of the changes. On June 1, 2026, the Centers for Medicare and Medicaid Services (CMS) issued a long-anticipated interim final rule that will guide state implementation of Medicaid work requirements, including outreach efforts.
As states begin the process of implementing new Medicaid work requirements, they may draw on lessons from their experience with “Medicaid unwinding.” During the unwinding, states conducted eligibility redeterminations for everyone on the program and disenrolled those who were no longer eligible or who did not complete the renewal process. KFF interviews with state officials, managed care plans, primary care associations, and advocacy organizations involved with the Medicaid unwinding in 2023, as well as interviews from the 23rd annual budget survey of Medicaid officials, identified successful outreach and communication strategies and partnerships to reach and educate enrollees about changes to the program.
The new requirements are complex and the implementation timelines are tight, so effective outreach, notices and communication will be challenging. These challenges were exacerbated by unexpected changes in the final rule that are likely to result in necessary changes to notices and other outreach materials. Because work requirements represent a change to eligibility requirements that apply to only some Medicaid enrollees, there will be unique challenges developing messages and strategies to explain the new requirements to those who need to meet the requirements while making clear who is not affected. In addition, states face several other challenges in conducting outreach, many of which reflect long-standing issues in Medicaid eligibility outreach processes. Describing eligibility processes in notices and outreach materials with clear, accessible language has been difficult for states. States have limited resources and workforce capacity for developing outreach materials. Call centers, an important resource to contact state Medicaid agencies with eligibility concerns, operate limited hours that may be inaccessible for many individuals. States must comply with federal rules on what work can be done through managed care organizations (MCOs).
This brief describes the outreach requirements in the law and rule, and highlights examples of outreach efforts states have shared during recent Medicaid Advisory Committee (MAC) meetings or on state websites. Some examples include outreach relating to other eligibility changes from the 2025 reconciliation law. State examples do not represent a comprehensive list of states adopting any strategy mentioned. This brief uses “work requirements” to describe the upcoming changes, though states sometimes use other language including “community engagement requirements” or “activity requirements” in their materials. Most examples were shared prior to the release of the interim final rule and may not fully reflect the rule’s requirements.
Federal Outreach and Notice Requirements
States are required to send targeted outreach notices to enrollees who may be subject to work requirements informing them of new work requirements. While the reconciliation law only requires notices to be sent to enrollees who are subject to work requirements, not including enrollees who are excluded from the requirements, (such as those who are medically frail or who are parents of children under age 14), the rule requires states to send notices to all expansion adults and all enrollees in 1115 waiver programs that are subject to the requirements. The Centers for Medicare & Medicaid Services (CMS) notes that sending notices to all expansion and all enrollees in applicable waiver programs is necessary because states will not have enough information to determine all individuals who should be excluded from the requirements and because enrollees may experience changes in circumstances that could affect whether they must comply with or are exempt from the work requirements between the time notices are sent and the requirements are implemented.
The law requires that notices explain who is subject to work requirements, how to comply with the requirements, and the consequences of noncompliance. The rule notes that because states must send notices to all expansion and applicable waiver enrollees, they will need to explain in clear language in the notice who qualifies for an exception or is a specified excluded individual and, therefore, does not need to comply with the requirements. The rule also requires that notices indicate how many months the state will look back at renewal to verify compliance. The law states that notices must be shared with enrollees in at least two different modalities including regular mail (or, if elected by the individual, in an electronic format) and in one or more additional modalities (including phone, text, online account). The rule reflects existing federal regulations that require notices to use plain language and be accessible for individuals with limited English proficiency (LEP) and individuals with disabilities.
The law requires notices to be sent three months prior to the first lookback month, meaning most states must send outreach notices in September. For states implementing work requirements on January 1, 2027 and that look back one month at application, the first lookback month is December 2026; therefore, outreach notices must be sent in September. For states that look back three months at application, outreach notices must be sent in July. In a recent KFF survey (fielded January-March 2026), most states that had made a decision (36) plan to look back one month to verify compliance at application. Two states (Idaho and Indiana) reported plans to look back three months at application, requiring them to begin sending notices in July. The rule requires states to send outreach notices to new enrollees who enroll after the initial outreach notices are sent and before the states implements the requirements.
States may send outreach notices along with an eligibility determination notice or other communications. States can utilize Medicaid MCOs to send outreach notices and must direct MCOs on which individuals must receive the notice, the frequency of when notices must be sent, and the required content of the notice.
After the initial outreach notice, states must send notices on a periodic basis. The rule lists several situations when states must send additional notices including, following application, renewal, and a change in circumstance; when a hardship exception is adopted, terminated, or expires; if the enrollees is no longer shown to be exempt from complying with work requirements; and upon request by CMS if monitoring data on work requirements indicates a problem.
Figure 1
In addition to sending targeted outreach notices, federal rules require states to post information about work requirements on their websites. The rule clarifies that the existing requirement for states to make program information available on their websites includes providing information about work requirements. While no other broad outreach is required, the rule encourages states to engage in additional outreach and education to raise community awareness of the new requirements.
State Outreach Plans
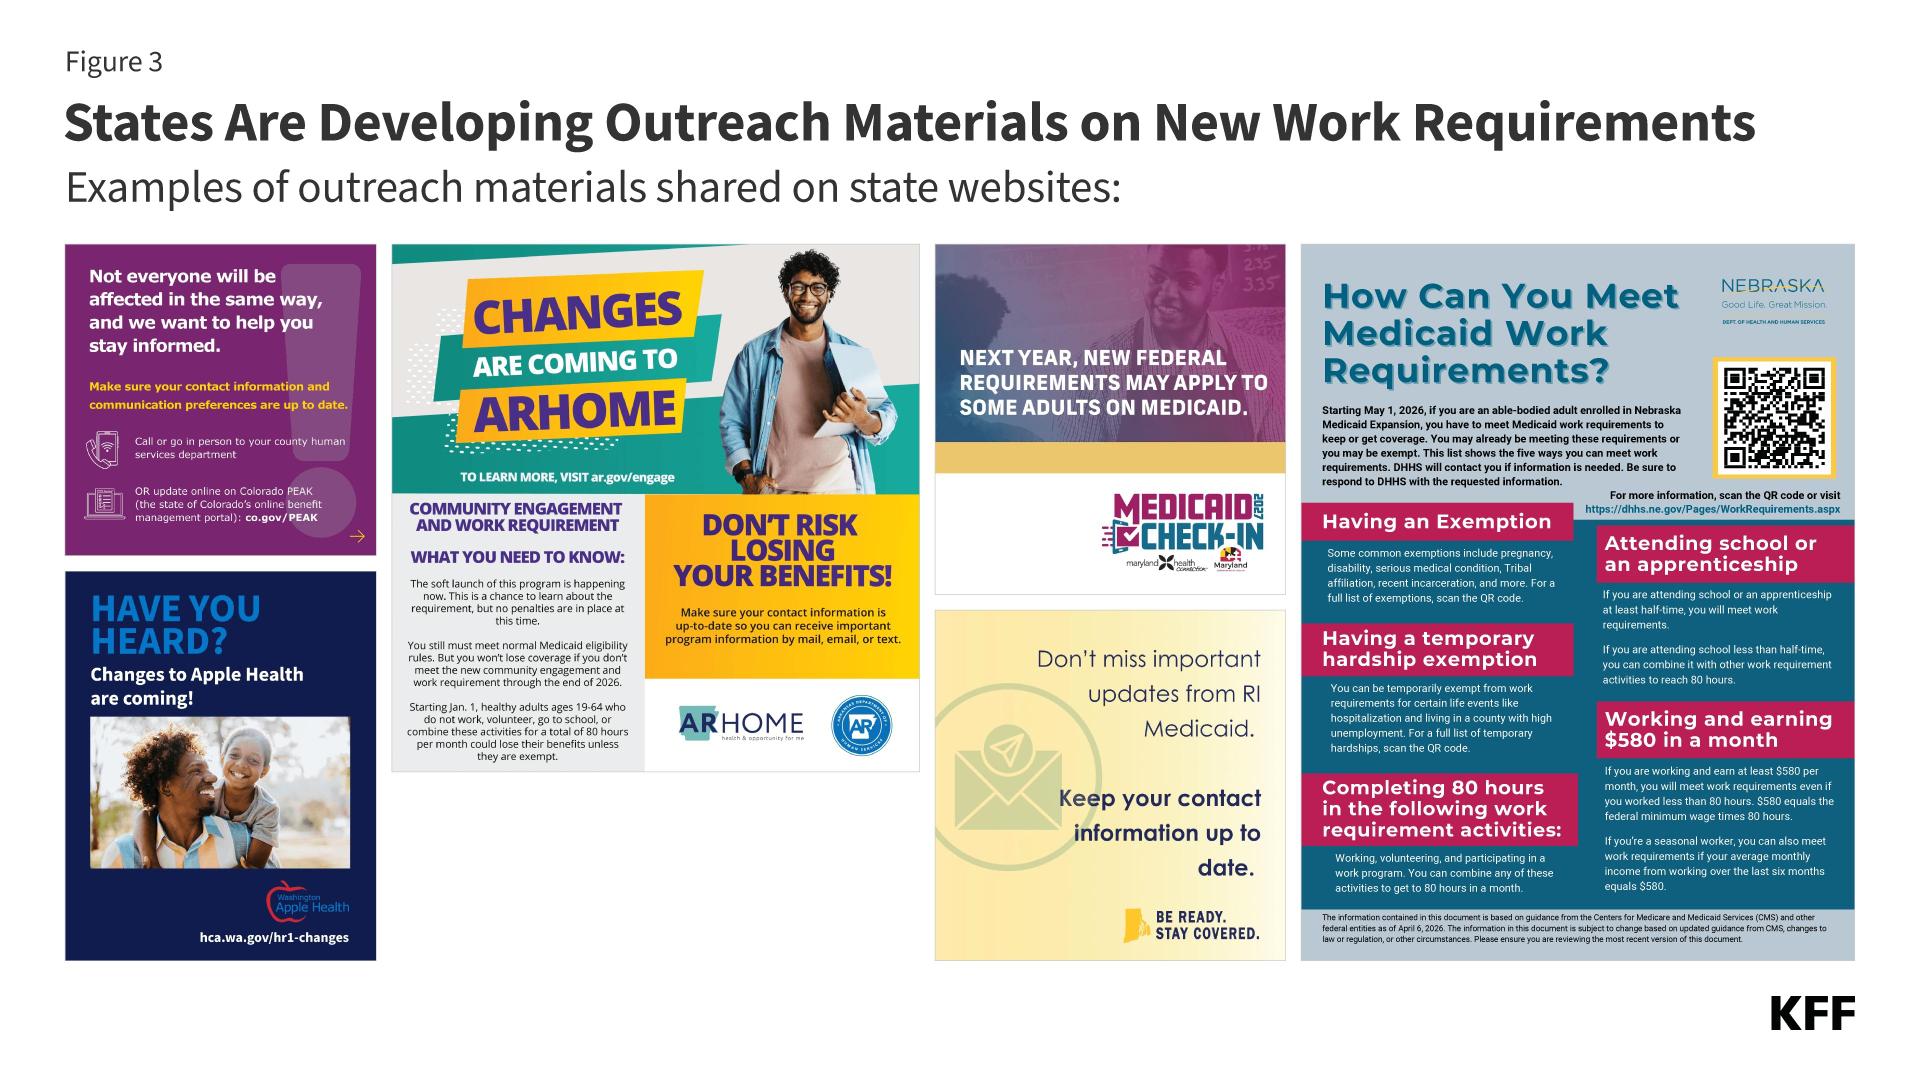
Beyond federal requirements, states are adopting a wide range of additional outreach strategies (Figure 2). Common strategies include additional direct enrollee communications through letters or other modalities, broad outreach through mass media and community events, and outreach to educate and engage providers, health plans, and community based organizations.
Figure 2
Direct Enrollee Communication
States are deliberating and making decisions about enrollee notices related to work requirements. Some states have shared draft notices with MAC members and other partners to get feedback on clarity and whether the language is clear and at an appropriate reading level. Nebraska and Montana, which have already implemented work requirements, sent notices to enrollees before the rule was published.
Nebraska’s notice was sent in December 2025. The three-page notice shared information about Medicaid expansion, what work requirements are, when and how Nebraska Medicaid will check work requirement compliance, consequences of noncompliance, and exemptions. There is also information about the importance of reporting changes that may affect eligibility, job seeking assistance, and the Medicaid agency’s contact information. The notice does not inform enrollees of how many months the state will look back at to verify compliance, which is required under the final rule.
Montana’s state plan amendment (SPA) to implement work requirements early required the state to send notices to affected enrollees in April 2026 and specified the content of the notices, which was similar to that of the final rule. Both the final rule and Montana’s draft SPA require that notices are sent to affected enrollees and explain work requirements, how to comply with the requirements, and the consequences of noncompliance. Unlike the rule, the Montana SPA does not explicitly require information about acceptable activities, exemptions, who is affected, and look-back periods.
Nevada used MAC meeting time to solicit feedback on a draft notice. To keep messaging inclusive of the acceptable activities for compliance, members discussed different language that could be used in place of “work requirements” like “work and volunteer requirements” or “work, school, and volunteer requirements.”
Pennsylvania is considering color coding notices to identify enrollees who will be newly subject to work requirements. Pennsylvania already utilizes color coding by sending renewal forms in pink envelopes. The suggestion to use color coded notices would indicate to enrollment assistors and navigators whether the enrollee they are assisting needs to meet the new requirements.
Additional Direct Enrollee Communication
Beyond required outreach notices, states also plan to send additional direct outreach to enrollees notifying them of upcoming work requirements implementation. Some communications are tailored to enrollees who will be subject to work requirements, and some will be broadly sent to all enrollees. These communications are not subject to the requirements on formal outreach notices that were outlined in the final rule.
Montana sent a letter to all Medicaid enrollees in March with basic information about who may be subject to work requirements. The letter directed enrollees to the state’s website on work requirements and assured enrollees that they do not need to act yet, but would receive an additional letter with more information on how to comply if they were subject to work requirements. Montana also began adding messaging on work requirements to renewal reminder emails and text messages in the spring.
In Vermont’s first MAC meeting following release of the rule, members reviewed a draft postcard that will be sent to all households with Medicaid enrollees. MAC members discussed how overly broad descriptions of affected enrollees may lead exempt expansion enrollees and enrollees eligible through other pathways to mistakenly assume that the work requirements apply to them.
New Jersey sent letters describing all eligibility changes between April and June. From July to September, New Jersey will send additional follow-up letters specifically about work requirements
Call Centers
States are required to offer telephone assistance with Medicaid applications and renewals. For work requirements, call centers can be utilized for enrollees to ask questions about work requirements and submit information about changes in their circumstances. Currently, several state websites on work requirements share call center information. As states increase outreach with notices and other materials that list call center information, more individuals will be prompted to contact call centers. Call center staffing may need to increase to accommodate the higher volume of calls. In addition to increasing staff capacity, staff may need additional training on how to help individuals navigate work requirements and have appropriate resources to share with callers who may be subject to work requirements. Call centers typically operate Mondays through Fridays during business hours, which may limit access for individuals who cannot call during those hours.
Nebraska and Delaware’s websites encourage enrollees to report changes in circumstances to the state’s existing Medicaid eligibility call center, with both call centers operating during business hours.
Arkansas plans to conduct proactive calls to notify enrollees who will need to comply. The state will use the calls to inform enrollees on the changes and remind enrollees to report changes in circumstances.
Enrollee Websites and Screening Tools
Most states have launched websites to centralize information on the eligibility changes required by the reconciliation law, including work requirements, that provide an overview of the new requirements as well as timelines, FAQs, and links to community resources. The information on state websites specific to work requirements describes, in general terms, which Medicaid enrollees may be subject to work requirements and who qualifies as an excluded individual and will be exempt from the requirements. Some websites have dedicated pages on work requirements that include more detailed information. Websites mostly provide information for enrollees and new or potential applicants, but some also provide information tailored to providers or health plans. Most websites encourage enrollees to check their mail often and keep contact information up to date, along with information on how to report changes to the state Medicaid agency. Some websites have links to sign up to the state Medicaid agency’s email subscription list.
Nebraska’s website features a 10-minute-long YouTube video overview of work requirements. While the video offers important information about work requirements in a format that some people may find more accessible, it contains some technical language that may be hard for enrollees and applicants to understand. Nebraska’s website shares other resources including links to community service and job seeking opportunities.
Montana has a website showing the intended goals of the work requirements, key changes, and flyers on work requirements and exemptions/temporary exemptions. The website states that enrollees will receive timely notices and shares information on appeals.
Some websites currently include fairly limited information on work requirements, often as part of information on broader Medicaid changes in the law while others provide more details that may help enrollees and potential applicants navigate work requirements.
Missouri has an “Implementation Hub” website that provides high-level summary information on all of the Medicaid and SNAP changes in the law.
In contrast, Colorado and Idaho’s websites provide more detailed information on how to comply with the new work requirements, noting that earning at least $580 from paid work verifies compliance, who will be exempt, and when the requirements will take effect.
Since not all Medicaid enrollees will be affected by work requirements, some states are launching screening tools for enrollees to check if they will need to comply with work requirements or prove that they are exempt. New Jersey and West Virginia have created unofficial screening tools to help enrollees determine if they are subject to or exempt from work requirements.
New Jersey’s screening tool first asks questions on exemptions. If the user’s information suggests they are unlikely to qualify for an exemption, they are prompted to enter information on their income and current qualifying activity hours.
West Virginia’s screening tool only checks for exemption status. If a user selects an option that suggests an exemption, the tool ends and tells the user that work requirements may not apply to them. However, there are no questions on medical frailty, so the screener misses an important potential exemption.
Other states that have launched screening tools include Louisiana and Wisconsin.
Broad Outreach
Although not required, some states plan to conduct broader outreach in the fall that will include social media posts, paid media ads, billboards and ads on public transportation, as well as road shows and in-person events. A challenge with broad outreach strategies is to be clear about which Medicaid enrollees are subject to work requirements to avoid confusion among enrollees who are not affected. Work requirements will only apply to adults ages 19-64 in the Medicaid expansion group and in certain Medicaid waiver programs. States are required to exempt many groups from work requirements, including individuals who are pregnant or postpartum, those who are medically frail, and parents /caretakers of dependent children under age 14 or individuals with disabilities. Explaining which parents will be subject to work requirements offers an example of the communication challenges states will face as they develop broad outreach messages. While many parents enrolled in Medicaid are covered through a mandatory parent eligibility pathway and do not have to meet the new requirements, some parents with children over age 13 are covered through the expansion pathway and will be subject to the new requirements (although the share of parents who will have to meet the requirements varies by state). However, because most parents do not know how they are covered, states will need to carefully craft outreach materials to explain who is subject to the new requirements without alarming and creating confusion among those parents who do not have to meet the requirements.
New Mexico is planning a paid media campaign including radio ads, digital displays, newspaper ads, and billboards. They also plan to shoot and produce a video commercial on eligibility changes from the 2025 reconciliation law.
Similarly, Rhode Island plans to use social media, community partner newsletters, paid media, and local media to get the word out about the Medicaid changes.
DC plans to launch an advertising campaign, including ads on public transportation and will also conduct “on the ground” outreach by participating in health fairs and other city events.
Montana and New Mexico have planned roadshows across the state.
Provider, Plan, and Community Based Organization Outreach
Providers, health plans, and community organizations generally have more direct interaction with enrollees than staff at a state Medicaid agency and help amplify enrollee outreach. MCO staff, providers, community-based organizations, and navigators/enrollment assisters often help communicate eligibility changes to enrollees.During the unwinding of the continuous enrollment provision, states utilized partnerships with other groups to amplify outreach to enrollees. A few states mentioned drawing on lessons learned from their unwinding experience.
Many states are conducting webinars and developing toolkits for partners to learn more about how work requirements will be implemented, and how to help enrollees navigate the changes. At the time of MAC meetings, some webinars had already been conducted, while others were still being planned. States are also developing various resources with entities that serve Medicaid enrollees that they can share with enrollees. Resources include one-pagers, FAQs, social media graphics, flyers and posters for community spaces. For example,
Illinois has launched a webinar series that includes different modules on eligibility changes from the 2025 reconciliation law, including modules on work requirements, exemptions from work requirements, common questions, and systems changes.
Montana has conducted partner briefing webinars with education about work requirements, reminders of existing processes on change reporting and notices, and specific information on how community organizations and providers can assist enrollees. Montana sent a notice to providers in May inviting them to a webinar and sharing the Medicaid agency’s provider contact information.
Maryland is conducting outreach for employers of Medicaid enrollees, highlighting that employers can play an important role in helping their employees access trusted information by directing employees to official updates and resources.
Some states have highlighted efforts to engage and collaborate with community partners and solicit feedback on implementation issues and outreach to enrollees. States have conducted workshops and working groups to gather feedback from trusted partners, particularly on what messaging works best for enrollees. For example:
Utah convened a Community Partner Engagement Group to prepare advocates to help Utahns navigate eligibility changes. The group will develop co-branded outreach materials, synchronize messaging across agencies, and provide an escalation path for partners to resolve issues.
Nevada is planning a public workshop to review the state’s communications plan.
The interim final rule allows states to utilize MCOs to assist with outreach and education. In particular, the rule describes how MCOs can help enrollees participate in work programs administered at American Job Centers, which count as hours for compliance with work requirements. MCOs may provide education to enrollees on how to prepare and collect documents for work program appointments and can coordinate with work programs to enable MCOs to follow up with enrollees.
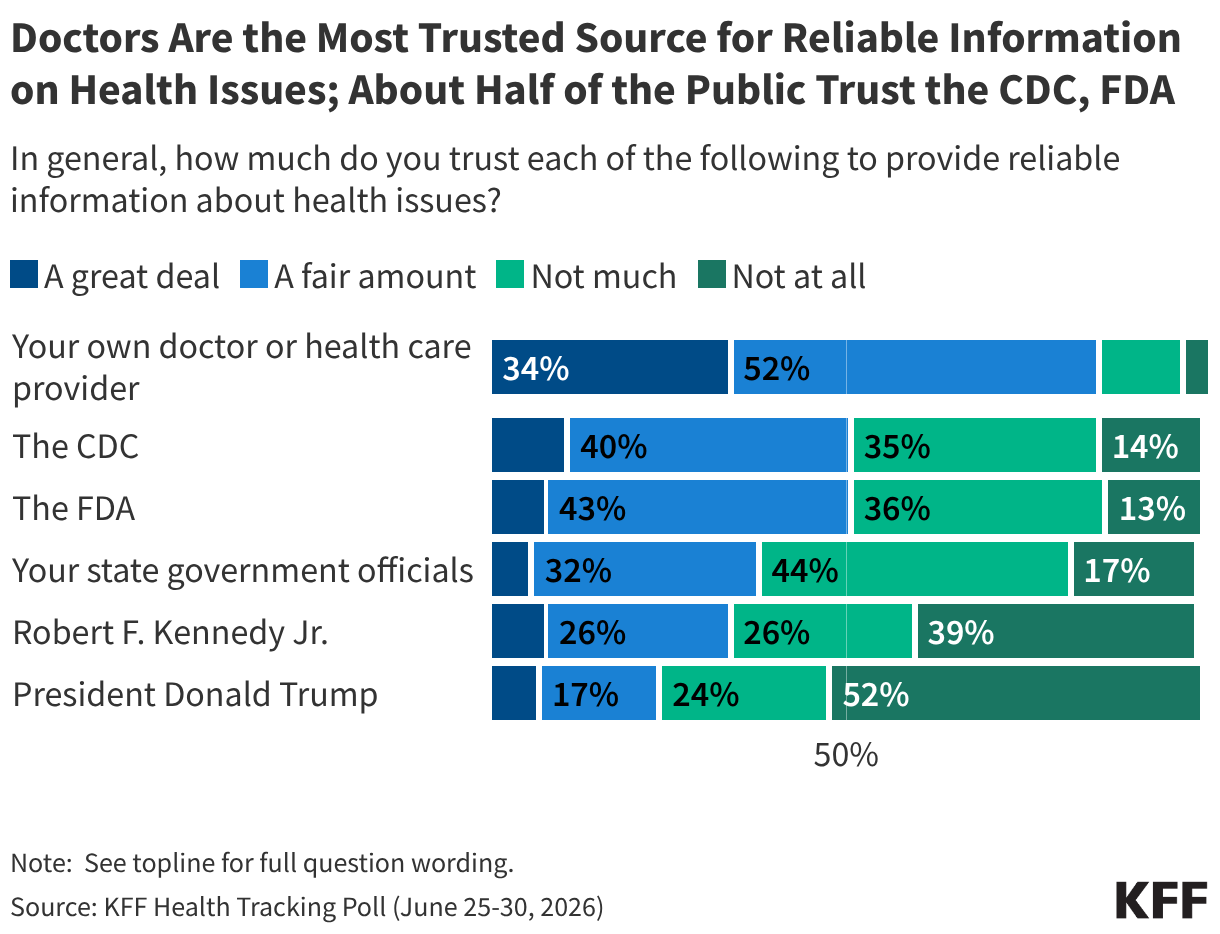
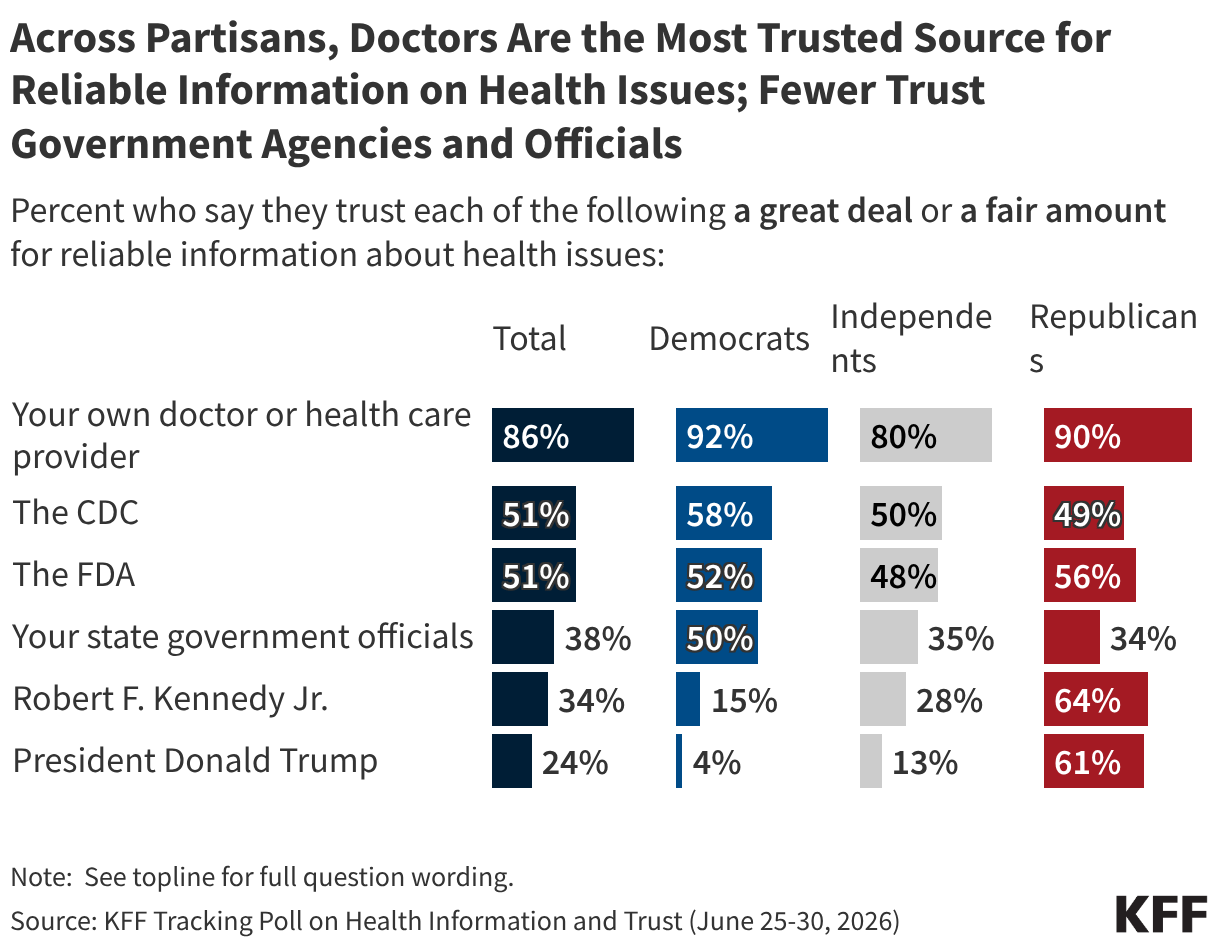
Doctors and other health care providers are the public’s most trusted source of health information, while trust in government health agencies and officials is much more divided. A large majority of adults express at least “a fair amount” of trust in their doctor for reliable information about health issues, while half say they trust the CDC or FDA and fewer than half express trust in their state government officials, HHS Secretary Robert F. Kennedy, Jr., or President Trump.
Partisanship shapes who the public trusts for health information, especially when it comes to Secretary Kennedy and President Trump. Roughly six in ten Republicans, rising to at least seven in ten among MAGA-supporting Republicans, say they trust Secretary Kennedy or President Trump for reliable health information compared to three in ten or fewer independents and Democrats who say the same. On the other hand, Democrats are more likely than Republicans to trust their state officials for health information, while similar shares of Democrats and Republicans say they trust the CDC or FDA. Individual health care providers are the most-trusted source for health information across partisanship.
Across demographic groups – including age, gender, race and ethnicity, and education – health care providers remain the most trusted source of health information. For other health information sources, trust can vary by different groups. White adults and those with a college degree are more likely to express trust in their doctor or health care provider, which may reflect health care access issues. Trust in the CDC and state government officials also differs by education, with college-educated adults more likely to express trust in these sources. White adults are more likely than their peers to express trust in Secretary Kennedy and President Trump for health information.
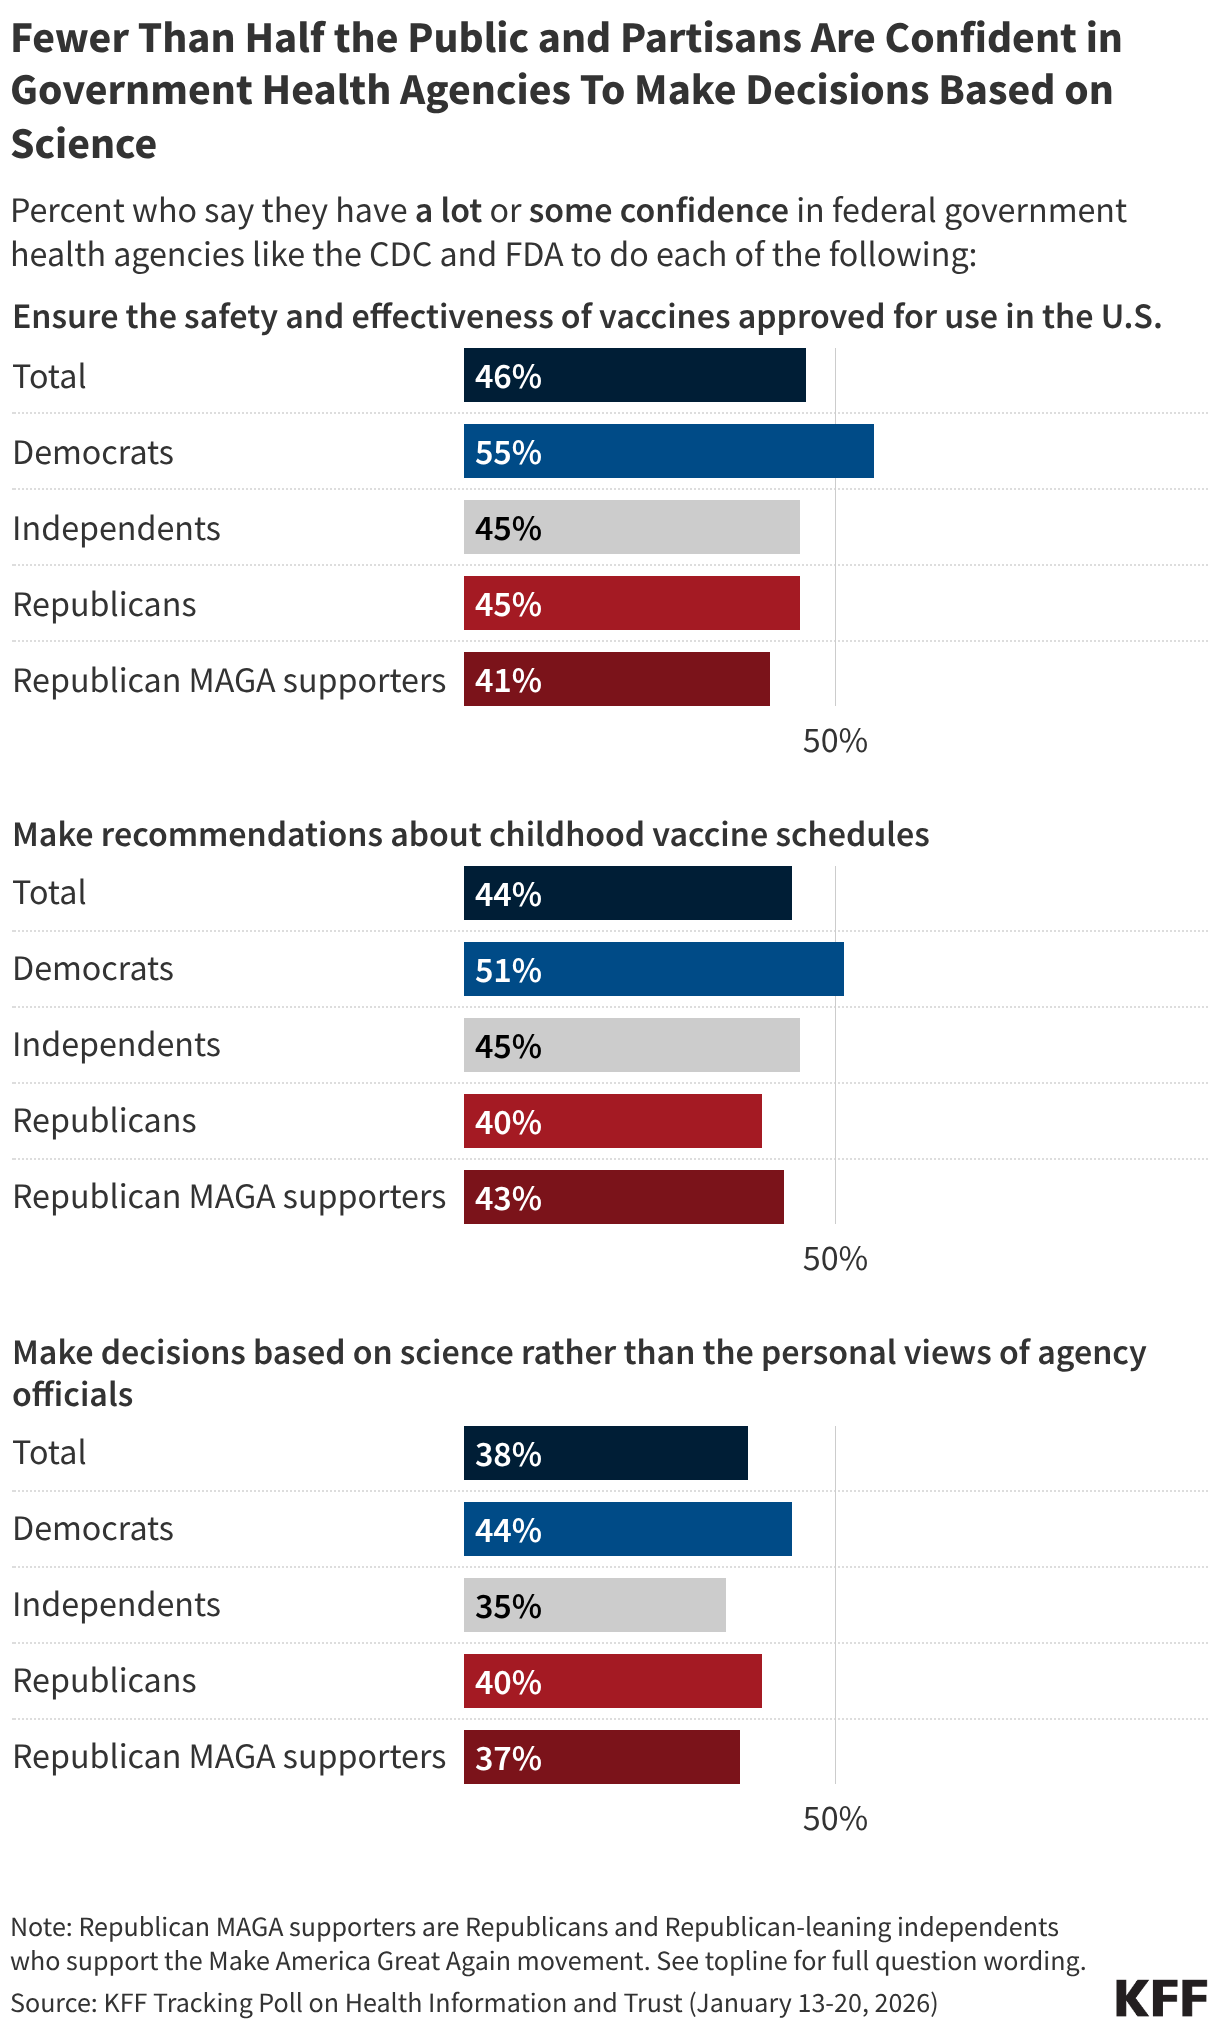
Most of the public lacks confidence in agencies like the CDC or FDA to carry out many of their core responsibilities. While Democrats are somewhat more likely than Republicans to have at least “some confidence” in government health agencies to ensure vaccine safety and effectiveness and make recommendations about the childhood vaccine schedule, fewer than half across partisans have confidence in these agencies to make decisions based on science. For more information, see KFF’s January 2026 Tracking Poll on Health Information and Trust.
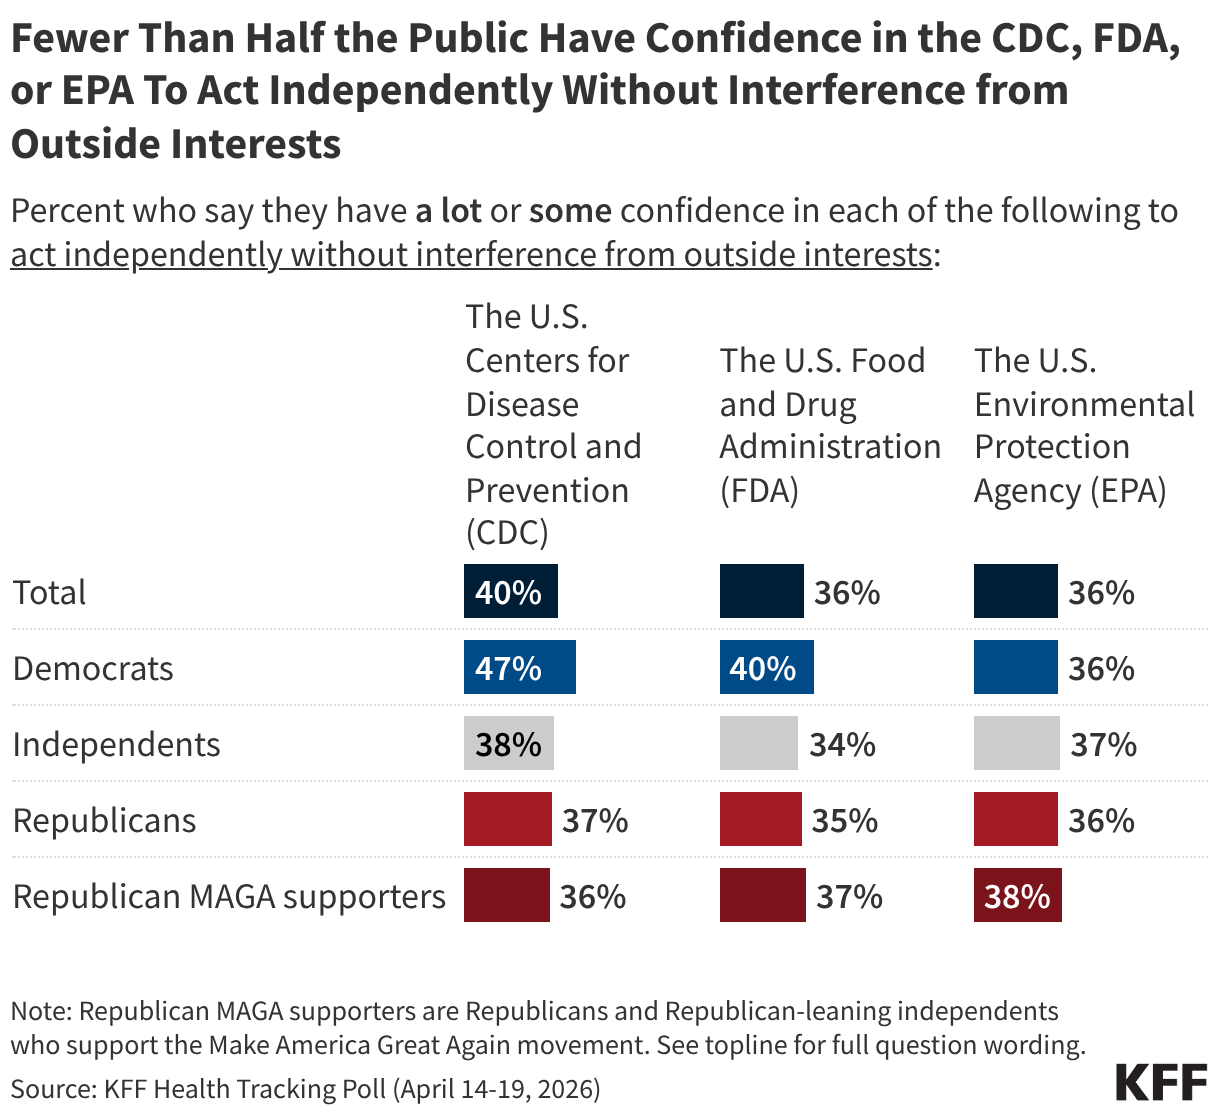
Less than half of the public and partisans express at least “some confidence” in the CDC, FDA, or EPA to act independently without outside interference. Democrats are somewhat more likely to say they have confidence in the CDC to act independently, with almost half expressing confidence. On the other hand, four in ten or fewer adults and partisans express confidence in the independence of the FDA or the EPA. For more information, see KFF’s April 2026 Health Tracking Poll.
Trends in Trust of Government Health Agencies and Officials
At the onset of the COVID-19 pandemic, there were high levels of bipartisan trust in information about the new virus from the U.S. Centers for Disease Control and Prevention (CDC). Trust in the agency for information about COVID-19 vaccines, and vaccines more generally, subsequently declined amid widening partisan divisions and large drops in Republican trust. Democratic trust in the agency has since declined significantly following President Trump’s reelection and the confirmation of Robert F. Kennedy Jr. as HHS Secretary. Amid these partisan shifts, half of the public now express trust in the CDC for reliable vaccine information. Keep scrolling to see trends among the public and partisans.
KFF polling has found trust in vaccine information from other health agencies and officials has also declined amid partisan divisions since 2020, including for the U.S. Food and Drug Administration (FDA), state government officials, and local public health departments.
Who Parents Trust for Childhood Vaccine Information
Among parents of children under age 18, pediatricians are the most trusted source of reliable vaccine information. Smaller shares, but still majorities, also trust their local public health department, the CDC, and the FDA. Over half of parents trust their friends and family for vaccine information, while far fewer express trust in Robert F. Kennedy Jr., pharmaceutical companies, or health and wellness influencers. As with the public overall, partisanship plays a role in who parents trust for vaccine information. For more information, see the KFF/Washington Post Survey of Parents.
Among parents, Secretary Kennedy garners trust on vaccines from a majority of Republican supporters of the Make America Great Again, or MAGA, movement (18% of all parents) and supporters of the Make America Healthy Again, or MAHA, movement (38% of all parents). While slim majorities of these MAGA and MAHA parents trust Kennedy for vaccine information, larger shares express trust in their child’s pediatrician.
News, Social Media, and AI
Use and Trust of News Sources for Health Information
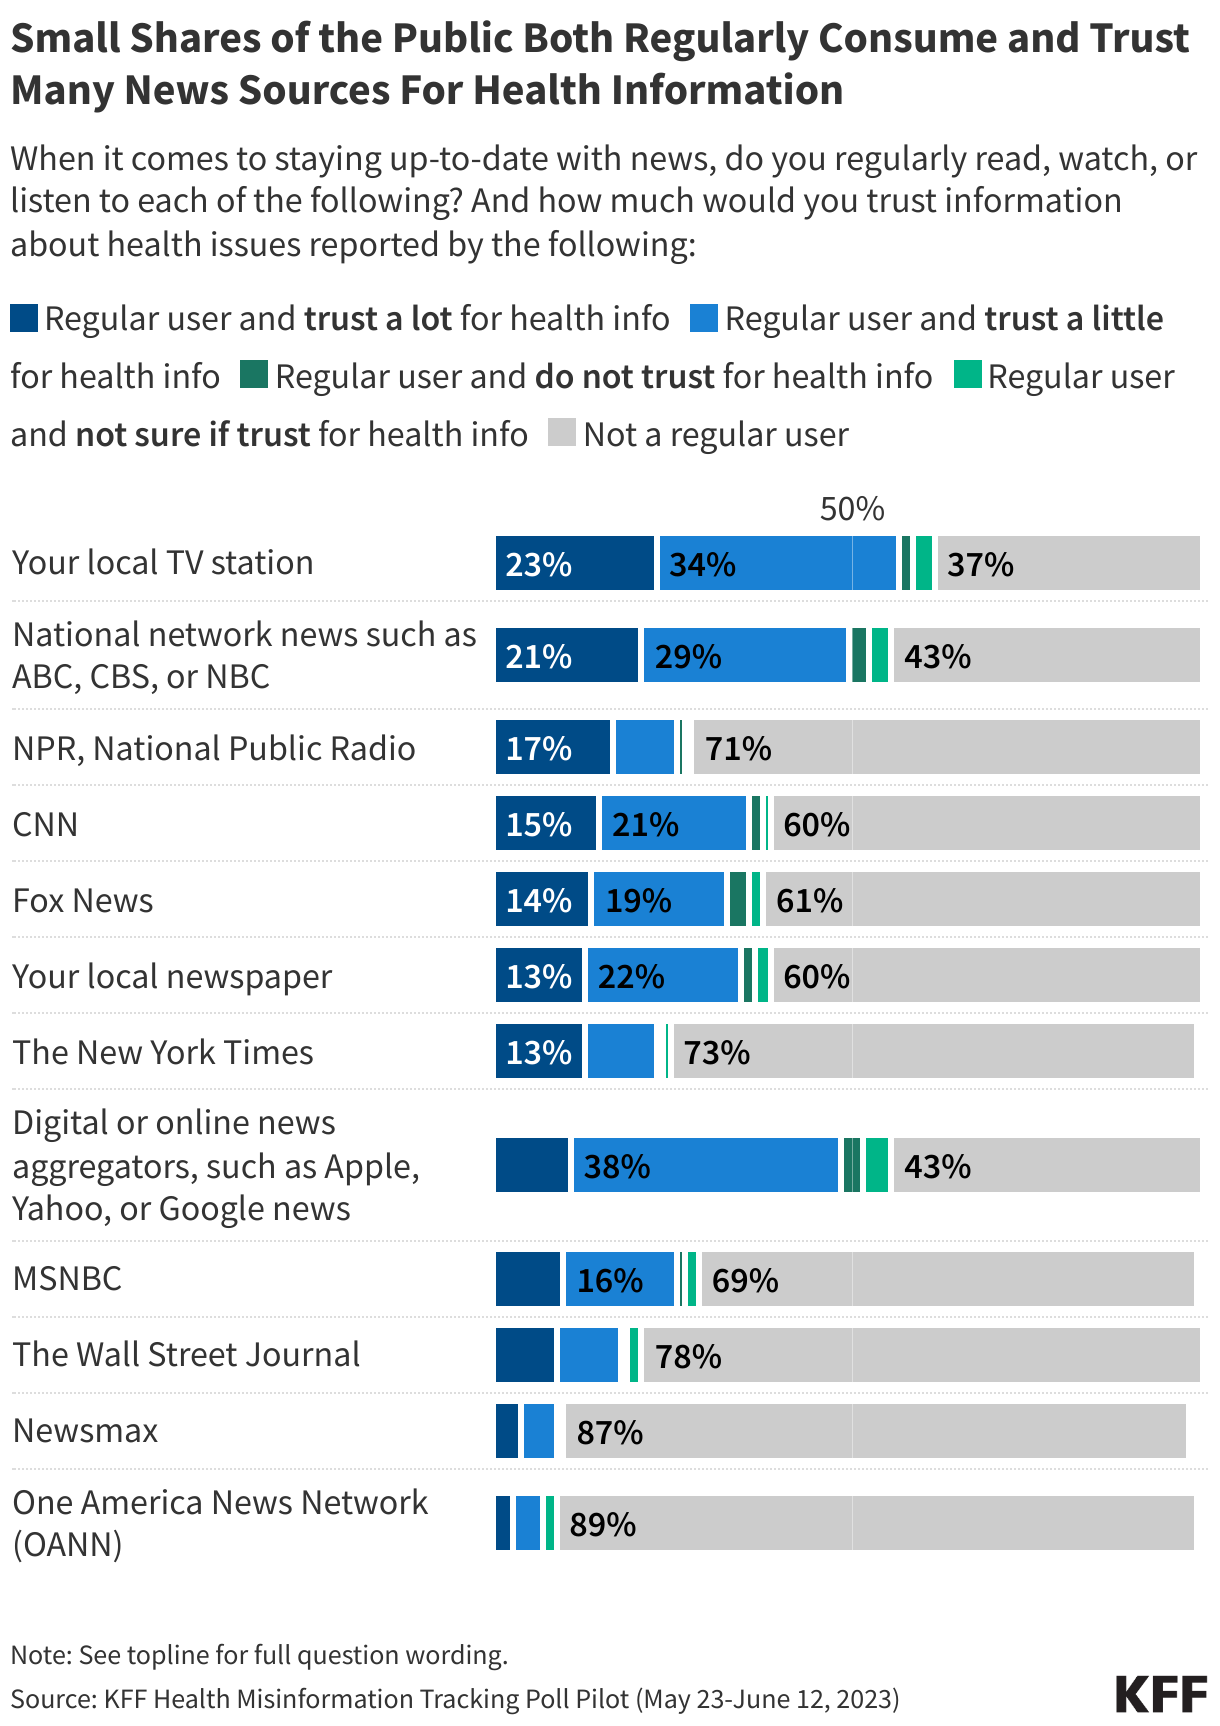
KFF’s Health Misinformation Tracking Poll Pilot measured the public’s consumption of a variety of television, print, radio, and digital news media sources as well as their trust in these sources for information about health issues. Overall, few adults both regularly consume most news sources and trust them a lot for information on health issues, with local and network television news topping the list. Nearly a quarter (23%) of adults say they regularly watch their local TV station and would trust it “a lot” for health information, while a similar share (21%) say the same about national network news. Other news sources, including NPR, CNN, Fox News, local newspapers, The New York Times, digital news aggregators, and MSNBC have trusting audiences that make up between one in ten and one in six of the overall public.
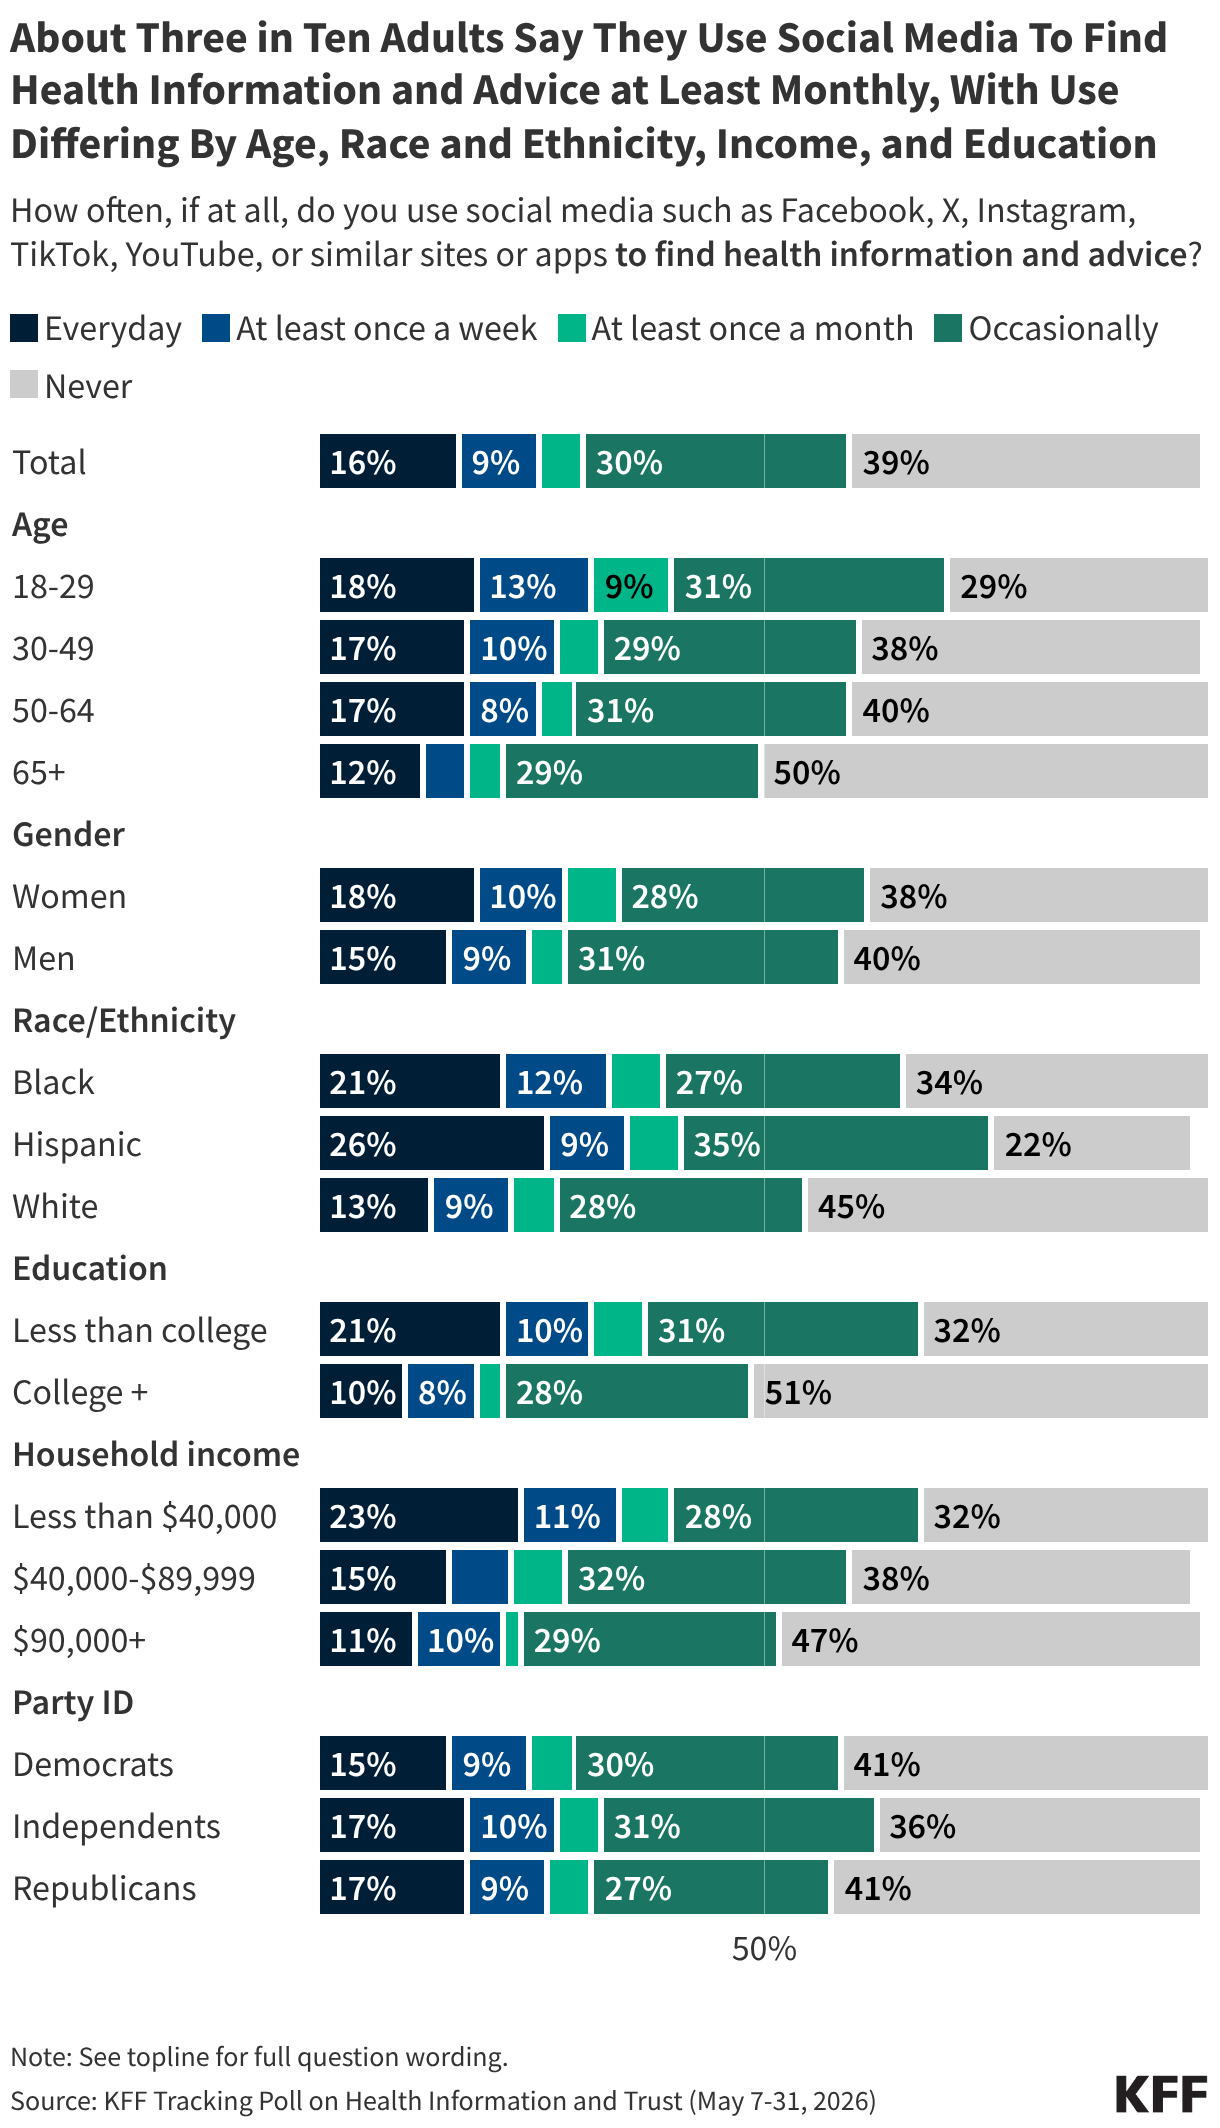
About three in ten adults say they use social media to find health information and advice “at least monthly,” including larger shares of younger adults, Black and Hispanic adults, lower income adults, and those with lower educational attainment. For more information see KFF’s June 2026 Tracking Poll on Health Information and Trust.
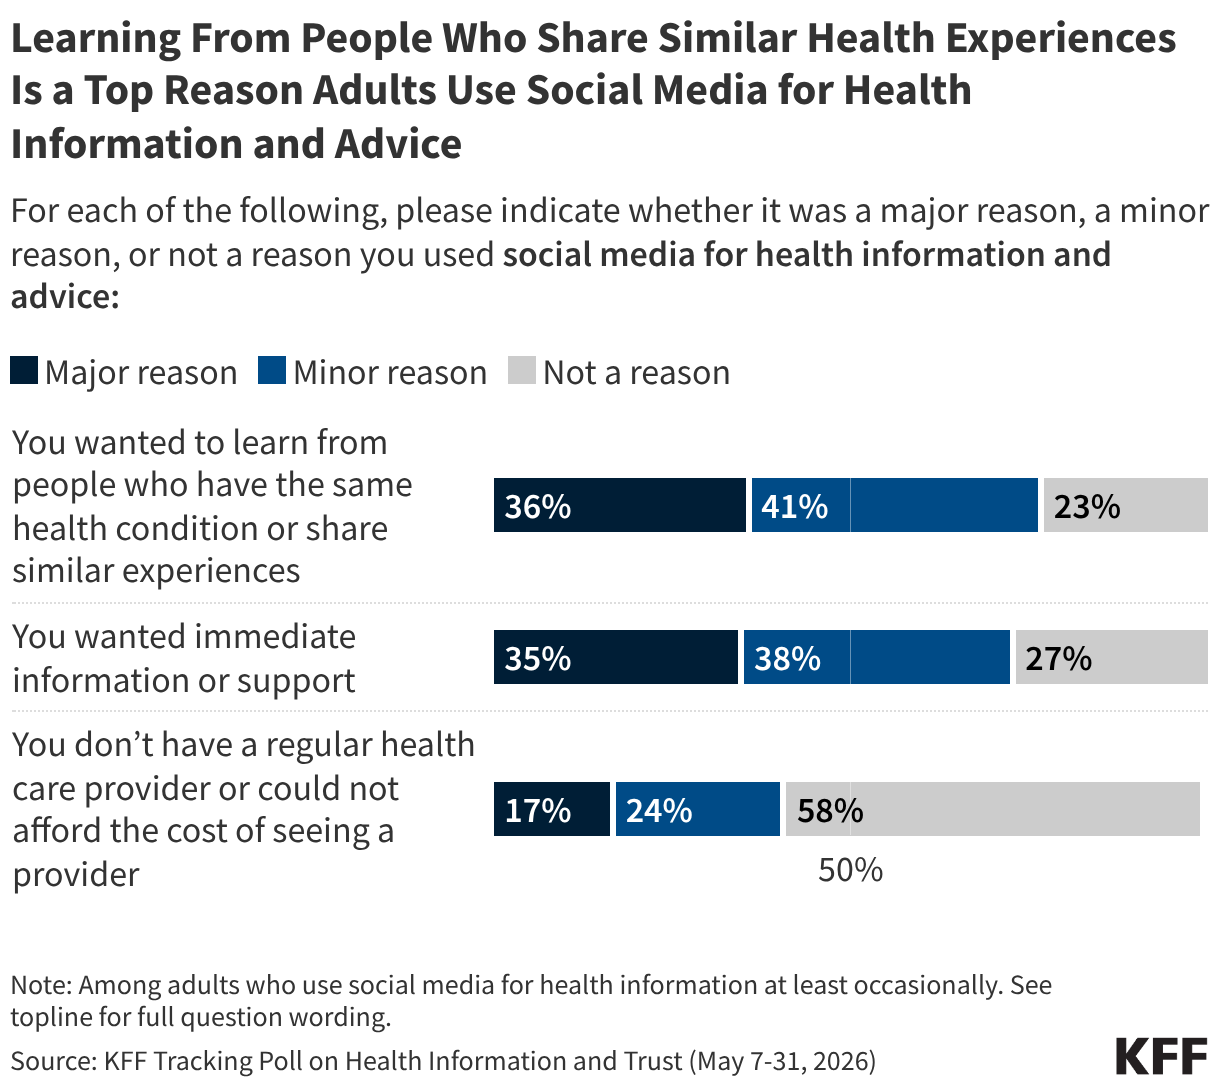
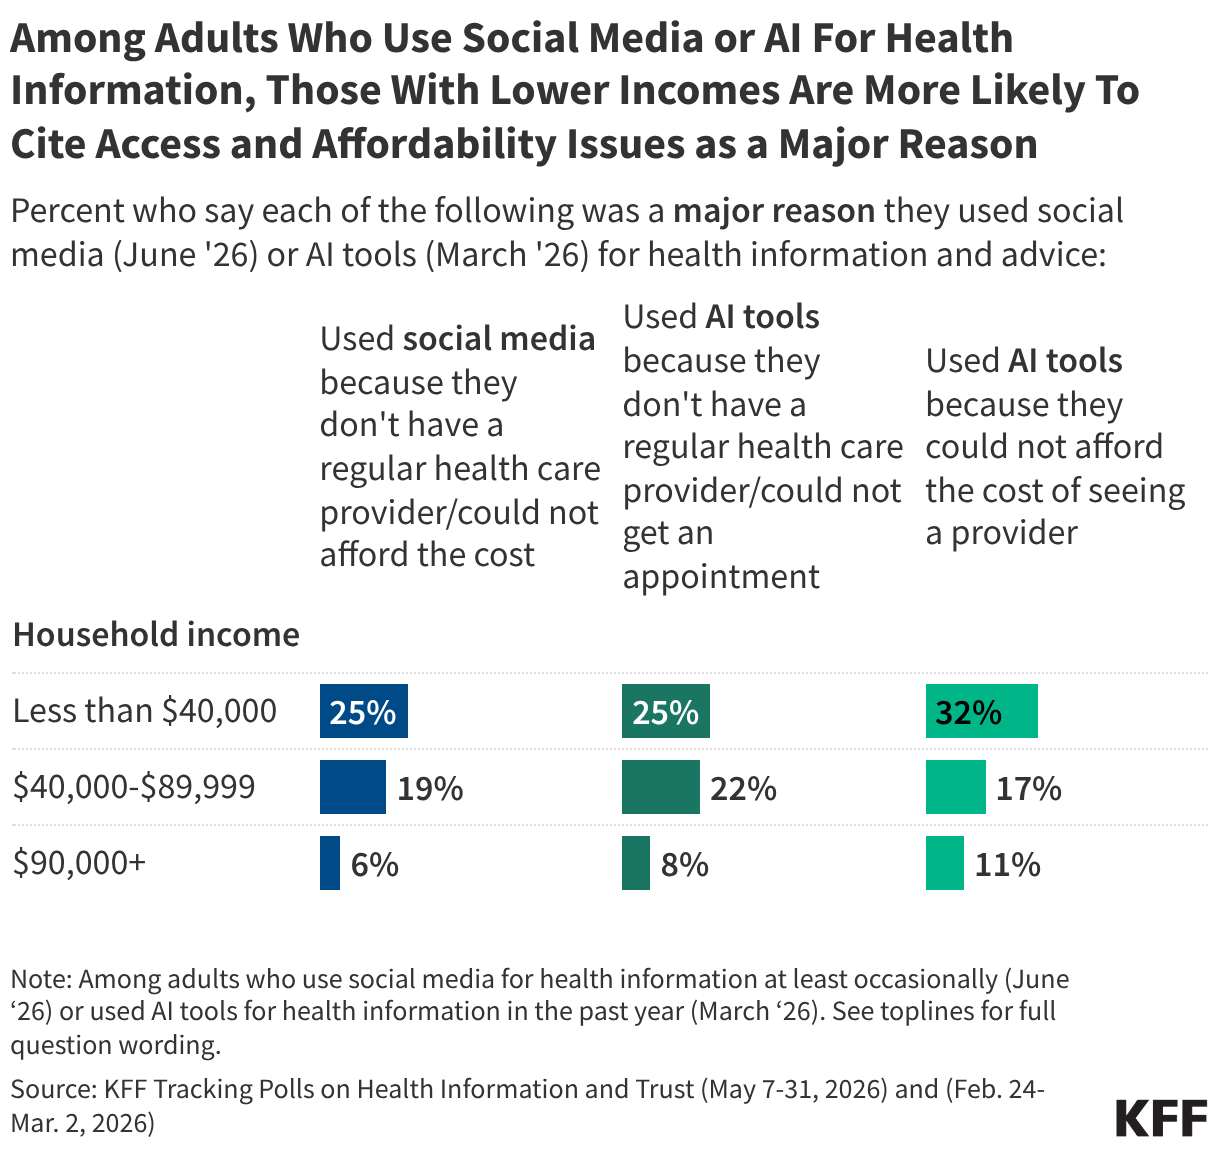
About one-third of adults who use social media for health information say a “major reason” they turned to social media for health advice was because they wanted to learn from people with similar experiences or because they wanted immediate information or support. About one in six users cite difficulty accessing or affording health care as a major reason.
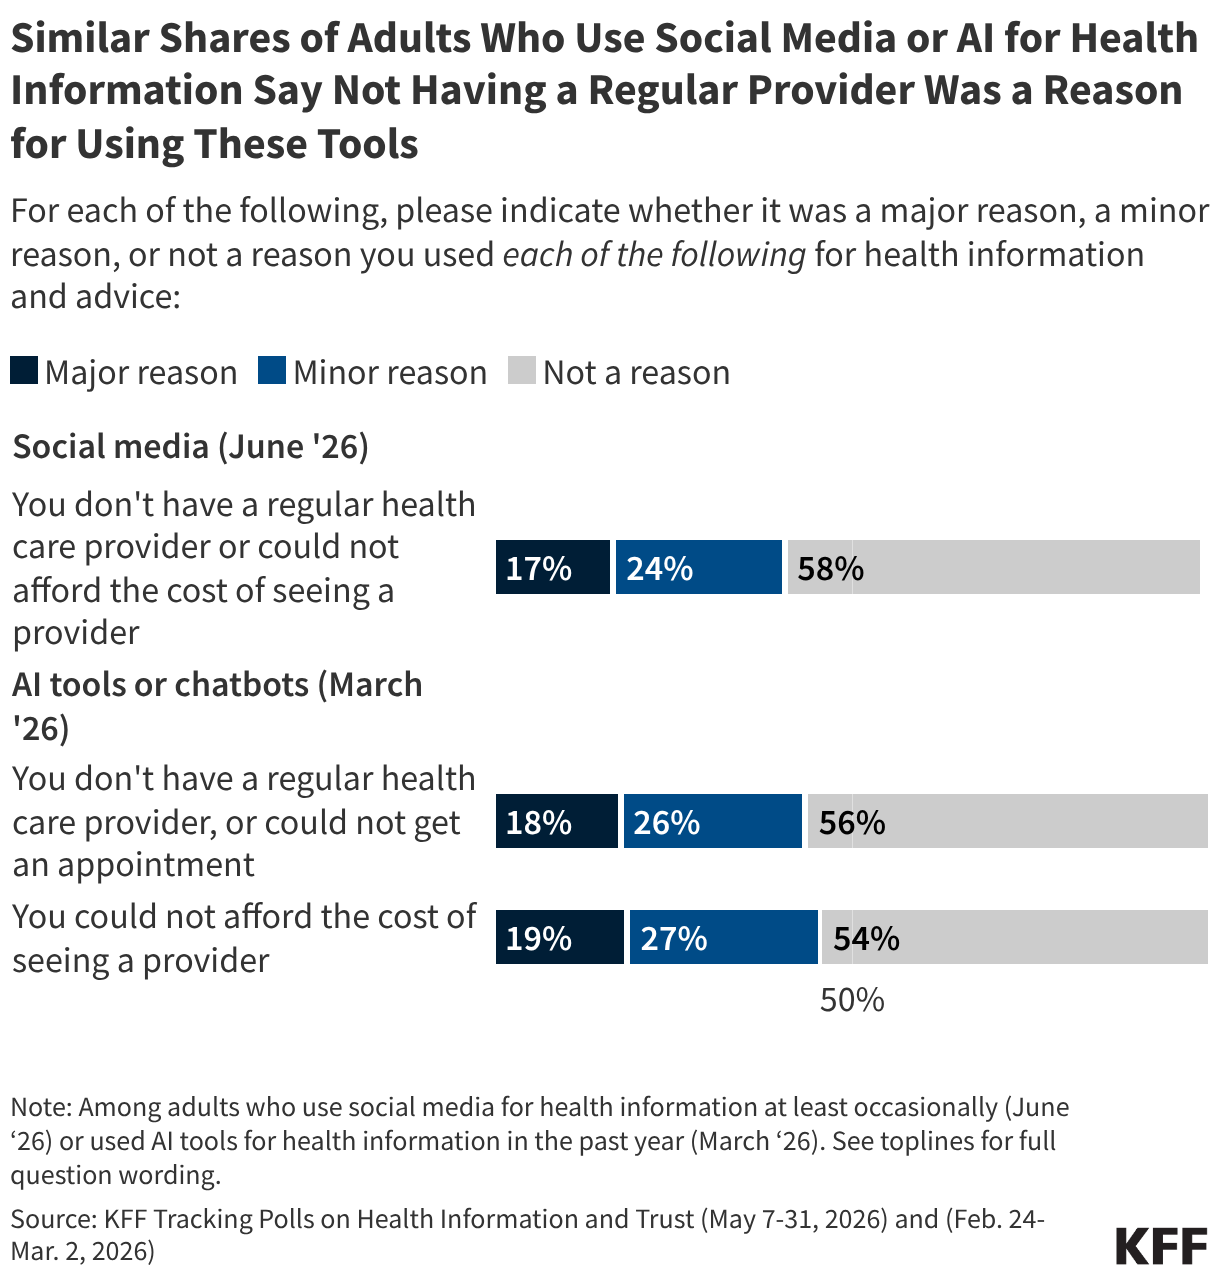
Similar shares of adults who use social media for health information or use AI chatbots for health information cite difficulties accessing or affording health care as major reasons they turned to these tools for health advice. These reasons are more commonly cited among lower income social media and AI users. For additional information on use of AI for health information, see AI and Health Information section below.
While fewer than half of the public report actively using social media at least monthly to find health information and advice, larger shares report being exposed to such information in the past month, with majorities saying they have recently seen content related to weight loss, diet, or nutrition and mental health.
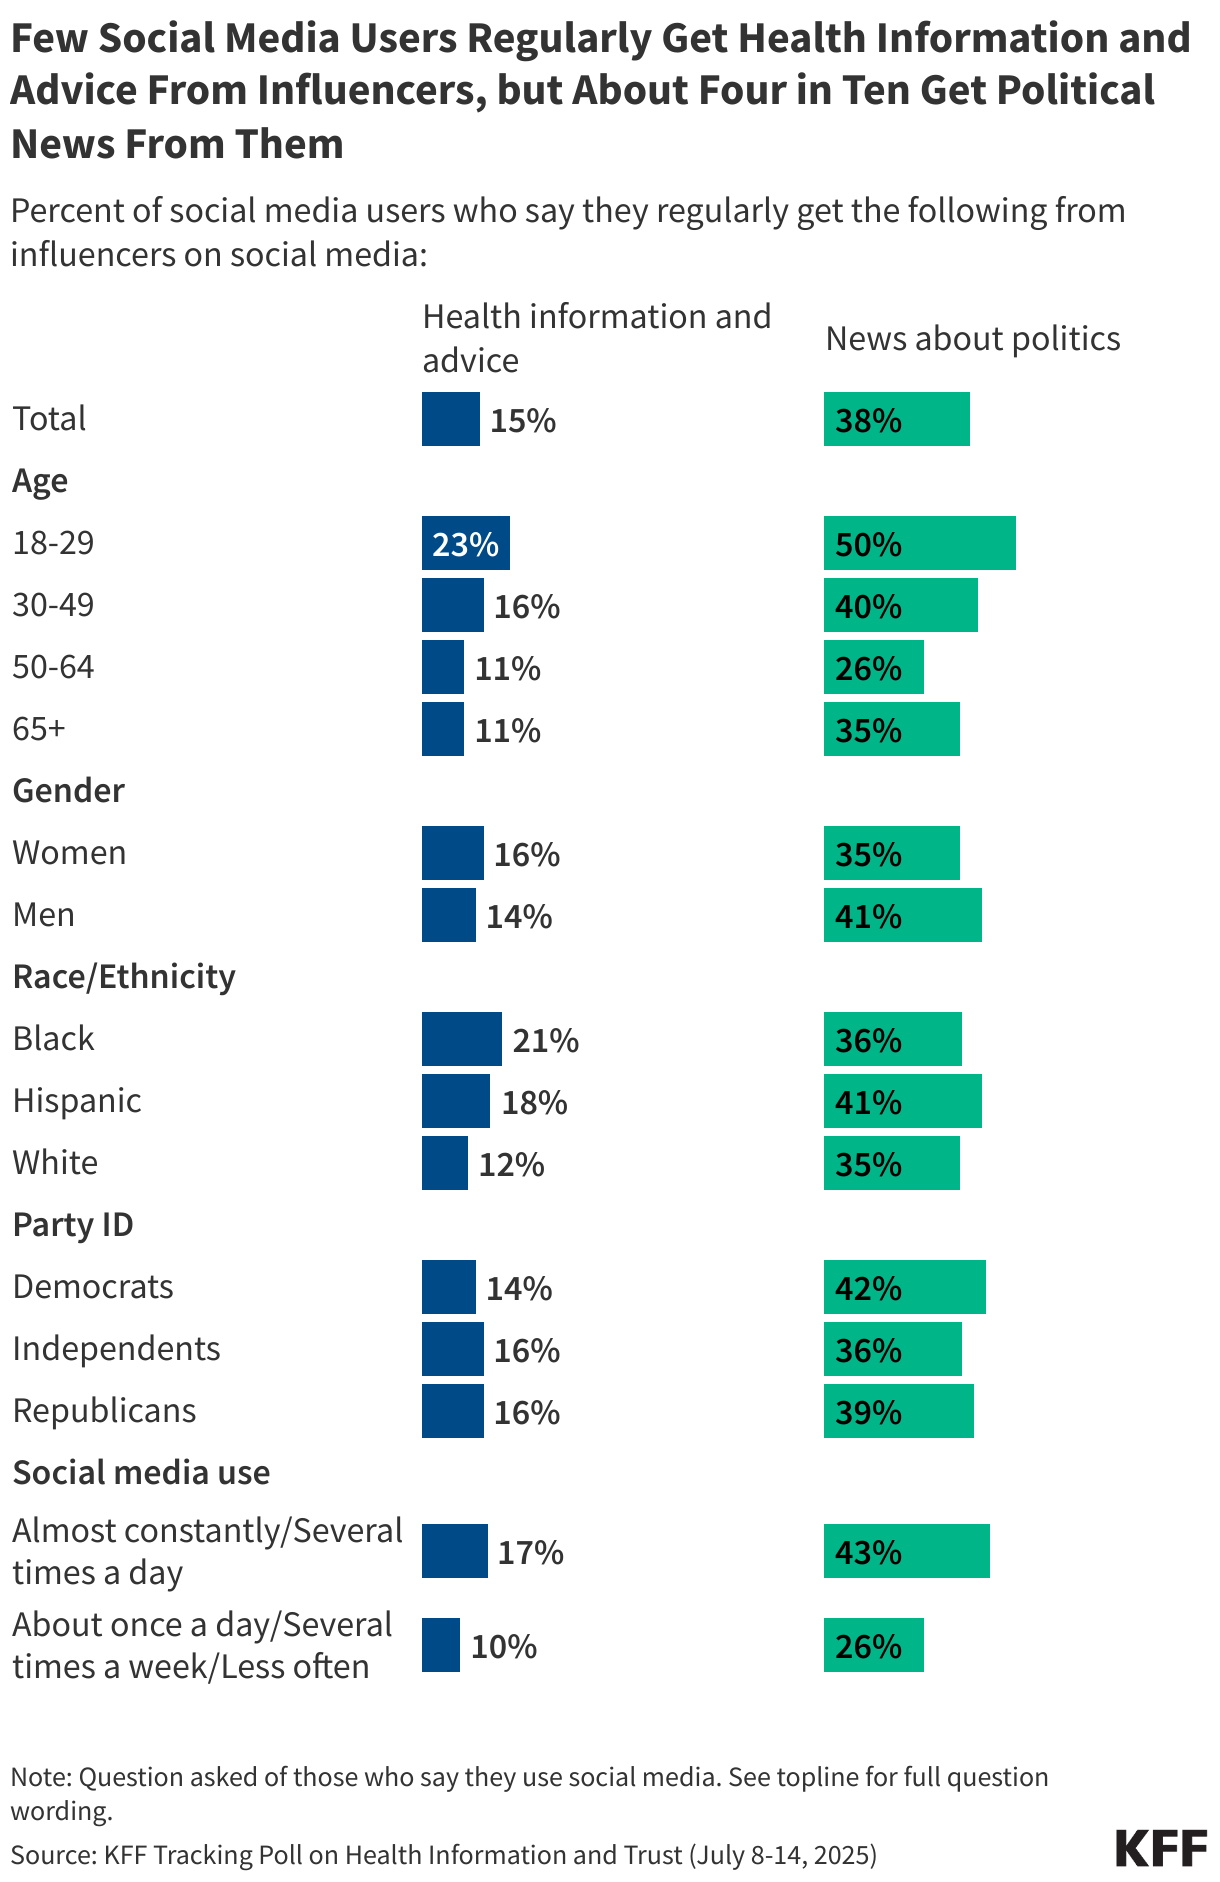
While four in ten social media users say they regularly get information about news and politics from social media influencers, far fewer (15%) say they turn to influencers for health information and advice. Younger adults, Black adults, and more frequent social media users are more likely than their peers to say they rely on influencers for health information. For more information on the relative impact of influencers on the public and health policy debates, see KFF CEO Drew Altman’s column.
Across different social media platforms, fewer than half of users say they find at least “some” of the health information they see on these platforms to be trustworthy. Younger users tend to be more trusting than older users of health content on certain platforms including TikTok, YouTube, Instagram, and Reddit.
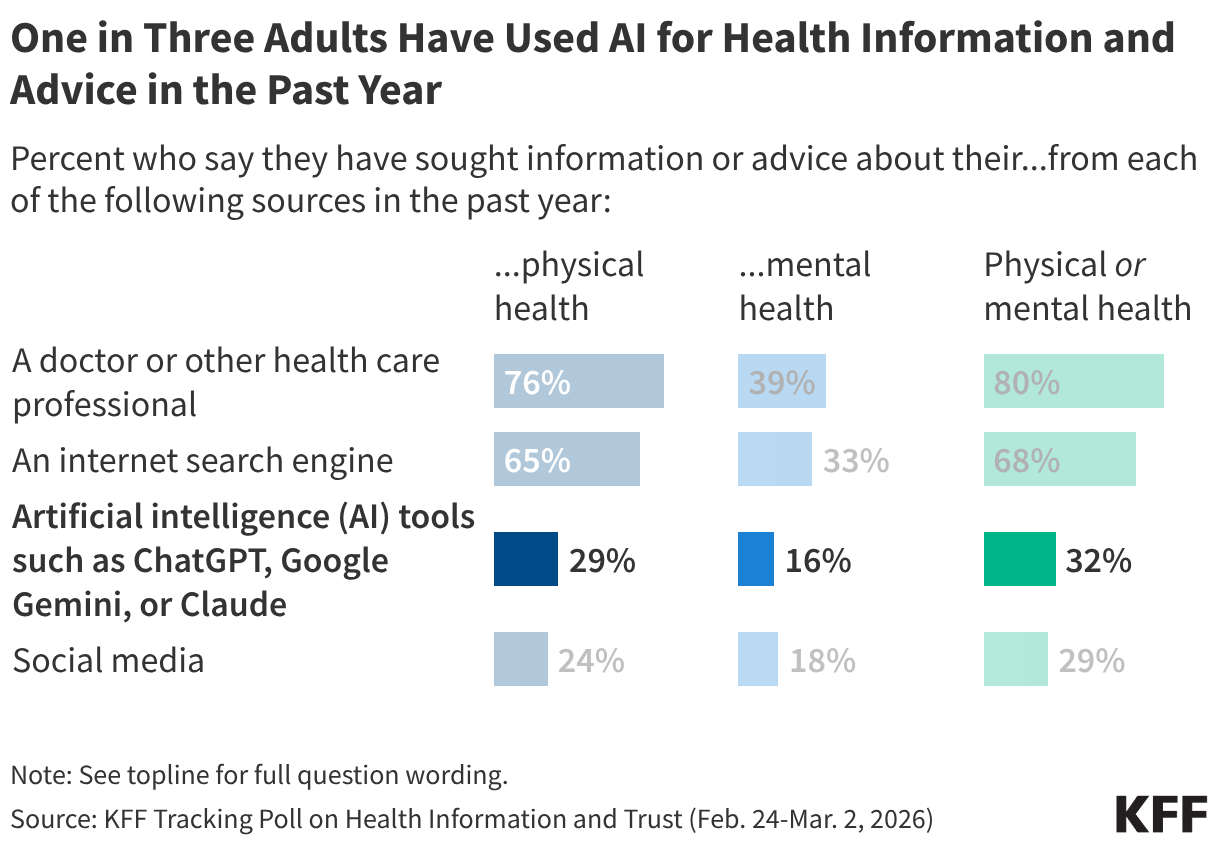
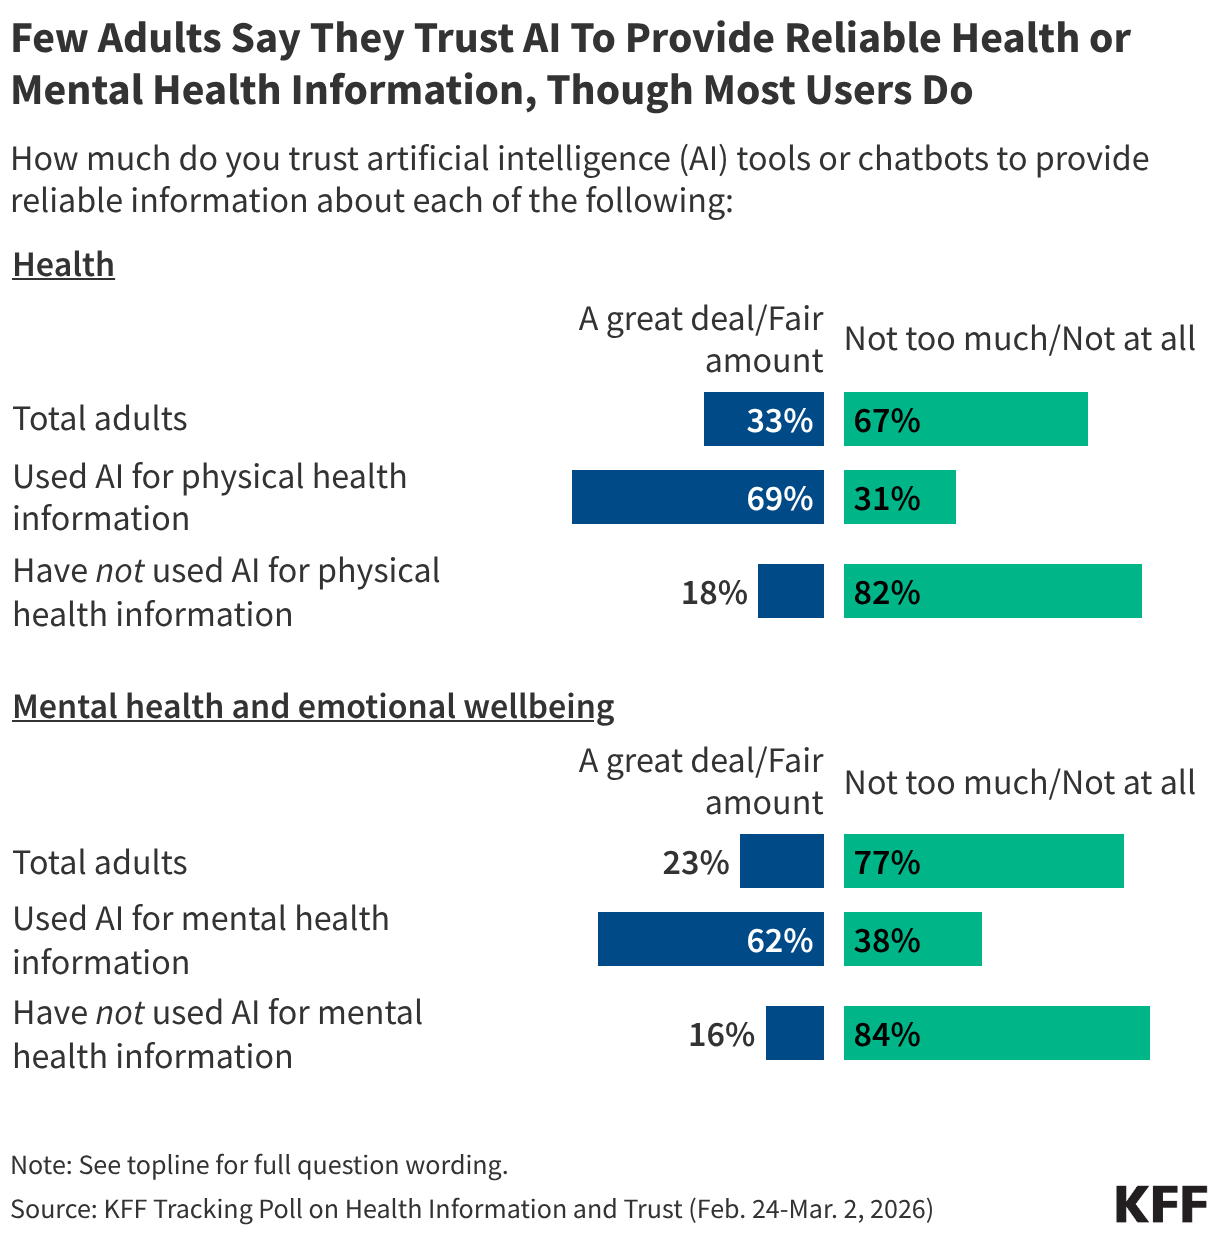
About a third (32%) of the public reports turning to AI chatbots for health information and advice in the past year – rivaling social media as a health information source, but less common than reliance on health care providers or internet search engines (where they may be encountering AI generated results, even if they are not looking for them). The share of adults using AI for health information includes three in ten who say they’ve used these chatbots in the past year for information or advice about their physical health, and one in six who’ve used them for mental health information or advice. For more information, see KFF’s March 2026 Tracking Poll on Health Information and Trust.
Larger shares of younger adults report turning to AI for either physical health or mental health information in the past year. When it comes to mental health advice, uninsured adults and Black and Hispanic adults are more likely than insured adults and White adults to have turned to AI.
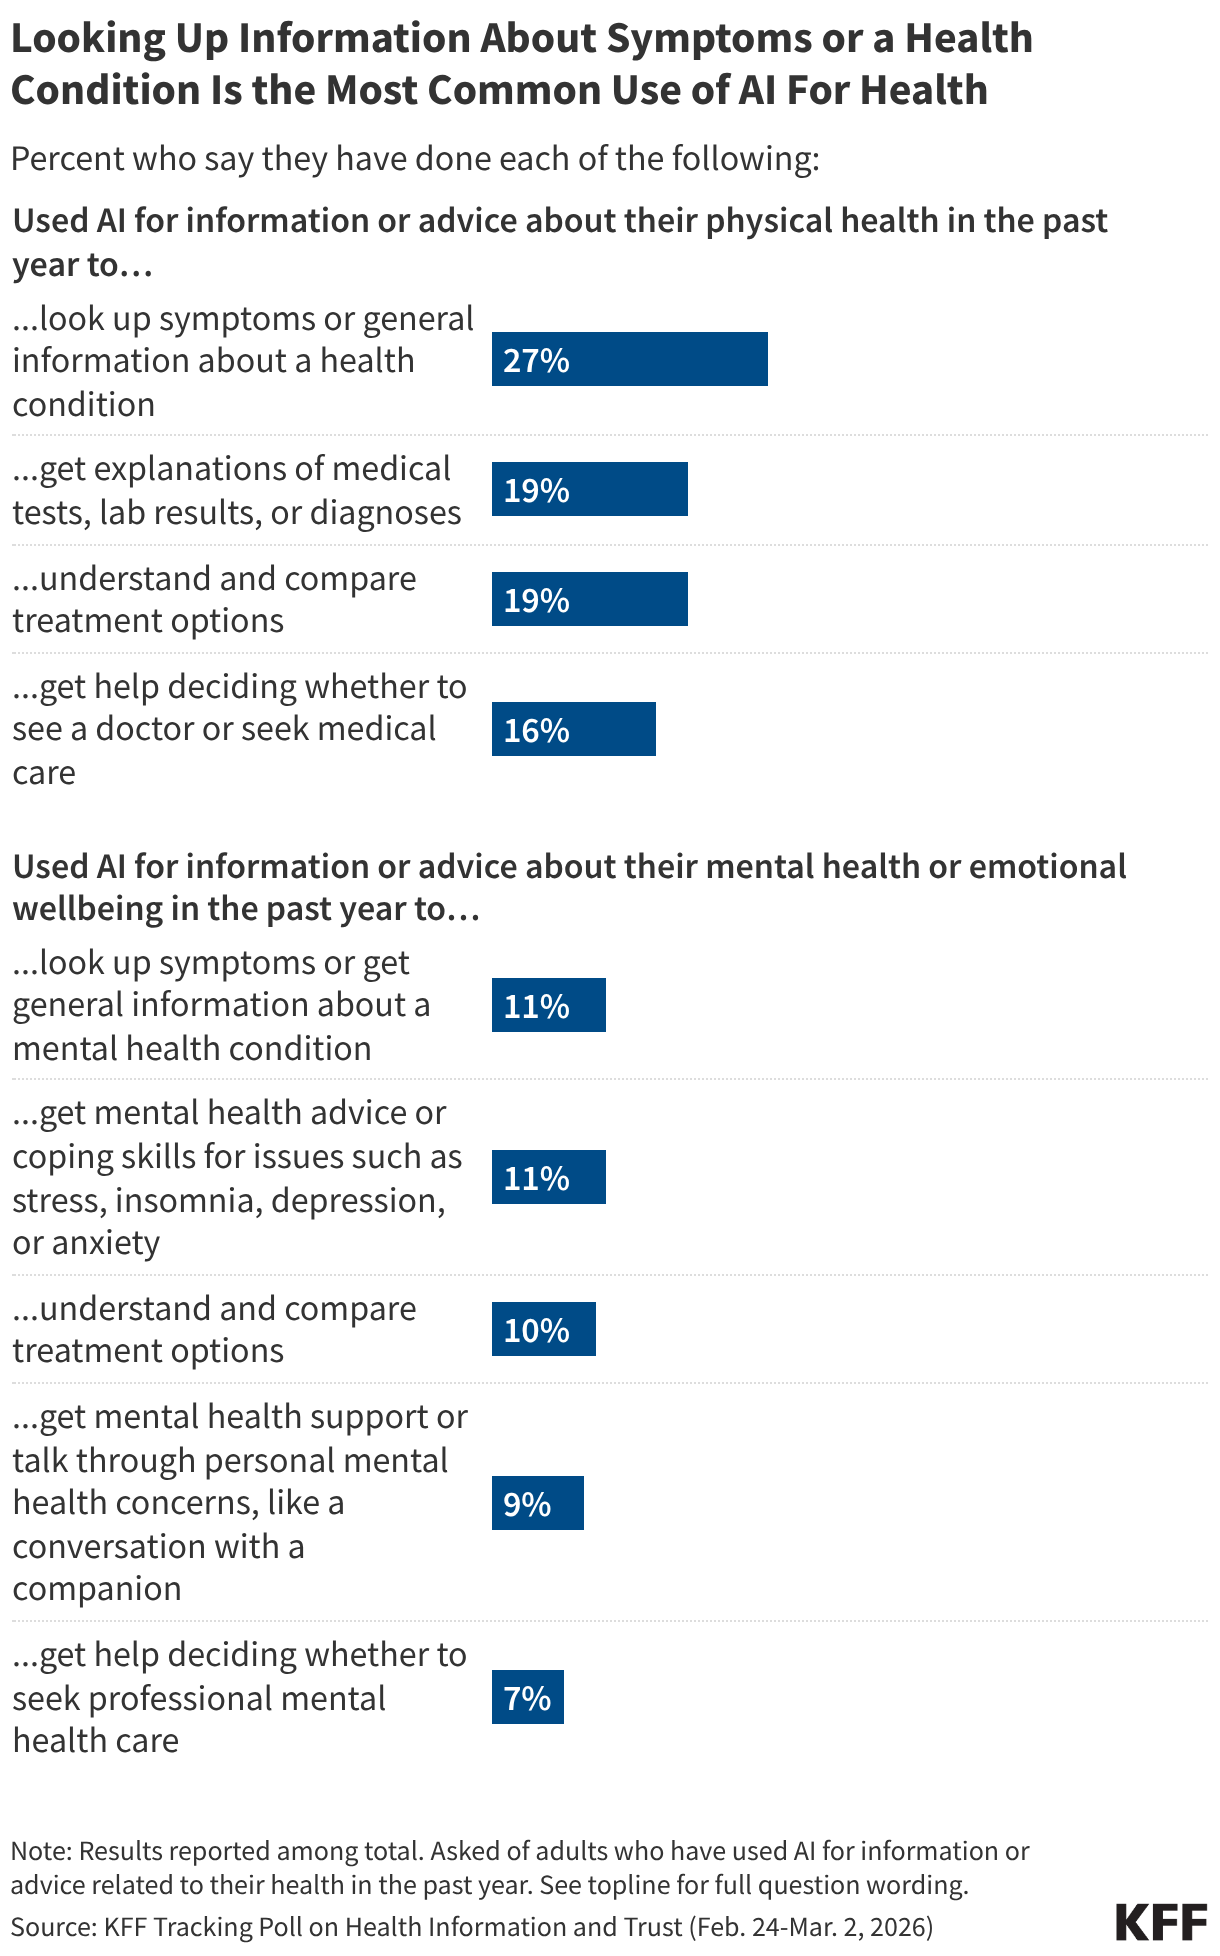
People report using AI for either physical health or mental health information in a variety of ways, most commonly to look up symptoms or general information about health conditions. Fewer say they used AI to help make decisions about whether to seek medical care for either physical or mental health concerns.
The most common reason people cite for turning to AI for health advice is wanting quick or immediate support. Many also cite wanting to look up information before seeing a provider or feeling more comfortable looking up health questions privately. One in five cite health care access or affordability issues as major reasons for turning to AI for health questions, including larger shares of younger adults and those with lower household incomes
Among the public overall, few adults say they trust AI tools to provide reliable information about health, but most adults who have used AI for health information and advice say they trust these chatbots to provide reliable health information.
False or Unproven Health Claims
Awareness and Belief in False or Unproven Health Claims
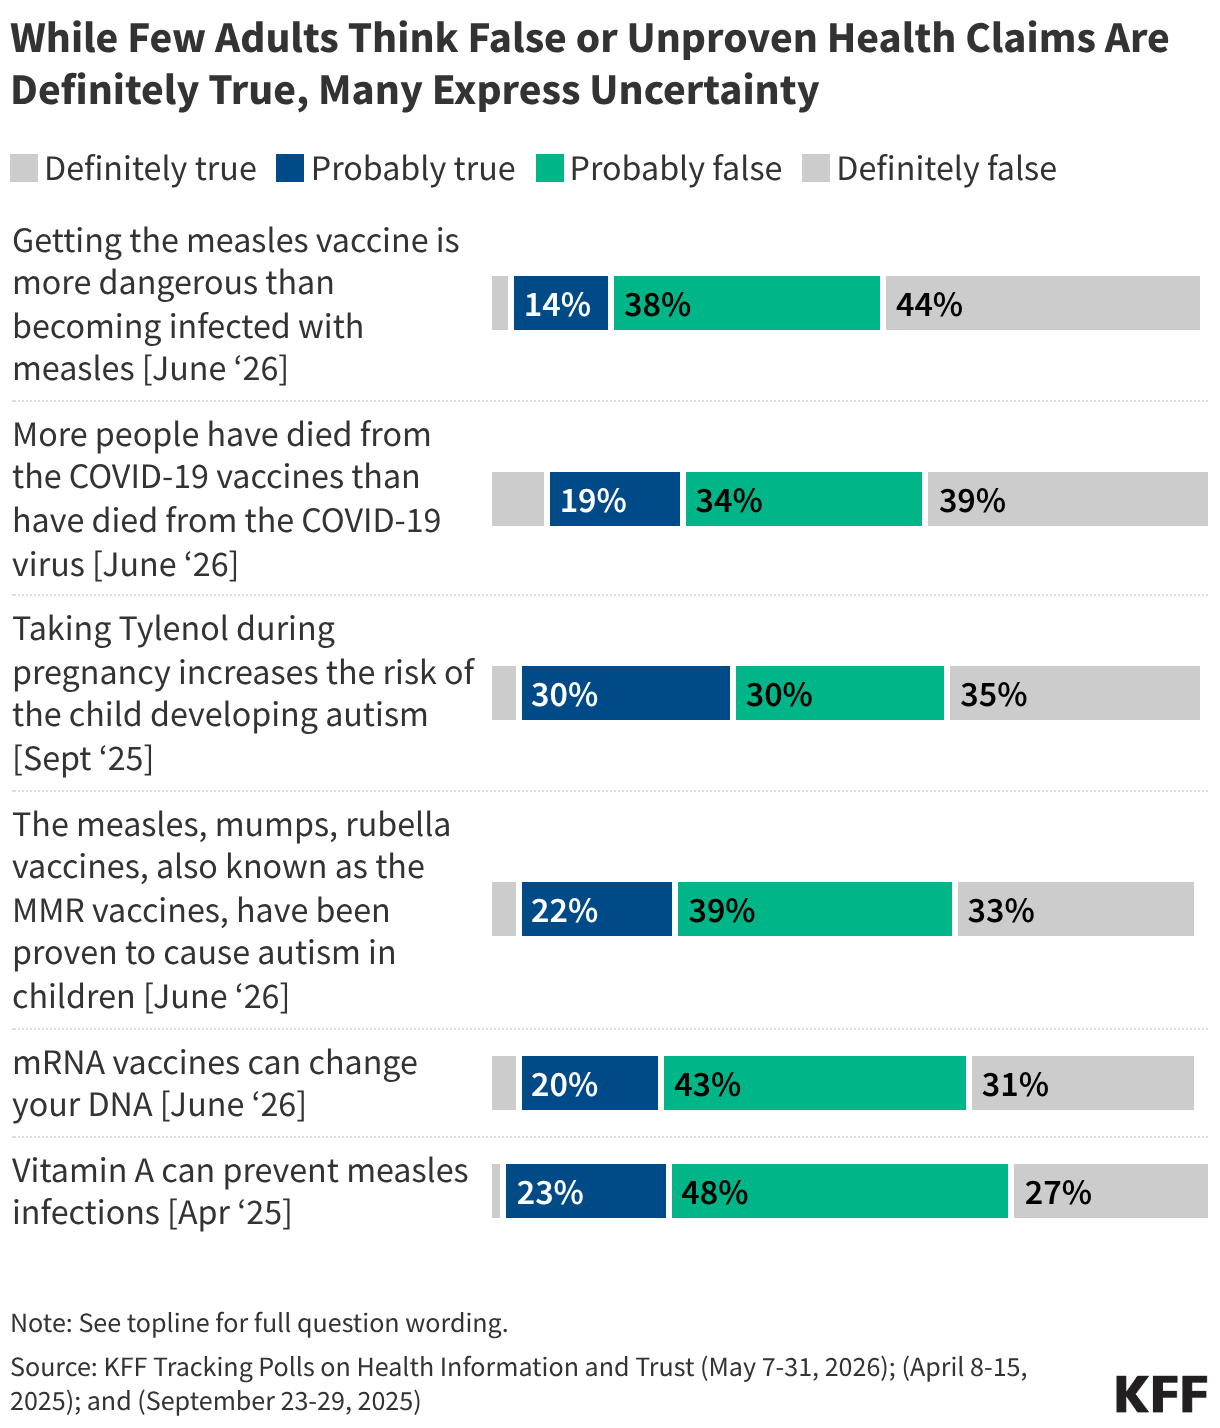
Exposure to health misinformation is often widespread, but relatively small shares of the public express certainty that many false or unproven claims are true. In fact, at least half of the public fall in a “malleable middle,” saying these claims are either “probably true” or “probably false.” The public’s uncertainty around false or unproven health claims related to COVID-19 , vaccines , measles and the purported causal link between Tylenol and autism presents an opportunity for interventions to clear up confusion and deliver accurate information.
KFF polls have measured exposure to a wide array of false, misleading, and unproven health claims since 2023. Exposure varies widely depending on the topic and prominence of news coverage of the claim. The most widely heard of those tested in KFF polls is that taking Tylenol during pregnancy increases the risk of a child developing autism, a claim cited by President Trump in a widely covered September 2025 press conference.
Across an array of false or unproven health claims measured in KFF surveys, few adults are certain these claims are “definitely true” while much larger shares say they are “definitely false.” For most claims, at least half express uncertainty, falling into the malleable middle and saying the claims are either “probably true” or “probably false.” Six recent false claims measured in 2026 and 2025 KFF surveys are shown below.
While KFF polling has consistently found that much of the public falls in the “malleable middle” when it comes to a wide array of false health claims, there are nuances within this group that can be examined by looking at patterns of belief across multiple myths. KFF’s June 2026 Tracking Poll on Health Information and Trust identified five groups based off patterns of belief across four common vaccine myths:
KFF polling has measured exposure to and belief in false or unproven claims across a wide array of topics. For information on belief in additional claims about COVID-19, reproductive health, and gun violence, see KFF’s Health Misinformation Tracking Poll Pilot. For information on additional false claims related to COVID-19, see KFF’s May 2022, and October 2021 COVID-19 Vaccine Monitors.
KFF polling has found partisanship and education play a substantial role in belief of false or unproven health claims about vaccines, COVID-19 and measles. Republicans and adults without a college degree are consistently more likely than Democrats and college educated adults, respectively, to believe or lean towards believing vaccine-related myths. For more information, see KFF's June 2026 Tracking Poll on Health Information and Trust.
Beyond partisanship and education, belief in common vaccine myths sometimes varies by age and race and ethnicity. Larger shares of adults ages 30-49 compared to older adults say false claims about vaccines are either definitely or probably true, as do Black adults compared to White adults. Hispanic adults are more likely than White adults to endorse two false claims about the measles vaccines. These differences show that susceptibility to health misinformation among some groups can vary depending on the topic, which may reflect different information channels relied upon by these groups (see social media and news sources sections for more information).
Adults who frequently use social media or artificial intelligence (AI) tools for health information are more likely to say several false claims about vaccines are definitely or probably true, as are those who lack a trusted health care provider compared to those who have a provider they trust to answer questions about their health.
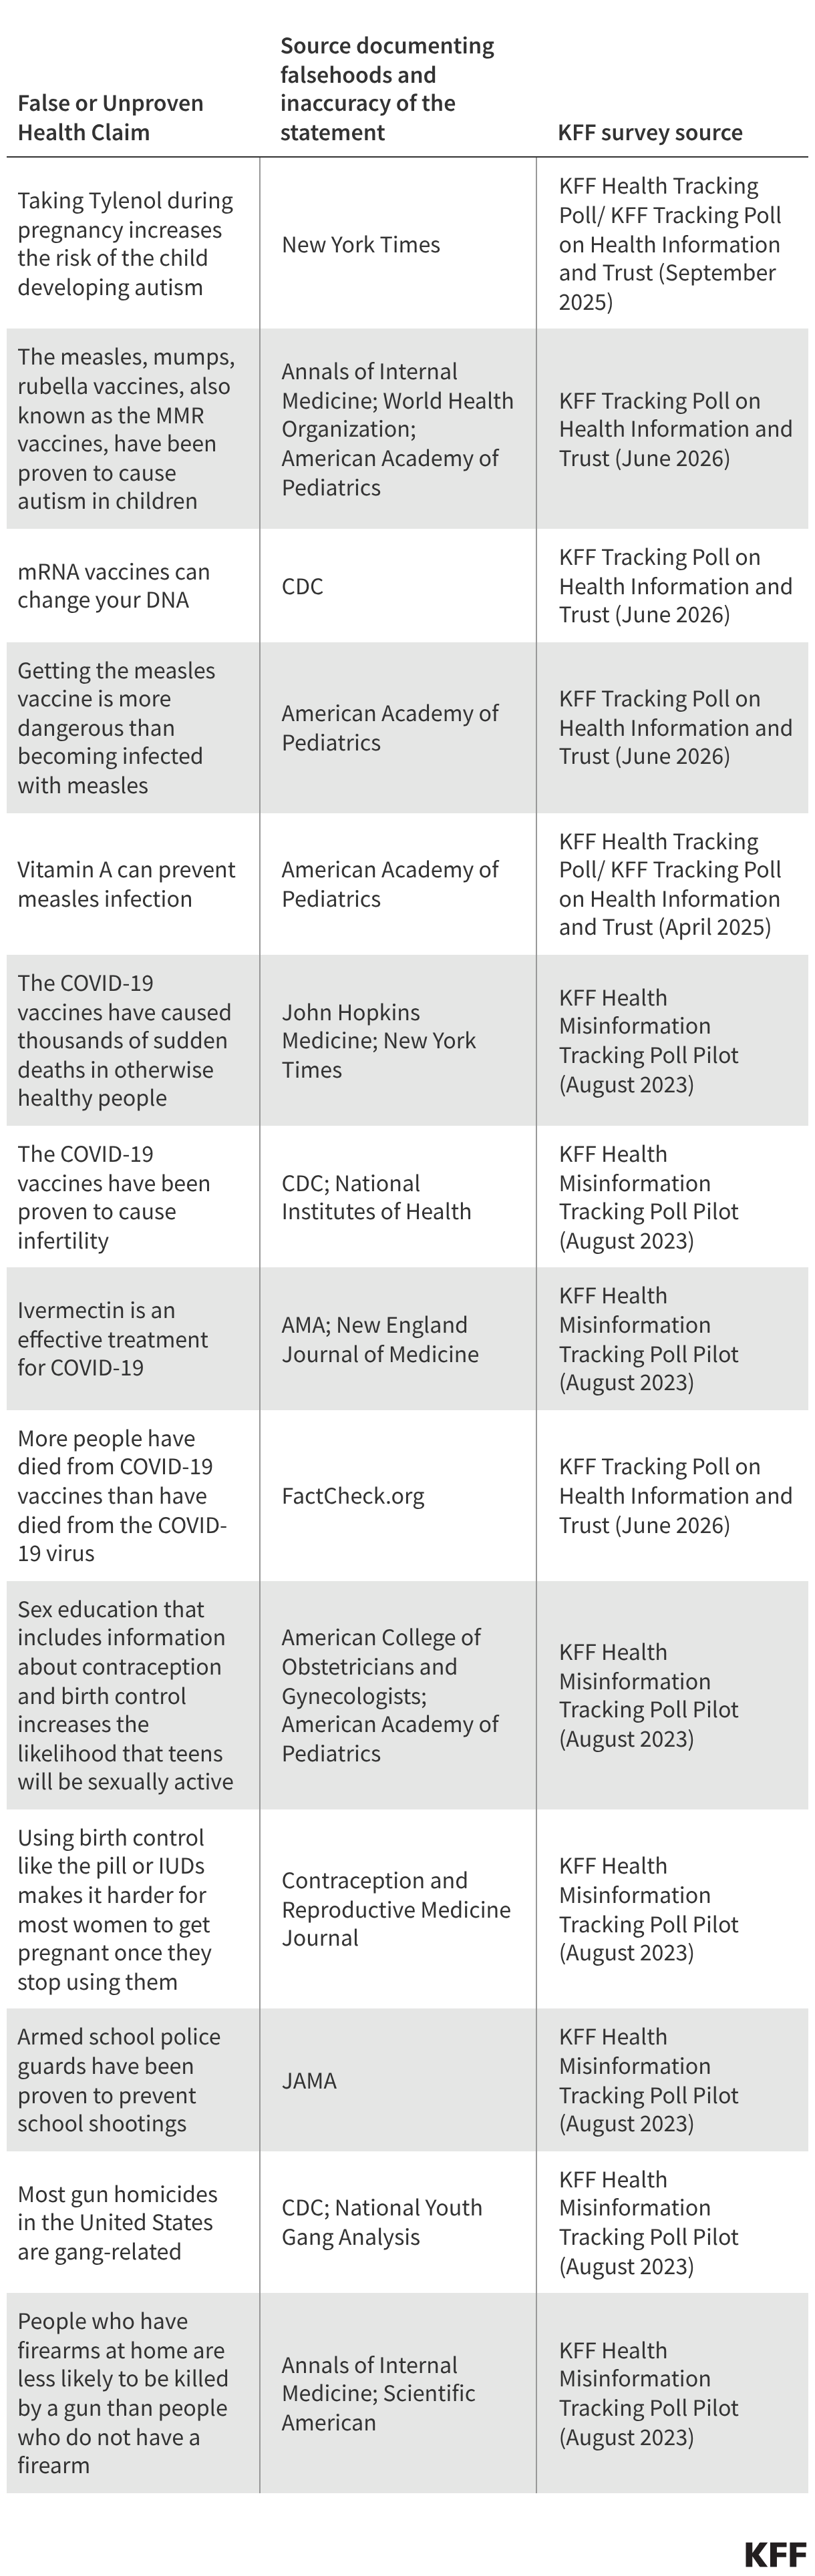
KFF polling has sought to examine the public’s exposure to and belief in a wide array of false or unproven health claims. Many of the false or unproven claims measured in KFF surveys have been amplified by or directly made by government officials, while others have been more nebulously shared and spread in public media over the years. Below is a list of sources to document these claims’ inaccuracy.
Most U.S. adults, including majorities across partisans, express confidence in the safety of many routine vaccines for children, including MMR, polio, and hepatitis B. Similarly, large majorities of adults ages 50 and over are confident that vaccines for pneumonia and shingles are safe. Views on the safety of COVID-19 and flu vaccines for both adults and children are more divided, with large shares of Democrats expressing confidence compared with smaller shares of Republicans. For more information, see KFF’s June 2026, January 2026 and April 2025 Tracking Polls on Health Information and Trust.
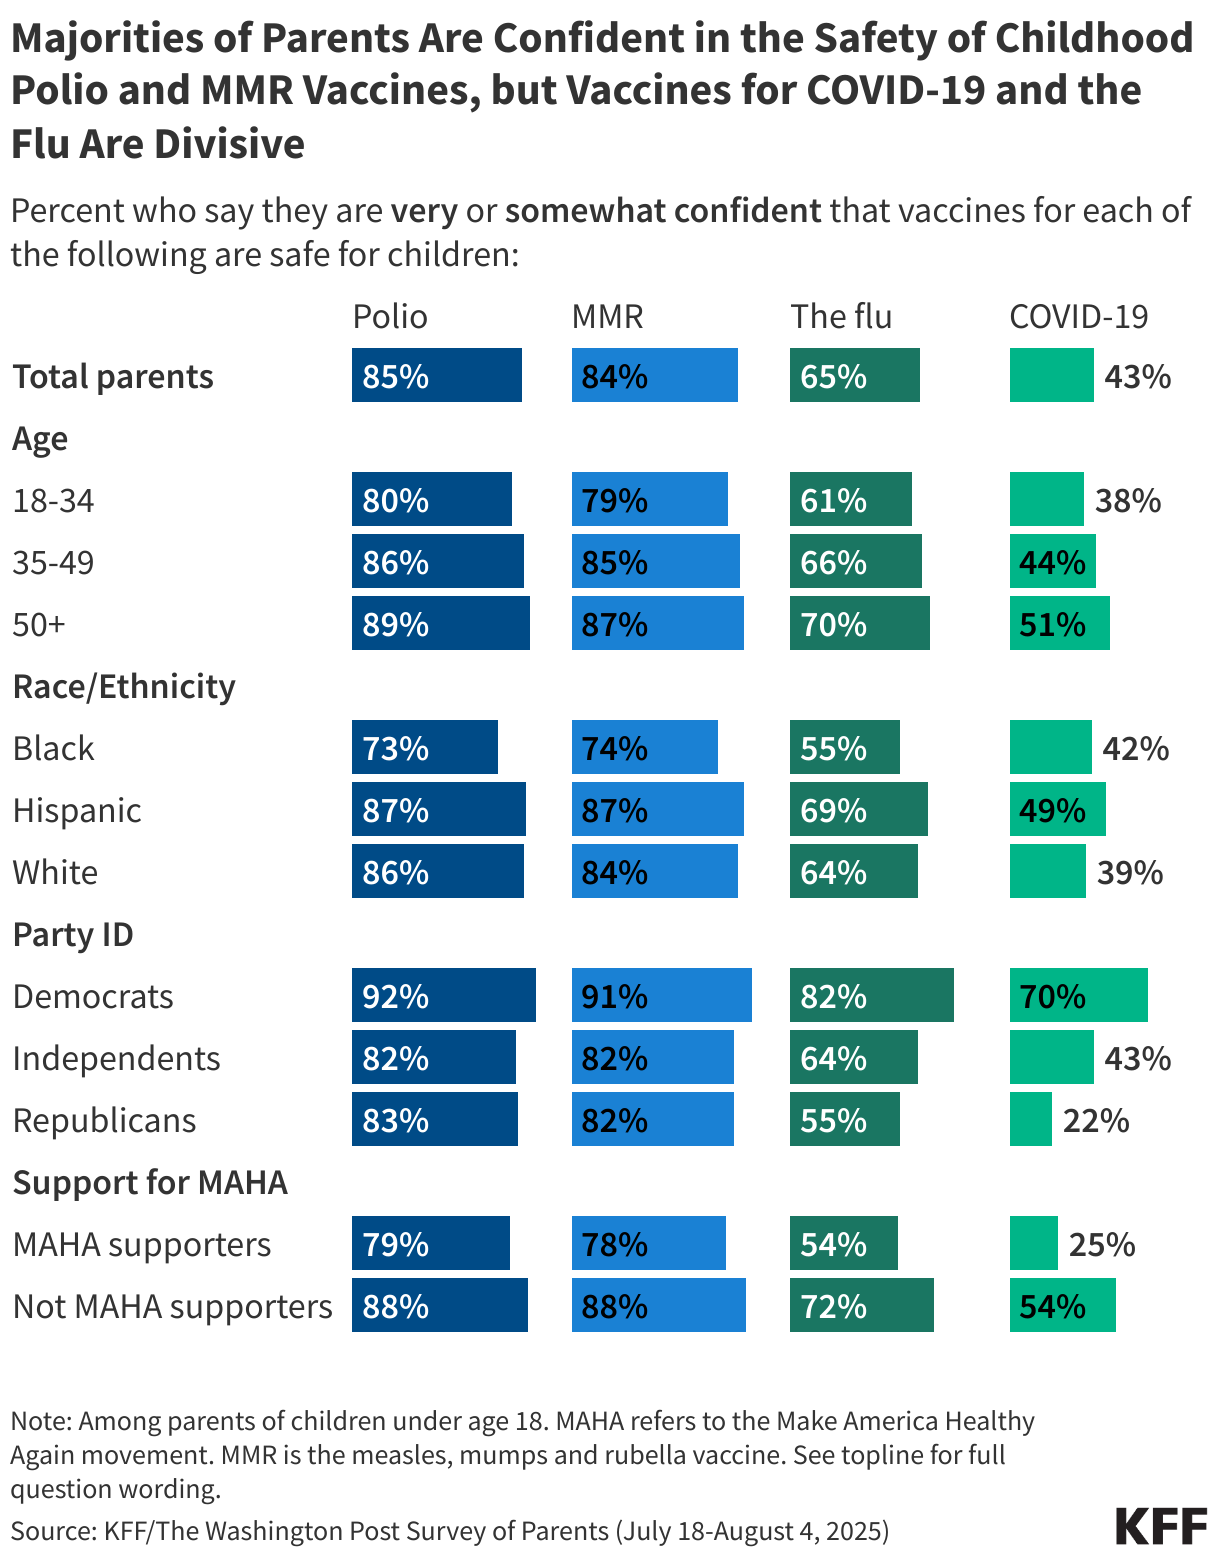
In summer 2025, large majorities of parents expressed confidence in the safety of childhood vaccines for polio and measles, mumps, and rubella (MMR), but parents’ views on the safety of flu and COVID-19 vaccines were more polarized. About two-thirds of parents say the flu vaccines are safe for children, while fewer than half say the same about COVID-19 vaccines, with divisions along partisan lines. Beyond partisanship, parents who support the Make America Healthy Again (MAHA) movement (38% of parents), Black parents and parents under age 35 are less likely than their peers to be confident that many routine vaccines are safe for children. For more information, see the KFF/Washington Post Survey of Parents.
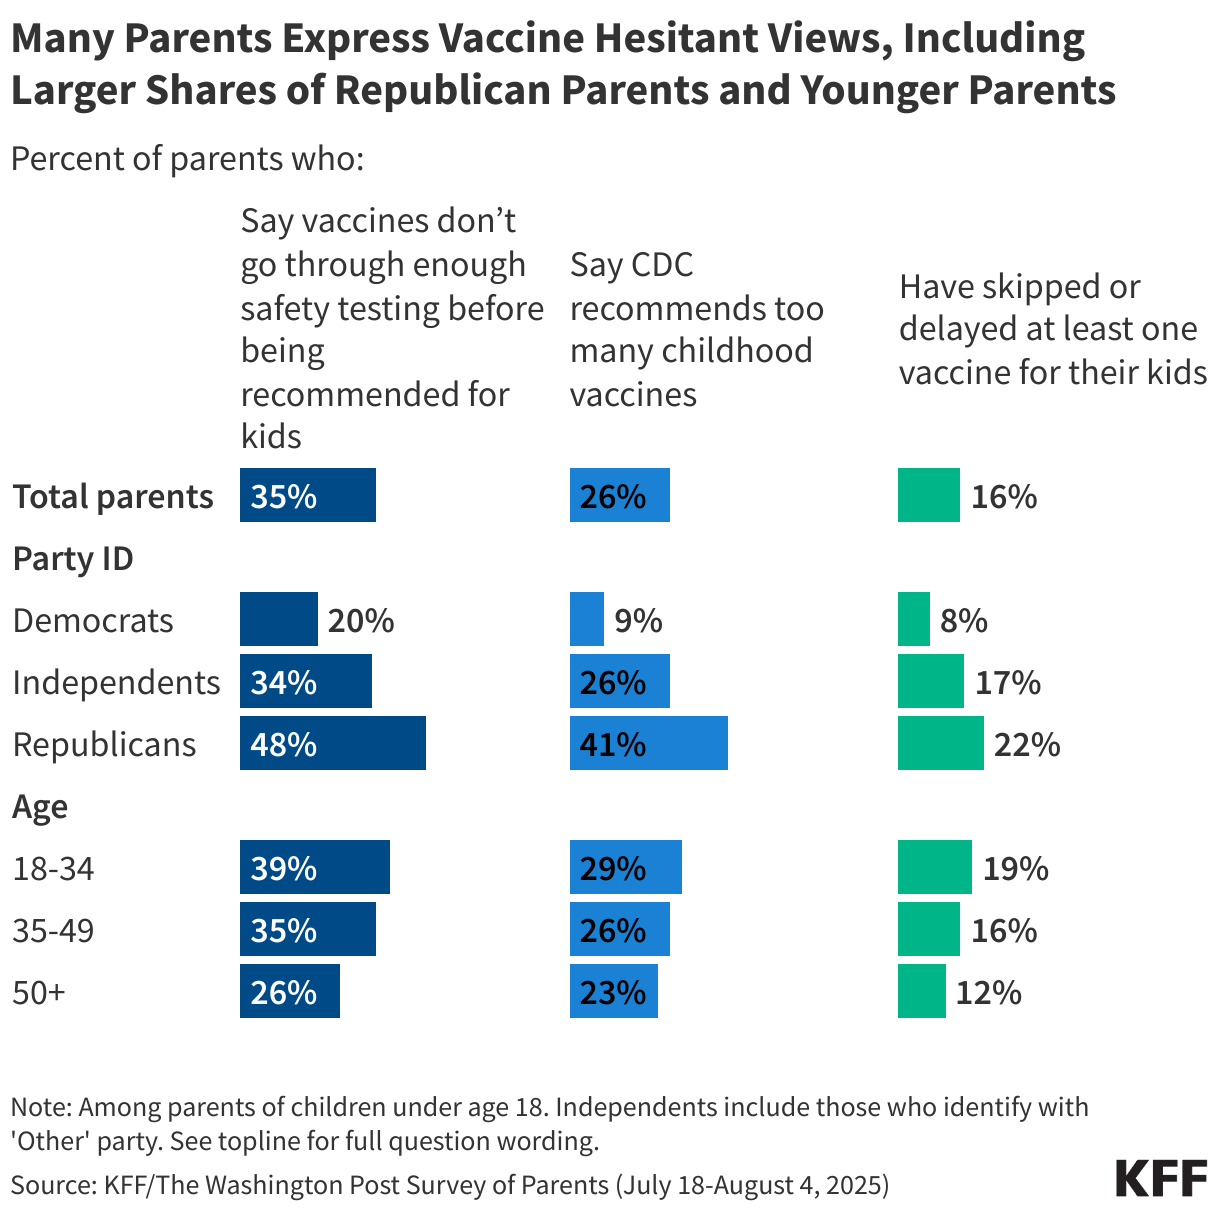
Most parents report keeping their children up to date on childhood vaccines, but about one in six say they have ever skipped or delayed at least one childhood vaccine for any of their children (excluding seasonal vaccines like flu and COVID-19). Despite strong uptake, many parents express skepticism towards vaccine safety testing and the number of vaccines recommended by the CDC (this survey was fielded prior to recent changes to the childhood vaccine schedule announced by HHS in January 2026). Younger parents and those who identify as Republicans are more likely than their counterparts to endorse vaccine-skeptical attitudes and to report skipping vaccines for their own children. For more information, see the KFF/Washington Post Survey of Parents.
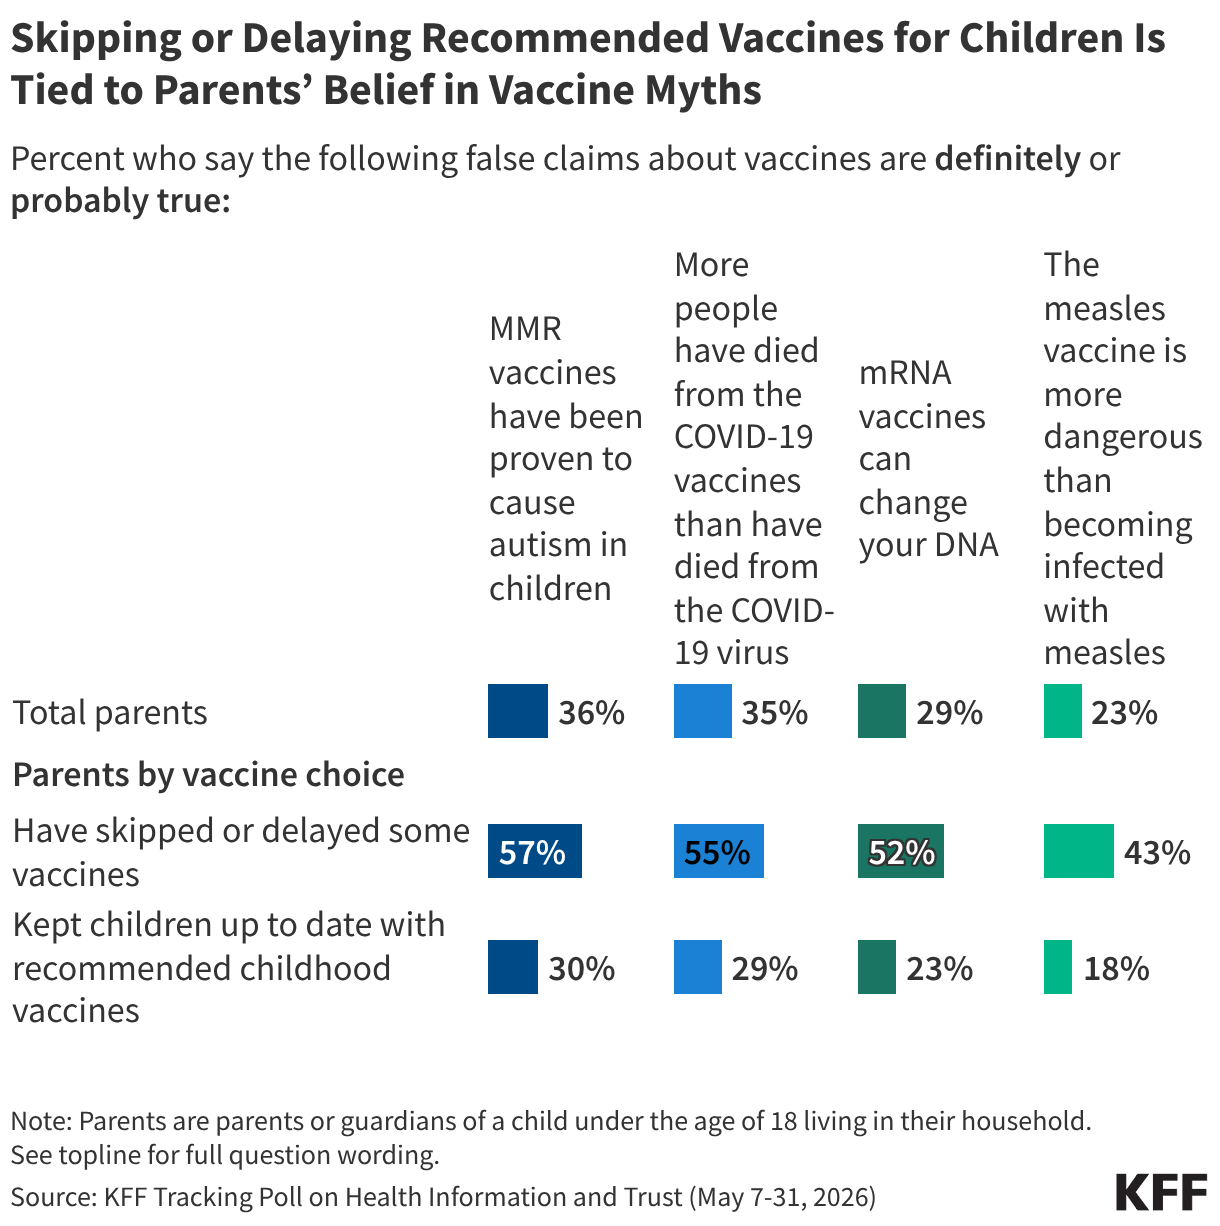
Parents who skip or delay recommended vaccines for their children are about twice as likely as parents who keep their children up to date on vaccines to believe or lean toward believing false claims about the measles and COVID-19 vaccines, underscoring how false health claims may shape parents’ decisions. For more information, see KFF's June 2026 Tracking Poll on Health Information and Trust.
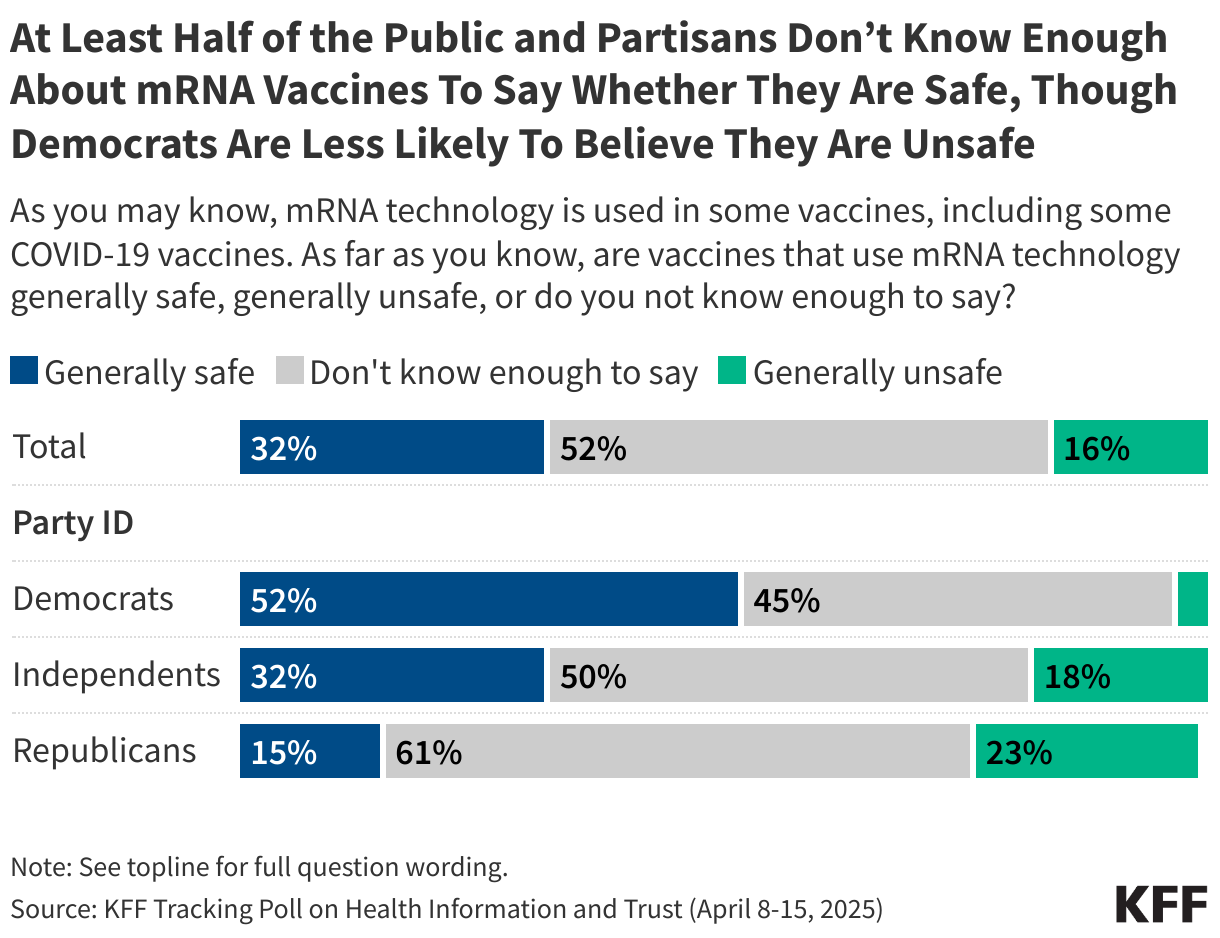
COVID-19 vaccines and some other vaccines currently under development rely on a vaccine technology known as messenger-RNA (mRNA), which has long been the subject of misinformation. While few adults view mRNA technology as unsafe, the technology remains obscure to much of the public, with about half saying they don’t know enough to say. For more information, see KFF’s April 2025 Tracking Poll on Health Information and Trust.
VOLUME 51
New KFF Poll Shows Public Divided When It Comes to Trusting Federal Health Agencies for Reliable Information
KFF’s latest Tracking Poll on Health Information and Trust finds that following large declines in trust in federal health agencies from 2020 through early 2026, trust in the CDC as a source of health information held steady over the last 6 months, while trust in both President Trump and state government officials declined somewhat. These findings, including levels of trust in sources of health information broken out by key demographic groups, can also be found on KFF’s interactive Health Information and Trust Polling Dashboard.
Featured
New KFF Tracking Poll on Health Information and Trust Looks at Trends in Trusted Sources of Health Information
KFF polling over the past several years has documented declining trust in the U.S. Centers for Disease Control and Prevention (CDC) for vaccine information, beginning during the COVID-19 pandemic and continuing during the first part of President Trump’s second term. As Congress considers President Trump’s nomination of Erica Schwartz to lead the CDC, the latest KFF poll finds that about half of the public (51%) express at least a fair amount of trust in the CDC to provide reliable health information, similar to the share who said so in January. The same share (51%) express trust in the FDA, also steady since January. Trust is lower for other sources, with fewer than half of adults saying they trust their state government officials, HHS Secretary Robert F. Kennedy Jr., or President Trump to provide reliable health information. The share who trust state government officials for health information is down 5 percentage points since January (38%, down from 43%), while trust in President Trump has declined by a similar amount (24%, down from 30%).
Doctors continue to be the public’s most trusted source of reliable information on health issues, with a large majority of adults (86%) saying they have at least “a fair amount” of trust in their own doctor or health care provider, similar to the share who said so in January.
Doctors and health care providers stand out as the one source trusted by large majorities of Democrats, independents, and Republicans alike. However, when it comes to some other sources of health information, partisans diverge. About six in ten Republicans say they trust Secretary Kennedy (64%) and President Trump (61%) for reliable health information, compared to three in ten or fewer independents and Democrats who say the same. On the other hand, Democrats (50%) are more likely than independents (35%) and Republicans (34%) to trust their state government officials for health information. Democrats were much more likely than Republicans to trust the CDC and FDA for vaccine-related information throughout Joe Biden’s presidency, but partisan gaps have narrowed during President Trump’s second term. Similar shares of Democrats (52%) and Republicans (56%) now say they trust the FDA for reliable health information, while Democrats remain just slightly more likely than Republicans to express trust in the CDC (58% vs. 49%).
AI & Emerging Technology
State Laws Regulating AI Chatbots and Mental Health Take Different Paths
A United Nations (UN) scientific panel’s preliminary report, released earlier this month, describes both the promise of the use of AI for health care and serious risks, particularly in conversations about mental health. The report warns that AI systems designed to be highly agreeable can validate a user’s beliefs regardless of accuracy, and in some cases, deepen emotional dependency or reinforce harmful thinking. The panel recommended legal incentives for safer system design, stronger evaluations of how these systems behave, and accountability measures for when they cause harm.
Regulations of AI chatbots in Arizona are taking a different path, with thegovernor vetoing three AI-related bills in late June. One of the three, which would have set disclosure and safety requirements for AI chatbots, including protections for minors, had passed the state Senate unanimously and the House before being vetoed. Supporters of the bill said that it would protect children from harmful chatbot interactions, but the governor’s veto notice claimed that it would cap damages too low for families harmed by violations and block them from bringing their own lawsuits.
Why This Matters: As state governments consider different regulatory responses to the growing use of AI chatbots and AI companions, a March KFF Tracking Poll on Health Information and Trust found that one in six adults say they have used AI for information and advice about their mental health or emotional wellbeing in the past year. Younger adults are particularly likely to be turning to AI for mental health information, with nearly three in ten (28%) of those between the ages of 18 and 29 saying they have done so in the past year.
Minnesota Law Requiring Mental Health Warnings on Social Media Paused During Legal Challenge
A new Minnesota law was scheduled to take effect July 1, requiring social media platforms including TikTok, Facebook, and Instagram to display warnings about the potential mental health risks of social media use, along with information for the 988 Suicide and Crisis Lifeline. Lawmakers say the law is intended to prompt users, particularly young people and parents, to think about their time on these platforms. An industry group representing social media companies sued to block the law, arguing that the mandated messages amount to compelled speech, and the state’s attorney general has agreed not to enforce it while the lawsuit is pending. A similar law in Colorado was put on hold last year after a comparable legal challenge. These laws target the potential risks of social media broadly rather than specific content, joining otherefforts that allege platform design itself, not just the content posted on social media, can pose mental health risks to users.
What We’re Watching
Social Media Health Information is Widely Distrusted, but Still Shapes Decisions
Most U.S. adults engage with health content on social media in some form, whether by sharing it or participating in online health communities, according to a new research letter published in JAMA reporting results from the 2024 Health Information National Trends Survey. Most users also said they don’t trust what they see there: 78% of users reported believing that health information on social media was false or misleading.
More recent KFF polling from June 2026 supports these findings, with about three in ten adults (31%) now using social media at least monthly for health information and advice. A majority (61%) say they are confident they are able to tell what’s true or false, but only about a third of social media users (36%) say they follow up with a doctor at least most of the time to check what they’ve seen.
The JAMA research letter goes further, though, examining whether people act based on what they see. More than one in five adults who use social media (21.6%) said they had made at least one health-related decision based on something they saw on these platforms. The letter’s authors note that these findings describe patterns of engagement rather than the accuracy of the content itself, with social media functioning as a widely used, if often distrusted, source of health information that still shapes behavior.
Why This Matters: The findings taken together show that social media content can still influence health decisions, regardless of how confident people feel in their own judgment or how skeptical they say they are. Although the underlying data in the JAMA letter is from 2024, KFF will continue to monitor how distrusted sources of health information may impact behavior, particularly as the AI and social media landscapes continue to evolve.
Misleading Sunscreen Content Is Rare on TikTok, But Outsized Engagement Keeps It Visible
A content analysis of 971 of the most-viewed TikTok videos using popular sunscreen-related hashtags, published last month in PLOS Digital Health, found the vast majority (86.8%) of sunscreen-related content promoted its use, commonly highlighting protection against skin damage, acne, aging, and cancer. A small share of videos (6.0%) included critique of sunscreen, and an even smaller fraction (1.6%) solely discouraged its use. While overall view counts did not differ significantly between content types, videos that only critiqued sunscreen received significantly higher engagement in likes, shares, and comments than promotional videos, suggesting that a small volume of content can still reach audiences disproportionately to its actual share of posts.
The study identified several specific claims among the small number of critical videos, including that sunscreen is toxic, contains carcinogens, disrupts hormones, or prevents the body from gaining the benefits of sun exposure, including vitamin D production. Multiple studies have found that regular sunscreen use does not cause vitamin D deficiency, and the chemical ingredients most often singled out in online criticism have no indication of being harmful to human health at the concentrations used in approved products.
Many of these claims have circulated online for several years, in some cases tracing back to a 2020 study finding that some chemical sunscreen ingredients are absorbed into the body at levels exceeding the FDA’s threshold for further safety testing. That finding on its own, though, does not indicate that an ingredient is unsafe. Some posts have also conflated past recalls of specific sunscreen products found to contain benzene, an unrelated and unapproved contaminant, with the safety of approved active ingredients generally. As a new sunscreen ingredient approved by the FDA last month begins appearing in U.S. products, KFF will monitor whether confusion about sunscreen ingredient safety continues to affect how the public perceives and uses sunscreen.
Why This Matters: The influence of misleading claims about sunscreen safety may lie less in their overall volume than in how strongly they resonate with the audiences who do encounter them. KFF polling has found that nearly four in ten (39%) of adults are “not too” or “not at all” confident in their ability to tell what is true or false in health information they see on social media. Such uncertainty may leave more room for a small volume of highly engaging false claims to carry influence beyond what their limited presence may suggest.
About The Health Information and Trust Initiative: the Health Information and Trust Initiative is a KFF program aimed at tracking health misinformation in the U.S., analyzing its impact on the American people, and mobilizing media to address the problem. Our goal is to be of service to everyone working on health misinformation, strengthen efforts to counter misinformation, and build trust.
The Monitor is a report from KFF’s Health Information and Trust initiative that focuses on recent developments in health information. It’s free and published twice a month.
Support for the Health Information and Trust initiative is provided by the Robert Wood Johnson Foundation (RWJF). The views expressed do not necessarily reflect the views of RWJF and KFF maintains full editorial control over all of its policy analysis, polling, and journalism activities. The data shared in the Monitor is sourced through media monitoring research conducted by KFF.
Editorial Note: This brief was updated on July 22, 2026, to incorporate new data on abortion statistics.
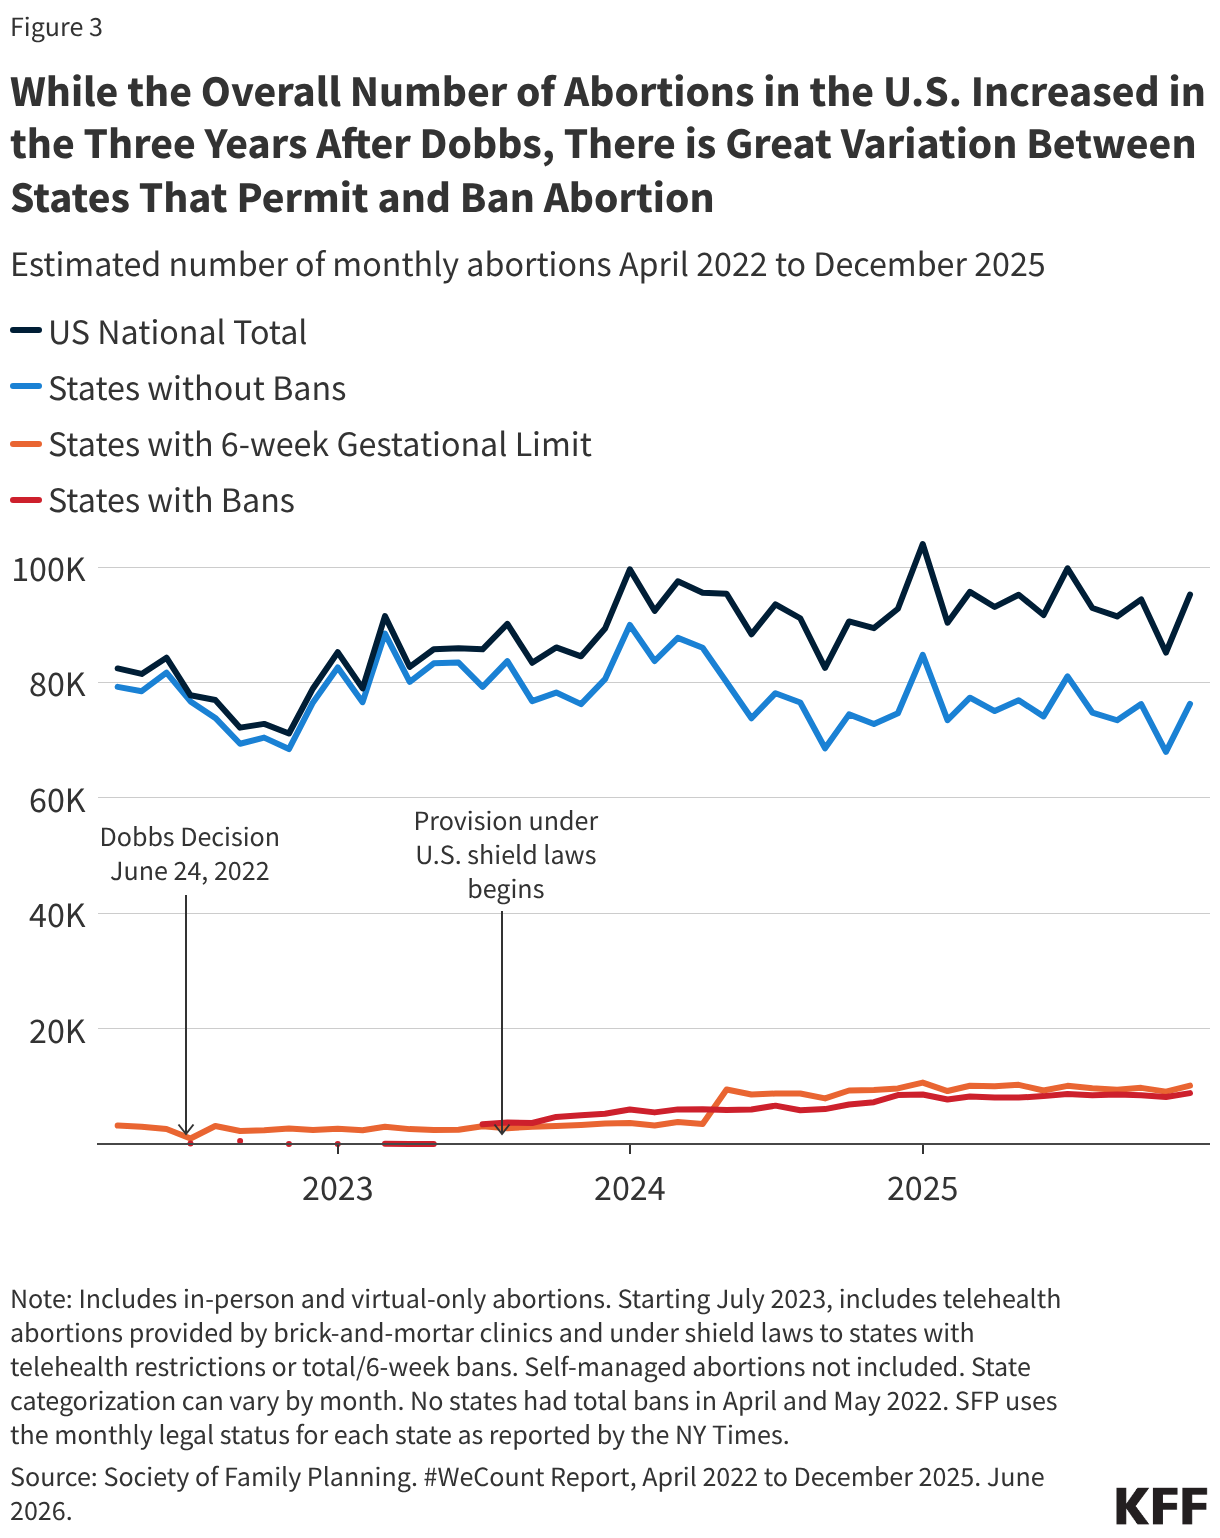
In the years following the Supreme Court ruling that overturned Roe v. Wade, the volume of abortions nationally has slightly increased. The most recent data from the Society for Family Planning’s #WeCount project show that the average monthly abortion volume in 2025 was higher than the monthly average in 2024. From January to December 2025, there have been 1.13 million abortions compared to 1.11 million abortions in all of 2024 and 1.05 million abortions in 2023. For most of the decade prior to the Dobbs ruling, there was a steady decline in abortion rates nationally, with a slight uptick in the years just before the ruling.
The upward trend in abortion volume is likely due to multiple reasons, including expanded telehealth capacity, the ability to mail medication abortion pills to patients, and the lower costs for telehealth abortions through virtual clinics compared to in-person care. Medication abortion via telehealth now accounts for 28% of all abortions.
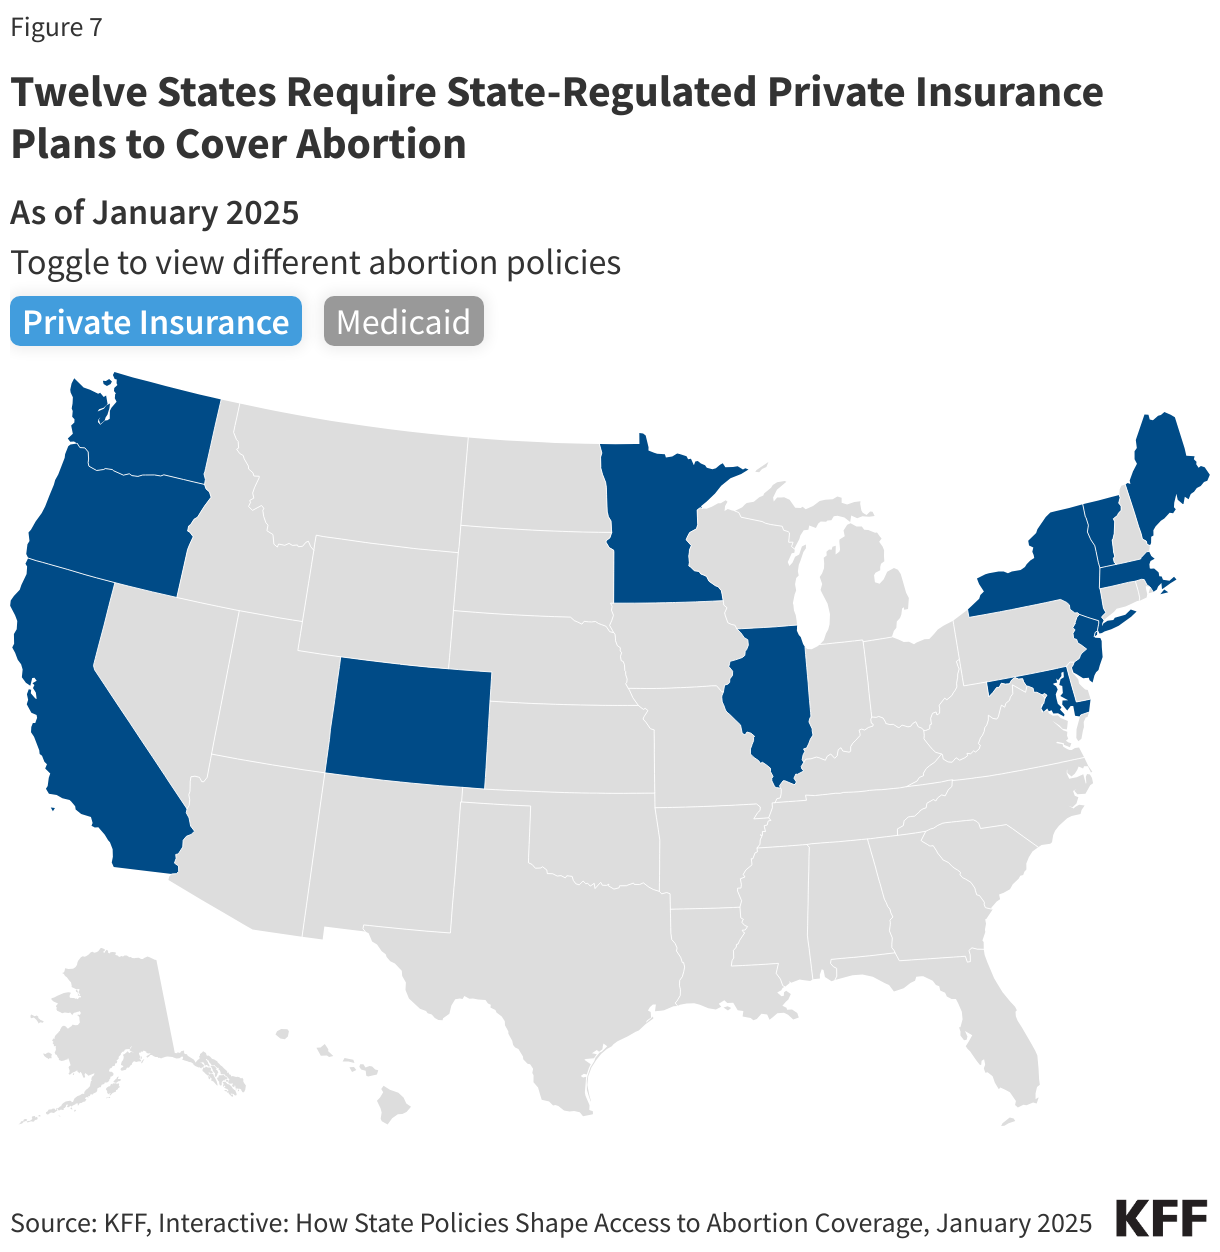
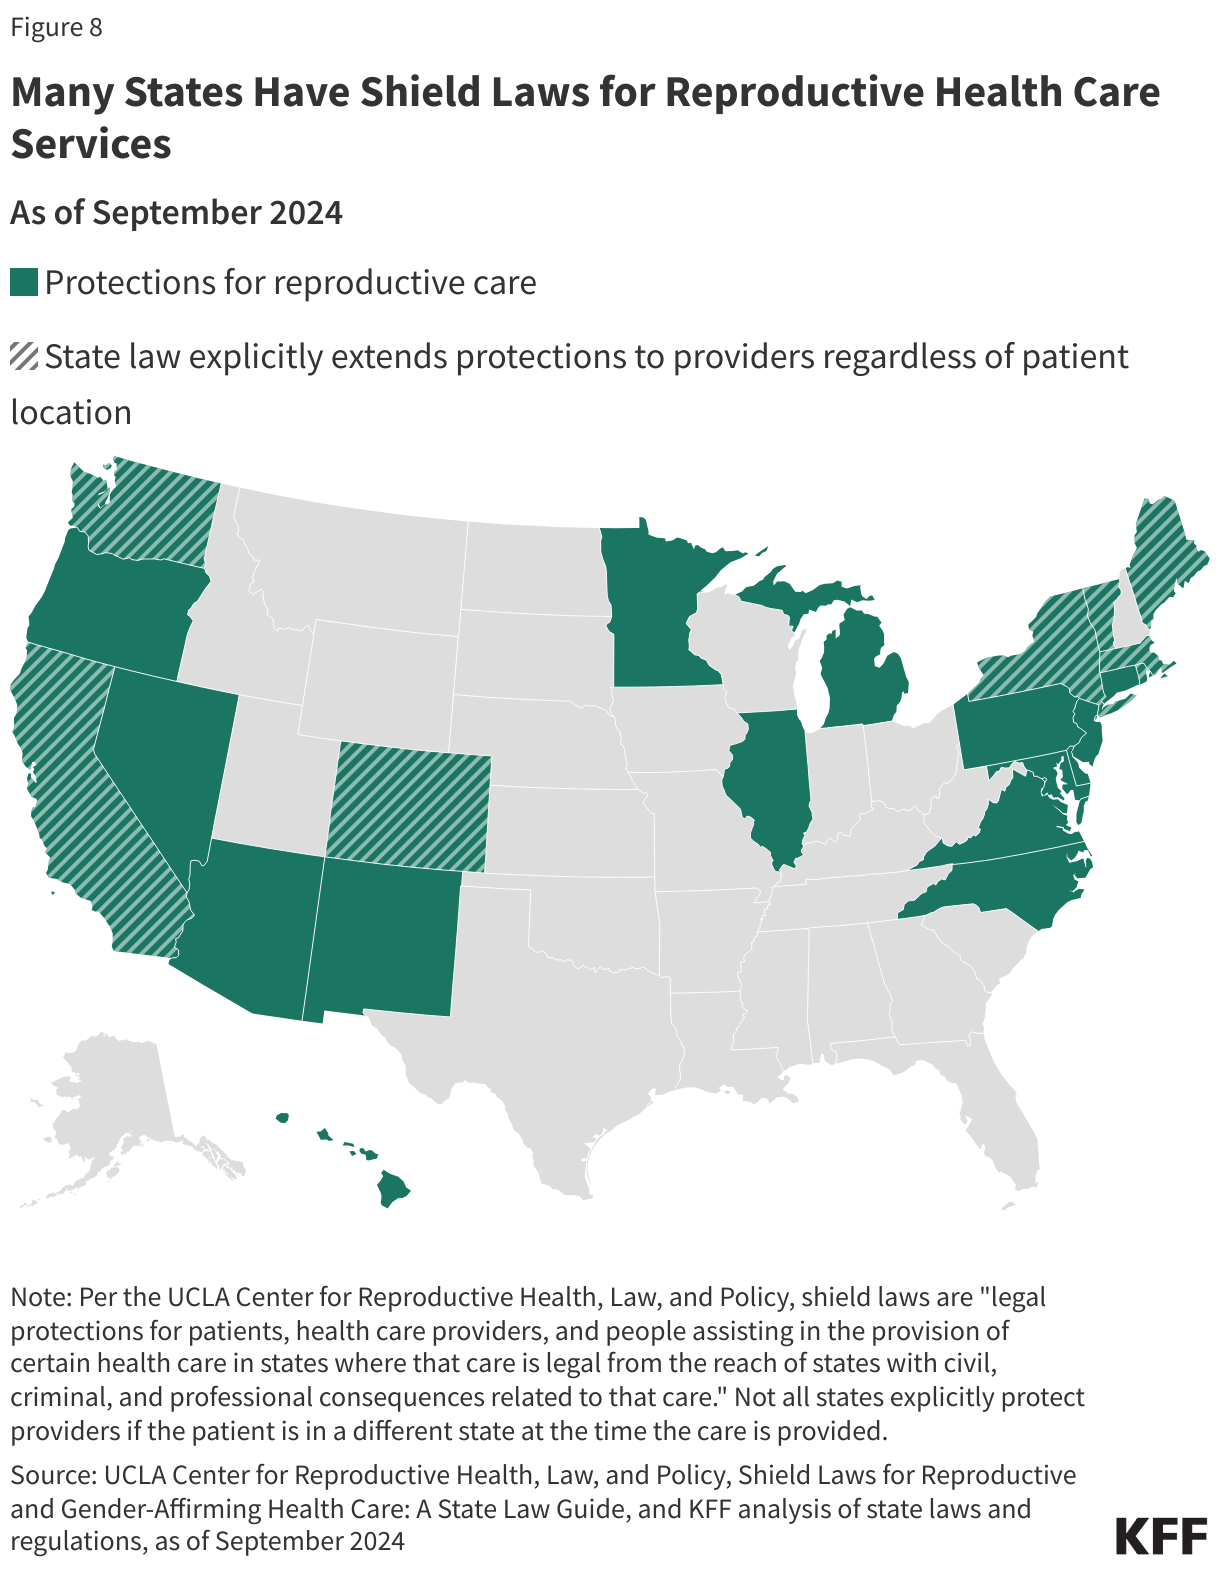
In contrast to the bans on the provision of abortion, several states have passed laws to protect and expand abortion access. Twelve (12) states require state-regulated private plans to cover abortion, many without cost-sharing, and 20 Medicaid programs use state-only funds to cover nearly all medically necessary abortions. Twenty-three (23) states passed shield laws intended to reduce the legal risks for clinicians who provide abortion care to patients who live in states where abortion is banned or restricted.
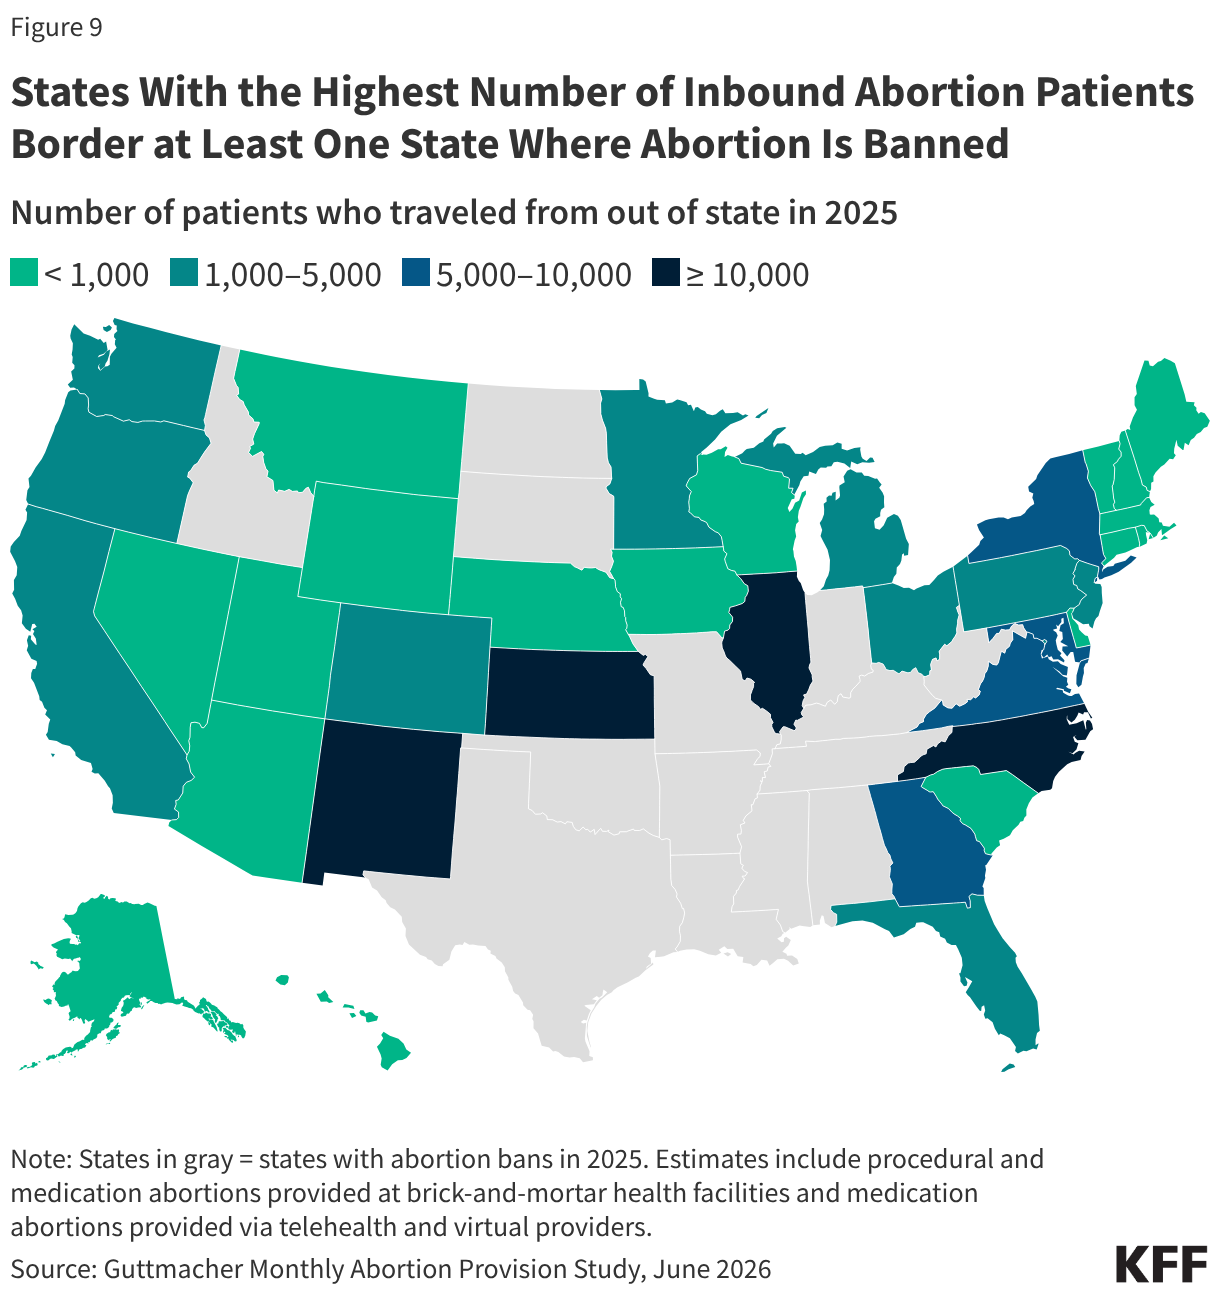
Interstate travel for abortion has also increased. The travel rate for abortion care across state lines nearly doubled from 2020 to 2024, with Illinois, North Carolina, New Mexico, and Kansas experiencing the highest volume of out-of-state abortion patients last year.
The CDC, which historically collected abortion information from most states, has not published any new abortion surveillance data since the second Trump Administration began. The most recent data was collected in 2022, the same year as the Dobbs ruling.
Following the 2022 ruling in Dobbs v. Jackson Women’s Health Organization, it was generally expected that the abortion rate would drop due to the number of states that rapidly adopted abortion bans (13 states) and early gestational restrictions (6 states). There is no doubt these policies have made abortion access much more challenging or even impossible for those seeking abortion who live in restrictive states; yet, contrary to expectations, recent data show that the volume of abortions in the U.S. overall has slightly increased in three years following the Supreme Court ruling. The combination of growth in telehealth availability for abortion care, lower telehealth costs, increased legal reproductive health care protections through state efforts, and higher rates of interstate travel, all likely contributed to the unexpected trajectory in abortion volume. However, the possibility of more state bans and restrictions combined with the ongoing legal challenges seeking to further restrict access may reverse this trend. Additionally, future actions that the Trump administration could take at the federal level could further limit abortion availability and access even in states that have enshrined the right to abortion, particularly if the administration restricts the distribution of medication abortion pills through the Comstock Act or targets the provision of telehealth abortions through regulatory revisions at the Food and Drug Administration.
This brief reviews the different sources of abortion data in the U.S., the factors that have affected abortion rates across the country before and after Dobbs, and what we may see as the Trump administration, Republican majorities in the House and Senate, and a conservative federal judiciary shape policy in the coming years.
How is abortion tracked at the state and federal level?
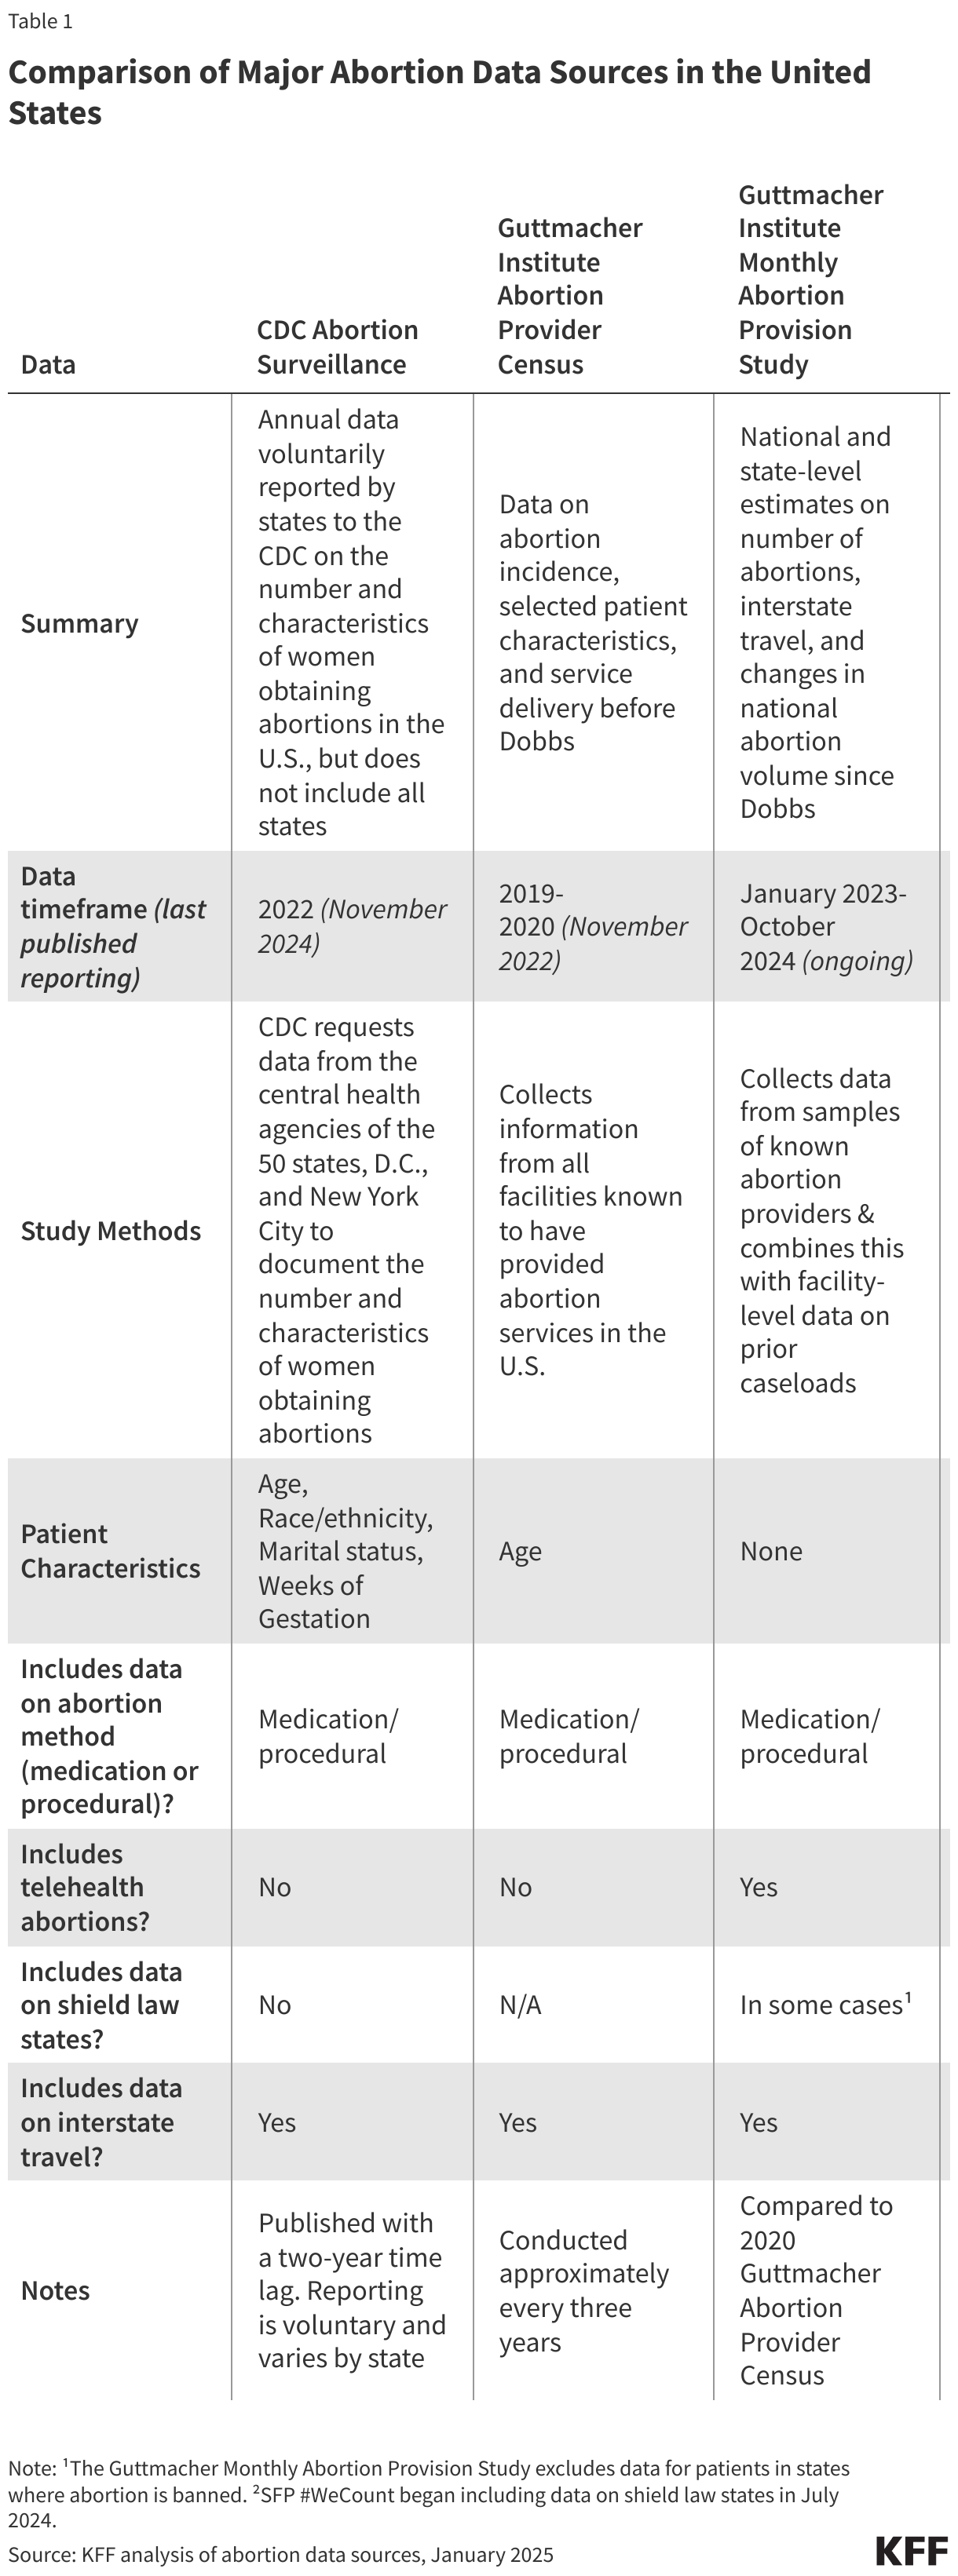
Three major organizations collect and report national and state-level data on abortion volume and rates: the federal Centers for Disease Control and Prevention (CDC), the Guttmacher Institute, and most recently, the Society of Family Planning through its (SFP) #WeCount project.
For decades, the federal CDC Abortion Surveillance System has requested data from the central health agencies of the 50 states, D.C., and New York City to document the number and characteristics of women obtaining abortions. Reporting to the CDC is voluntary and not all states participate in the surveillance system. Notably, California, Maryland, and New Hampshire have not reported data on abortions to the CDC system for years. Most states collect and report data on the demographic characteristics of patients, gestational weeks, and type of abortion procedure. CDC publishes data from the surveillance system annually, with the most recent data on abortions in 2022, reflecting a 2-year lag. Since the second Trump Administration began, the CDC has not issued any new surveillance data on abortion, and the federal staff from the agency’s Reproductive Health Division were terminated.
Prior to the Dobbs ruling, the Guttmacher Institute, an independent research and advocacy organization, periodically conducted the Abortion Provider Census (APC), collecting data on abortion incidence and abortion facilities. Data from the APC are based primarily on questionnaires completed by known facilities that provide abortion in the country, information from state health departments, and Guttmacher estimates for a small portion of facilities. The most recent APC reports data from 2020. Following the Dobbs ruling, the Guttmacher Institute established an additional data collection initiative, the Monthly Abortion Provision Study, to track abortion volume within the formal U.S. health care system. This ongoing effort collects data on and provides national and state-level estimates on abortions while also tracking the changes in national abortion volume since 2020.
While the CDC and Guttmacher APC data differ in terms of collection methods, timeframe, and completeness, both have shown similar trends in abortion rates over the past decade. One notable difference is that Guttmacher’s survey has included continuous reporting from all states, which explains at least in part the higher abortion volume in their data.
Society of Family Planning’s (SFP) #WeCount is a newer national reporting initiative that measures changes in abortion volume following the Dobbs ruling. The project provides semiannual reports on the monthly number of abortions by state and includes data on abortions provided through in-person health care settings and through telehealth. The #WeCount report started collecting data in April 2022 and has published three full years of abortion data since Dobbs.
How many abortions occurred prior to the Dobbs ruling?
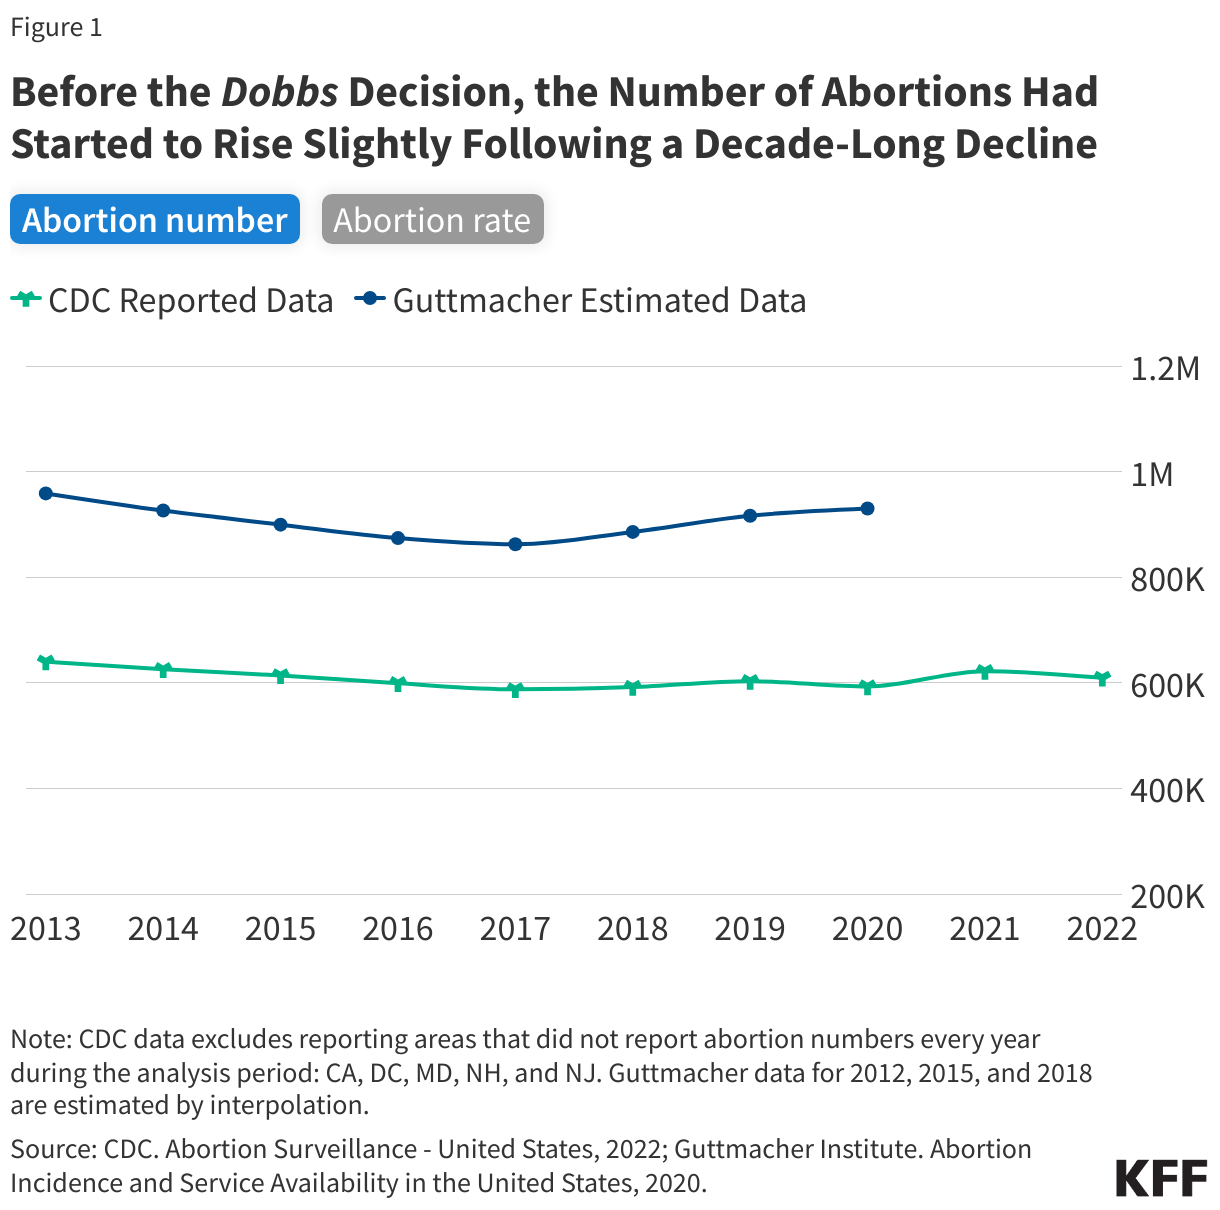
For most of the decade prior to the Dobbs ruling, there was a steady decline in abortion rates nationally, but there was a slight increase in the years just before the ruling.
The most recent CDC data are from 2022, the same year as the Dobbs decision, and show that abortion rates declined from 2013 through 2017 and remained steady in the years leading up to the court decision (Figure 1). CDC reported 609,360 abortions in 2022 and a rate of 11.2 abortions per 1,000 women (excludes CA, DC, MD, NH, and NJ). In contrast, the Guttmacher Institute reported 930,160 abortions in 2020 and a rate of 14.4 abortions per 1,000 women. Guttmacher’s study showed a slight upward trend in abortion from 2017 to 2020 whereas CDC’s report showed a stable rate in abortions from 2017 to 2022 except for a slight uptick in 2019 and 2021.
Experts generally attribute the long-term decline in abortion rates to increased use of more effective methods of contraception. The slight increase in the years leading up to the Dobbs decision could be due to greater state-level coverage of Medicaid enrollees that made abortion access more affordable in some states as well as broader financial support from abortion funds to help individuals pay for the costs of abortion care.
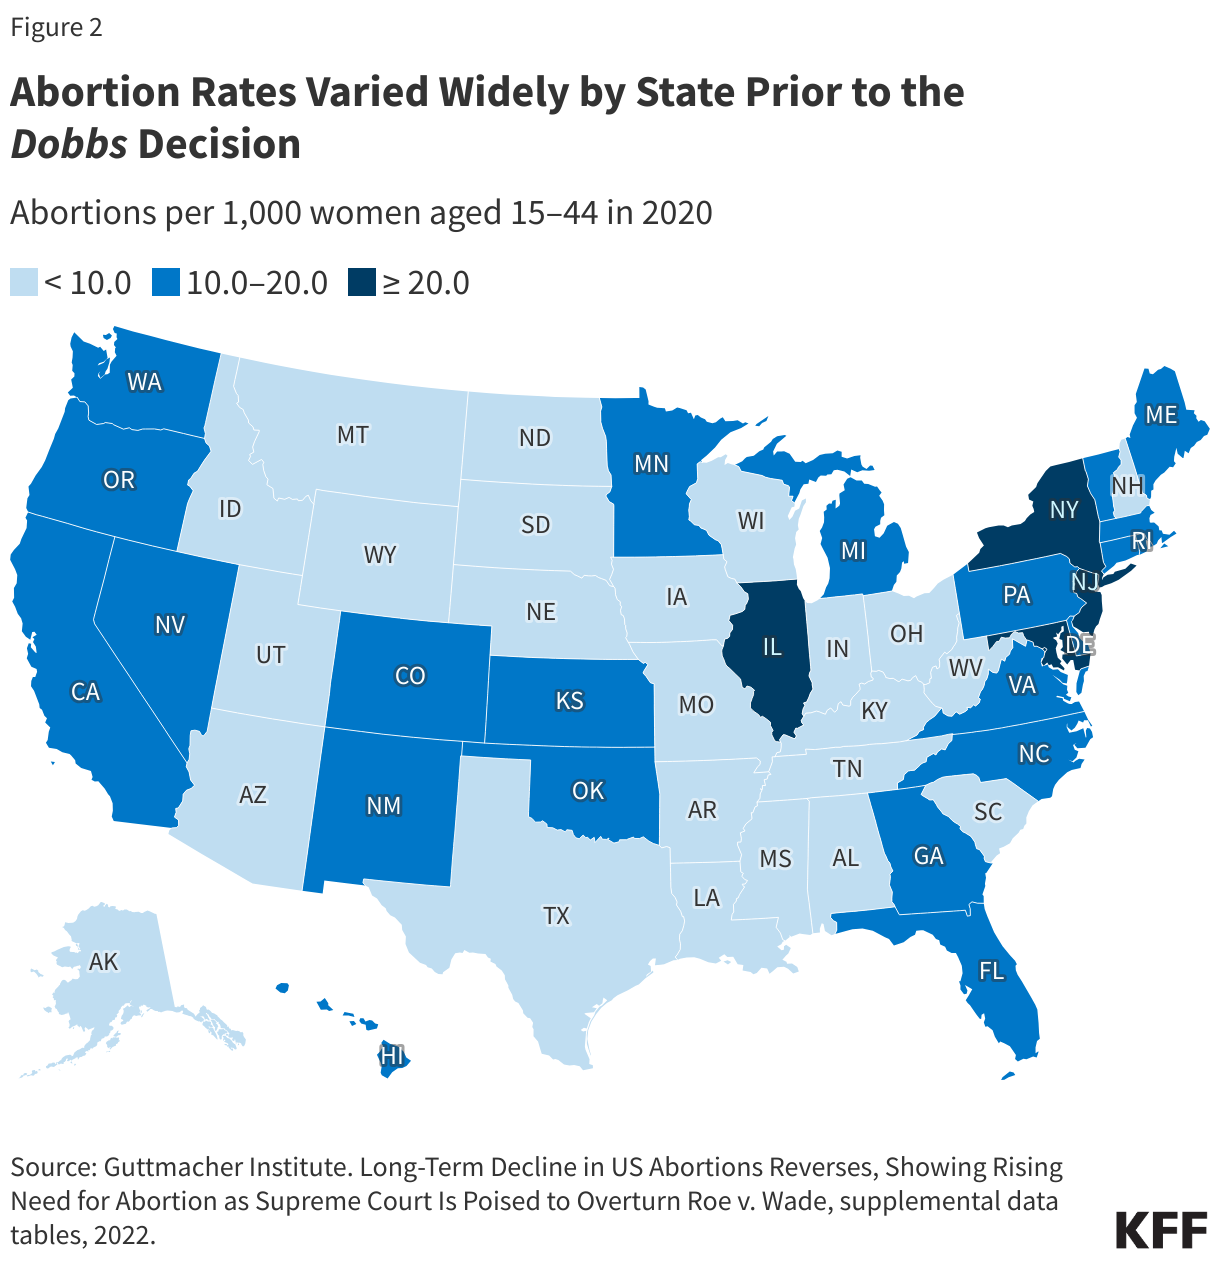
Even prior to the Dobbs ruling, abortion rates varied widely between states.
National averages can mask local and more granular differences. Some of the variation in abortion volume and rates has been due to the wide differences in state policies that have shaped the availability of abortion, with some states historically placing restrictions on abortion (such as targeted regulations of abortion providers, requirements for multiple visits, and mandatory waiting periods), that constrained abortion access and availability. In some states, there were only one or two abortion clinics even before Dobbs.
What has happened to abortion volume since Dobbs?
The SFP and Guttmacher Institute data both find that while the number of abortions in the U.S. dropped immediately following Dobbs, the total number or volume of abortions nationally has increasedthree full years following the ruling. However, the consistency observed at the national level obscures wide state-level variation and sharp declines in abortion volume in states with bans and early gestational restrictions.
The latest SFP’s #WeCount data show that there were 1.13 million abortions performed or pills distributed in 2025. There were 1.11 million abortions in 2024, slightly up from 1.05 million in 2023. The monthly average abortions steadily increased from 85,780 abortions per month in 2023 to 92,400 abortions in 2024 to 93,900 in 2025 (Figure 3).
Why did abortions increase after states instituted bans?
While it was not a total surprise that states without abortion bans had an increase in abortions following the Dobbs ruling, the reasons behind this increase are complex. The upward trend is likely due to a combination of increased interstate travel for abortion access by people coming from abortion ban states, the presence of state-level laws in states that protect providers who offer abortion services, lower costs associated with telemedicine medication abortions, and expanded virtual/telehealth capacity and the ability to mail medication abortion pills to patients from both bricks-and-mortar and telemedicine-only providers.
The Rise of Medication Abortion, Telehealth, and Virtual Clinics
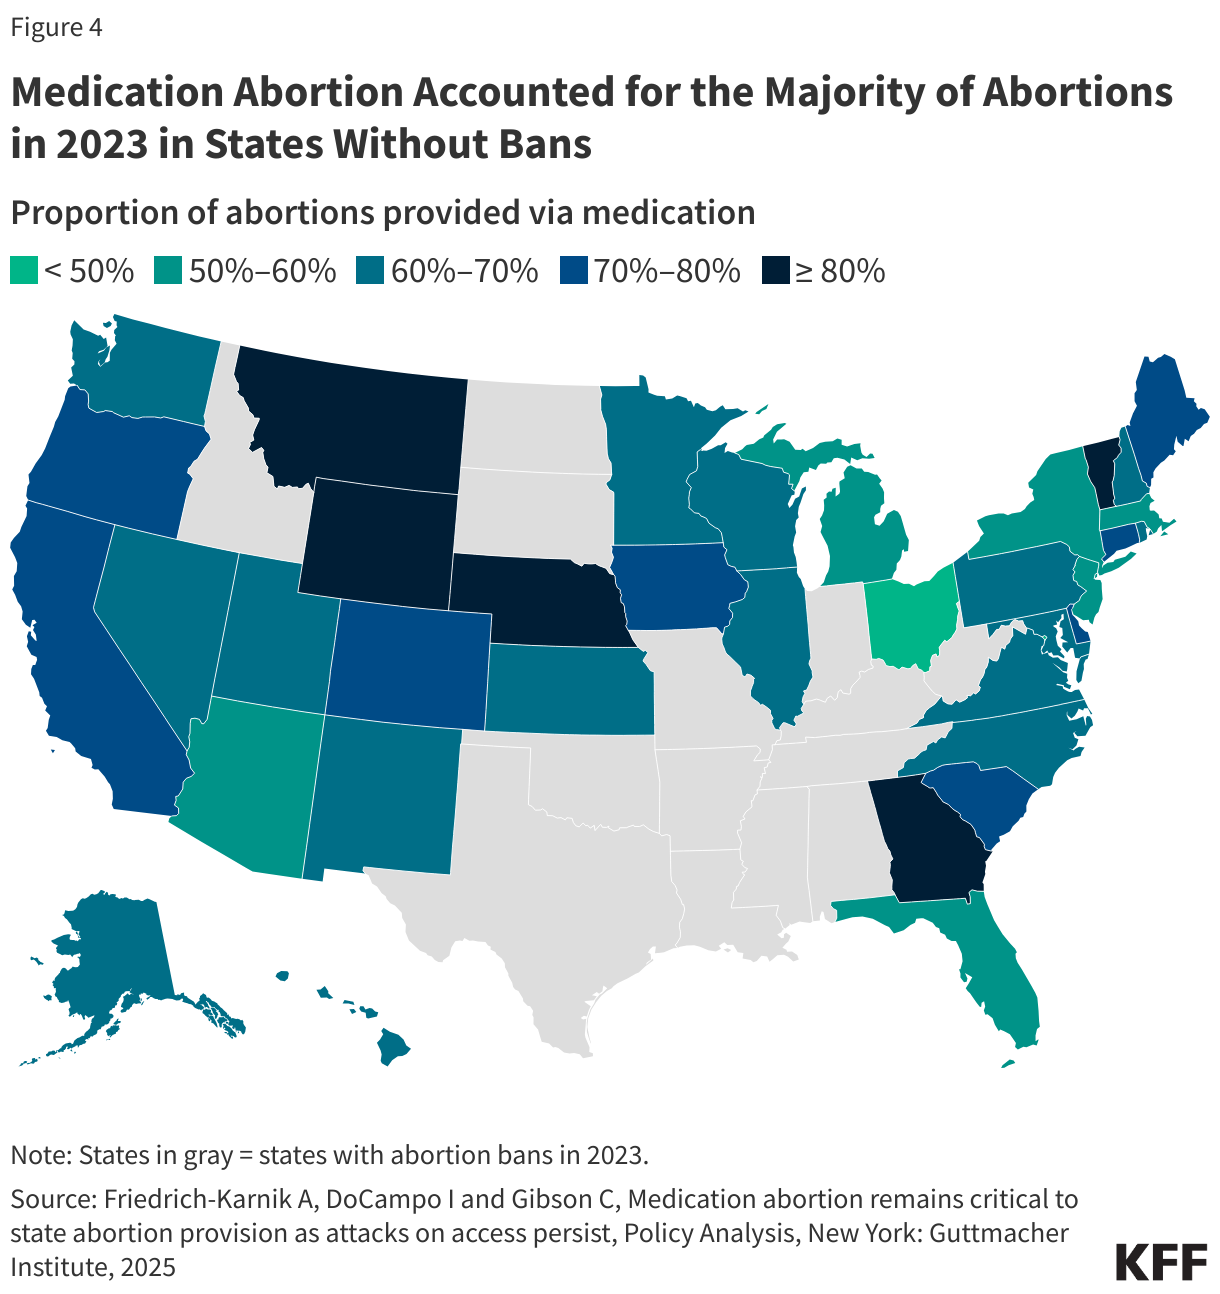
While procedural abortions are only performed in a clinical setting, medication abortion can be provided either in a clinical setting or remotely via telehealth. Medication accounts for nearly two thirds (65%) of abortions nationally. Approved by the U.S. Food and Drug Administration (FDA) in 2000, mifepristone, one of the drugs used for medication abortion, has a solid safety and effectiveness record regardless of whether the pills are dispensed in person by a clinician (either medical doctor or advanced practice clinician) or via telehealth and mailed or dispensed through a retail pharmacy. When taken, medication abortion successfully terminates the pregnancy 91.9% to 99.7% of the time, with a 0.4% risk of major complications, and an associated mortality rate of less than 0.001 percent (0.0005%). The latest Guttmacher data show that in states without bans, medication accounted for the majority of abortions in 2023 (Figure 4). In five states (MT, WY, NE, GA, and VT), more than eight in ten abortions were medication abortions.
Access to medication abortion via telehealth had been historically limited by an FDA policy (Risk Evaluation Mitigation Strategy or REMS) that had permitted only physicians in a health care setting to dispense mifepristone in person. This resulted in a restriction on the ability to mail the pills or for retail pharmacies to dispense. In December 2021, the FDA revised this policy, lifting the requirement that clinicians dispense the drug only in-person. This was done, in part, to alleviate the burden placed on the health care delivery system during the COVID-19 public health emergency. In January 2023, the FDA finalized a policy change that allows retail pharmacies to dispense medication abortion pills to patients with a prescription. These changes opened the door to greater use of telehealth for medication abortions. Subsequently, there was a rise in the number of virtual clinics, which now account for a quarter (24%) of facilities that offer medication abortion services.
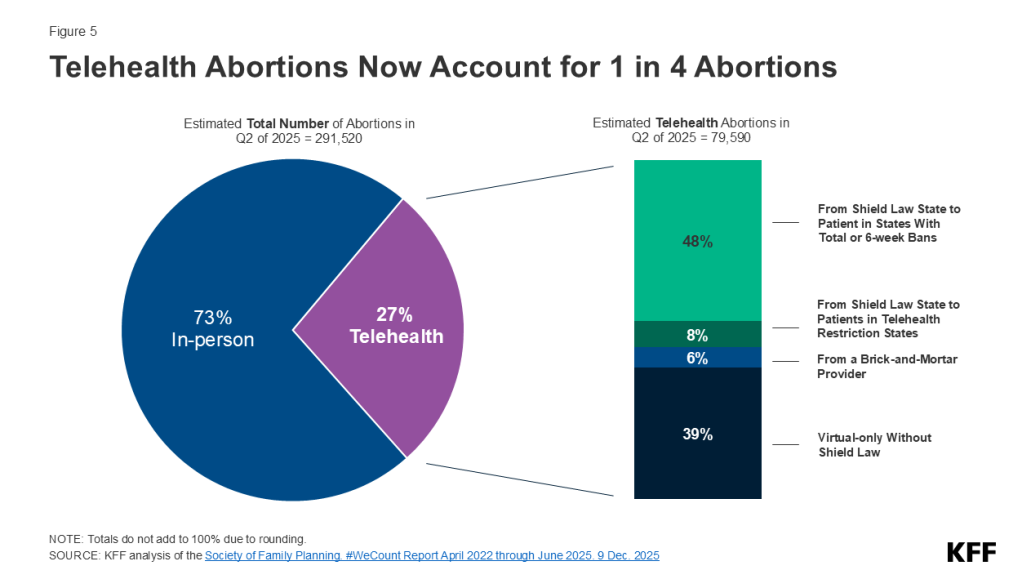
The most recent report shows that telehealth abortions accounted for 28% of all abortions in 2025(Figure 5). The #WeCount reports distinguish between telehealth abortions provided by brick-and-mortar facilities from those provided under shield laws that give some legal protections to clinicians who provide abortion care via telehealth to people living in states with bans and restrictive policies. More than half of these telehealth abortions were performed under shield laws (56%), 7% of abortions were from online services offered by clinics that traditionally operate from physical locations (brick-and-mortar facilities), and four in ten (40%) were from virtual-only clinics. The provision of telehealth abortions varies widely across states, ranging from 8% in D.C. to 44% in Nevada. Note: The counts for medication abortions, particularly those provided by mail, reflect the number of pills dispensed by providers, not necessarily complete abortions.
Costs for Telemedicine Abortions
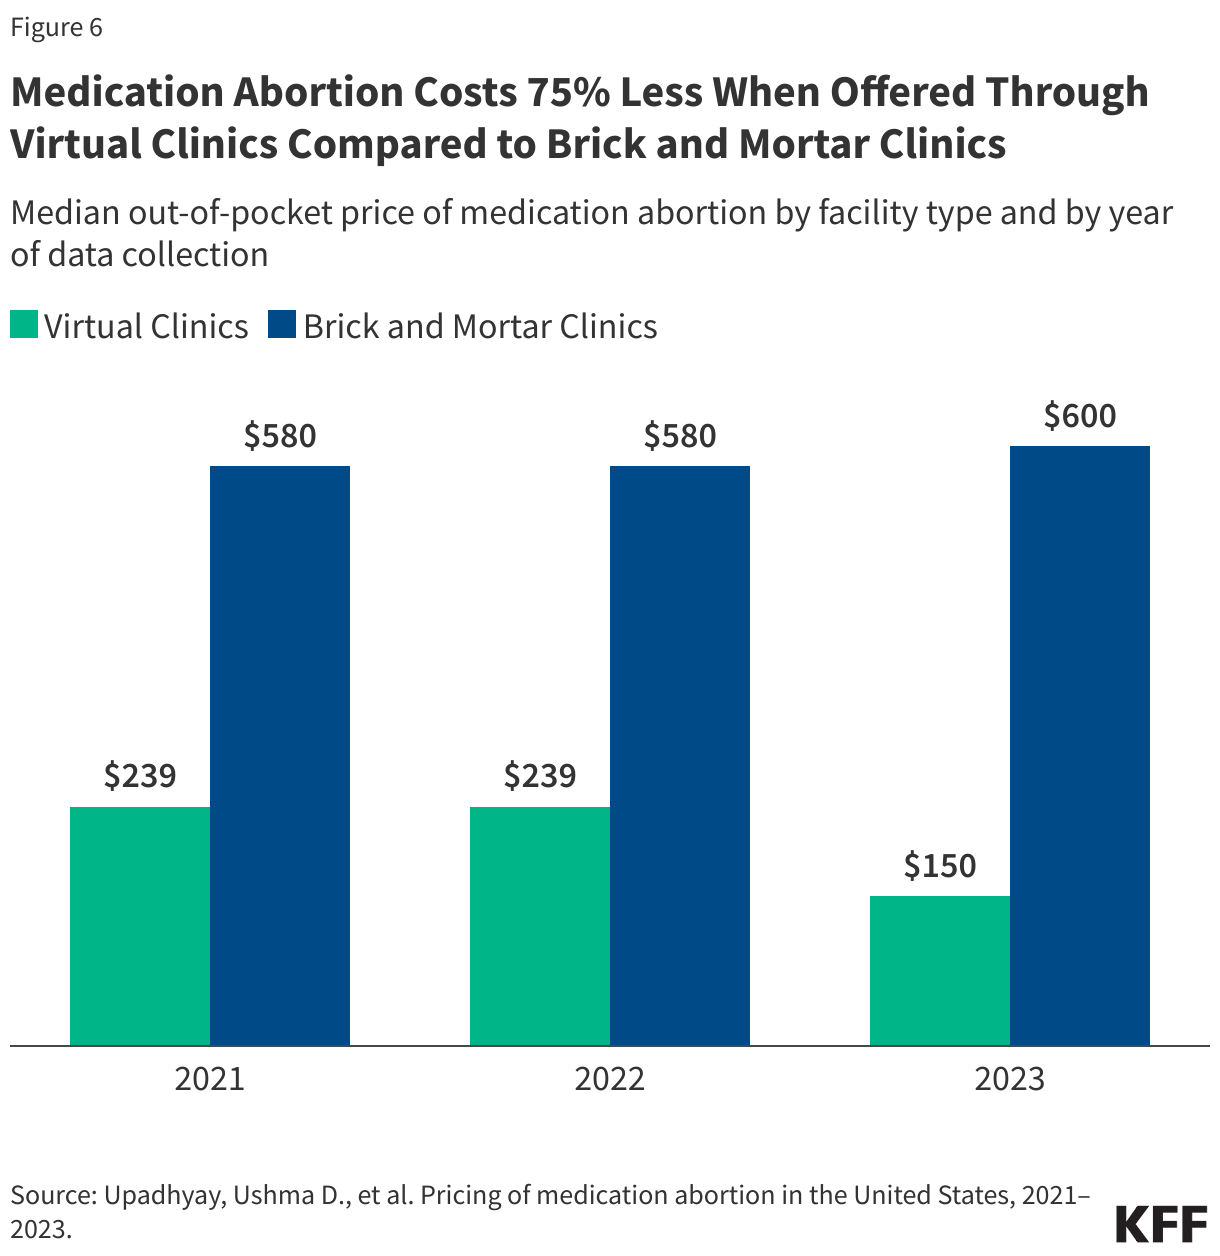
The median price of medication abortion offered through brick-and-mortar clinics increased from $580 in 2021 to $600 in 2023. In contrast, the median price of medication abortions via virtual clinics decreased from $239 in 2021 to $150 in 2023, which is 75% less than the cost of in-person care (Figure 6). Virtual clinics do not incur many of the costs of a physical clinic, such as building maintenance, meeting regulations for surgical centers, and security to handle protesters. The increased availability of telehealth and virtual clinics has lowered the costs of care and reduced financial barriers resulting from abortion services as well as travel and other related expenses.
Costs for some have also been offset by the availability of financial assistance and logistical support from national and local networks of abortion funds. Since Dobbs, these networks received a reported 39% more requests for abortion support and financially supported more than 100,000 individuals seeking abortion care.
State-Level Protections
Over the past several years, some of the states where abortion remains legal have passed laws to protect abortion access for their residents and expand access to people seeking abortions from other states. For example, residents in California are protected from civil liabilities for providing or receiving abortion services, and providers are protected from professional discipline. Policies that have been implemented include using state funds to cover abortions under Medicaid beyond federal limitations, raising Medicaid reimbursement rates for abortion services, requiring state-regulated private plans to cover abortion, and enacting shield laws to protect clinicians who provide abortions in their states either in person or via telemedicine.
Today, 12 states require state-regulated private plans to cover abortion, some without any cost-sharing (Figure 7).
State actions to use their own revenues to pay for abortions have also expanded access to abortion services. States are not restricted by the federal Hyde Amendment (which bans the use of federal funds for abortion in Medicaid, Medicare and other public programs unless the pregnancy is a result of rape, incest, or if it endangers the woman’s life) and have the option to use state-only funds to cover abortions under other circumstances for women on Medicaid, which 20 states do currently.
A growing number of states passed shield laws to reduce the legal risks for clinicians who provide abortion care to patients who live in states where abortion is banned or restricted. While the details of these laws vary state to state, some policies protect clinicians from professional discipline for offering health care that is criminalized in another state, and others protect clinicians who provide care to patients across state lines, such as by prescribing and mailing abortion pills via telehealth services to patients in their state of residence. Some states also passed broader shield laws to protect patients and people assisting with reproductive services from civil and criminal consequences. As of July 2026, 22 states and Washington D.C. have enacted shield laws, with 8 states extending explicit protections to clinicians regardless of patient location or state of residence (Figure 8).
Interstate Travel
The Guttmacher Institute Monthly Abortion Provision Study is the only data source so far to provide in-depth information on interstate travel pre- and post-Dobbs. Guttmacher estimates that prior to Dobbs, nearly one in ten people obtained an abortion by traveling across state lines in 2020. Even though abortion was legal, there were considerable restrictions in many states that made abortion access very limited, which led to the need for interstate travel for abortion care for some people. The latest data show that 142,000 patients traveled out of state for abortion care in 2025, a slight drop from 2024, but notably higher than the number of travelers in 2020 (81,000), before the Dobbs ruling. The states with the highest number of people traveling inbound for abortion care border at least one state where abortion is banned, including Illinois (32,560 patients), North Carolina (17,870 patients), Kansas (13,630 patients), and New Mexico (10,180 patients) (Figure 9).
While the data show that abortions slightly increased three years after Dobbs, ongoing and impending legal challenges, state legislative efforts, and federal executive actions could further alter the reproductive care landscape and have impacts beyond abortion counts. A recent JAMA study, for instance, found that fertility rates have increased in states with complete or 6-week abortion bans, namely among populations with the greatest structural disadvantages and barriers to obtaining abortion care. A concurrent study showed infant mortality rates have also risen in these states, many of which are already experiencing some of the worst maternal, infant, and child health outcomes in the U.S. The findings from these studies underscore the widespread repercussions of policy efforts aimed at restricting abortion access.
Episode 13, AI Series: AI is racing into everyday medicine. The rules of the road are still being written. Dr. Michelle Mello of Stanford, professor at both the Law School and the School of Medicine, and co-leader of its Healthcare Ethical Assessment Lab for AI, joins Chip to address the questions that trail every advance this series has covered: who makes the rules, who ensures the technology gets it right — and who answers when it doesn’t?
Charles N. Kahn III is a senior visiting fellow at KFF. He is also a visiting senior fellow at the American Enterprise Institute and a nonresident senior scholar at the University of Southern California’s Schaeffer Center for Health Policy & Economics. He serves as co-chair of the international Future of Health collaborative.
Professor of Law, Stanford Law School; Professor of Health Policy, Stanford University School of Medicine
Michelle Mello is a Professor of Law at Stanford Law School and Professor of Health Policy at Stanford University School of Medicine. She conducts empirical research into issues at the intersection of law, ethics, and health policy. She is the author of nearly 300 articles on artificial intelligence, medical liability and patient safety, ethical and legal issues arising in biomedical research, and other topics. She is co-director of the Healthcare Ethical Assessment Lab for Artificial Intelligence (HEAL-AI) at Stanford University, which conducts ethical assessments of AI tools proposed for deployment at Stanford Health Care facilities. Mello holds a Ph.D. in Health Policy and Administration in addition to a law degree.
This weekly podcast features insightful conversations between host Chip Kahn and his guests, who discuss the business of health care, connecting the dots between the health care business, policy, and patients.
The podcast’s first series on AI in health care illuminates how AI is changing health care, and features guests who are deploying this technology, managing its consequences, and designing policy around it.
Editorial Note: The Policy Actions tracker will no longer be updated as the data source has ceased tracking government responses to COVID-19. For more information, please visit the Oxford Covid-19 Government Response Tracker.
Section:
0/0
Cases and Deaths
This tracker provides the cumulative number of confirmed COVID-19 cases and deaths, as well as the rate of daily COVID-19 cases and deaths by country, income, region, and globally. It will be updated weekly, as new data are released. As of March 7, 2023, all data on COVID-19 cases and deaths are drawn from the World Health Organization’s (WHO) Coronavirus (COVID-19) Dashboard. Prior to March 7, 2023, this tracker relied on data provided by the Johns Hopkins University (JHU) Coronavirus Resource Center’s COVID-19 Map, which ended on March 10, 2023. Please see the Methods tab for more detailed information on data sources and notes. To prevent slow load times, the tracker only contains data from the last 200 days. However, the full data set can be downloaded from our GitHub page. While the tracker provides the most recent data available, there is a two-week lag in the data reporting.
Note: The data in this tool were corrected on March 18, 2024, to clarify that they represent new cases and deaths over a full week rather than the average per day over a seven-day period.
Policy Actions
This tracker contains information on policy measures currently in place to address the COVID-19 pandemic. Policy categories currently being tracked include social distancing & closure measures, economic measures, and health systems measures. Policies are tracked at the country-, income-, and region-level. Please see the Methods tab for more detailed information on data sources and notes.
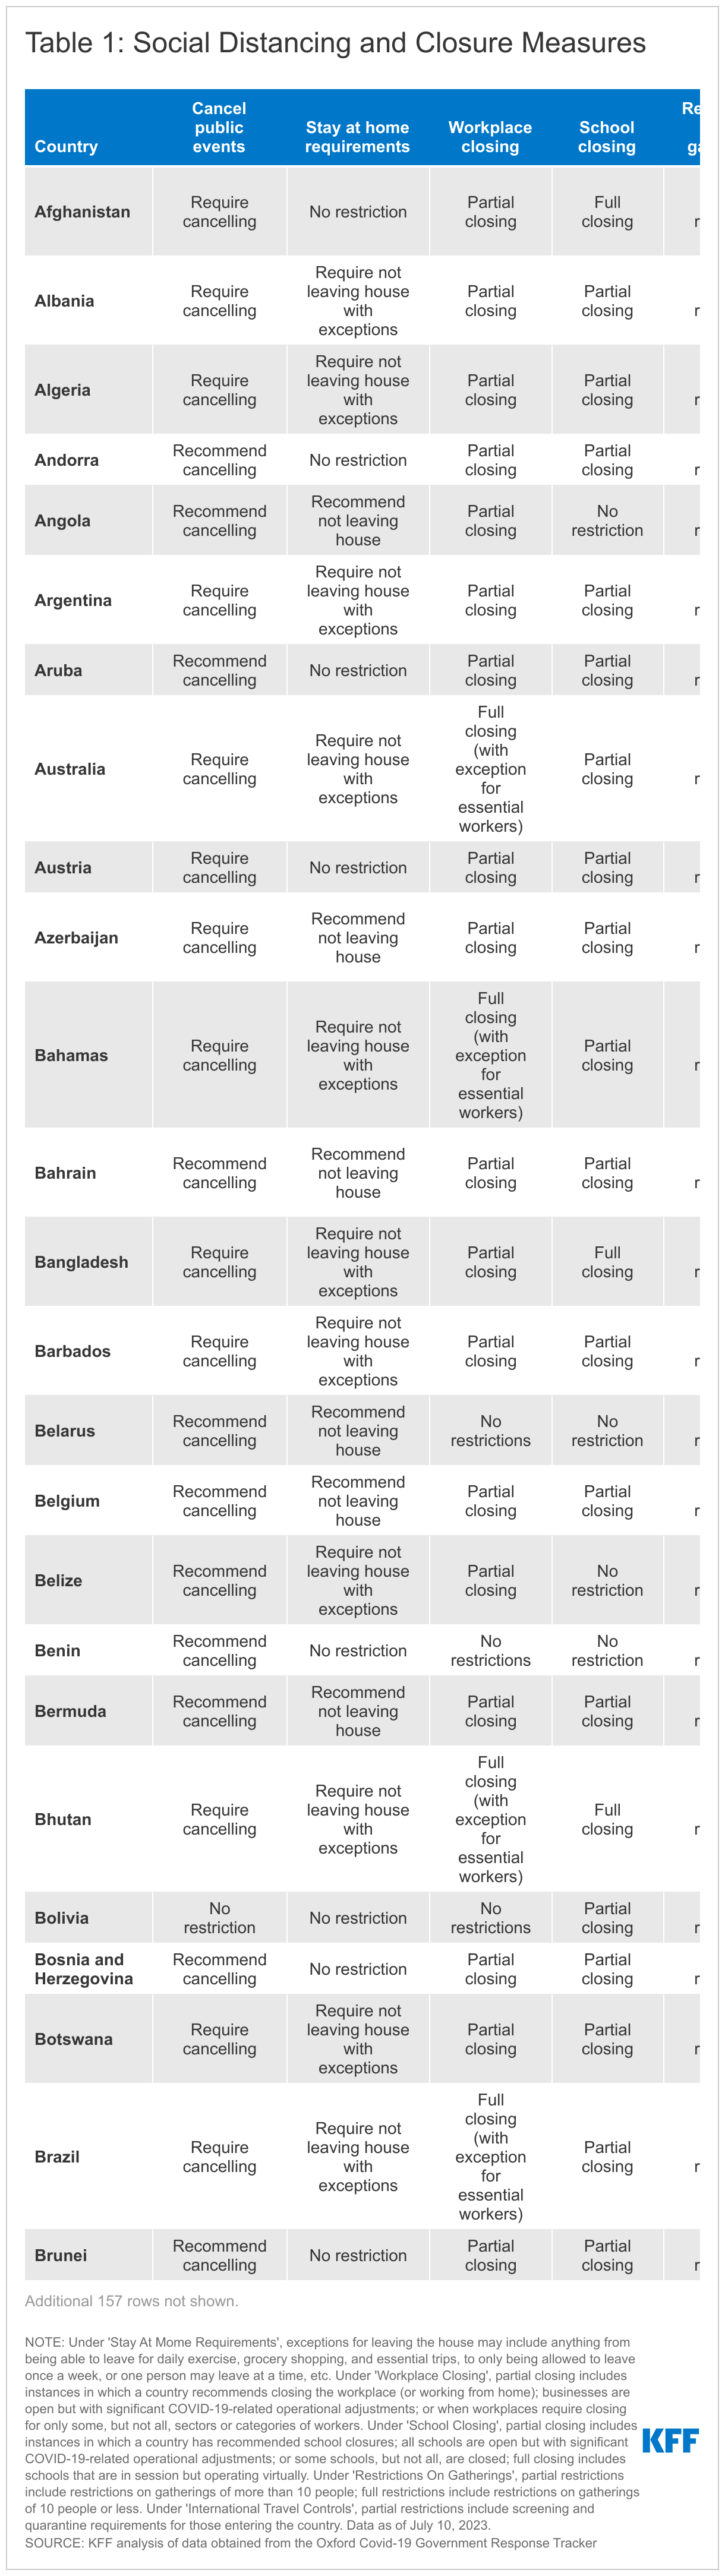
Social Distancing and Closure Measures
As countries continue to implement policies to prevent the transmission of SARS-CoV-2, the virus that causes COVID-19, these tables and charts show which social distancing and closure measures are currently in place by country.
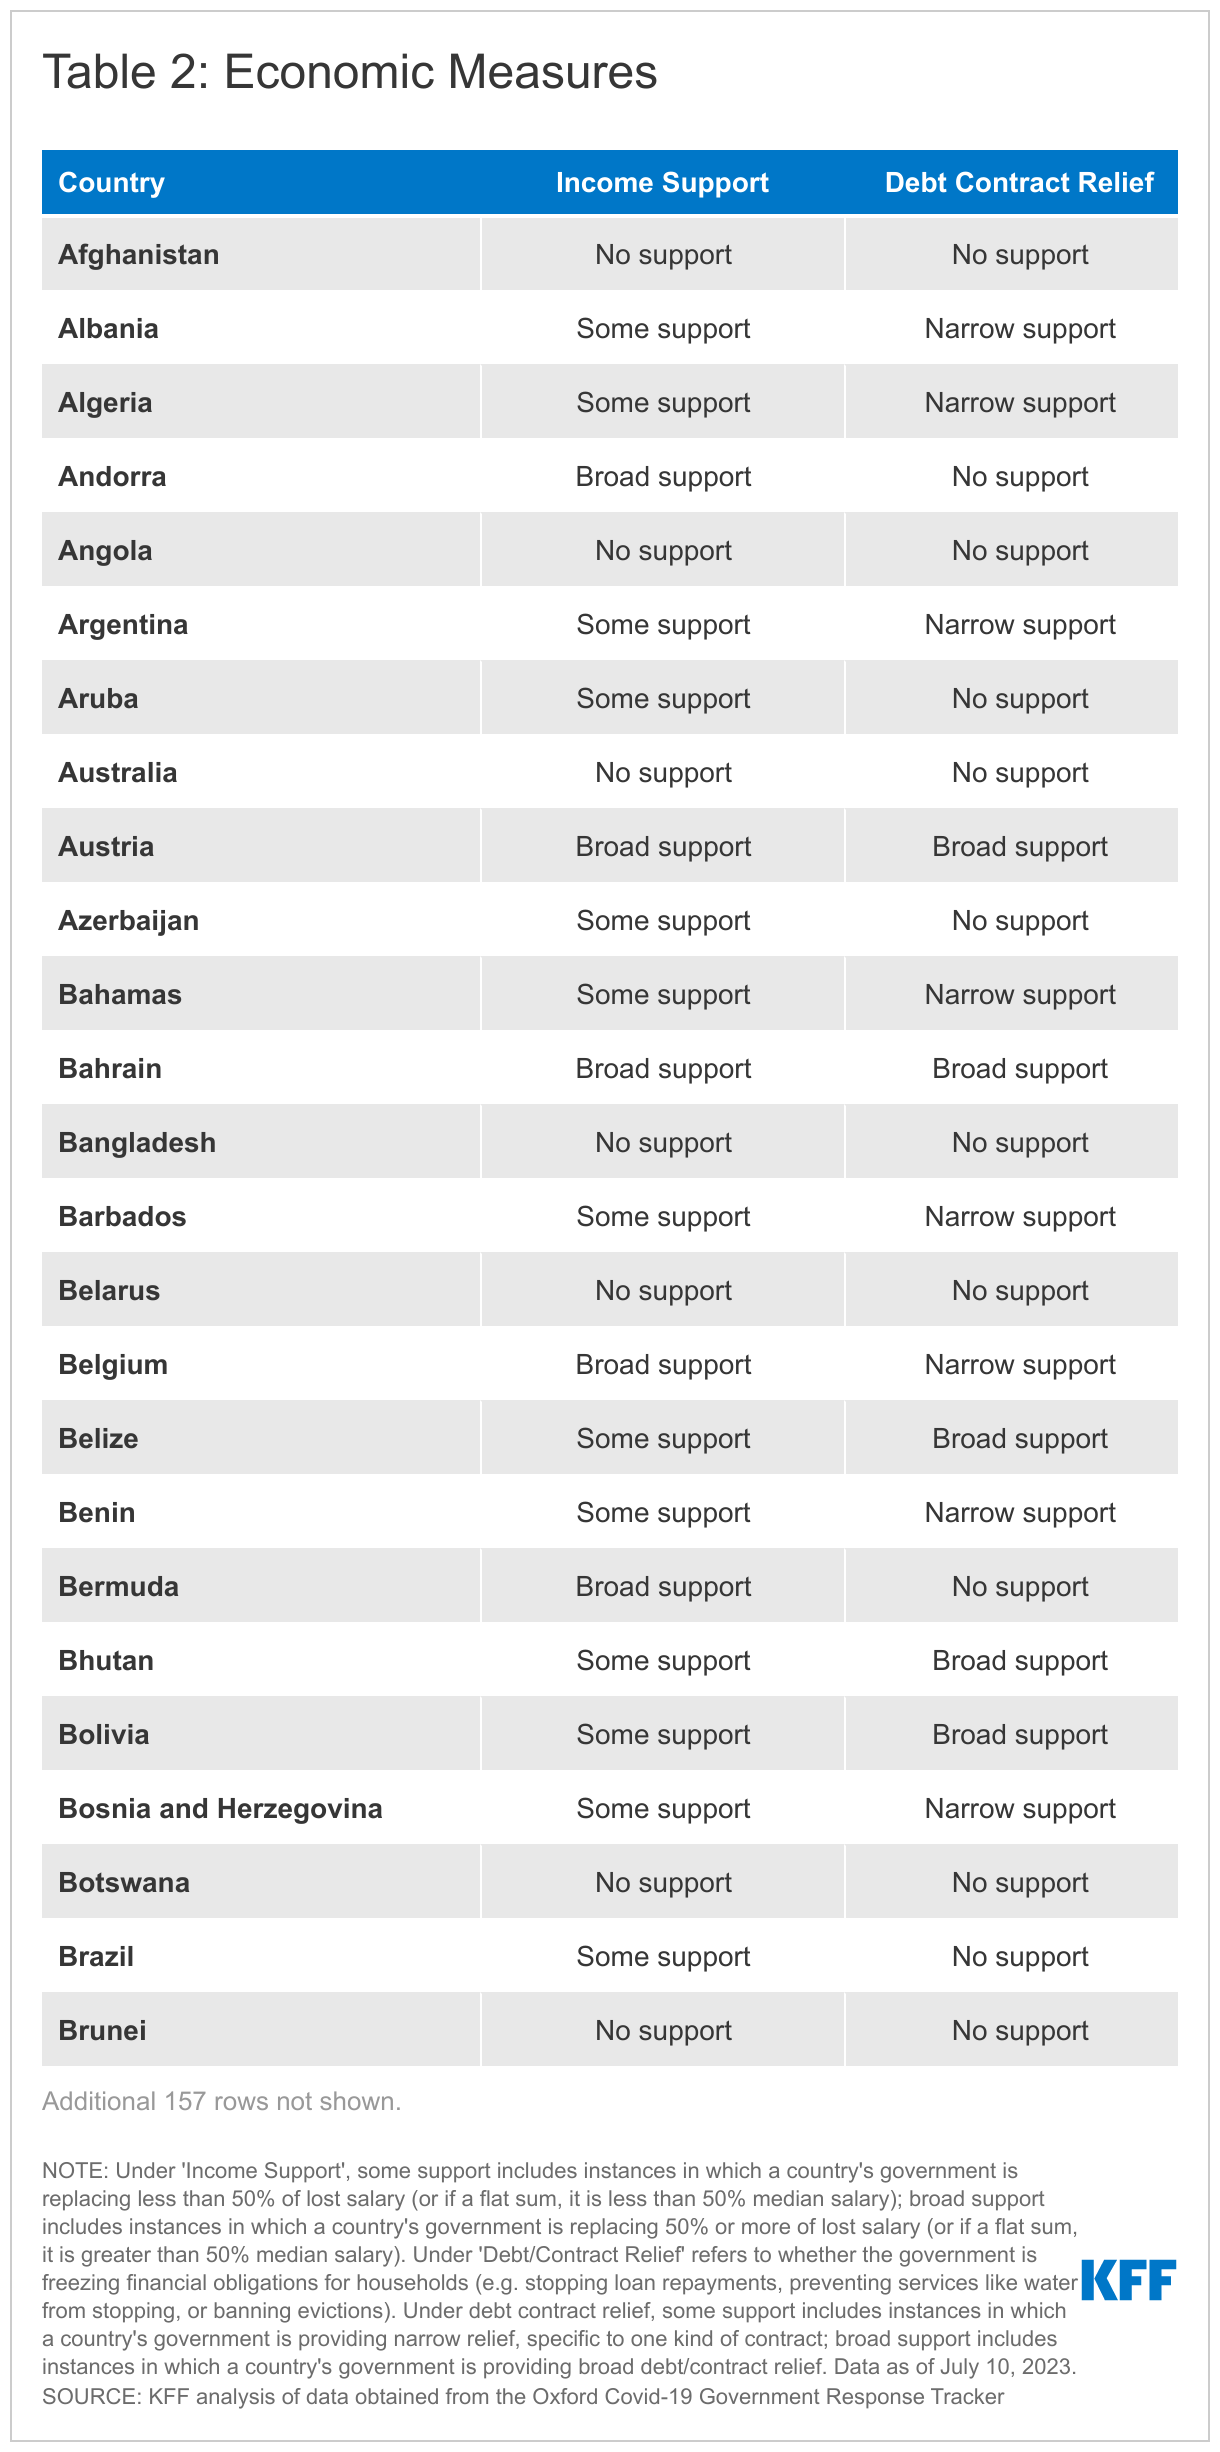
Economic Measures
The COVID-19 pandemic has placed an unprecedented strain on country economies. These tables and charts show which economic-related measures, namely income support and debt relief, are currently in place by country.
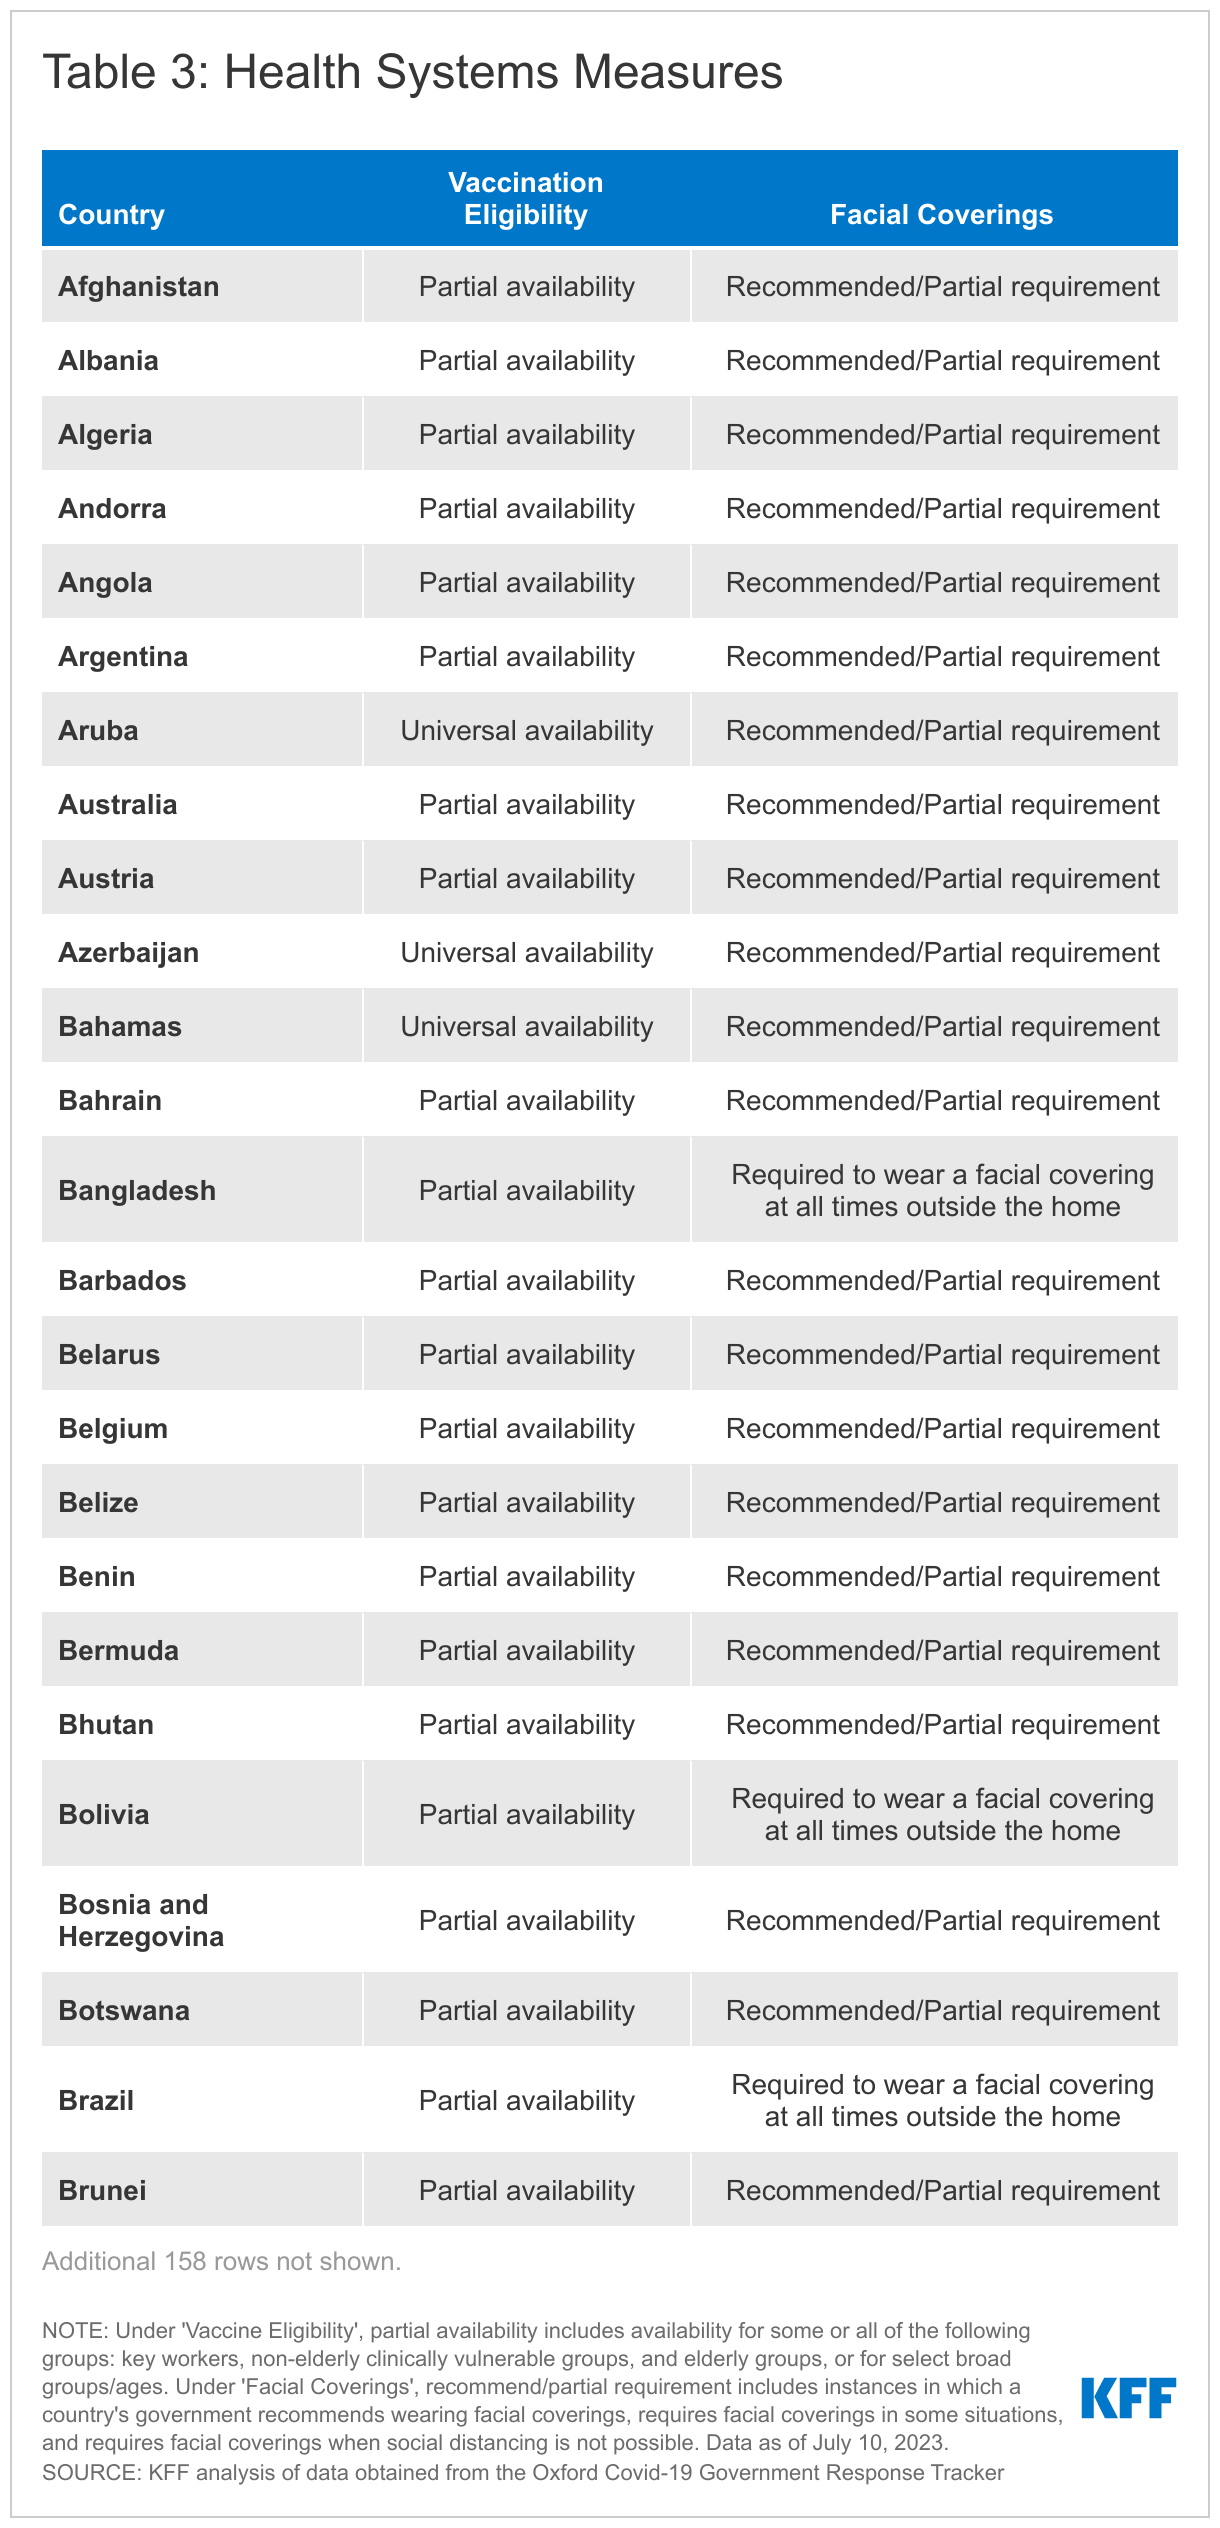
Health Systems Measures
The COVID-19 pandemic continues to strain and disrupt global health systems. These tables and charts show which health systems measures are currently in place by country.
Policy actions data include the measure that was in place for each indicator at the country-level as of the end of 2022. Policy actions data will no longer be updated as the data source has ceased tracking government responses to COVID-19. For more information, please visit the Oxford Covid-19 Government Response Tracker.
Social Distancing and Closure Measures
Under 'Stay At Home Requirements', exceptions for leaving the house may include anything from being able to leave for daily exercise, grocery shopping, and essential trips, to only being allowed to leave once a week, or one person may leave at a time, etc. Under 'Workplace Closing', partial closing includes instances in which a country recommends closing the workplace (or working from home); businesses are open but with significant COVID-19-related operational adjustments; or when workplaces require closing for only some, but not all, sectors or categories of workers. Under 'School Closing', partial closing includes instances in which a country has recommended school closures; all schools are open but with significant COVID-19-related operational adjustments; or some schools, but not all, are closed; full closing includes schools that are in session but operating virtually. Under 'Restrictions On Gatherings', partial restrictions include restrictions on gatherings of more than 10 people; full restrictions include restrictions on gatherings of 10 people or less. Under 'International Travel Controls', partial restrictions include screening and quarantine requirements for those entering the country. Values for ‘Cancel Public Events’ were not recodified.
Economic Measures
Under 'Income Support', narrow support includes instances in which a country's government is replacing less than 50% of lost salary (or if a flat sum, it is less than 50% median salary); broad support includes instances in which a country's government is replacing 50% or more of lost salary (or if a flat sum, it is greater than 50% median salary). Under 'Debt/Contract Relief', narrow support includes instances in which a country's government is providing narrow relief, such as relief specific to one kind of contract.
Health Systems Measures
Under 'Vaccine Eligibility', partial availability includes availability for some or all of the following groups: key workers, non-elderly clinically vulnerable groups, and elderly groups, or for select broad groups/ages. Under 'Facial Coverings', recommend/partial requirement includes instances in which a country's government recommends wearing facial coverings, requires facial coverings in some situations, and requires facial coverings when social distancing is not possible.
The U.S. supports global health programs in over 80 countries, with additional countries reached through its regional efforts and contributions to multilateral organizations.1 In each partner country, U.S. programs often operate in multiple program or health areas, which may include: the President’s Emergency Plan for AIDS Relief (PEPFAR), Tuberculosis (TB), the President’s Malaria Initiative (PMI), Family Planning and Reproductive Health (FP/RH), Maternal and Child Health (MCH), Nutrition, and Global Health Security.2 This tracker provides an overview of U.S. bilateral global health programs by country and region through:
a map of U.S. bilateral global health programs by country (Figure 1);
a list of countries where the U.S. operates bilateral global health programs by program area (Table 1); and
a summary of the number of countries reached by region and program area (Table 2).
The tracker currently reflects FY 2024 data3 and will be updated periodically. See also the KFF tracker for U.S. global health country-level funding.
Number of countries represents countries that received obligated funding directly from the U.S. government as reported on ForeignAssistance.gov; additional countries may be reached through “regional” and “worldwide” programming. ↩︎
The U.S. also operates programs targeting Neglected Tropical Diseases (NTDs) and other general global health programs, but these data are not disaggregated at the country level; as such, these programs are included in the tracker as “Other.” ↩︎
Reflects U.S. global health programs by country and region as identified in FY 2024 obligations funding data, the most recent year available of complete data, from ForeignAssistance.gov for all global health programs. See also KFF’s U.S. Global Health Country-Level Funding Tracker for more details on historical appropriated/planned, obligated, and disbursed funding by country, region, and income. ↩︎
State and Federal Reproductive Rights and Abortion Litigation Tracker
Last updated on
The Supreme Court’s Dobbs ruling, overturning Roe v. Wade, returned the decision to restrict or protect abortion to states. In many states, abortion providers and advocates are challenging state abortion bans contending that the bans violate the state constitution or another state law. Additionally, new questions have arisen regarding the intersection of federal and state authority when it impacts access to abortion and contraception.
This litigation tracker presents up-to-date information on the ongoing litigation in state and federal courts involving access to contraception and abortion. Use the buttons below to navigate between cases related to: Pregnancy and Work, Emergency Care, Family Planning, Privacy, Medication Abortion, Minors Access, and State Abortion Bans.
Why Do We Hear More About High Drug Prices Than About Hospital Prices?
In this JAMA Health Forum post, KFF’s Larry Levitt outlines four reasons why high drug prices are in the spotlight more than hospital prices, even though hospitals accounted for 40% of the growth in national health spending from 2022 to 2024, and explores the potential for policy action to restrain them.