Poll Finding

Most Hispanic Immigrants Say Their Lives Are Better In The U.S. But Face Financial And Health Care Challenges: The 2023 KFF/LA Times Survey of Immigrants

Authors: Shannon Schumacher, Liz Hamel, Samantha Artiga, Drishti Pillai, Audrey Kearney, Marley Presiado, Ana Gonzalez-Barrera, and Mollyann Brodie
Published: Jan 18, 2024

Findings

Note: This content was updated on February 14, 2024 to correct the description of how states were classified in terms of expansiveness of coverage for immigrants.

Executive Summary

Hispanic immigrants comprise the largest share of the immigrant population in the U.S., and about a third of Hispanic or Latino adults in the U.S. are immigrants. This report provides an in-depth look at the varied experiences of Hispanic immigrants living in the U.S. and highlights the unique challenges many face, as Hispanic immigrants are more likely than other immigrant groups to have limited English proficiency (LEP), be noncitizens, have lower household incomes, be uninsured, and have lower levels of educational attainment. This report details how these factors affect the experiences of Hispanic immigrants, including at work, in their communities, and in accessing health care and other services.

Despite these challenges, this report also highlights the resiliency and optimism of the Hispanic immigrant population. It reveals that, regardless of their current economic situation, most Hispanic immigrants report a higher quality of life in the U.S. than in their countries of birth and believe their children’s lives will be better than their own. Most Hispanic immigrants are working, one in four of whom report being self-employed or a small business owner, and many provide financial support to family in their countries of birth even when their own incomes are limited. Moreover, while many face challenges, circumstances vary across Hispanic immigrants, with those who are higher income and who have a green card, valid visa or citizenship faring better across many measures. However, some difficulties, such as unfair treatment in the workplace, are shared across Hispanic immigrants regardless of income or immigration status. Enhanced understanding of Hispanic immigrant experiences not only provides insight into the diversity of the population but can also help focus initiatives, policies, and resources to help address the challenges they face.  (For a shortened, Spanish-language version of this report, click here.)

This report is based on The Survey of Immigrants, conducted by KFF in partnership with the Los Angeles Times during Spring 2023, the largest and most representative survey of immigrants living in the U.S. to date. With its sample size of 3,358 immigrant adults, including 1,207 Hispanic immigrant adults, the survey provides a deep understanding of immigrant experiences, reflecting their varied countries of origin and histories, citizenship and immigration statuses, racial and ethnic identities, and social and economic circumstances. KFF also conducted focus groups with immigrants from an array of backgrounds, which expand upon information from the survey (see Methodology for more details). Other reports from this survey include an overview report, a health and health care experiences report, a report on politics and policy and a report examining Asian immigrant experiences.

Key Takeaways

A majority of Hispanic immigrants in the U.S. are from Mexico, are long-term U.S. residents, and are employed; yet they face significant socioeconomic challenges. Hispanic immigrants include people born in Mexico (53%), Central America (17%), South America (16%) as well as smaller shares from other regions and countries.1  Three in four (77%) Hispanic immigrants have been in the U.S. for ten years or longer and two-thirds (67%) are employed, yet a majority live in lower income households (less than $40,000 per year). Two-thirds of Hispanic immigrants have limited English proficiency (LEP) and a similar share have a high school education or less. A majority (56%) are noncitizens, including one in four who are likely undocumented.

Like immigrants overall, most Hispanic immigrants came to the U.S. for better opportunities and most feel they are better off as a result of immigrating, with those from Central America especially likely to cite safety as a key benefit. About eight in ten Hispanic immigrants say they are better off compared to their own parents, and two thirds say they think their children’s lives will be even better, with particularly high levels of optimism for their children’s future among noncitizens and those from Central America.

Most Hispanic immigrants are employed, yet many face unfair treatment in the workplace even among those who are citizens, are English proficient, and have at least a college degree. Two-thirds (67%) of Hispanic immigrants are working, mainly in hourly jobs. Despite high rates of employment, most have annual household incomes under $40,000 leading to challenges affording basic needs. Among working Hispanic immigrants, at least half (55%) report experiencing discrimination in the workplace. Even among those who are citizens (45%), are English proficient (41%), and who have at least a college degree (52%), substantial shares say they experience mistreatment at work because they are an immigrant.

Among the two-thirds of Hispanic immigrants who have limited English proficiency (LEP), most report experiencing language-related challenges. A majority (58%) of those with LEP say that difficulty speaking or understanding English has made it hard for them to access key services or get a job. Hispanic immigrants with LEP also report higher rates of workplace discrimination and difficulty understanding U.S. immigration laws compared to those who are English proficient.

Substantial shares of Hispanic immigrants, particularly those who are likely undocumented, say they lack sufficient information about U.S. immigration laws and policies, worry that they or a family member could be detained or deported, and have confusion about rules related to the use of public programs that help pay food, housing, or health care. About eight in ten (79%) Hispanic immigrants, rising to nine in ten of those who are undocumented, are uncertain whether use of public programs that help pay for health care, housing or food can decrease one’s chances for green card approval or incorrectly believe this to be the case. Four in ten Hispanic immigrants, including three-fourths of those who are likely undocumented, worry that they or a family member could be detained or deported.

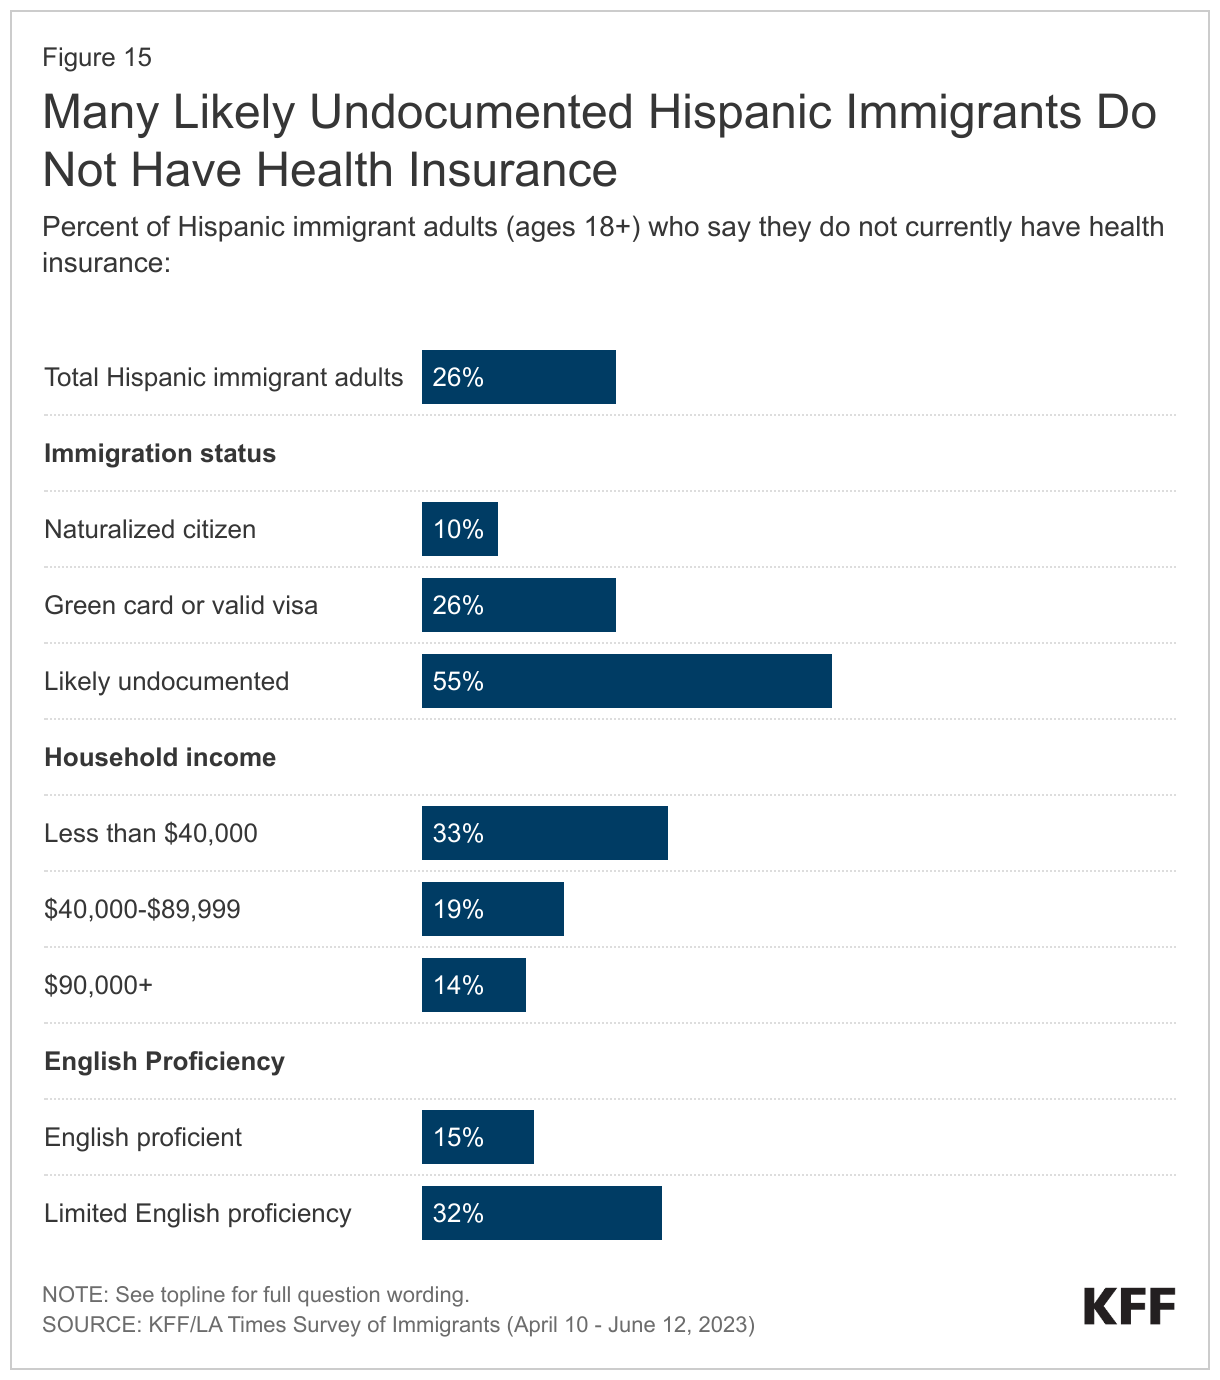
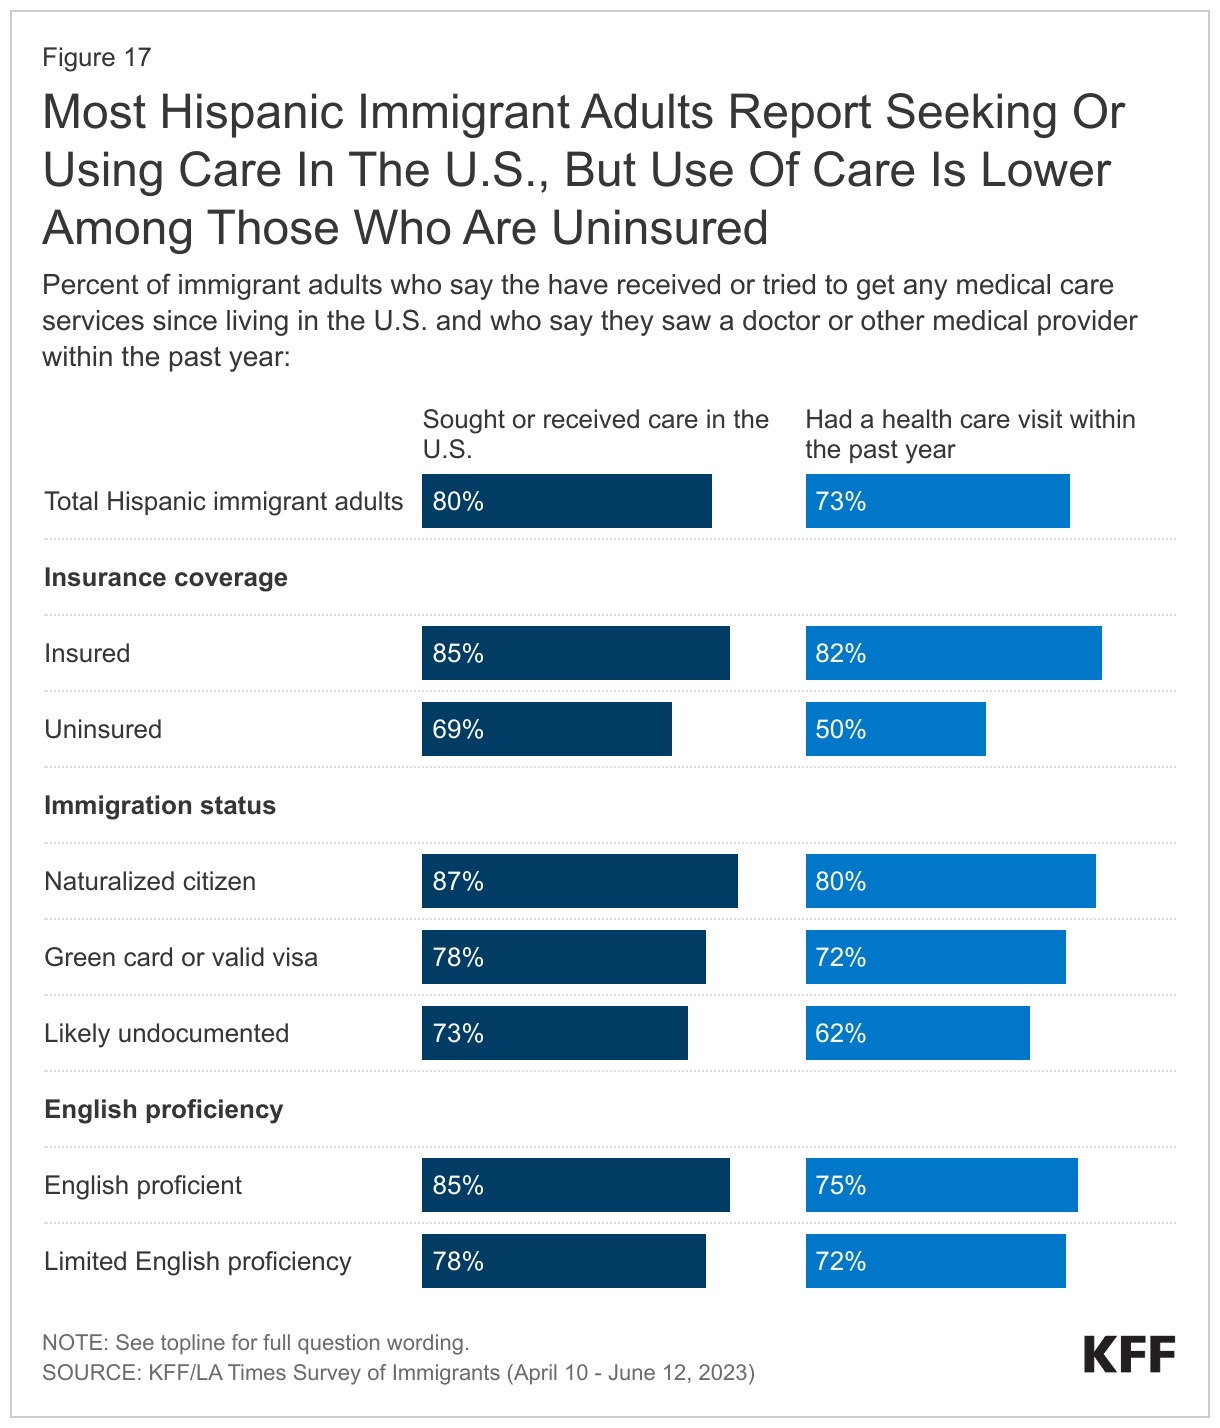
Hispanic immigrants, particularly those who are uninsured, face many challenges when it comes to accessing health care. Overall, one in four (26%) Hispanic immigrants are uninsured, but this share rises to over half (55%) among those who are likely undocumented, compared to 26% of those with a green card or valid visa and one in ten (10%) of those who are citizens. While most Hispanic immigrants have sought and recently received care in the U.S., those who are uninsured are much less likely than those with coverage to have utilized care, with just half (50%) of uninsured Hispanic immigrants having a health care visit in the past year compared with over eight in ten (82%) of those with coverage. Uninsured Hispanic immigrants also are less likely than their insured counterparts to have a usual source of care and a trusted provider and are much more likely to report skipping or postponing care in the past year.

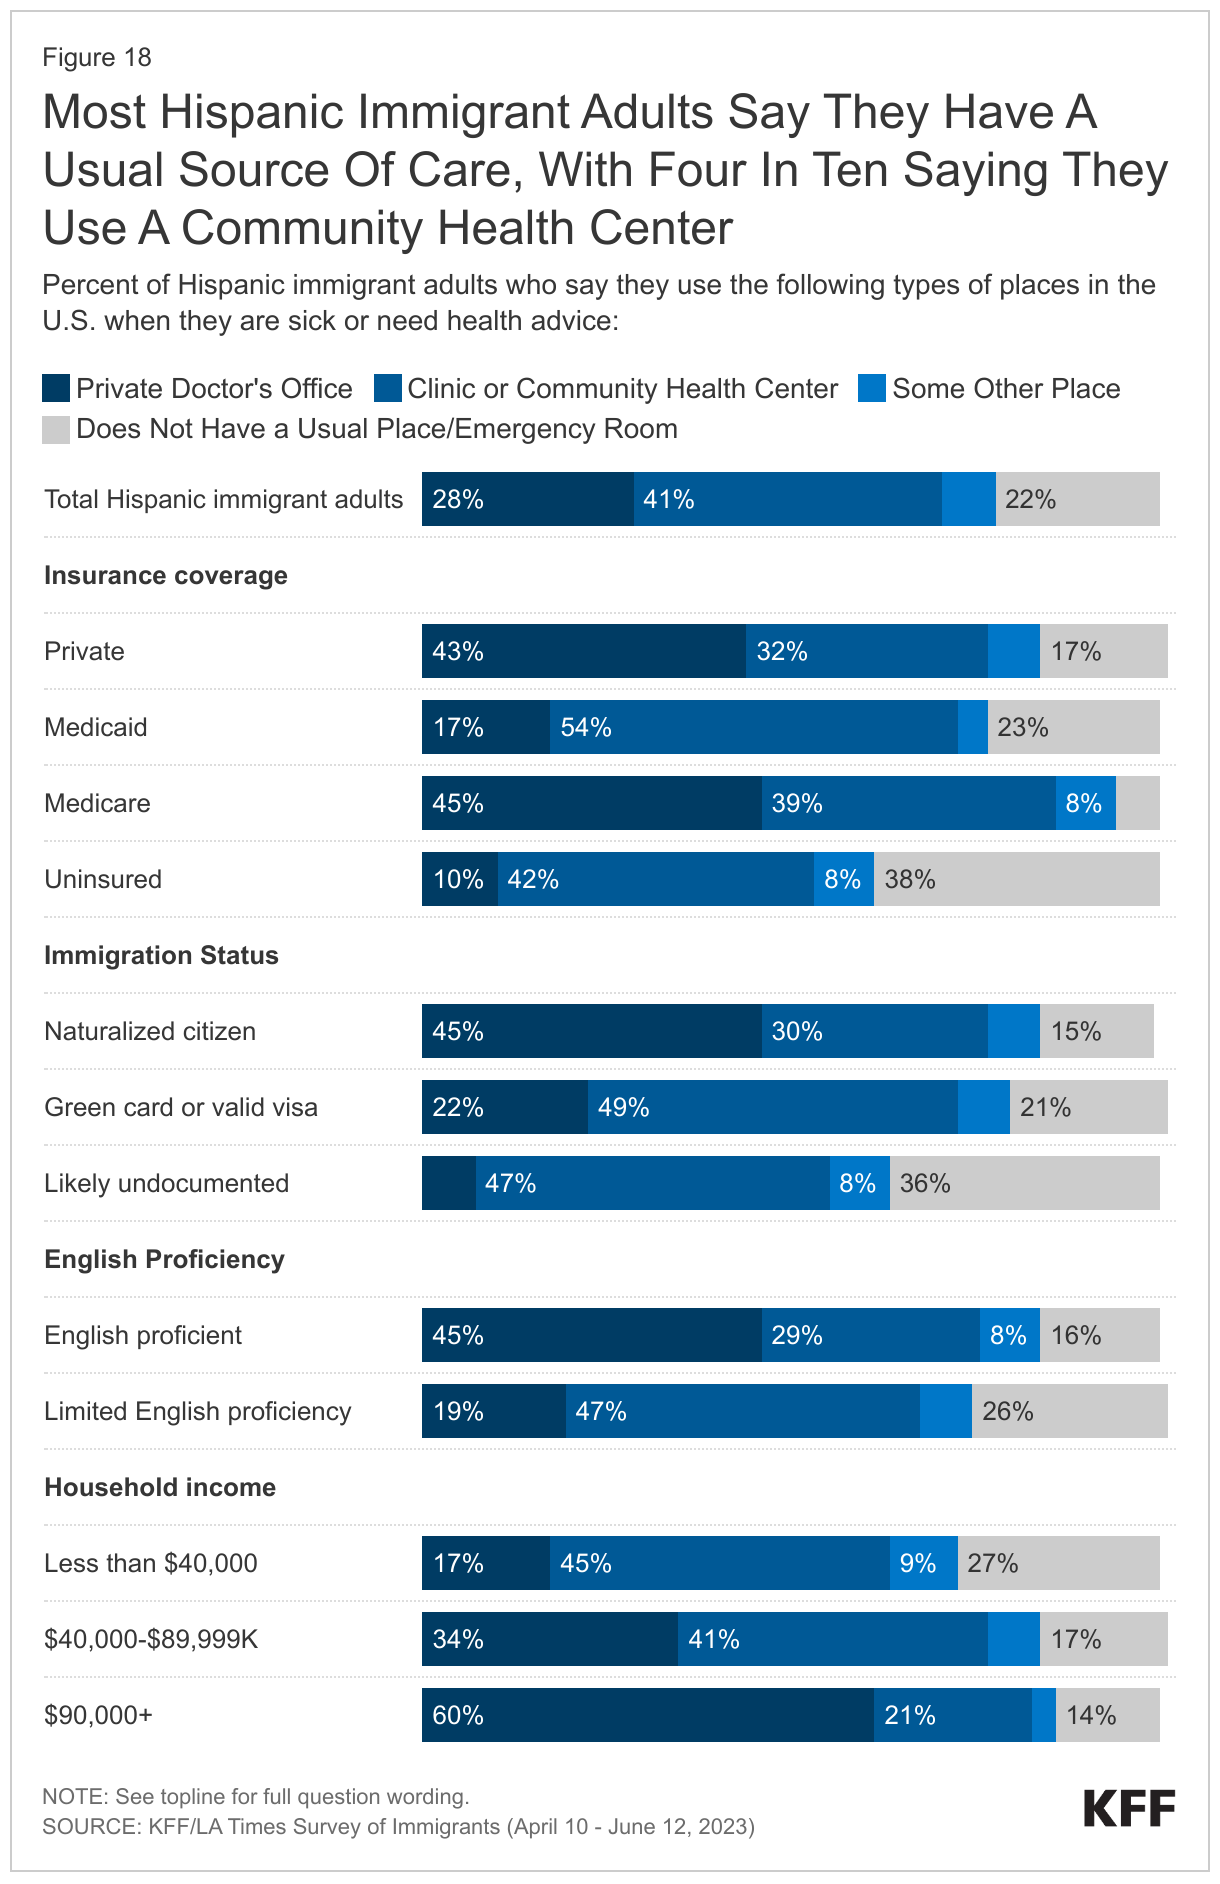
Community health centers (CHC) are the predominant place Hispanic immigrants usually go to when they are sick or need health advice and facilitate access to care for those who are uninsured. Overall, four ten (41%) of Hispanic immigrants say a CHC is their usual source of care, with substantial shares using CHCs across insurance types, immigration status, and English proficiency. CHCs are a national network of safety-net primary care providers serving low-income and medically underserved communities

Who Are Hispanic Immigrants?

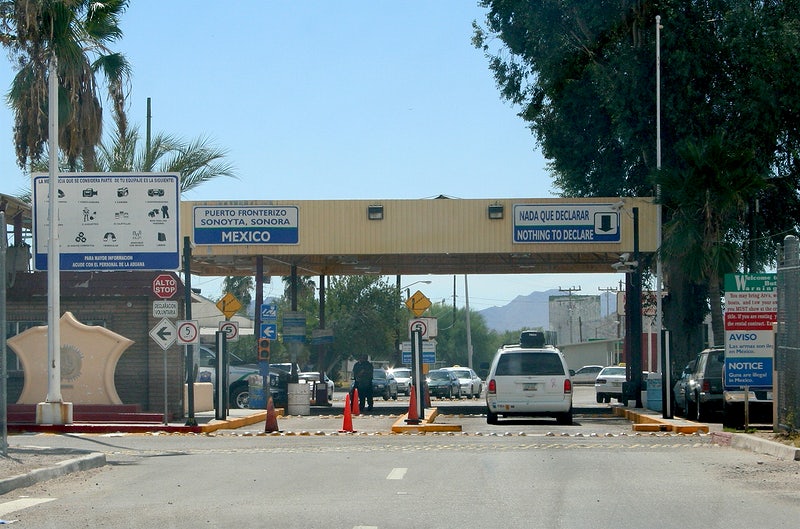
Country/Region of Origin: About half (53%) of Hispanic immigrants in the U.S. are from Mexico, while about one in six are from Central America (17%) or South America (16%). Smaller shares are from either Cuba (6%) the Caribbean (6%), or other regions. See Appendix Table 2 for a list of regional groupings.

Census Region: Most Hispanic immigrants live in either the South (42%) or West (35%), while fewer live in the Northeast (15%) or Midwest (9%). More than half of Hispanic immigrants live in one of three U.S. states: California (25%), Texas (18%), or Florida (12%).

Time in country: Most Hispanic immigrants are long-term U.S. residents. About three in four (77%) have lived in the U.S. for ten years or longer, about one in ten (12%) have been in the U.S.  between 5 and 9 years, while one in ten (8%) have been in the U.S. for fewer than five years. The share of Hispanic immigrants who arrived in the past 5 years is higher among immigrants from South America (16%), Central America (11%) than among those from Mexico (4%)

Employment and pay: Similar to the overall immigrant population, two-thirds (67%) of Hispanic immigrants are currently employed for pay, including three-quarters (75%) of those ages 18-64. About one in four (27%) employed Hispanic immigrants are self-employed or the owner of a business.

Parental Status: About four in ten (39%) Hispanic immigrants are the parent of a child under 18 living in their household, and the vast majority (86%) of this group say at least one of their children was born in the U.S.

English Proficiency: About two-thirds of Hispanic immigrants have limited English proficiency (LEP, defined as speaking English less than very well), including about one in ten (13%) who report they do not speak English at all. About one in three Hispanic immigrants say they speak English very well, including one in ten (11%) who speak English exclusively. The vast majority (86%) of Hispanic immigrants say they speak Spanish at home.

Immigration Status: About four in ten (43%) Hispanic immigrants are naturalized U.S. citizens, about three in ten (31%) say they have a valid visa or green card, and one in four (25%) are likely undocumented. In this report, immigrants who said they are not a U.S. citizen and do not currently have a green card (lawful permanent status) or a valid work or student visa are classified as “likely undocumented” since they have not affirmatively identified themselves as undocumented. Among Hispanic immigrants who are likely undocumented, most are from Mexico (61%), one in four are from Central America (25%), about one in ten (11%) are from South America, while very few (2%) are from the Caribbean. Overall, Hispanic immigrants account for about eight in ten (78%) of the likely undocumented immigrant population living in the U.S.

Household Income: A majority (56%) of Hispanic immigrants have annual household incomes of less than $40,000. Fewer live in middle income (28% in $40K-$89,999) or higher income (13% in $90,000+) households.

Education: About two-thirds of Hispanic immigrants have a high school education or less, including one in three (36%) who did not graduate high school. About one in six Hispanic immigrants have completed some college (18%) while a similar share has a college degree or higher (16%).

Reasons For Coming And Life In The U.S.

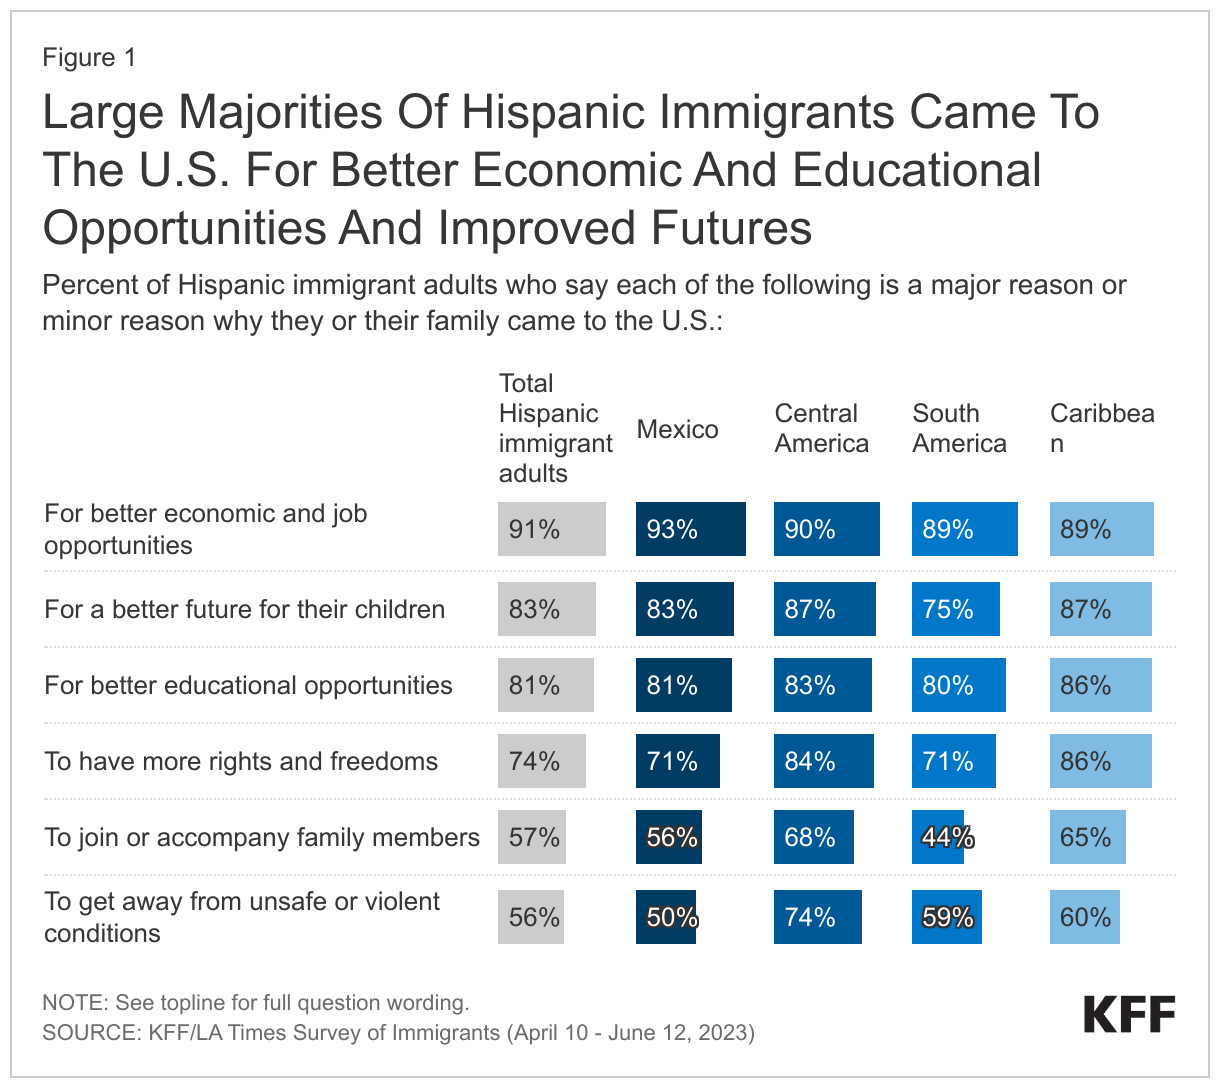
Like immigrants overall, a majority of Hispanic immigrants say they came to the U.S. for better economic and job opportunities (91%), a better future for their children (83%), and for better educational opportunities (81%), with many from Central America also citing more rights and freedoms and escaping unsafe or violent conditions as reasons. Hispanic immigrants from Central America stand out compared to Hispanic immigrants from Mexico and South America as having larger shares who say they came to the U.S. for more rights and freedoms (84%), to escape unsafe or violent conditions (74%), and to join or accompany family members (68%). Larger shares of Hispanic immigrants from the Caribbean also say having more rights and freedoms (86%) and to join or accompany family members (65%) were reasons for coming to the U.S.

Large Majorities Of Hispanic Immigrants Came To The U.S. For Better Economic And Educational Opportunities And Improved Futures

About eight in ten Hispanic immigrants say they have a better quality of life in the U.S., and Central American Hispanic immigrants are particularly likely to say their safety is improved as a result of coming to the U.S. Most Hispanic immigrants say they are better off than in the country of their birth when it comes to their educational opportunities (85%), their financial situation (82%), their employment situation (81%), and their safety (81%). About nine in ten Central American Hispanic immigrants (88%) say their safety has improved as a result of moving to the U.S., reflecting their reasons for coming to the U.S.

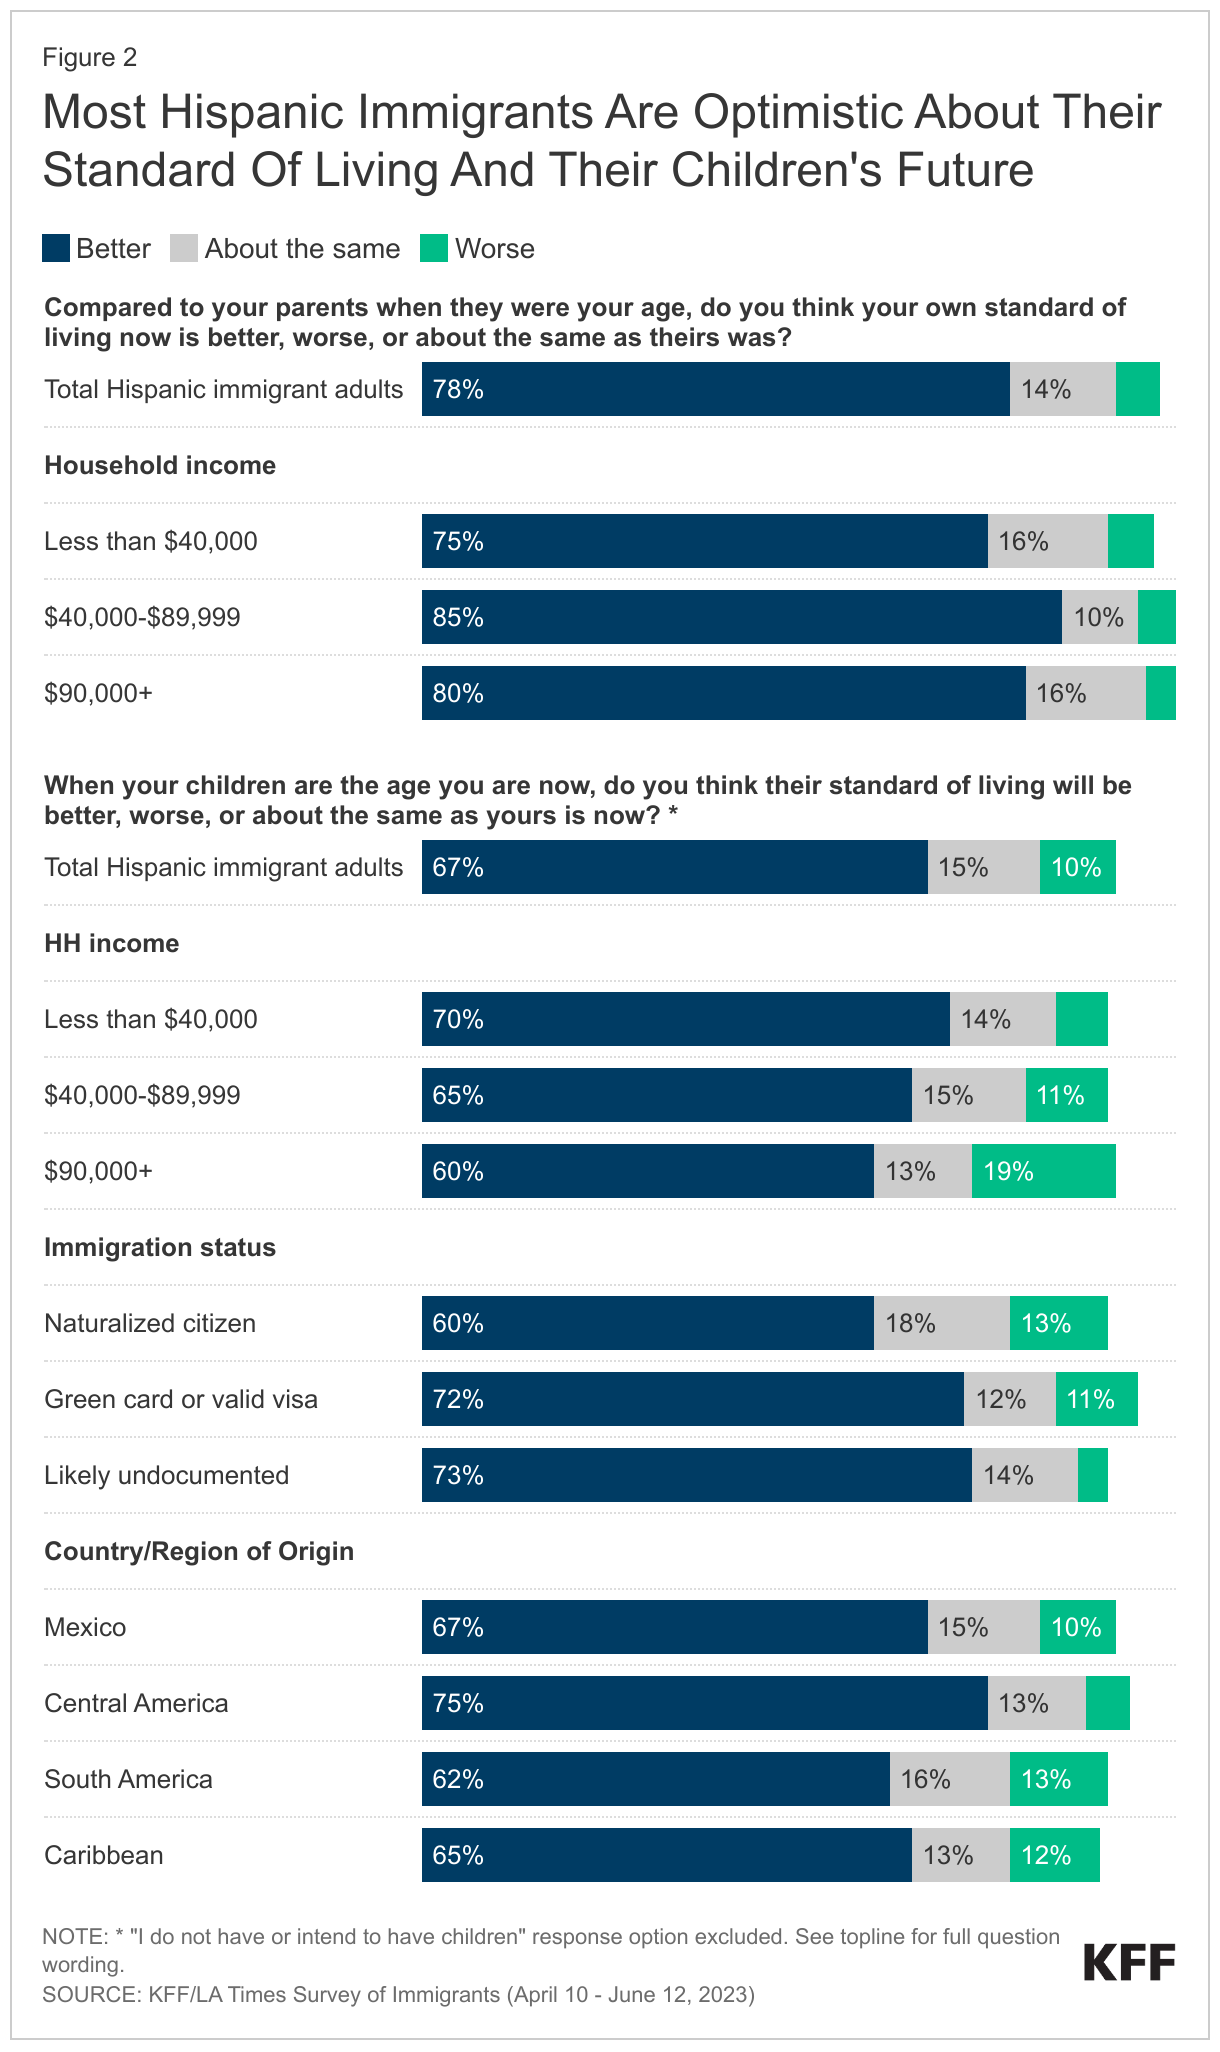
Most Hispanic immigrants say their own standard of living is better than their parents’ was at their age and that their children’s lives will be better than theirs, including those with lower household incomes. About eight in ten (78%) Hispanic immigrants say their standard of living is better compared with their parents at their age, and two-thirds (67%) say they think their children’s lives will be better than theirs. Smaller shares of Hispanic immigrants say they think their children’s lives will be worse (10%) or about the same (15%). Lower income Hispanic immigrants are as likely as those with higher household incomes to say their current standard of living is better than their parents’ was and similar shares are optimistic about their own children’s futures. Hispanic immigrants who are noncitizens (73%) and those from Central America (75%) are particularly likely to say they are optimistic for their children’s futures.

Most Hispanic Immigrants Are Optimistic About Their Standard Of Living And Their Children's Future

In Their Own Words: Hispanic Immigrants Say There Are Better Opportunities In The U.S. For Themselves And Their Children

In focus groups, participants expressed that while they face challenges in the U.S., they are grateful to be in the U.S. given the greater opportunities for themselves and their children. Many participants told stories of how different it was for them growing up in their home countries compared to how their children are able to grow up in the U.S.

“I’ll be motivating my kids, day by day, so that they can have a better future than me.” – 39-year-old Mexican immigrant man in California

“In my case, I think [my children are] better here. There [are] better opportunities, better jobs, schools. They can study whatever they want, whereas over there [in Guatemala], it’s a little hard. There’s a lot of opportunities for them to choose from.” – 57-year-old Guatemalan immigrant woman in Texas

“My daughter just graduated from college, one of the best universities here….she’s an example for the other kids to follow. Here in the States, they can have a career. Where I lived, I couldn’t go to school, but they can. What I tell them is, ‘You have the ability to achieve whatever you want.’ I tell them, ‘Be successful and show the world that we can also do it. Show them that we’re not a burden, but that we also come to better ourselves.’” – 47-year-old Mexican immigrant woman in California

“Because sometimes, what my parents made wasn’t enough, so at a young age, they put you to work. You had to work to survive. Like I told my daughter, ‘Thank God we’re in this country. You don’t live wealthy, but you do have what you need.’ So, I tell her, ‘You have the opportunity to go to school, and as your dad, I’m going to make sure you study.’” – 51-year-old El Salvadorian immigrant man in California

“We’re happy because we have a better life, even though we always miss our homeland. But it’s better.” – 35-year-old Mexican immigrant man in California

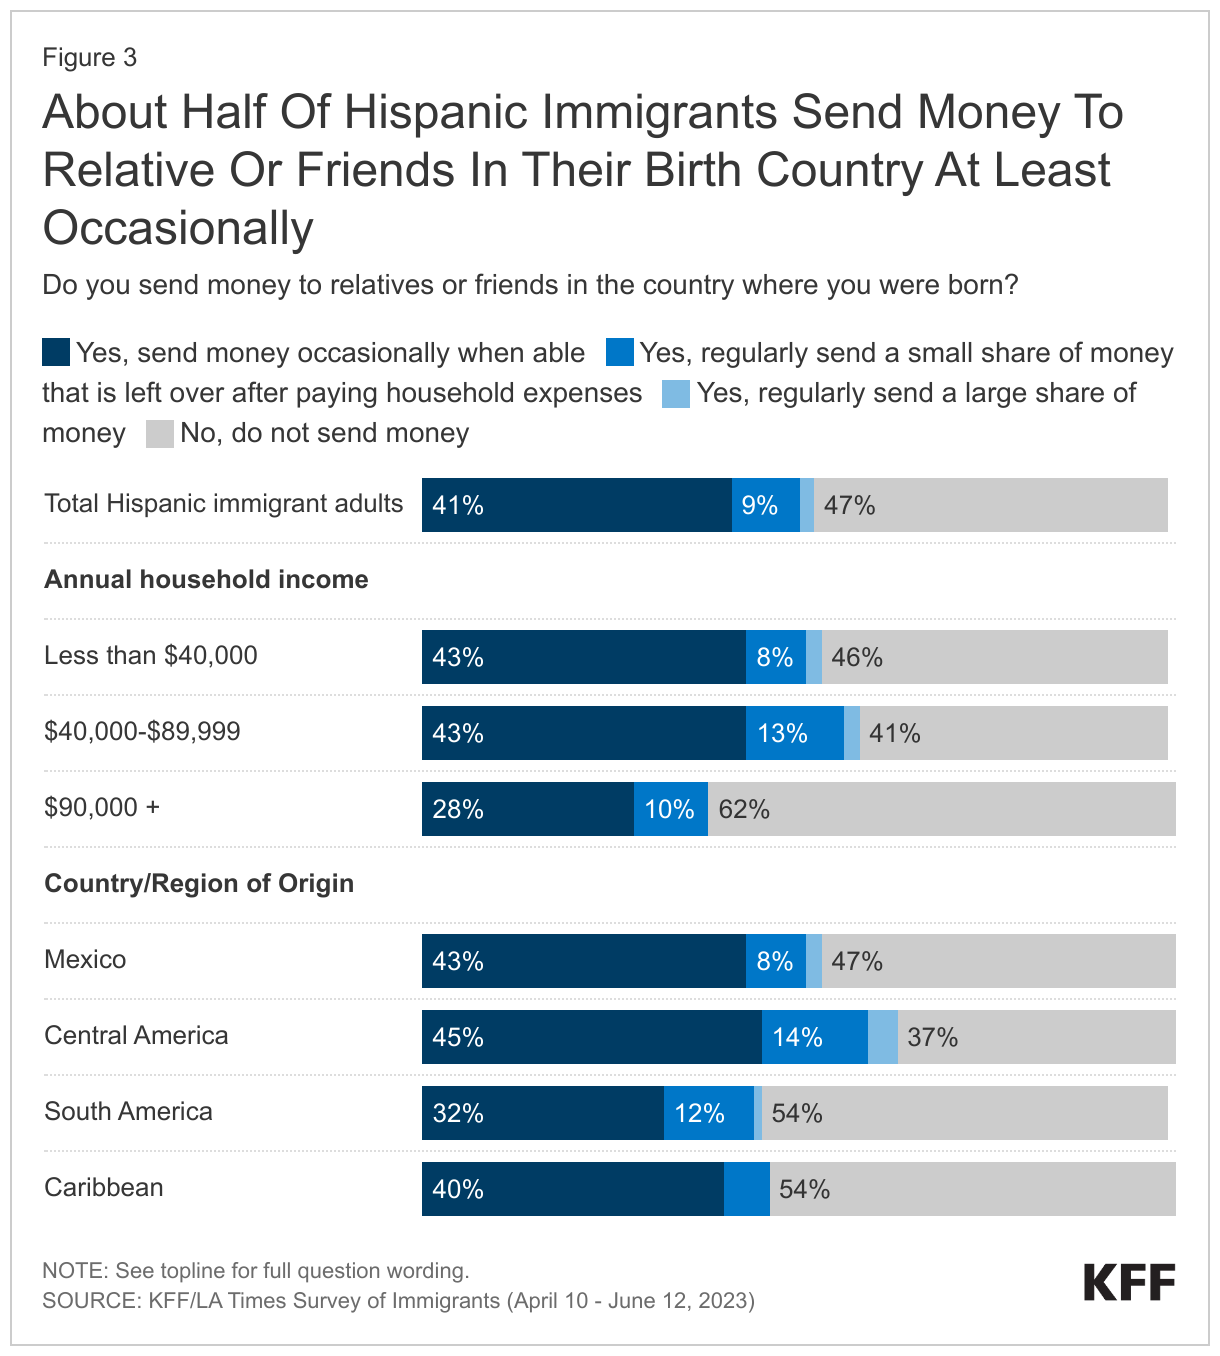
In addition to feeling that their lives are better in the U.S., about half of Hispanic immigrants support their families and friends in their country of birth by sending money at least occasionally, including among those with lower household incomes. Hispanic immigrants from Central America (62%) are more likely than those from South America (45%) or the Caribbean (46%) to say they send money at least occasionally. About half (53%) of Hispanic immigrants from Mexico send money at least sometimes. Hispanic immigrants with lower or moderate household incomes are more likely than those with higher household incomes to say they send money at least occasionally (53% vs. 58% vs. 38%).

About Half Of Hispanic Immigrants Send Money To Relative Or Friends In Their Birth Country At Least Occasionally

Eight in ten Hispanic immigrants say they would choose to come to the U.S. again. Asked what they would do if given the chance to go back in time knowing what they know now, eight in ten Hispanic immigrants (80%) say they would choose to come to the U.S. again, including similarly large shares across income, immigration status, and country/region of origin. While most Hispanic immigrants share this sentiment, overall, fewer than one in ten (7%) immigrants say they would not choose to move to the U.S. and about one in ten (13%) say they are not sure whether they would choose to move to the U.S.

Overall, about six in ten (63%) Hispanic immigrants say, thinking about their futures, they plan to stay in the U.S., but about one in six (17%) Hispanic immigrants from Mexico say they plan to move back to Mexico. Overall, about one in five Hispanic immigrants say they want to move back to the country they were born in (13%) or to another country (7%), and about one in six (17%) say they are not sure if they plan to stay in the U.S. A bare majority (54%) of Hispanic immigrants who are likely undocumented say they plan to stay in the U.S., while one in four say they either plan to move back to their country of birth (20%) or move to a different country (6%) and a further one in five (20%) are not sure. One in six Hispanic immigrants from Mexico say they want to move back to their country of birth (17%), compared to smaller shares of those from South America (7%) and the Caribbean (2%).

Work Experiences

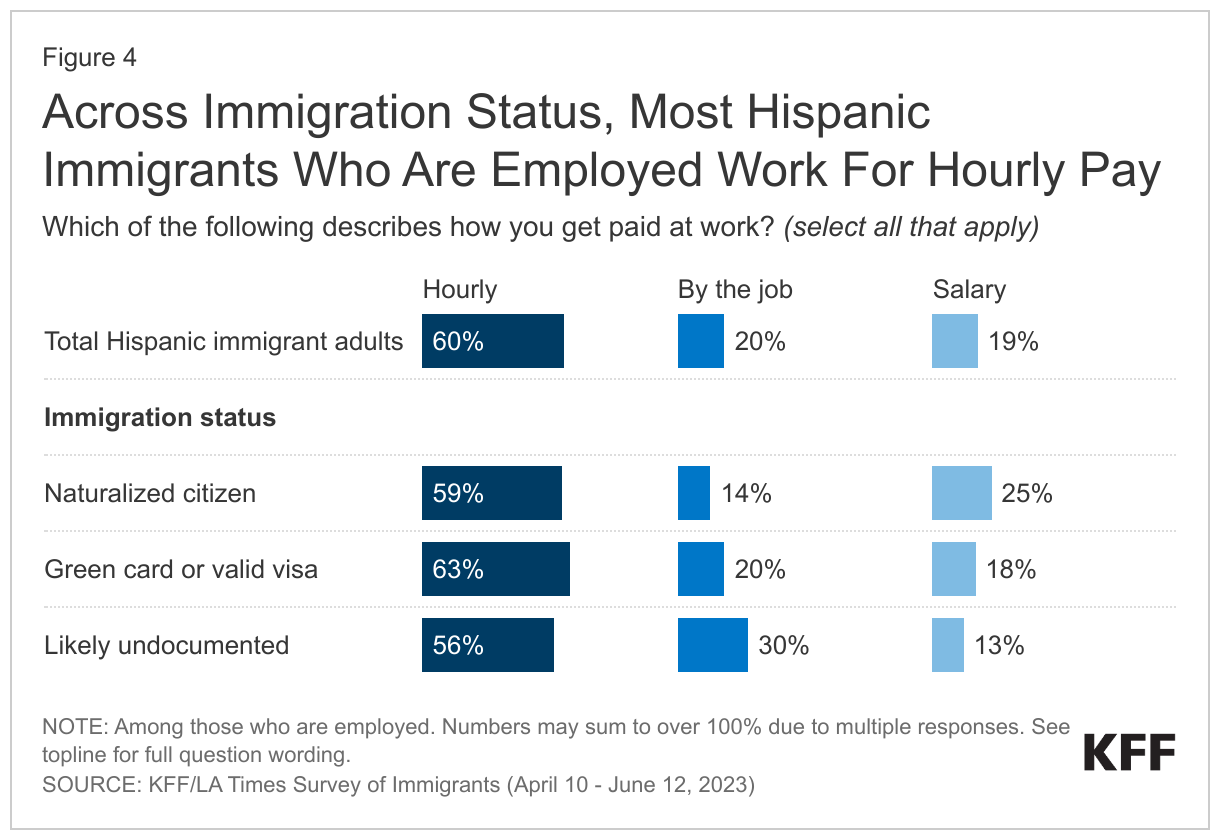
Most (67%) Hispanic immigrants are working, mainly in hourly jobs, of whom about one in four (27%) are self-employed or the owner of a small business. Similar to the overall immigrant population, two-thirds (67%) of Hispanic immigrants report they are currently employed for pay, including three-quarters (75%) of those ages 18-64. Most employed Hispanic immigrants report working for hourly pay (60%), while one in five (20%) say they are paid by the job and a similar share work for a salary (19%). Hispanic immigrants who are likely undocumented (30%) are more likely to say they are paid by the job compared to those with a valid visa or green card (20%) or those who are naturalized citizens (14%). Conversely, those who are naturalized citizens are more likely than noncitizens report they have a salaried job, with one in four (25%) saying they receive a salary. Despite these differences, most Hispanic immigrants across immigration statuses report working in hourly jobs. Nearly half (46%) of Hispanic immigrants with a college degree say they are overqualified for their jobs, compared to about one in four (23%) with less than a college degree.

Across Immigration Status, Most Hispanic Immigrants Who Are Employed Work For Hourly Pay

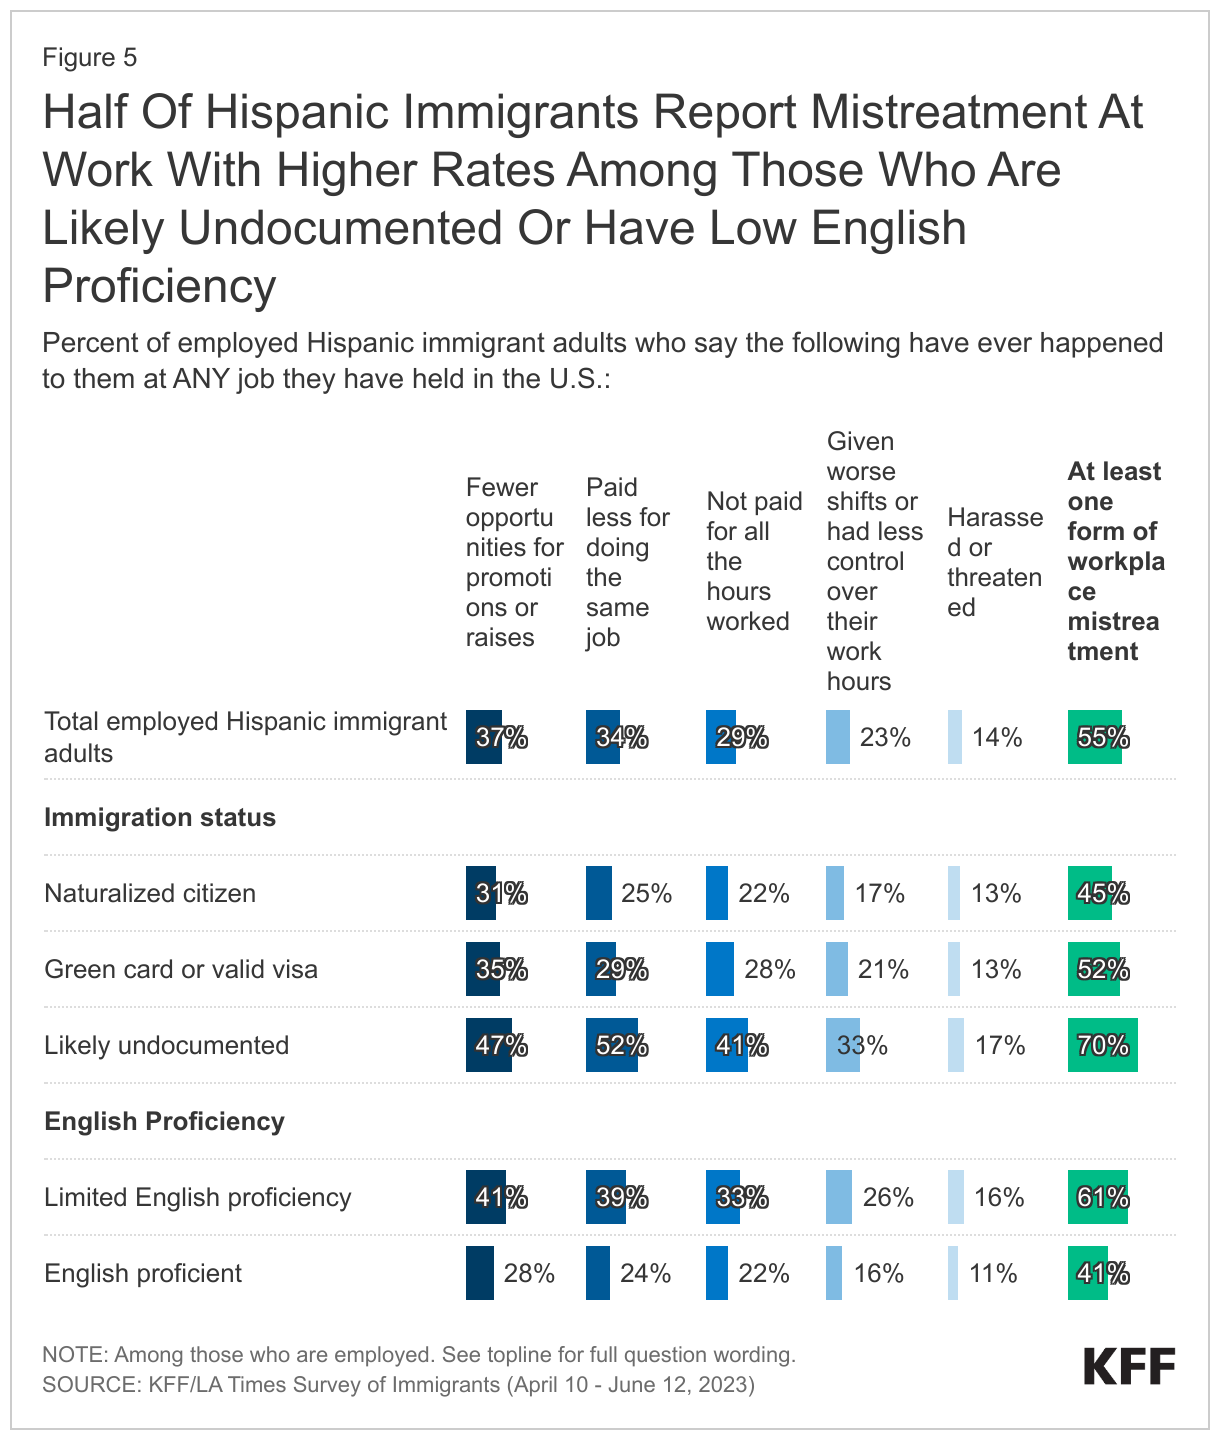
About half of working Hispanic immigrants report experiencing discrimination at work, including seven in ten likely undocumented Hispanic immigrants and six in ten Hispanic immigrants with LEP. At least half (55%) of all Hispanic working immigrants say they have ever been treated differently from people born in the U.S. doing the same job at work in at least one of five ways asked about on the survey, including being given fewer opportunities for advancement (37%), being paid less for doing the same job (34%), not being paid for all the hours worked or not given overtime pay for which they were eligible (29%), being given worse shifts or less control over their work hours (17%), or being harassed or threatened by someone in their workplace because they are an immigrant (14%). Due to lack of work authorization, undocumented immigrant workers face disproportionate employment challenges and are at increased risk for workplace abuses and violations. Reflecting these increased risks, most (70%) undocumented employed Hispanic immigrants report they have experienced at least one form of workplace discrimination, including about half (52%) who say they have been paid less for doing the same job as someone born in the U.S. and four in ten (41%) who say they were not paid for all their hours worked. Additionally, six in ten (61%) working Hispanic immigrants with LEP say they have experienced at least one form of unfair treatment in the workplace. However, even among those who are citizens (45%), are English proficient (41%), and who have at least a college degree (52%), substantial shares say they experience mistreatment at work.

Half Of Hispanic Immigrants Report Mistreatment At Work With Higher Rates Among Those Who Are Likely Undocumented Or Have Low English Proficiency

Financial Situation

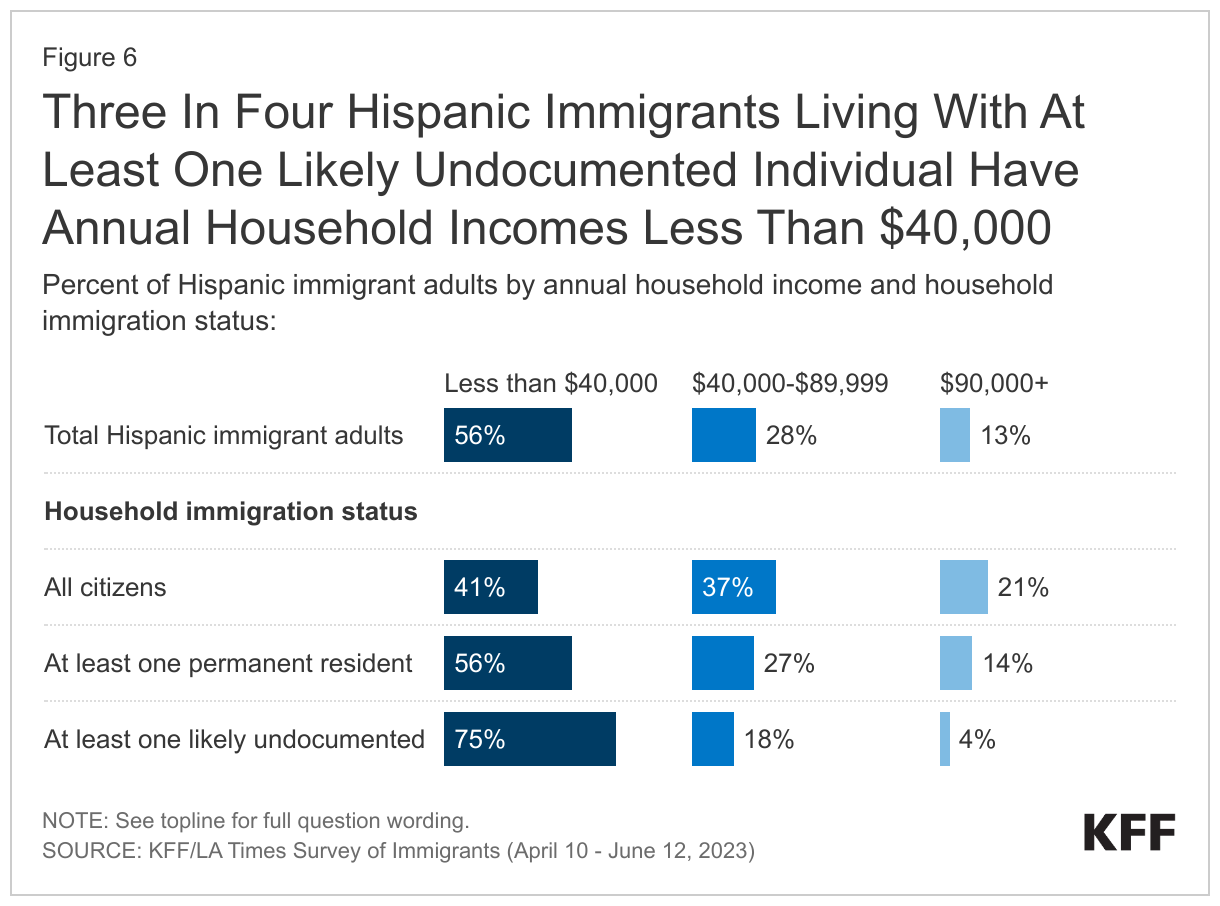
Household incomes among Hispanic immigrants vary widely by immigration status. A majority (56%) of Hispanic immigrants live in lower-income households (under $40,000 annually), including three-quarters of those in households with at least one undocumented resident. However, Hispanic immigrants who live in a household in which everyone is a citizen are five times more likely have household incomes of $90,000 or more than those who live in a household in which at least one person is likely undocumented (21% vs. 4%).

Three In Four Hispanic Immigrants Living With At Least One Likely Undocumented Individual Have Annual Household Incomes Less Than $40,000

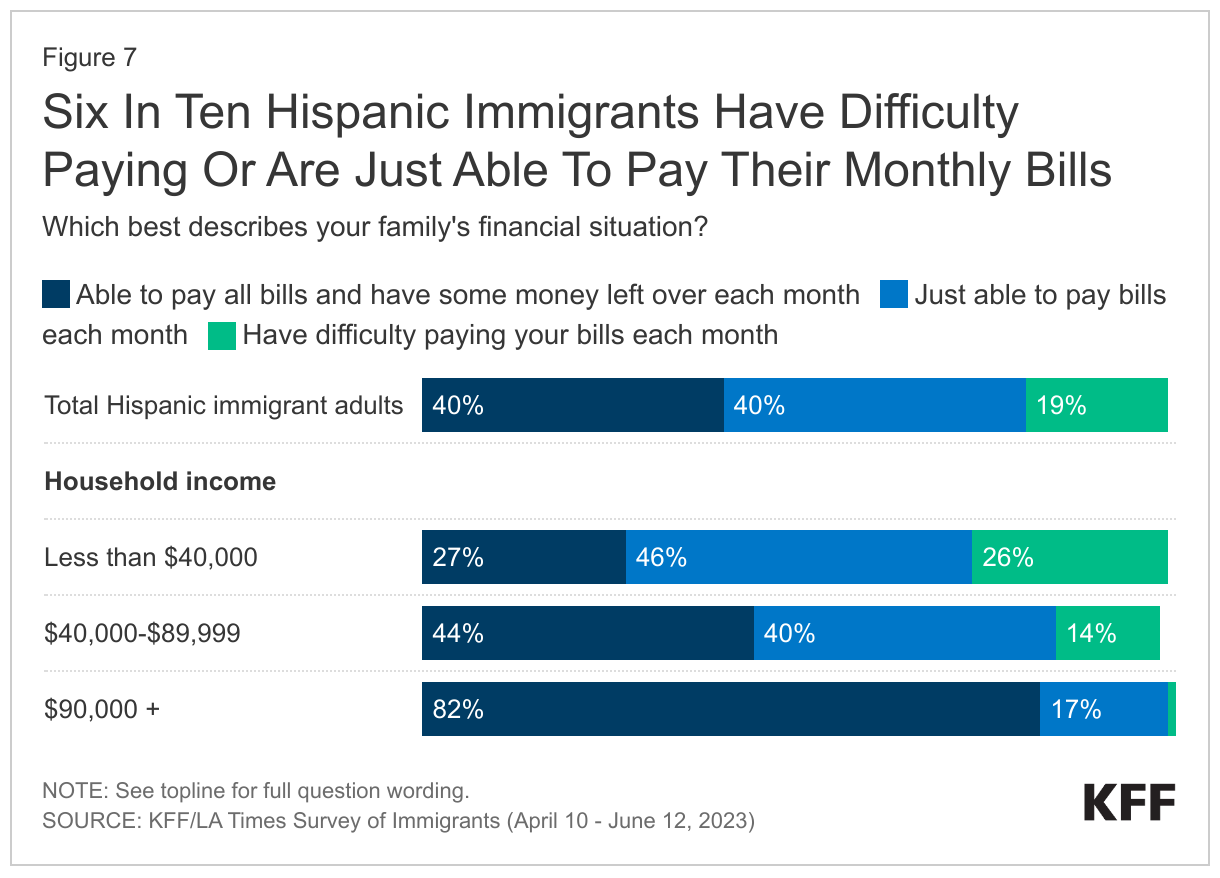
Four in ten Hispanic immigrants say they can pay their monthly bills and have money left over each month, including eight in ten (82%) among those in higher income households, however, six in ten say they are just able to pay their bills each month (40%) or have difficulty paying their bills each month (19%). The ability to pay monthly bills varies widely by household income, with about seven in ten in lower income households (less than $40,000 annually) saying they either are just able to pay their bills (46%) or have difficulty doing so each month (26%), and the large majority of those in higher income households ($90,000 or more annually) saying they have money left over each month (82%).

Six In Ten Hispanic Immigrants Have Difficulty Paying Or Are Just Able To Pay Their Monthly Bills

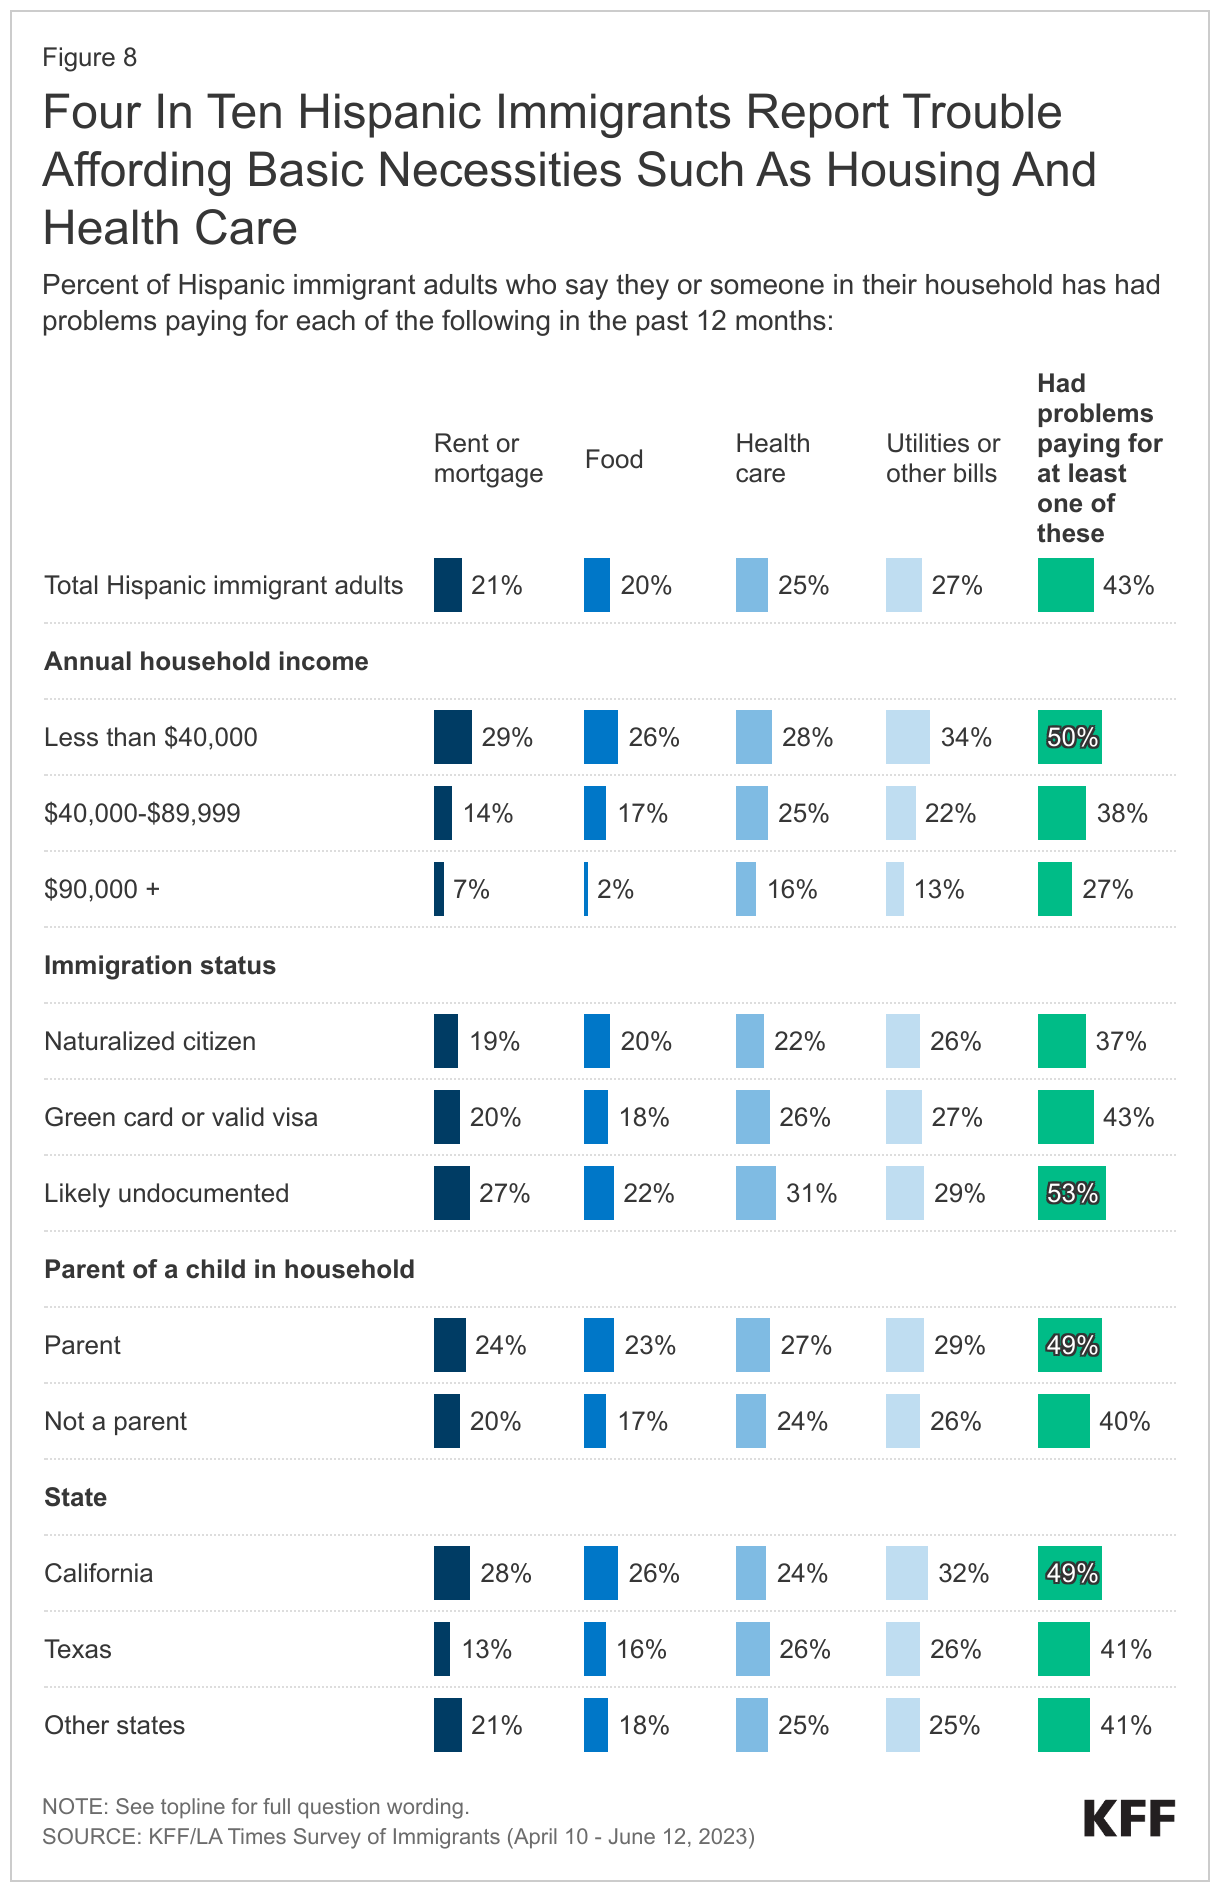
Many Hispanic immigrants in lower income households have difficulty affording basic needs. Overall, about four in ten Hispanic immigrants (43%), rising to half (50%) among lower income households, say their household has had problems paying for at least one of the following necessities in the past 12 months: utilities or other bills (27%), health care (25%), rent or mortgage (21%), or food (20%), with this. The shares who report facing these financial challenges are also larger among Hispanic immigrants who are likely undocumented (53%) and those from Mexico (47%) given that these groups are more likely to have lower incomes. In addition, Hispanic immigrants who are parents are more likely than those who are not to have problems paying for at least one of these (49% vs. 40%).

Where Hispanic immigrants live also affects their financial situation and stability. For example, Hispanic immigrants living in California are more likely than those in other states to report problems affording basic needs, particularly housing, likely reflecting the high cost of living in the area. About half (49%) of Hispanic immigrants living in California say they have had difficulties paying for necessities, including about one third (32%) who cite difficulties paying utilities or other bills, about three in ten (28%) who say they have had problems paying their rent or mortgage, and one in four who have difficulty paying for food (26%). Hispanic immigrants in Texas are about half as likely as those in California to say they have had problems paying for housing costs (13% vs. 28%).

Four In Ten Hispanic Immigrants Report Trouble Affording Basic Necessities Such As Housing And Health Care

Limited English Proficiency And Language Barriers

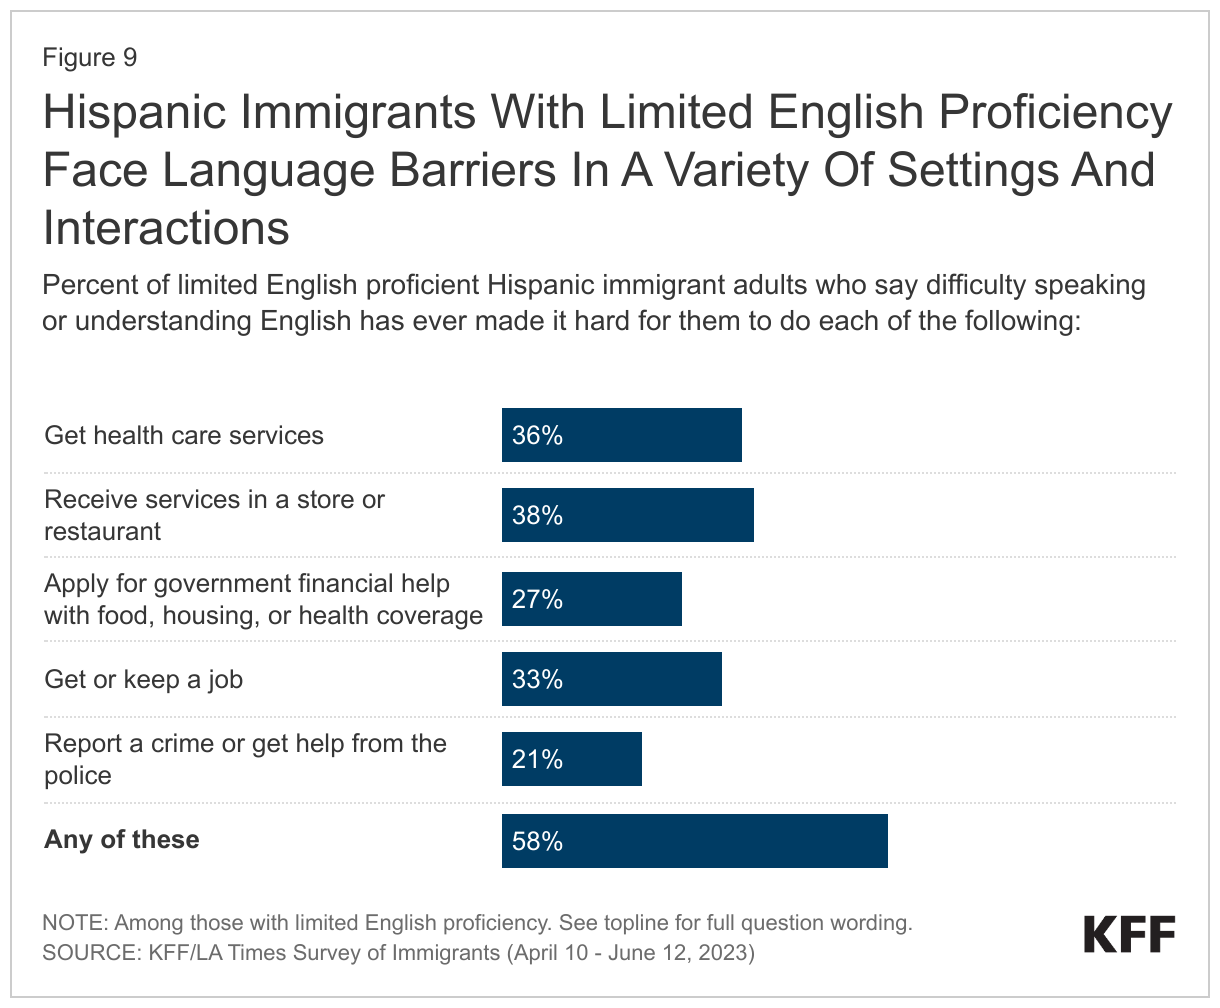
A majority of Hispanic immigrants with LEP report language barriers in a variety of settings and interactions, including one in four (23%) parents who say that difficulty speaking or understanding English has made it hard for them to communicate with their child’s school or teacher.  Overall, two-thirds of Hispanic immigrants have LEP, meaning they speak English less than very well, including about seven in ten  among those from Mexico (70%) and Central America (68%) compared with about six in ten among those from the Caribbean (60%) and South America (58%). Among Hispanic immigrants with LEP, a majority (58%) say that difficulty speaking or understanding English has ever made it hard for them to do at least one of the following: receive services in a store or restaurant (38%); get health care services (36%); get or keep a job (33%); apply for government financial help with food, housing, or health coverage (27%); or report a crime or get help from the police (21%). One in four (23%) Hispanic immigrant parents with LEP say difficulty speaking or understanding English has made it hard for them to communicate with their child’s school or teacher.

Hispanic Immigrants With Limited English Proficiency Face Language Barriers In A Variety Of Settings And Interactions

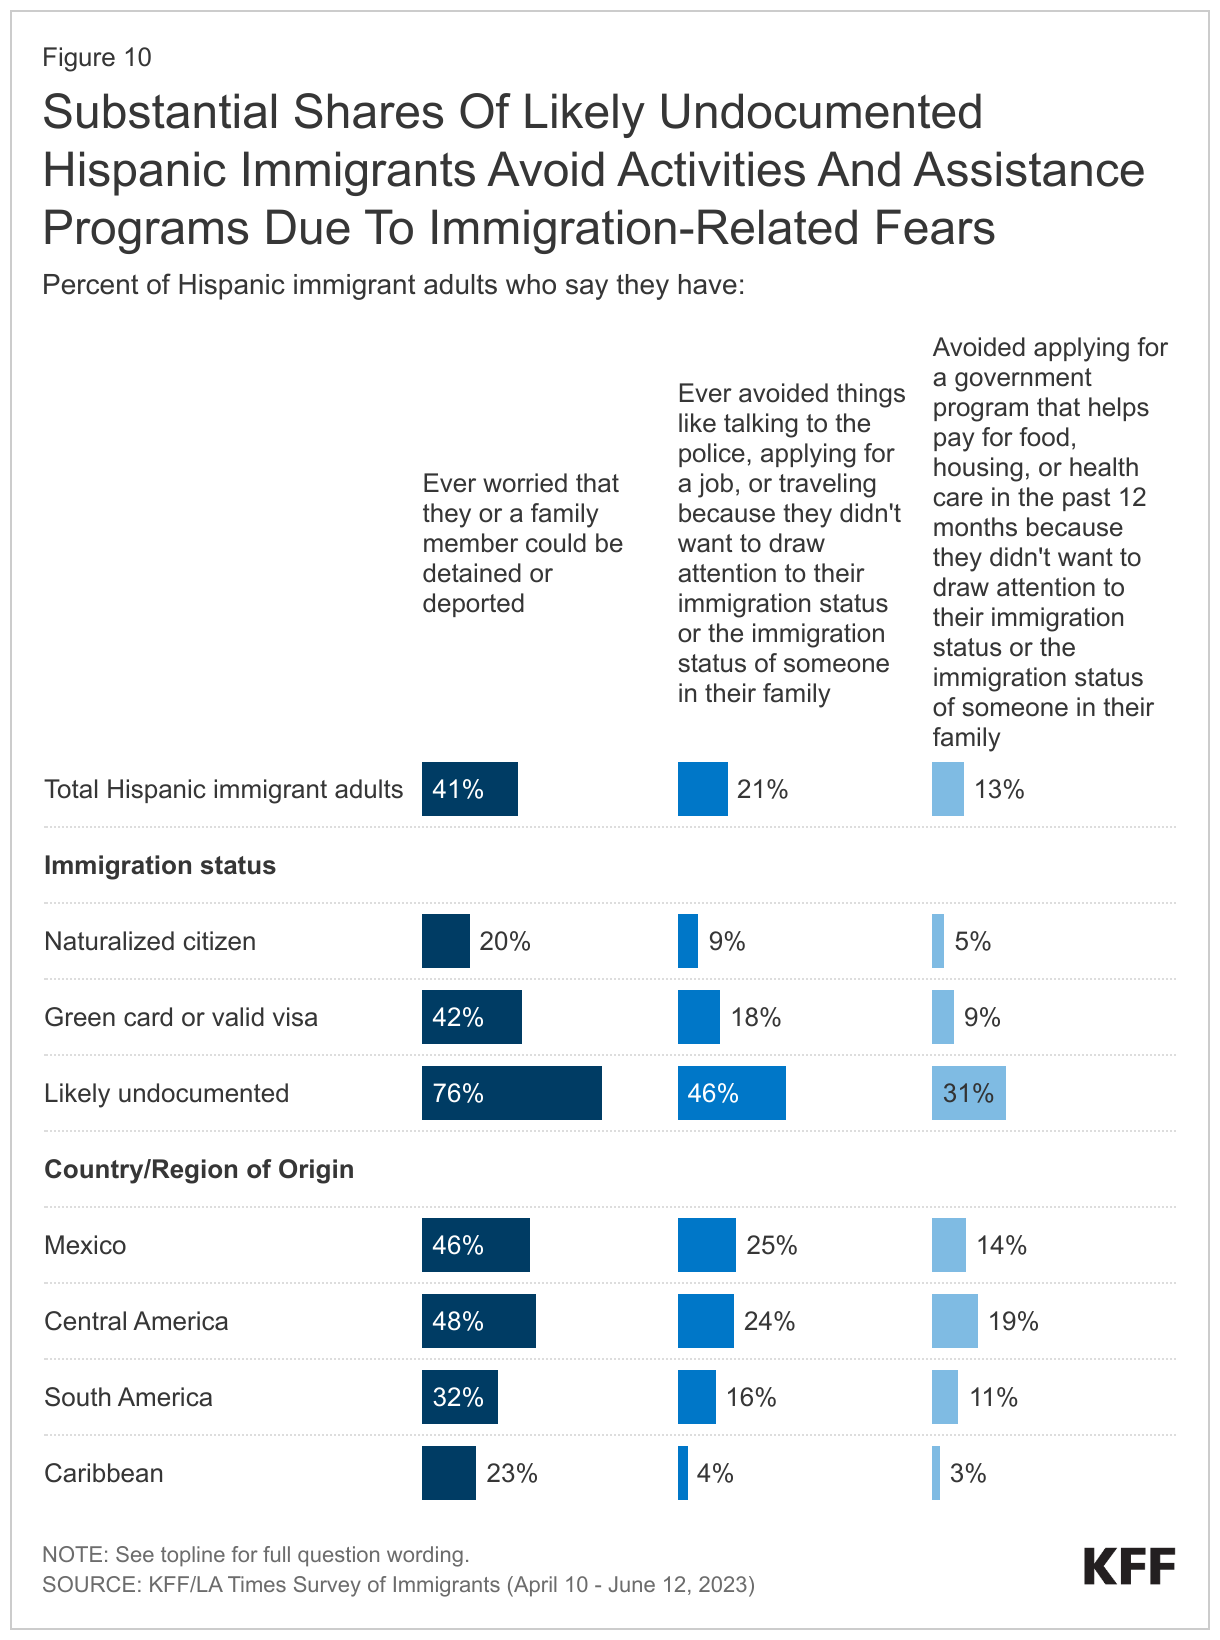
About three in four (76%) Hispanic immigrants who are likely undocumented worry they or a family member may be detained or deported. However, worries about detention or deportation are not limited to those who themselves are likely undocumented. Even among Hispanic immigrants who are naturalized citizens, one in five (20%) say they worry they or a family member could be deported, and about four in ten immigrants (42%) who have a green card or other valid visa say they have this worry. Largely reflecting the higher shares who are likely undocumented, Hispanic immigrants from Central America (48%) and Mexico (46%) are more likely to express concern about detention or deportation than are Hispanic immigrants from South America (32%) or the Caribbean (23%).

Substantial shares of Hispanic immigrants who are likely undocumented say they have avoided certain activities because they didn’t want to draw attention to their or a family member’s immigration status. This includes about one in five (21%) Hispanic immigrants overall, rising to nearly half (46%) of those who are likely undocumented, who say they have avoided things such as talking to the police, applying for a job, or traveling because they didn’t want to draw attention to their or a family member’s immigration status. In addition, about one in ten (13%) Hispanic immigrants say they have avoided applying for a government program that helps pay for food, housing, or health care in the past 12 months because of concerns about immigration status, including about three in ten (31%) of those who are likely undocumented.

Substantial Shares Of Likely Undocumented Hispanic Immigrants Avoid Activities And Assistance Programs Due To Immigration-Related Fears

U.S. Immigration Policy Knowledge

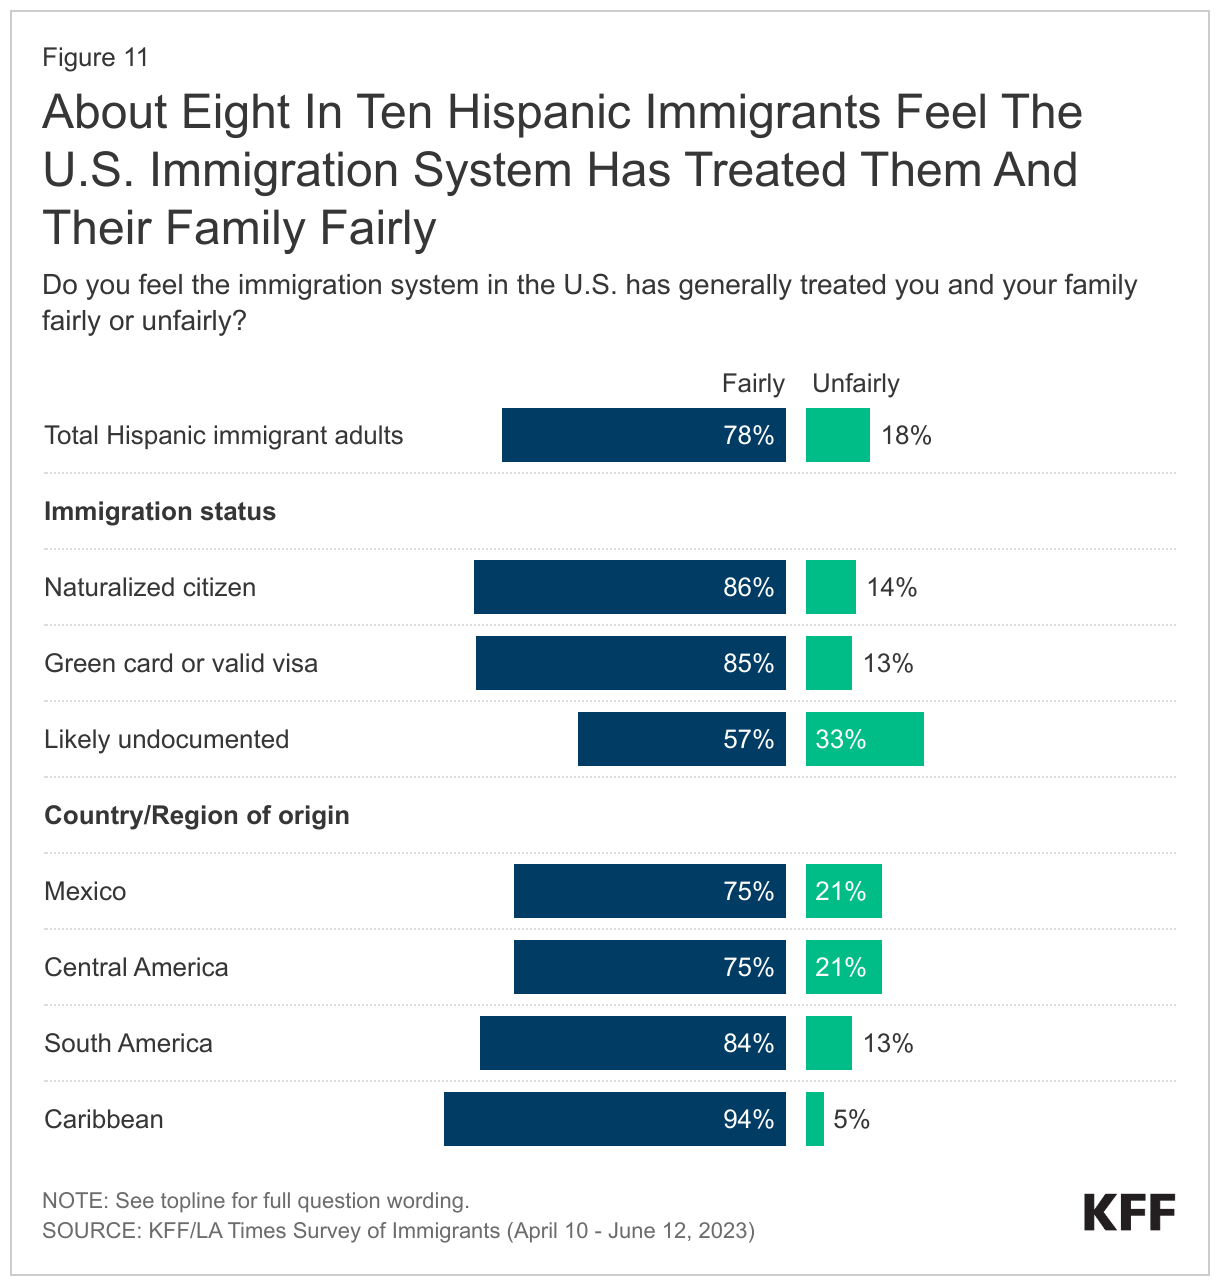
Most (78%) Hispanic immigrants say they feel the U.S. immigration system has treated them and their families fairly, but one third of those who are likely undocumented say they feel they have been treated unfairly. Largely reflecting their higher rates of being likely undocumented, about one in five Hispanic immigrants from Mexico (21%) and Central America (21%) say they and their family have been treated unfairly. Likely in part a reflection of the policy that granted Cubans who reached U.S. soil prior to 2017 a fast track to U.S. citizenship, the vast majority (94%) of Hispanic immigrants from the Caribbean say they and their families have been treated fairly by the U.S. immigration system.

About Eight In Ten Hispanic Immigrants Feel The U.S. Immigration System Has Treated Them And Their Family Fairly

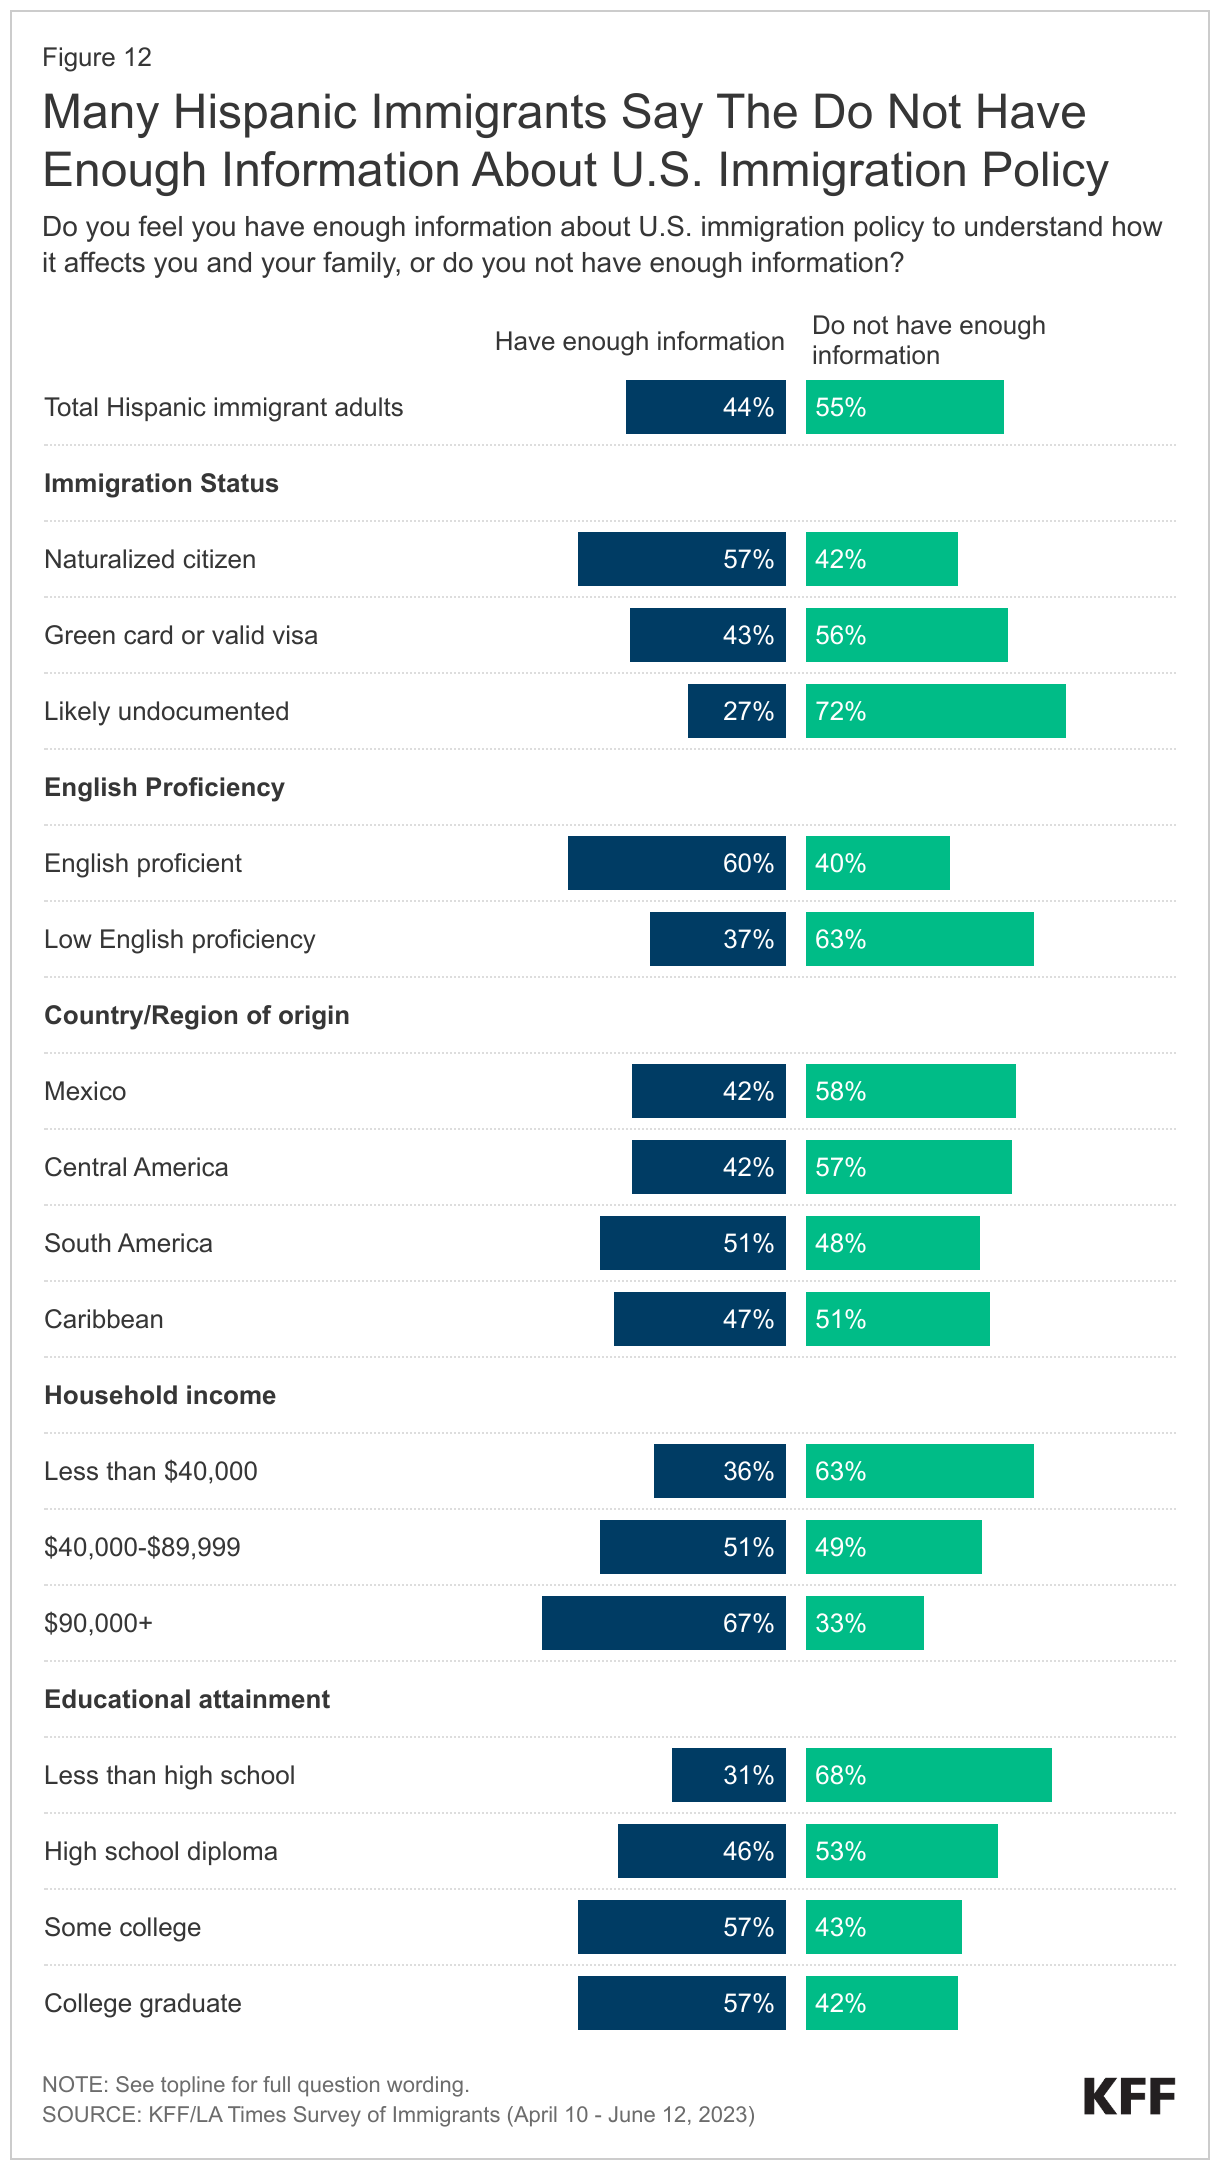
A majority (55%) of Hispanic immigrants, including about seven in ten (72%) of those who are likely undocumented, say they do not have enough information about U.S. immigration policy to understand how it affects them and their family. Most Hispanic immigrants who have a green card or valid visa (56%) and about four in ten (42%) naturalized citizens also say they lack sufficient information. Beyond differences by immigration status, the groups who are more likely to say they do not have enough information to understand how immigration policy affects them and their families include Hispanic immigrants with LEP as well as those who have been in the U.S. for fewer than ten years, have lower household incomes, and those with lower educational attainment levels. In contrast, majorities of naturalized citizens, those who are English proficient, those who have been in the U.S. for longer, and those with higher incomes and educational attainment levels say they have enough information.

Many Hispanic Immigrants Say The Do Not Have Enough Information About U.S. Immigration Policy

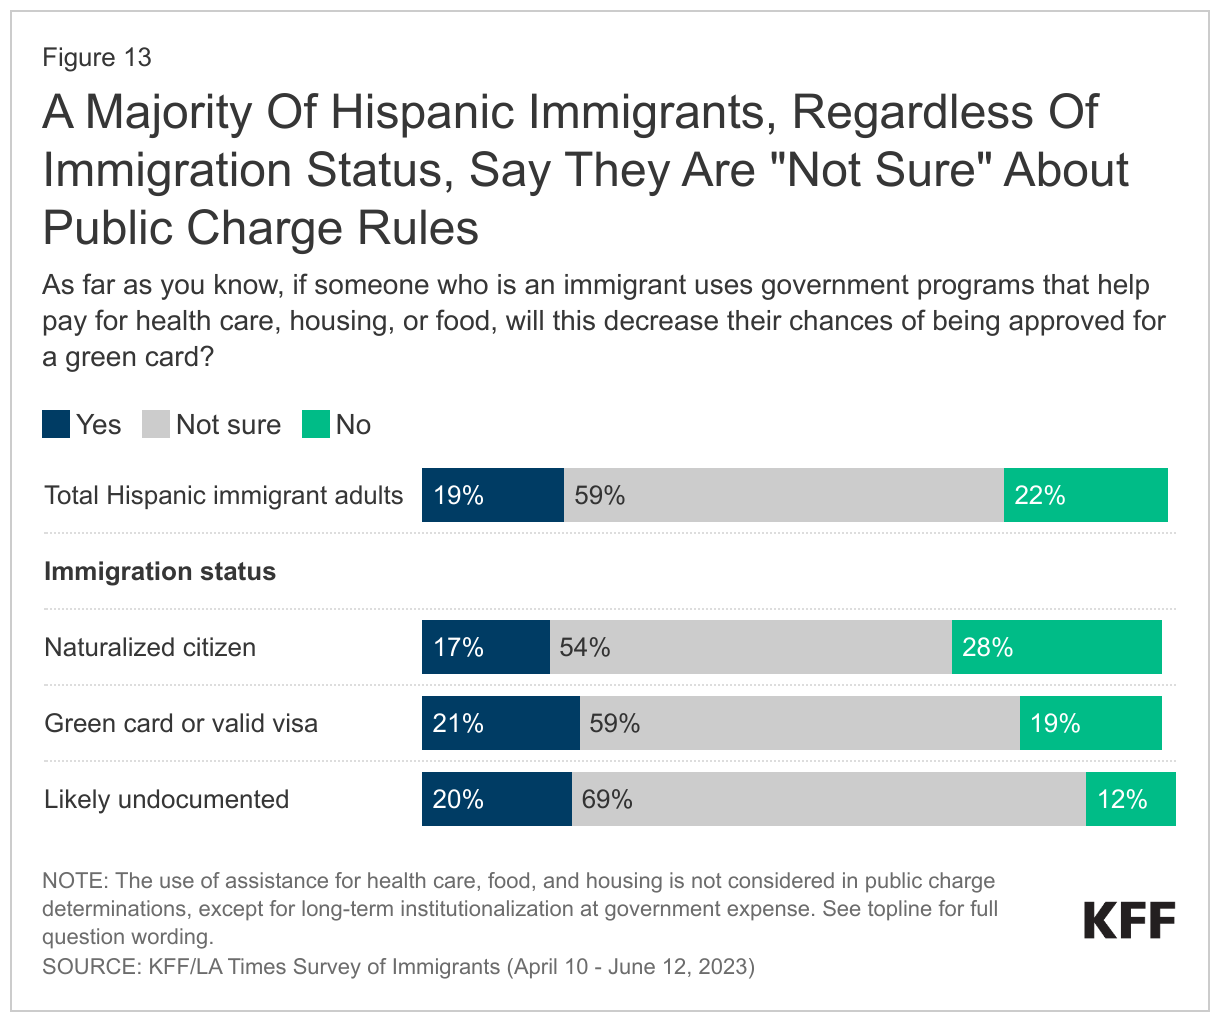
Most Hispanic immigrants are uncertain about how using assistance for food, housing, and health care may affect their immigration status. Under longstanding U.S. policy, federal officials can deny an individual entry to the U.S. or adjustment to lawful permanent status (a green card) if they determine the individual is a “public charge” based on their likelihood of becoming primarily dependent on the government for subsistence. In 2019, the Trump Administration made changes to public charge policy that newly considered the use of previously excluded noncash assistance programs for health care, food, and housing in public charge determinations. This policy was rescinded by the Biden Administration in 2021, meaning that the use of noncash benefits, including assistance for health care, food, and housing, is not considered for public charge tests, except for long-term institutionalization at government expense. However, the survey suggests that many Hispanic immigrants remain confused about public charge rules. About six in ten (59%) Hispanic immigrants say they are “not sure” whether use of public programs that help pay for health care, housing or food can decrease one’s chances for green card approval and another one in five (19%) incorrectly believe this to be the case. Among Hispanic immigrants who are likely undocumented, nine in ten are either unsure (69%) or incorrectly believe use of these types of public programs will decrease their chances for green card approval (20%).

A Majority Of Hispanic Immigrants, Regardless Of Immigration Status, Say They Are "Not Sure" About Public Charge Rules

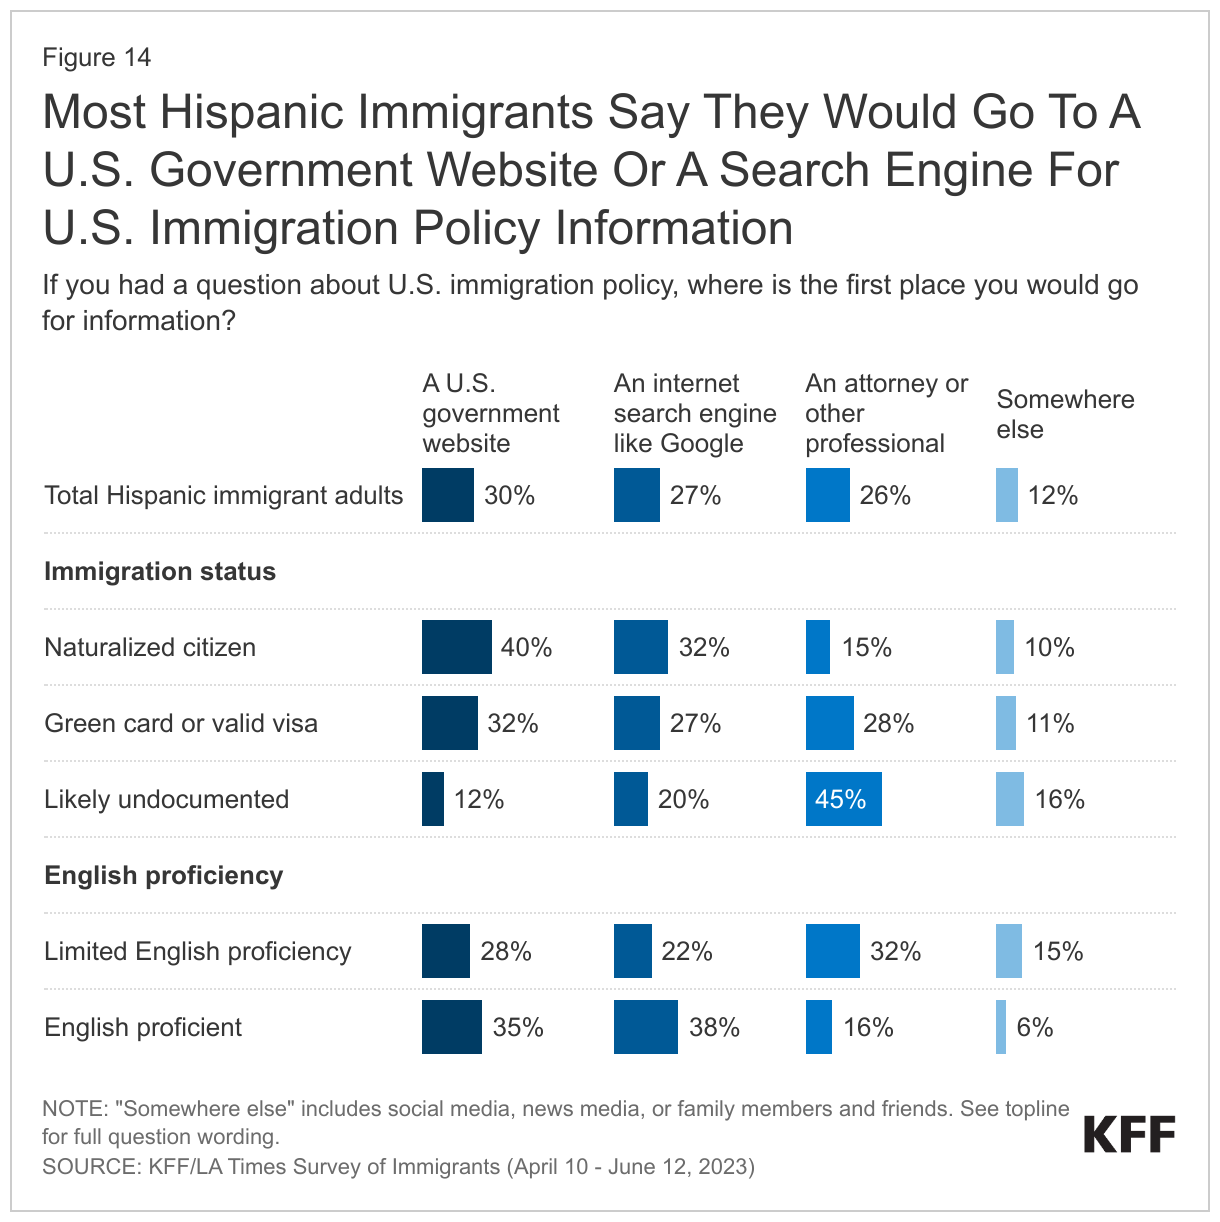
When asked where they would go if they had a question about U.S. immigration policy, most Hispanic immigrants say they would look to a government website (30%), an internet search engine like Google (27%), or an attorney or other professional (26%). Hispanic immigrants who are likely undocumented are more likely to say they would seek information from an attorney or other professional (45%) than are immigrants who are naturalized citizens (15%) or have a green card or valid visa (28%). Hispanic immigrants who have LEP are twice as likely to say they would go an attorney than those who are English proficient (32% v. 16%). As reported by the LA Times, immigration scams, particularly pretending to be an attorney are rampant, which may pose risks for undocumented immigrants.

Most Hispanic Immigrants Say They Would Go To A U.S. Government Website Or A Search Engine For U.S. Immigration Policy Information

Challenges Accessing Health Care

About one in four (26%) Hispanic immigrants are uninsured, rising to over half (55%) among those who are likely undocumented. About one in four (26%) of those with a green card or other valid visa report being uninsured and just one in ten (10%) of those who are citizens say they lack coverage. Uninsured rates are also higher among those who have lower incomes and LEP. The high uninsured rates among noncitizen and lower income Hispanic immigrants likely reflect lower levels of private coverage due to disproportionate employment in lower income jobs that are less likely to offer employer-based insurance. Medicaid coverage helps offset some, but not all, of this gap, as many noncitizen immigrants remain ineligible for federally funded coverage programs. Many lawfully present immigrants face a five-year waiting period to enroll in Medicaid or Children’s Health Insurance Program (CHIP) coverage, and undocumented immigrants are prohibited from enrolling in any federally funded coverage, including Medicaid, CHIP, Affordable Care Act (ACA) Marketplace, and Medicare coverage.

Many Likely Undocumented Hispanic Immigrants Do Not Have Health Insurance

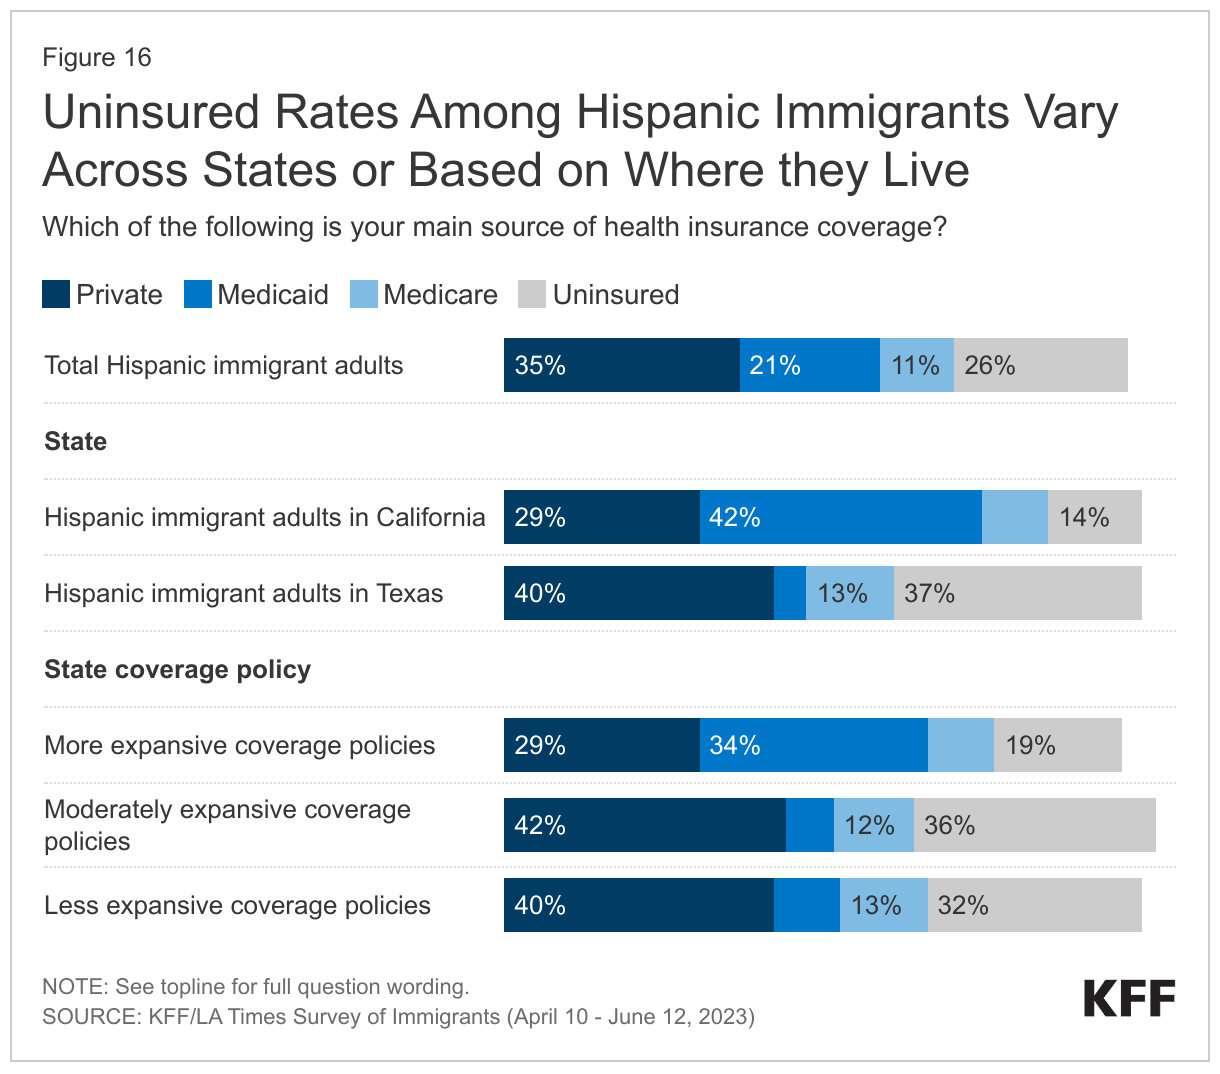
Where Hispanic immigrants live also makes a difference in their coverage rates, with higher rates of coverage among those living in states that offer more expansive coverage.  States vary in the coverage they provide for their low-income population overall as well as for immigrants specifically. Those that have adopted the ACA Medicaid expansion have broader eligibility for low-income adults overall, but noncitizen immigrants still face eligibility restrictions for this coverage. Some states have expanded coverage for immigrants by eliminating the five-year waiting period in Medicaid and/or CHIP for lawfully present immigrant children and/or pregnant people and/or extending coverage to some immigrants regardless of immigration status through fully state-funded programs. Immigrants in states that have taken up more of these coverage options are less likely to be uninsured. For example, the uninsured rate for Hispanic immigrant adults in California is much lower than it is in Texas (14% vs. 37%). California has adopted the ACA Medicaid expansion to low-income adults, expanded coverage for recent lawfully present immigrant children and pregnant people in Medicaid and CHIP, and began providing fully state-funded coverage regardless of immigration status to children in 2016 and to some adults in 2019. In contrast, in Texas, Medicaid eligibility for adults remains limited to very low-income parents (16% of the federal poverty level or about $4,000 per year for a family of three), and the state does not provide any state-funded coverage for immigrants. Even in states offering more expansive coverage, about one in five (19%) Hispanic immigrants remain uninsured, which may, in part, reflect enrollment barriers for those who are eligible such as lack of knowledge or confusion around eligibility rules, immigration-related fears, difficulty completing enrollment processes, and/or language barriers.

Uninsured Rates Among Hispanic Immigrants Vary Across States or Based on Where they Live

Classifying States by Coverage Policies

Health coverage was analyzed by expansiveness of state coverage for immigrants based on state of residence reported by survey respondents. Expansiveness of coverage was classified as follows:

More expansive coverage: States were classified as having more expansive coverage if they have implemented the ACA Medicaid expansion to low-income adults, have taken up options in Medicaid and CHIP to cover immigrants, and provide state-funded coverage to at least some groups (such as children) regardless of immigration status. Even when state-funded coverage is limited to children, the availability of this coverage may reduce fears among immigrant adults about applying for coverage for themselves if they are eligible for other options.

Moderately expansive coverage: States were classified as having moderately expansive coverage if they implemented the ACA Medicaid expansion to low-income adults and have taken up at least two options available in Medicaid and CHIP to expand coverage for immigrants, including covering lawfully-residing immigrant children or pregnant people without a five year wait or adopting the CHIP unborn child option to cover income-eligible pregnant people regardless of immigration status.

Less expansive coverage: States were identified as having less expansive coverage if they have not implemented the ACA Medicaid expansion to low-income adults and/or have taken up fewer than two options in Medicaid or CHIP to expand coverage for immigrants and do not offer state-funded health coverage to immigrants.

See Appendix Table 1 for state groupings by these categories.

Overall, most Hispanic immigrants have sought health care in the U.S., and about three in four have seen a health care provider in the past year, but health care use is much lower among those who are uninsured and those who are likely undocumented. Reflecting the large role health insurance status plays in facilitating access to care, uninsured Hispanic immigrants are less likely to say they have sought or received care in the U.S. and to say they have seen a provider in the past year compared with insured Hispanic immigrants. Half of uninsured Hispanic immigrants report having a health care visit in the past year, compared to about eight in ten (82%) of their insured counterparts. Likely undocumented Hispanic immigrants and those with LEP also are generally less likely to report seeking or receiving care than their citizen and English proficient counterparts, although there is no significant difference in the share who have had a health care visit in the past year by English proficiency. In addition to higher uninsured rates among these groups, immigration-related fears and language barriers may reduce their use of care.

Most Hispanic Immigrant Adults Report Seeking Or Using Care In The U.S., But Use Of Care Is Lower Among Those Who Are Uninsured

Most Hispanic immigrants say they have a place to go when they are sick or need health advice other than an emergency room, with four in ten (41%) saying they go to a neighborhood clinic or health center, also known as a community health center (CHC). Substantial shares of Hispanic immigrants, regardless of their insurance type, immigration status, English proficiency, and household income say a CHC is their usual source of care, highlighting their importance as a source of care for Hispanic immigrants overall. CHCs are a national network of safety-net primary care providers serving low-income and medically underserved communities, including communities of color, uninsured people, immigrants, and those in rural areas. Research shows that CHCs offer linguistically and culturally competent care to underserved racial and ethnic groups as well as people with LEP and that these services can positively impact patient satisfaction.

Uninsured Hispanic immigrants are much less likely than their insured counterparts to have a usual source of care other than the emergency room or to have a trusted doctor in the U.S. and are more likely to report skipping or postponing care. About one in five (22%) Hispanic immigrants say they do not have a usual source of care other than the emergency room, rising to over one in three of those who are uninsured (38%) or likely undocumented (36%). Moreover, while two-thirds (66%) of Hispanic immigrants overall say they have a trusted doctor or health care provider in the U.S., majorities of those who are uninsured (69%) and likely undocumented (56%) say they do not have a trusted doctor in the U.S. In addition, Hispanic immigrants who are uninsured are more likely than those who have insurance (35% vs. 21%) to say they have skipped or postponed health care services in the past 12 months.

Most Hispanic Immigrant Adults Say They Have A Usual Source Of Care, With Four In Ten Saying They Use A Community Health Center

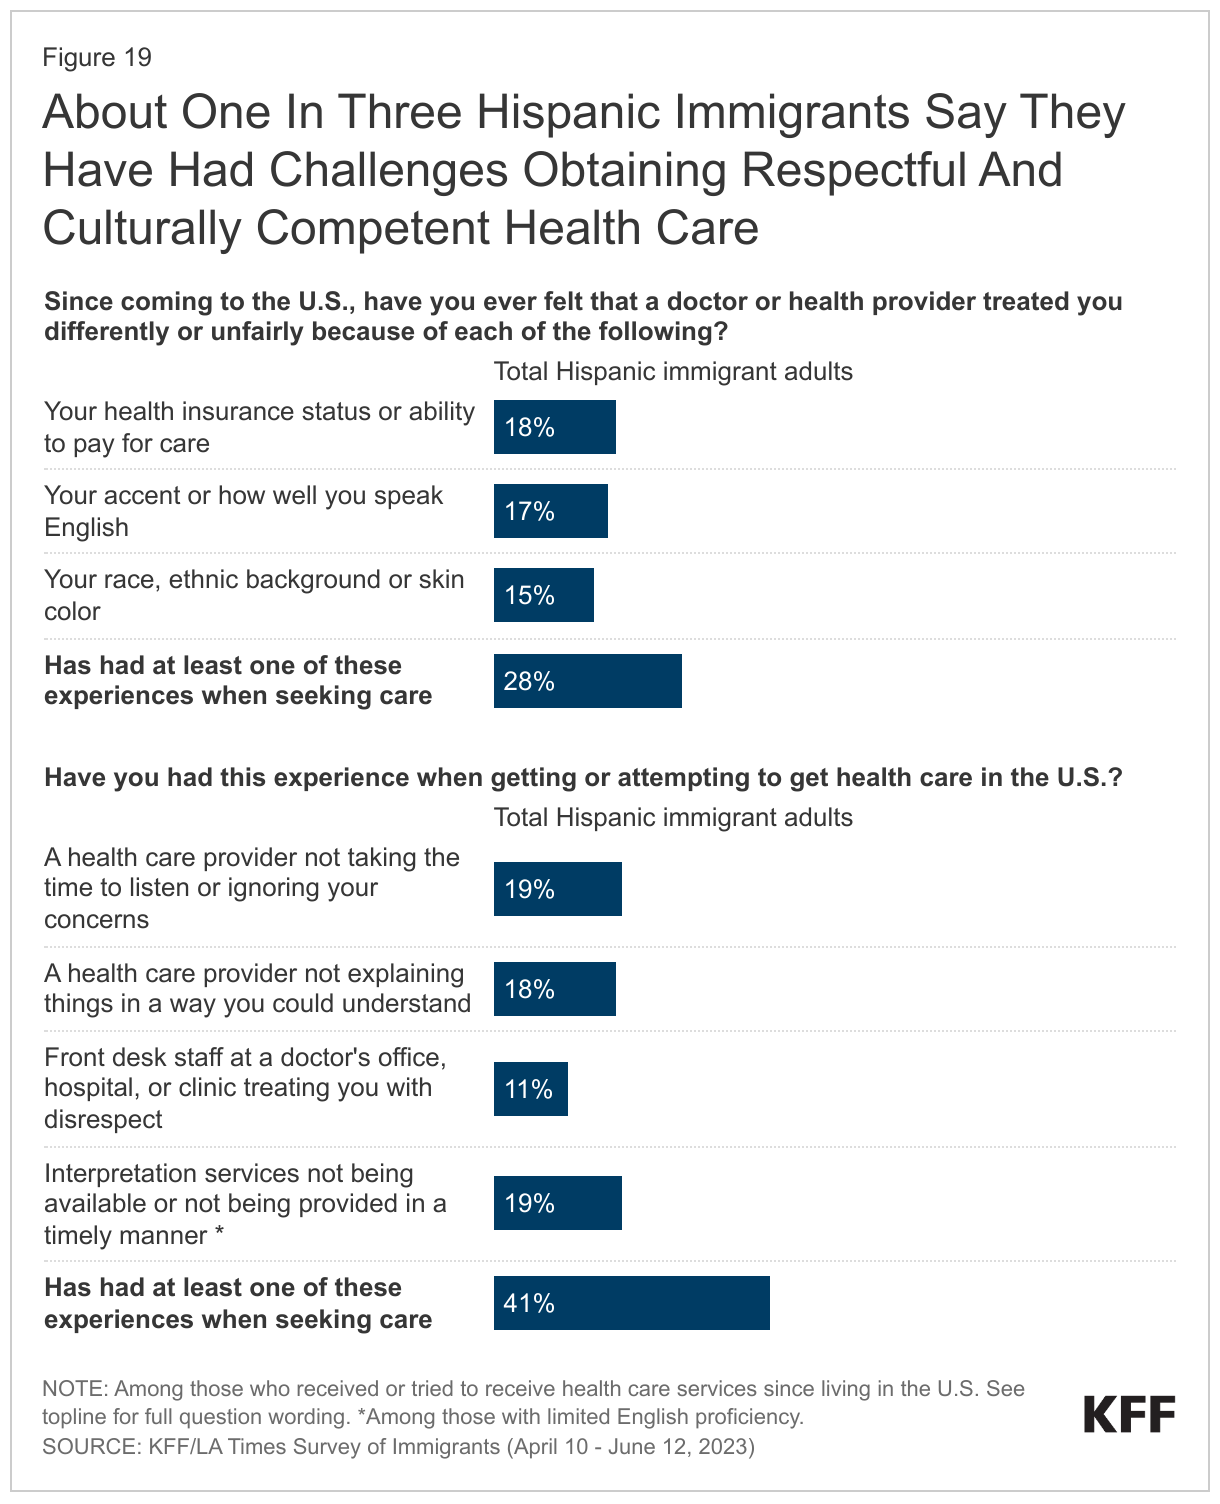
Among Hispanic immigrants who sought care in the U.S., about three in ten (28%) report being treated unfairly by a health care provider based on at least one of several factors asked about, and four in ten (41%) report at least one of several difficulties obtaining respectful and culturally competent care asked about on the survey. Specifically, about three in ten (28%) say that since coming to the U.S. they have ever been treated unfairly by a health care provider because of their insurance status or ability to pay (18%), their accent or how well they speak English (17%), and/or their race, ethnic background, or skin color (15%). Additionally four in ten (41%) say they experienced one or more of the following challenges, including a provider not taking the time to listen or ignoring concerns (19%); a health care provider not explaining things in a way they could understand (18%); being treated with disrespect by front office staff (11%); and, among those with LEP who completed the survey in a language other than English, interpretation services not available or provided in a timely manner (19%). Notably, there are few differences among Hispanic immigrants in the share reporting experiencing at least one of these challenges by coverage, income, or immigration status.

About One In Three Hispanic Immigrants Say They Have Had Challenges Obtaining Respectful And Culturally Competent Health Care

Acknowledgements:

KFF would like to thank the Association of Asian Pacific Community Health Organizations, the Black Alliance for Just Immigration, Dr. May Sudhinaraset, the National Immigration Law Center, the National Resource Center for Refugees, Immigrants, and Migrants, and UnidosUS for their invaluable inputs, insights, and suggestions throughout the planning, fielding, and dissemination of this survey project.

Methodology

The KFF/LA Times Survey of Immigrants is a partnership survey conducted by KFF and the LA Times examining the U.S. immigrant experience.

The survey was conducted April 10-June 12, 2023, online, by telephone, and by mail among a nationally representative sample of 3,358 immigrants, defined as adults living in the U.S. who were born outside the U.S. and its territories. Respondents had the option to complete the survey in one of ten languages: English (n=2,435), Spanish (n=627), Chinese (n=171), Korean (n=52), Vietnamese (n=22), Portuguese (n=16), Haitian-Creole (n=13), Arabic (n=9), French (n=9), and Tagalog (n=4). These languages were chosen as they are most commonly spoken by immigrant adults from countries of focus for the survey with limited English proficiency (LEP), based on the 2021 American Community Survey (2021).

Teams from KFF and The Los Angeles Times worked together to develop the questionnaire and both organizations contributed financing for the survey. KFF researchers analyzed the data, and each organization bears the sole responsibility for the work that appears under its name. Sampling, data collection, weighting, and tabulation were managed by SSRS of Glenn Mills, Pennsylvania in collaboration with public opinion researchers at KFF.

Respondents were reached through one of three sampling modes: an address-based sample (ABS) (n=2,661); a random digit dial telephone (RDD) sample of prepaid (pay-as-you go) cell phone numbers (n=565); and callbacks to telephone numbers that that were previously randomly sampled for RDD surveys and were identified as speaking a language other than English or Spanish (n=132). Respondents from all three samples were asked to specify their country of birth and qualified for the survey if they were born outside of the U.S.

Project design was informed by a pilot study conducted from January 31-March 14, 2022 among a sample of 1,089 immigrants in collaboration with SSRS. Prior to fielding the pilot study, KFF and SSRS conducted interviews with experts who had previous experience surveying immigrants. These conversations informed decisions on sampling, modes of data collection, recruitment strategies, and languages of interviews. The pilot test measured incidence of immigrant households across four different sample types and offered a short survey in 8 different languages both online and on the telephone. Based on the results of the pilot test, the following recruitment and data collection protocol was implemented:

Sampling strategy and interview modes:

The ABS was divided into areas (strata), defined by Census tract, based on the incidence of immigrants among the population overall and by countries of origin. Within each stratum, the sample was further divided into addresses that were flagged by Marketing Systems Group (MSG) as possibly occupied by foreign-born adults and unflagged addresses. To increase the likelihood of reaching immigrant adults, strata with higher incidence of immigrant households overall, and of immigrants from certain countries of origin were oversampled.

Households in the ABS were invited to participate through multiple mail invitations: 1) an initial letter in English with a short paragraph of instructions in each of the 10 survey languages on the back; 2) a reminder postcard in English plus up to two additional languages; 3) a follow-up letter accompanied by hardcopy questionnaires in English and one additional language; and 4) a final reminder including short messages in all 10 languages. For mailings 2 and 3, additional languages were chosen by using flags to identify the language other than English likely spoken at home. Invitation letters requested the household member ages 18 or older who was born outside of the U.S. with the most recent birthday to complete the survey in one of three ways: by going online, dialing into a toll-free number, or returning the completed paper questionnaire. In addition, interviewers attempted outbound calls to telephone numbers that were matched to sampled addresses. ABS respondents completed the survey online (n=2,087), over the phone (n=105), or by mail on paper (n=469). The random sample of addresses was provided by MSG.

The RDD sample of prepaid (pay-as-you-go) cell phone numbers was obtained through MSG. The prepaid cell phone component was disproportionately stratified to effectively reach immigrants from different countries based on county-level information. To increase the likelihood of reaching immigrant adults, counties with higher incidence of immigrants overall, and of certain countries of origin were oversampled.

The callback sample included 132 respondents who were reached by calling back telephone numbers that were previously randomly sampled for SSRS RDD surveys within two years and coded by interviewers as non-English or non-Spanish speaking.  as having respondents speaking languages other than English or Spanish.

Incentives:

Initial mailings to the ABS sample included $2 as part of the invitation package, and respondents received a $10 incentive if they completed the survey in the first two weeks after the initial mailing. In order to increase participation among under-represented groups, the incentive increased to $20 for those who did not respond within the first two weeks. ABS phone respondents received this incentive via a check received by mail, paper respondents received a Visa gift card by mail, and web respondents received an electronic gift card incentive. Respondents in both phone samples received a $25 incentive via a check received by mail.

Questionnaire design and translation:

In addition to collaboration between KFF and the LA Times, input from organizations and individuals that directly serve or have expertise in issues facing immigrant populations helped shaped the questionnaire. These community representatives were offered a modest honorarium for their time and effort to review questionnaire drafts, provide input, attend meetings, and offer their expertise on dissemination of findings.

After the content of the questionnaire was largely finalized, SSRS conducted a telephone pretest in English and adjustments were made to the questionnaire. Following the English pretest, Research Support Services Inc. (RSS) translated the survey instrument from English into the nine languages outlined above and performed cognitive testing through qualitative interviews in all languages including English. The results of the cognitive testing were used to adjust questionnaire wording in all languages including English to ensure comprehension and cohesiveness across languages and modes of interview. As a final check on translation and its overlay into the web and CATI program, translators from Cetra Language Solution reviewed each question, as it appears in the program, and provided feedback. The questionnaire was revised and finalized based on this feedback.

Data quality checks:

A series of data quality checks were run on the final data. The online questionnaire included two questions designed to establish that respondents were paying attention and cases were monitored for data quality. Fifteen cases were removed from the data because they failed two or more quality checks, failed both attention check questions, or skipped over 50% of survey questions. An additional 67 interviews were removed after deemed ineligible by SSRS researchers (they were not U.S. immigrants).

Weighting:

The combined sample was weighted to adjust for the sampling design and to match the characteristics of the U.S. adult immigrant population, based on data from the Census Bureau’s 2021 American Community Survey (ACS). Weighting was done separately for each of 11 groups defined by country or region of origin (Mexico, China, Other East/Southeast Asia, South Asia, Europe, Central America, South America, Caribbean, Middle East/North Africa, Sub-Sahara Africa, all others). The samples were weighted by sex, age, education, race/ethnicity, census region, number of adults in the household, presence of children in the household, home ownership, time living in the U.S., English proficiency, and U.S. citizenship. The overall sample was also weighted to match the share of U.S. adult immigrants from each country/region of origin group. The weights take into account differences in the probability of selection for each of the three sample types. This includes adjustment for the sample design and geographic stratification, and within household probability of selection. Subgroup analysis includes data checks to ensure that the weighted demographics of subgroups are within reasonable range from benchmarks whenever possible.

The margin of sampling error including the design effect for the full sample is plus or minus 2 percentage points. Numbers of respondents and margins of sampling error for key subgroups are shown in the table below. For results based on other subgroups, the margin of sampling error may be higher. Sample sizes and margins of sampling error for other subgroups are available by request. Sampling error is only one of many potential sources of error and there may be other unmeasured error in this or any other public opinion poll. KFF public opinion and survey research is a charter member of the Transparency Initiative of the American Association for Public Opinion Research.

GroupN (unweighted)M.O.S.E.
Total3,358± 2 percentage points
Race/Ethnicity
Black immigrants274± 8 percentage points
Hispanic immigrants1,207± 4 percentage points
Asian immigrants1,318± 4 percentage points
White immigrants495± 6 percentage points
Immigration Status
Naturalized citizen2,134± 3 percentage points
Green card or valid visa holder819± 5 percentage points
Likely undocumented372± 6 percentage points
English Proficiency
Speaks English only or “very well”1,713± 3 percentage points
Speaks English “less than very well”1,635± 3 percentage points

Focus group methodology:

As part of this project, KFF conducted 13 focus groups with immigrant adults across the country to help inform survey questionnaire development, provide deeper insights into the experiences of immigrant groups that had a smaller sample size in the survey, and to provide a richer understanding of some of the survey findings.

Two rounds of focus groups were completed. The first round of 6 groups was conducted between September-October 2022 virtually among participants living across the country who are Hispanic immigrants (conducted in Spanish), Asian (excluding Chinese) immigrants (conducted in English), or Chinese immigrants (conducted in Mandarin Chinese). The groups were separated by gender, lasted 90 minutes, and included 5-7 participants each.

The second round of groups were conducted in-person between May-June 2023 in Los Angeles, CA and Fresno, CA with Hispanic immigrants conducted in Spanish; and in Houston, TX and Irvine, CA with Vietnamese immigrants conducted in Vietnamese. In addition, virtual groups were conducted among participants living in the Texas border region (Hispanic immigrants), the Miami, FL region (Haitian immigrants), and nationally (Black immigrants from sub-Saharan Africa). Groups were mixed gender, lasted between 90 minutes and two hours, and were conducted in English, Spanish, Vietnamese, and Haitian-Creole with 5-8 participants each.

For each group, participants were chosen based on the following criteria: Must be at least 18 years of age and have been born outside of the U.S. and its territories; for groups conducted in languages other than English, must speak English “less than very well” and be able to speak conversationally in the group’s language (i.e., Spanish). In addition, groups were chosen to represent a mix of household composition, including at least some participants who are parents; a mix of household income levels, with a preference for recruiting lower income participants; a mix of health insurance types; and a mix of immigration statuses. Goodwin Simon Strategic Research (GSSR) recruited and hosted the first round of focus groups. PerryUndem recruited and hosted the second round of focus groups. The screener questionnaire and discussion guides were developed by researchers at KFF in consultation with the firms who recruited and hosted the groups. Groups were audio and video recorded with participants’ permission. Each participant was given $150-$175 after participating.

Endnotes

  1. Persons of Hispanic origin may be of any race but are categorized as Hispanic for this analysis and include those who selected u201cHispanic or Latino (such as Mexican, Brazilian, Cuban, or some other Latin American background)u201d when asked to describe their racial and ethnic background. ↩︎

States Obtain Special Waivers to Help Unwinding Efforts

Published: Jan 16, 2024

This policy watch was updated on Jan. 16, 2024 to reflect ongoing policy changes.

As states unwind the continuous enrollment provision and complete redeterminations for all Medicaid enrollees, they face numerous challenges including staffing shortages and outdated systems. More than six months into the unwinding of the continuous enrollment provision, over 14 million individuals have been disenrolled with 71% due to procedural reasons. To give states additional tools to comply with federal renewal requirements, the Centers for Medicare and Medicaid Services (CMS) identified a range of strategies, including the availability of temporary waivers under section 1902(e)(14)(A) of the Social Security Act. Nearly all states adopted one or more of these temporary waivers. As of January 12, 2023, CMS had approved a total of 392 waivers for 49 states and the District of Columbia. At the end of December 2023, growing concern over loss of Medicaid coverage for children prompted federal officials to issue new data showing that adoption of waiver flexibilities influences renewal outcomes for children and additional guidance highlighting strategies to reduce procedural disenrollments. The guidance included an announcement that the waivers will be extended to be available through the end of 2024 (unless approved for a longer duration) instead of being tied to the unwinding period. The Secretary of HHS also sent letters to nine states with large declines in Medicaid child enrollment, urging them to take up additional policy options to prevent disenrollments due to paperwork or procedural issues.

How are states using unwinding waivers?

CMS groups available “1902(e)(14)(A)” waivers into four buckets: options to increase ex parte renewals, supporting enrollees in completing and submitting renewal forms, updating enrollee contact information, and facilitating reenrollment for individuals disenrolled for procedural terminations. States can also request authority to adopt additional strategies to protect enrollees during the unwinding; these waivers are counted in the Other category but discussed in the bucket where the strategy fits in best.

Nearly all states have adopted a range of unwinding waivers
  • Nearly all states (49) have approved waivers to help increase ex parte rates. Ex parte renewals work by eliminating the need for enrollees to submit renewal forms. Instead, state Medicaid staff use administrative data on income and other circumstances to determine eligibility. Of states with waivers in this category, 38 adopted waivers to allow for ex parte renewals for individuals with no income and /or income at or below 100% of the federal poverty level (FPL). Under this option, CMS allows an ex parte renewal if the most recent income determination was no earlier than March 2019 and the state has checked financial data sources and no information is received; without the waiver states would need to conduct new data matches or otherwise document that an individual has no or low-income. Thirty-three states have waivers to allow the state to assume no change in assets if there is no information returned through the asset verification systems or to allow states to renew eligibility based on a simplified asset verification process. More than half of states (27) have waivers to use Supplemental Nutrition Assistance Program (SNAP) or Temporary Assistance for Needy Families (TANF) eligibility to confirm ongoing Medicaid eligibility. Other approved waivers in this category include the use of Title II disability income data, suspending requirements to apply for other benefits, and requiring manual ex parte reviews before terminating coverage.
  • Forty-four states have waivers to update enrollee contact information. Updating contact information is an important step to ensure that renewal forms are sent to the correct addresses. States can obtain updated contact information from the National Change of Address (NCOA) and/or USPS returned mail databases (37 states), MCOs (32 states), enrollment brokers who aid beneficiaries in enrollment (six states), or Programs of All-Inclusive Care for the Elderly (PACE) (six states). Five states have waivers allowing states to obtain contact information from other sources, including Qualified Health Plans and a state-designated Health Information Exchange.
  • Twenty-eight states have waivers to help enrollees complete and submit renewal forms. Twenty-one states have waivers that allow managed care organizations (MCOs) to help enrollees complete sections of their renewal forms, beyond sections relating to managed care plan selection.  Eleven states have waivers that permit applicants and enrollees to designate an authorized representative over the phone without requiring a signed designation. This phone designation enables assisters and others who are helping enrollees complete renewals by phone to provide timely support without waiting for signed documents. Eleven states have flexibilities to waive the recording of telephonic enrollee signatures. One state (Alaska) has a waiver permitting the use of a simplified renewal form.
  • A total of 19 states have waivers to help individuals re-enroll if they were disenrolled for procedural reasons. Seventeen waivers have been approved to reinstate coverage from the date of termination for individuals who were disenrolled for procedural reasons but later found to be eligible. This ensures that any health care services obtained after individuals were disenrolled are covered. Ten states obtained waivers to extend automatic reenrollment into an MCO plan from the standard 60 days up to 120 days. Twenty-four states have waivers to extend the amount of time to take final actions on fair hearing requests beyond the standard 90 days, and two states have other waivers that relate to fair hearing strategies (these are included in the other category). CMS allows waivers to designate state agencies or community organizations, pharmacies, and providers as qualified entities to determine presumptive eligibility for MAGI enrollees who were disenrolled for procedural reasons. However, no states have obtained either of these waivers yet.
  • States vary widely in their use of 1902(e)(14)(A) waivers, ranging from 15 in Indiana and Tennessee to 0 in Florida. There may be several reasons for this variation in uptake related to differences in how state eligibility systems function, the need to address compliance issues, interest in maintaining coverage, and more.
Number of 1902(e)14(A) waivers approved in each state

What are the key issues to watch?

During the unwinding period, CMS has issued guidance on how to mitigate procedural disenrollments using multiple strategies. Data suggests that states that have taken advantage of unwinding flexibilities have reduced procedural terminations and kept more eligible children enrolled. On December 18, 2023 CMS sent letters to the nine states with the highest child disenrollment rates and encouraged them to adopt additional flexibilities to maintain coverage for eligible children, including 1902(e)(14)(A) waivers. CMS also announced that unwinding waivers will remain in effect until at least the end of 2024 and that states can request new waivers up until that point.

Efforts to improve renewal processes and reduce procedural disenrollments will likely last beyond the unwinding period, and CMS and states may look to extend some unwinding flexibilities and/or make some permanent for regular operations. A KFF brief based on interviews with state officials and others in four states provides insights into which waivers have been most effective at achieving the goals of increasing ex parte renewal rates, updating contact information, and reducing administrative burden. Input from these and other states can help to inform CMS decisions over whether to maintain some waiver options.

News Release

More Children are Losing Medicaid Coverage as Child Poverty Grows 

Published: Jan 16, 2024

Children’s Medicaid and Children’s Health Insurance Program (CHIP) enrollment declined by 5.5%, or 2.3 million children, from March 2023, before the unwinding began, to September 2023, according to KFF’s latest analysis. Across all 50 states and DC, at least 14,377,000 people were disenrolled from Medicaid between April 1 and January 9, 2024.

Medicaid eligibility levels are higher for children, raising concerns that they may be losing coverage and becoming uninsured despite remaining eligible. Medicaid covers 8 in 10 children living in poverty and over half of Black, Hispanic, American Indian, and Alaska Native (AIAN) children.The loss of Medicaid could worsen economic stress for many families. Today, as household expenses remain high and most pandemic-era financial relief has ended, families with children are experiencing increased financial hardships and rising poverty rates.Children have the highest official poverty rates of any age group. In 2022, the percentage of children ages 0-18 living in poverty was about 16%. While the official poverty measure remained stable between 2021 and 2022, the supplemental poverty rate for children more than doubled, from 5.2% in 2021 (a record low) to 12.4% in 2022 likely due in part to the expiration of expanded tax credits, including the expanded Child Tax Credit. Supplemental poverty rates were highest in 2022 for children who identify as AIAN (25.9%), Hispanic (19.5%), or Black (17.8%).While children’s poverty rates and Medicaid coverage losses have increased, recent federal actions may help families cover expenses and maintain coverage in the future, including reports of a tentative bipartisan agreement to expand the Child Tax Credit as well as a 12-month continuous coverage requirement for children in Medicaid and the Children’s Health Insurance Program that started in 2024.

Recent Trends in Children’s Poverty and Health Insurance as Pandemic-Era Programs Expire

Published: Jan 16, 2024

After a period of increased federal investment in children and families, pandemic-era programs and federal funding are expiring and overall federal spending on children began to decline in 2022. At the same time, millions are being disenrolled from Medicaid, including children, creating a host of challenges for households with children, who already fared worse throughout the pandemic compared to households without children. In December 2023, growing concern over loss of Medicaid coverage for children prompted the federal government to issue additional guidance with strategies to protect coverage and to write letters nine states with high numbers or shares of Medicaid child enrollment declines urging them to take up policy options to prevent disenrollments due to paperwork, or procedural, issues. Despite recent challenges, there have also been some recent federal actions that may help children and families, including reports of a tentative bipartisan agreement to expand the Child Tax Credit (CTC). This issue brief examines recent trends in children’s poverty rates and the impact of expiring federal aid, explores recent changes in Medicaid coverage for children, and discusses what to watch as families contend with these compounding changes.

Children have the highest official poverty rates compared to other age groups, and rates vary substantially by state (Figure 1). In 2022, the percent of children ages 0-18 living in poverty was 16.1% based on KFF analysis of the American Community Survey. This rate has remained stable in recent years and is higher than the share of adults ages 19-64 (11.7%) and adults 65 and older (10.9%). There is substantial variation in child poverty across states, ranging from 6.6% of children in New Hampshire living in poverty in 2022 to 25.9% of children in Mississippi. The child poverty rate in Puerto Rico, a U.S. territory, is 56.9%. These rates are based on the official poverty measure, which only accounts for pretax cash resources, including cash assistance programs such as social security and unemployment insurance.

Children's Poverty Rates Vary by State

A recent Census Bureau report found that while the official poverty measure remained stable from 2021 to 2022, the supplemental poverty rate for children more than doubled (Figure 2). The supplemental poverty measure (SPM) accounts for pretax cash resources but, unlike the official poverty measure, also includes refundable tax credits (such as the Child Tax Credit (CTC) and Earned Income Tax Credit) and noncash benefits (such as SNAP, school lunches, and WIC) while excluding some necessary expenses (such as taxes or medical expenses). Following the onset of the pandemic, the SPM rate for children fell from 12.6% in 2019 to 9.7% in 2020 and fell again to 5.2% in 2021, a record low. However, the SPM rate more than doubled to 12.4% in 2022, returning to pre-pandemic levels. The expiration of expanded tax credits, including the expanded CTC, and stimulus payments, both included in the SPM but not the official poverty measure, contributed to this increase. The Census Bureau also reported the CTC kept twice as many individuals out of poverty in 2021, when the expanded CTC was in place, compared with 2022 once the expansion had expired.

The Supplemental Poverty Rate for Children Declined During the Pandemic but Has Returned to Pre-Pandemic Levels

The supplemental poverty rate increased from 2021 to 2022 for children across all racial and ethnic groups (Figure 3). From 2019 to 2021, the SPM fell for all racial and ethnic groups shown here and helped narrow percentage point differences in supplemental poverty rates between children of color and White children. Black and Hispanic children experienced the largest SPM declines from 2019 to 2021, decreasing from 20.6% to 8.3% and 20.3% to 8.4%, respectively, which mirrors findings from another survey that found that the expanded CTC in 2021 disproportionately benefited Black and Hispanic families. However, from 2021 to 2022, the SPM more than doubled for most groups. The percentage point differences in supplemental poverty rates between children of color and White children widened once more, and SPM rates returned to pre-pandemic levels for all racial and ethnic groups aside from American Indian and Alaska Native (AIAN) children, whose SPM in 2022 (25.9%) was significantly higher than before the pandemic (14% in 2019). Overall, supplemental poverty rates were highest in 2022 for children who identify as AIAN (25.9%), Hispanic (19.5%), or Black (17.8%). Once the expanded CTC payments expired, a survey found families reported increased financial stress, including Hispanic parents who were more likely to experience difficulty with monthly expenses and food hardship following the expiration compared with White and Black parents.

Along with expiring pandemic-era federal financial relief and rising poverty rates, families have also dealt with the rising cost of household expenses due to inflation, all leading to increased financial hardships for families with children. The share of U.S. households with children in which children faced food insecurity increased from 6.2% in 2021 (or 2.3 million households) to 8.8% in 2022 (or 3.3 million households), meaning around 1 million more families could not provide adequate food for their children (Figure 3). The expiration of the CTC likely contributed to this increase, with one report finding most families used their expanded CTC in 2021 to fund basic needs including food, utilities, housing, clothing or education costs. High inflation over the past year reduced the purchasing power of families, also contributing to increased food insecurity and rising financial hardships. While inflation has cooled in recent months, prices remain much higher than before the pandemic. Other pandemic-era relief that helped families with household expenses, including increased childcare funding and expanded SNAP benefits, have also expired.

Food Insecurity Among Children Increased in 2022

During the Medicaid continuous enrollment period, Medicaid enrollment increased substantially, and the uninsured rate declined. One report found that over half of children in the U.S. were covered by Medicaid or the Children’s Health Insurance Program (CHIP) at one point during the continuous enrollment period. Medicaid also covers 8 in 10 children living in poverty and over half of Black, Hispanic, and American Indian and Alaska Native children. The uninsured rate among children was 5.1% in 2022, down from 5.6% in 2019 and less than half the rate among nonelderly adults (11.3%), largely due to broader availability of Medicaid and CHIP coverage for children than for adults (Figure 4). People who are insured have better access to care and are more likely to receive preventive care or needed services compared with people without insurance. In 2022, nearly one-quarter (24.5%) of uninsured children had not seen a doctor in the past year compared to 5.7% of children with private coverage, and 8.6% of uninsured children went without needed care due to cost compared to less than 1% of children with private coverage. Further, a recent study released by the Congressional Budget Office (CBO) found that Medicaid enrollment in childhood can increase earnings and potentially reduce federal spending in the future.

The Uninsured Rate for Children Declined During the Pandemic

However, amid increases in poverty and financial hardship, millions have recently been disenrolled from Medicaid due to the unwinding of the Medicaid continuous enrollment provision. KFF analysis of national data from the Centers for Medicare and Medicaid Services (CMS) reveals children’s Medicaid/CHIP enrollment declined by 5.5%, or 2.3 million children, from March 2023, before the unwinding began, to September 2023 (Figure 5). Other data through January 2024 show that net Medicaid enrollment declines have reached 3.3 million children. The KFF unwinding tracker shows that in 23 states reporting data, almost 4 in 10 (37%) of those disenrolled are children. Because Medicaid eligibility levels are higher for children and with three-quarters of overall disenrollments happening because of procedural or paperwork reasons, there are concerns that children may be losing coverage and becoming uninsured despite remaining eligible. A recent KFF focus group report found that while some enrollees found the Medicaid renewal process simple, others had difficulty navigating the process and ended up losing their coverage and, in some cases, becoming uninsured. Participants noted that losing Medicaid would be “devastating” and expressed anxiety at the thought of no longer having Medicaid coverage for themselves or their children. The CBO study also found that the loss of Medicaid coverage in childhood could result in reduced GDP and have negative long-term fiscal implications for federal spending.

Children's Medicaid/CHIP Enrollment Declined by 5.5% from March to September 2023

What to watch?

Changes in poverty and family resources have implications for financial security, as does a loss of Medicaid, and, looking ahead, it will be important to track both. Though millions of individuals have already been disenrolled from Medicaid, considerable uncertainty remains as to how overall Medicaid enrollment will change and how many individuals, including children, will become uninsured as the unwinding continues. CMS is also monitoring the unwinding and took action to reinstate coverage for 500,000 individuals (mostly children) who were erroneously disenrolled. The agency also recently released unwinding data revealing that states who have adopted unwinding strategies, including temporary waivers, have been better at maintaining coverage for children. Given this evidence, CMS issued an informational bulletin reminding states about available flexibilities and sent letters encouraging the use of these strategies to the governors of the nine states with the highest disenrollment rates for children.

While children’s poverty rates and Medicaid coverage losses have increased, there have been some recent federal actions that may help children and families cover expenses and maintain coverage in the future. President Biden has repeatedly called for an expansion of the CTC, including proposals in his Build Back Better framework and fiscal year 2024 budget. There have also been various legislative proposals to expand the CTC over the past year, with reports of Congress recently reaching tentative a bipartisan agreement to expand the CTC (although on a somewhat smaller scale relative to the 2021 expansion). Further, as of January 2024, all states are also now required to provide 12-month continuous eligibility for Medicaid and CHIP children, which has been shown to reduce Medicaid disenrollment and churn rates. Three states also recently received approval to extend continuous eligibility for children in Medicaid for multiple years, which could help children maintain coverage beyond one year.

What Are the Implications of the Recent Elimination of the Medicaid Prescription Drug Rebate Cap?

Published: Jan 16, 2024

As of January 1, 2024, the American Rescue Plan Act (ARPA) lifted the cap on the total amount of rebates that Medicaid could collect from manufacturers who raise drug prices substantially over time. Anticipating the implementation of this policy, drug manufacturers have made various changes allowing them to avoid increased rebates resulting from the lifting of the cap. Recent changes that have garnered attention include price cuts for insulin, used to treat diabetes, and the discontinuation of Flovent, a frequently used asthma inhaler. While the insulin price cuts have been portrayed by drug manufacturers as a step to improve affordability, they may in fact be revenue maximizing efforts in response to the changes in the Medicaid rebate formula. This policy watch explains what the rebate cap is, examines how many drugs might be impacted, and explores the implications of recent manufacturer responses on Medicaid programs and enrollees.

What is the rebate cap?

ARPA eliminated the limit on Medicaid drug rebates manufacturers pay starting January 1, 2024. Under the Medicaid Drug Rebate Program, drug manufacturers provide rebates to the federal government and states in exchange for Medicaid coverage of their drugs. The rebate amount includes two main components: a rebate based on a percentage of average manufacturer price (AMP) (or the difference between AMP and “best price,” whichever is greater) and an inflationary component to account for price increases. The AMP is the price charged by drug manufacturers to wholesalers. Because of the inflationary component, the calculated rebate on a drug whose price increases quickly over time could be greater than the AMP for that drug. However, the total rebate amount had been capped at 100% of AMP since 2010. As a result, manufacturers who hit the rebate cap did not face additional Medicaid rebates if they continued to increase prices. Recent KFF analysis found rebates reduced Medicaid spending on prescription drugs by over half each year from fiscal year 2017 through 2022 (Figure 1). However, ARPA, enacted in March 2021, eliminated the 100% AMP cap on Medicaid drug rebates as of January 1, 2024.

Rebates Reduce Gross Medicaid Spending by Over Half Each Year

The lifting of the rebate cap is expected to have a substantial impact on brand drugs, especially those drugs that have already hit the rebate cap or have price increases much faster than inflation over time. A prior KFF analysis of gross prescription drug spending in Medicaid found that more than a third (34%) of drugs had price increases above inflation between 2015 and 2019, though not all these drugs hit the rebate cap. Drugs with fewer drugs in their therapeutic class were more likely to have increases above inflation. Other research has shown that around 15%-20% of all brand drugs have reached the cap. Further, recent MACPAC analysis found a small proportion of all drugs (4.7%) reached the rebate cap in FY 2020 but estimates total rebates would equal 130.8% of gross spending on those drugs without the rebate cap.

What are the implications of lifting the rebate cap?

In response to the elimination of the rebate cap, some drug companies are lowering drug prices or discontinuing drugs in favor of lower priced alternatives to avoid paying additional Medicaid rebates. After years of increasing list prices, insulin manufacturers have recently cut prices of some insulin products up to 80%. The lifting of the rebate cap was a major contributor to this response; research has shown insulin manufacturer Eli Lilly was expected to pay $430 million and Novo Nordisk $350 million in additional rebates to Medicaid in 2024. While these insulin price decreases are quite large, drug manufacturers may not actually see reduced revenues given the rebate payments they will avoid as result. Another drugmaker GSK is cutting prices of some products as well as discontinuing their brand drugs Flovent HFA and Flovent Diskus, frequently used asthma inhalers, and will instead sell a generic alternative, with a lower list price. It remains to be seen how many more drugs will see price cuts or be discontinued, and it can be difficult to predict which drugs or manufacturers will be most affected by the policy change as data on drug AMPs and rebates is currently proprietary. However, an analysis of 2017 data found 25 drugs, most of which were for diabetes treatment, accounted for 85% of rebates reduced by the cap. Manufacturers may also respond in other ways, such as by raising launch prices.

While under current law Medicaid must cover nearly all of a rebating manufacturer’s FDA approved drugs, if a particular drug is discontinued, Medicaid enrollees may experience some administrative challenges when trying to access alternatives. Because Medicaid must cover nearly all of a participating manufacturer’s FDA approved drugs, Medicaid would cover a rebating manufacturer’s new generic (as in the case of Flovent). However, states can use an array of payment strategies and utilization controls to manage pharmacy expenditures, including preferred drug lists and prior authorization (PA) policies linked to clinical criteria, which can impact access. There could be some administrative challenges Medicaid enrollees may need to navigate depending on the state or health plan. Individuals may need to switch prescriptions to a different product on the preferred drug list or get approval to use a non-preferred drug which could lead to delays in accessing prescriptions. Asthma prevalence is higher for people with Medicaid compared with private insurance, and children may be uniquely impacted as the Flovent inhaler made it possible for young children to use the medication. Manufacturer responses may also result in changes in out-of-pocket costs for commercial and uninsured patients; however, Medicaid enrollees usually pay little or no copays for prescription drugs, including for insulin.

Lifting the rebate cap was expected to reduce Medicaid spending, though the level of savings is dependent on how drug companies respond as well as impacted by later provisions in the Inflation Reduction Act (IRA). When enacted, eliminating the rebate cap was projected by the Congressional Budget Office to reduce federal spending by more than $17 billion over ten years. However, cost savings under changes to the rebate cap will be dependent on manufacturer responses to the change in policy. Further, the IRA, passed in 2022, requires drug companies to pay a rebate to the government if drug prices rise faster than inflation in Medicare starting in 2023 (this requirement already exists in Medicaid). The Medicare inflation-related rebates will mean slower growth in drug prices over time, leading to lower Medicaid inflation-related rebates and increased Medicaid drug spending. The lifting of the rebate cap magnifies the effects of the Medicare inflation-related rebates in the IRA on Medicaid.

States and managed care plans may adjust their preferred drug lists (PDLs) as the landscape shifts in response to the lifting of the rebate cap. Rebates are typically higher for brand name drugs, so states sometimes favor brand drugs with high rebates over generics. For example, while this may be shifting, insulin utilization in Medicaid has been largely concentrated among brand-name drugs likely due to high rebate amounts. As prices of brand drugs change and generic drugs come on the market, states may adjust their PDLs to maximize savings. For example, Massachusetts Medicaid has removed the PA requirement for three brand alternatives for Flovent and has added a PA requirement for the generic Flovent. The state will allow the use of the generic Flovent without PA until March to smooth the transition for members. New York Medicaid has made a similar change. States continually take action like this to contain Medicaid prescription drug costs, with over two-thirds of states in KFF’s annual survey of state Medicaid programs reporting new or expanded initiatives to contain prescription drug costs, including significant PDL or rebate changes.

News Release

Florida’s Plan to Import Prescription Drugs from Canada, the First of its Kind, May Face Obstacles that Could Delay Implementation and Savings

Published: Jan 12, 2024

A new KFF policy watch explains some of the hurdles the state of Florida still must clear before it can implement its novel plan to make some prescription drugs more affordable by importing them from Canada.

Florida’s plan represents the first time the Food and Drug Administration (FDA) has granted authority for a state to safely import prescription drugs from another country. However, the state must take some additional steps to move forward with the program and may face other challenges that could delay or even block implementation:

  • Florida officials will need to obtain approval from the FDA for each drug they seek to import. The state also will have to test the quality of such drugs and ensure that drug labels meet FDA standards.
  • The Canadian government has expressed concern about the potential impact of this importation program on the drug supply for Canadians and could impose barriers for importation to the U.S.
  • The drug industry’s lobbying group, the Pharmaceutical Research and Manufacturers of America (PhRMA), has opposed drug importation in the past and may file new legal or administrative challenges to prevent the plan from being implemented.

Beyond implementation challenges, KFF experts unpack other questions related to Florida’s plan, including who will benefit from any savings and what types of drugs will (and will not) qualify for importation. Some of the most expensive drugs, such as biologics, are ineligible for importation.

KFF polling has consistently shown that high prescription drug costs are a concern for the American public and there is strong bipartisan support for many measures to make medications more affordable, including allowing the importation of drugs from Canada.

To see other data and analyses related to efforts to address prescription drug costs, visit kff.org.

Related Resources:


What to Know About the FDA’s Recent Decision to Allow Florida to Import Prescription Drugs from Canada

Published: Jan 12, 2024

For more information, please see: FAQs on Prescription Drug Importation

On January 5, 2024, the FDA authorized the state of Florida to import certain prescription drugs from Canada, an approach designed to give Floridians access to lower drug prices paid by people in Canada. This announcement has received a great deal of attention because it is the first time the FDA has granted authority for a state to safely import prescription drugs from another country. KFF polling has consistently shown that high prescription drug costs are a concern for the American public, with strong bipartisan support for several proposals to make medications more affordable, including allowing the importation of drugs from Canada. However, Florida must now take additional steps before the FDA will allow any drugs to be imported, and could face other obstacles to implementation, meaning Floridians may not see the benefits of these efforts for some time to come.

How did the FDA’s decision come about and what did the FDA authorize Florida to do?

Policymakers from both parties at both the federal and state levels have talked about importation of prescription drugs from other countries as a strategy to lower drug prices for many years. The door to Florida’s new state importation program was opened by a 2020 final rule creating this new pathway to import drugs from Canada and was reinforced by a 2021 executive order from the Biden Administration directing the FDA to work with states to import prescription drugs from Canada. Florida Governor and GOP presidential candidate Ron DeSantis and his administration have been seeking to gain approval to implement an importation plan for over three years.

The FDA has now authorized Florida’s drug importation program from Canada for a period of two years, stating that it met the requirements that importation would provide savings to consumers without sacrificing health and safety. According to the state’s January 5, 2024 press release, this program will save Florida up to $183 million in the first year of implementation, and based on Florida’s October 20, 2023 estimate of cost savings, these savings will accrue to the state’s Medicaid program. Whether any Floridians will pay lower out-of-pocket costs on imported drugs is unclear.

What are the obstacles to implementation?

Even with FDA approval, Florida will need to meet additional requirements before the plan can be implemented and overcome other potential roadblocks. For example, before Florida is permitted to import any drugs from Canada, it will need to submit a pre-import request to the FDA for each drug they seek to import, and can only import that drug if the FDA approves that request. The state of Florida will also be required to conduct quality testing of the drugs and ensure that drug labels meet FDA standards.

It is also possible that the Canadian government may impose barriers for importation to the U.S. Canadian law limits the sale of drugs outside of Canada that could create or worsen supply issues for Canadians. In response to the recent FDA action, Health Canada recently released a statement saying, “the Government of Canada is taking all necessary action to safeguard the drug supply and ensure Canadians have access to the prescription drugs they need” and added, “bulk importation will not provide an effective solution to the problem of high drug prices in the U.S.”

Other interested parties, including the Pharmaceutical Research and Manufacturers of America (PhRMA), may also seek to prevent the plan from being implemented, and PhRMA has previously filed a lawsuit and citizen petition challenging the importation pathway. Soon after the FDA issued its response to Florida, PhRMA issued a statement saying that importation of drugs from Canada “poses a serious danger to public health.”

Will all Floridians benefit and which drugs will qualify?

Florida’s importation program is limited both in terms of who could be helped and which drugs could potentially be imported. Imported drugs will only be available for people receiving services through certain state agencies and government programs, including people covered under Medicaid, people served through county health departments, and others residing in certain state facilities. The program does not extend to people with other types of insurance, such as employer insurance, or the uninsured.

Drugs that Florida may initially import include those that treat HIV/AIDS, mental health conditions, and prostate cancer. But certain types of drugs are excluded, such as biological products (including insulin), which are often very expensive, and infused drugs.

What is the significance of the FDA’s approval?

The FDA’s approval of Florida’s importation plan represents a political victory for the state in its long-standing efforts to implement its program, but this victory may be more symbolic than real when it comes to the impact on drug prices overall for the state’s residents. The Biden Administration can also notch another policy win in the area of drug spending, on top of its other actions to lower prescription drug costs included in the Inflation Reduction Act of 2022. Among the drug pricing provisions in this law are a cap on insulin copays under Medicare, a cap on annual out-of-pocket costs for retail prescriptions under Medicare Part D, and requiring the federal government to negotiate the price of some high-spending drugs under Medicare.

With states eager to adopt various approaches to tackle the problem of high drug prices, the FDA’s green light to Florida for its importation program is likely to encourage other states to make similar moves in this direction. But Florida’s importation program still faces obstacles before it can be implemented, and even then, its reach and impact may be somewhat limited, meaning that the issue of high drug prices is likely to remain top of mind for the public.

A photo illustration representing a timeline of significant U.S. federal policies and events that have influenced present-day health disparities

How History Has Shaped Racial and Ethnic Health Disparities

A Timeline of Policies and Events

This timeline offers a historical view of significant U.S. federal policies and events spanning the early 1800s to today that have influenced present-day health disparities. It covers policies that directly impacted health coverage and access to care, relevant events in medicine, social and economic policies and developments that influence health, and efforts to tackle inequalities. Some events impacting people of color, like the Louisiana Purchase, Westward Expansion and the Transatlantic Slave Trade, predate this timeline. While not exhaustive, the timeline aims to provide context for addressing disparities, acknowledging the complex history that shapes racial and ethnic health and health care disparities that persist today.

Type of policy or event:

  • Health & Medicine
  • Broader Policies

1808 to 1890

Medical Exploitation of Enslaved Black Women

Copy link to Medical Exploitation of Enslaved Black Women

The importation of enslaved people from foreign countries was outlawed in 1808. This ban had profound economic implications, as it increased the value of the existing enslaved populations and spurred slave owners to focus on their reproductive viability, contributing to medical experimentation on enslaved women. For example, while renowned for his contributions to the field of obstetrics and gynecology, Dr. J Marion Sims developed new surgical techniques through medical experiments on enslaved women, including Anarcha, Lucy, and Betsey in Alabama from 1845 to 1849. Dr. Francois Marie Prevost honed his cesarean surgical procedure by practicing on at least 30 enslaved women in Haiti and Louisiana during the 1830s. Dr. Ephraim McDowell, considered the father of abdominal surgery, developed surgical treatments for ovarian cancer in the early 1800s, often on enslaved women. The experimental procedures were often conducted without anesthesia due to the inaccurate belief that Black people felt less pain than White people. This racial bias in pain perception persists in modern medicine, affecting the way medical students and residents view and treat pain among different racial groups. In recent years, there have been efforts to reevaluate the ethics of these physicians’ work and acknowledge the exploitation of enslaved women in the development of modern reproductive surgical procedures, especially in the context of the ongoing maternal health crisis.

Federal Indian Boarding Schools

Copy link to Federal Indian Boarding Schools

While first initiated in 1819, the U.S. implemented policies establishing and supporting Indian boarding schools across the nation into the late 20th century. These schools were designed to culturally assimilate American Indian, Alaska Native (AIAN), and Native Hawaiian children by forcibly removing them from their families and communities as part of efforts to dispossess them from their native lands. The children suffered severe abuse and neglect. Many children died at these institutions and were buried in unmarked and marked graves on the school grounds. In 2022, an investigation by the Bureau of Indian Affairs identified ongoing impacts of the school system, including loss of life, territories and wealth, negative impacts on physical and mental health and Tribal and family relations, and erosion of the use of Tribal languages as well as religious and cultural practices. 

The Indian Removal Act and the Trail of Tears

Copy link to The Indian Removal Act and the Trail of Tears

The Supreme Court’s Johnson v. McIntosh decision established legal doctrine surrounding Indigenous ownership of land in 1823. The decision determined that American Indian people did not have legal ownership of the land they inhabited, laying down the foundation for the forced displacement of American Indian Tribes. The Indian Removal Act of 1830 authorized the forced relocation of American Indian Tribes from the Southeast U.S. to the Midwestern and Western parts of the country and started the Trail of Tears. The forced resettlement resulted in approximately 100,000 American Indian people losing their lives, homes and Tribal lands. The loss of lands and people from this period resulted in a substantial loss of Indigenous knowledge, languages, and traditions and continues to impact American Indian people today. 

Dred Scott v. John F.A. Sandford

Copy link to Dred Scott v. John F.A. Sandford

Dred and Harriet Scott, enslaved persons in the state of Missouri, sought freedom from their enslavers in 1846 under the assumption that their temporary residence in a free state/territory freed them from slavery. Their judicial fight for freedom continued for 11 years and gained notoriety as slavery became a major political issue in the U.S. In 1857, Chief Justice Taney read the majority opinion stating that enslaved people were not citizens of the U.S. and, therefore, could not file cases at the federal level. Further, it established that the federal government did not have the power to prohibit slavery in its territories.

The Emancipation Proclamation

Copy link to The Emancipation Proclamation

The proclamation declared the end of slavery in the Confederacy. While it did not codify the illegality of slavery, it signaled a shift in the purpose of the Civil War from one that focused on the preservation of the Union to one that was focused on the end of slavery. The Emancipation Declaration was a significant milestone that helped pave the way for the Reconstruction Amendments that outlawed slavery and involuntary servitude.

Reconstruction Amendments

Copy link to Reconstruction Amendments

The Thirteenth, Fourteenth, and Fifteenth Amendments, collectively known as the Reconstruction Amendments, outlawed slavery and involuntary servitude; granted citizenship to anyone born in the U.S. and equal protection to all people; and extended the right to vote to Black men, respectively. The Reconstruction Amendments were designed to enforce the declaration of the end of slavery, provide equality for freed Black people, and provide people with legislative pathways to uphold equal rights and treatment under the law. However, they were quite unsuccessful in fulfilling their objectives, particularly in states where lynchings, Black Codes, and Jim Crow laws were established to further disenfranchise Black people. The Reconstruction Amendments served as foundational documents for the civil rights movements of the 1950s and 1960s, as well as other equal rights movements.

Freedmen’s Bureau Acts of 1865 and 1866

Copy link to Freedmen’s Bureau Acts of 1865 and 1866

The Acts established a Bureau for the Relief of Freedmen and Refugees whose role was to provide social, economic, and occupational resources to displaced Southerners and freed Black people after the Civil War. Like many other Reconstruction Era actions, the Bureau was shut down in 1872 due to pervasive racism and lack of funding. The Freedmen’s Bureau is recognized as one of the earliest examples of race-conscious or affirmative action in the U.S. The Bureau has a complicated legacy because, while it provided medical assistance to more than a million freed people and established over 1,000 schools for Black people in the American South, including Historically Black Colleges and Universities, it made little to no headway in land redistribution and the advancement of civil rights for Black people. 

Alaska Purchase

Copy link to Alaska Purchase

The U.S. purchased Alaska from Russia on October 18, 1867 as part of American expansionist efforts. The Alaska Purchase, also known as the Treaty of Cession, excluded Alaska Natives from the rights provided to White people under the new U.S. government, including ownership of most of the land. Prior to the Alaska Purchase, the Alaska Native population had already dwindled due to the introduction of new diseases by the Russians. After the U.S. took over, the Alaska Native population continued to experience disenfranchisement and loss of their ancestral lands. In 1921, the Snyder Act eventually provided them full citizenship and the right to vote, and, in 1971, President Nixon ceded 44 million acres of federal land back to Alaska Native people.

Historically Black Medical Schools

Copy link to Historically Black Medical Schools

Historically Black Colleges and Universities (HBCUs) are institutions of higher education that were established before 1964 to educate persons of African descent. HBCUs were founded in response to the exclusion of African American students from traditional colleges and universities due to segregation. In the late 19th century, there were seven Black medical colleges. After the 1910 Flexner report, only two remained — Meharry Medical College and Howard University. Today, Black doctors remain underrepresented in the health care workforce, and HBCU graduates make up 70% of Black doctors and dentists.

Chinese Exclusion Act

Copy link to Chinese Exclusion Act

The law implemented a ten-year ban on Chinese laborers immigrating to the U.S., representing the first example of federal law restricting entry of an ethnic group. The initial ten-year ban was extended until 1943, ending after China and the U.S. established an alliance during World War II. The Act was informed by the 1877 Joint Special Committee to Investigate Chinese Immigration, which found that White laborers opposed Chinese immigration out of fear of loss of employment due to the low wage labor provided by Chinese immigrants. The Exclusion Act set a precedent for restricting immigration on the basis of race and fueled xenophobic sentiment and mistreatment of Chinese people in America that is still present today and rose amid the COVID-19 pandemic.

Dawes Act and the Dawes Commission

Copy link to Dawes Act and the Dawes Commission

As part of efforts to break up reservation and Tribal lands, the Dawes Act authorized the president to distribute reservation land commonly held by Tribal members into allotments to individuals. In addition, the Dawes Commission created methods for identifying Tribal membership, including the development of the Dawes Rolls that identify ancestry through Tribal lineage. In the 1930s, some Tribes began using blood quantum requirements to determine eligibility for land distribution and other entitlements. While the policy was portrayed as an effort to protect American Indian property rights and alleviate poverty among American Indians, it reflected beliefs that American Indian people should assimilate to White culture and principles. These policies contributed to weakening of Native American conditions, as the land allotted to individuals included areas that were unsuitable for farming, some nomadic Native cultures did not easily adapt to an agricultural existence, and millions of acres of Tribal land were ultimately lost when sold to non-Native people.

1891 to 1899

Immigration Act of 1891

Copy link to Immigration Act of 1891

The Act centralized the immigration enforcement authority of the federal government, extended immigration inspection to land borders, and expanded the list of excludable and deportable immigrants to include people who are likely to become a public charge, as well as those with infectious diseases. The law was passed during a period of increased immigration into the U.S. and led to further immigration exclusions following the Chinese Exclusion Act in 1882. The 1891 law set precedent for the Immigration Acts of 1903, 1907, and 1917, which established health and certain work status restrictions as well as literacy requirements for immigration that resulted in limiting immigration primarily from Asia and Mexico and reinforcing xenophobic sentiment.

U.S. Public Health Service (USPHS) Medical Inspections of Immigrants

Copy link to U.S. Public Health Service (USPHS) Medical Inspections of Immigrants

With increasing immigration starting in the 1880s and through the next century and growing concern about job displacement by immigrants and the potential spread of infectious diseases, the USPHS carried out medical examinations of immigrant populations entering the U.S. and identified whether they would become public charges (i.e., likely to become dependent on the government for support). In the late 19th and early 20th century, Asian and Mexican immigrants and Jewish immigrants from Eastern Europe were disproportionately impacted by these activities. Public charge determinations continue to be applied to immigrants in the U.S. today. The Trump Administration made changes to public charge determinations that extended them to take into account the use of non-cash government programs, including health care. These changes have since been rescinded by the Biden Administration, although many immigrant families continue to have fears and concerns about accessing health care and other non-cash assistance programs even if they and/or their children are eligible.

Plessy v. Ferguson

Copy link to Plessy v. Ferguson

This Supreme Court ruling validated racial segregation by finding that the equal protection principles mandated by the Fourteenth Amendment could be honored with facilities that were “separate but equal.” Plessy v. Ferguson occurred in the aftermath of Reconstruction, during a time when conservative Democrats sought to roll back the gains made by Black people. The ruling has had long-term negative impacts on Black people’s access to opportunities, including quality health care, particularly in states that adopted laws upholding segregation within medical facilities, agencies, and societies. The legacy of the “separate but equal” ruling continued through state and local statutes (Jim Crow laws) through the mid-1960s (until its abolition by the Civil Rights Act in 1964). Ultimately, the combined effects of these statutes denied Black people the right to vote and attain educational or vocational opportunities, contributing to income, wealth, and health inequities that persist today.

Annexation of the Republic of Hawai’i

Copy link to Annexation of the Republic of Hawai’i

Sanford Dole and the U.S. government dethroned the Hawaiian monarch Queen Lili’uokalani, following concerns that Hawai’i may become part of the European empire. Hawai’i, an independent sovereign nation, was officially annexed in 1898, as part of U.S. efforts to extend its territory and political power in the Pacific. Following Hawai’i’s occupation by Western people in the 1800s, the Native Hawaiian population was decimated due to the introduction of multiple infectious diseases, and their language and culture eroded with the institution of Christian and English boarding schools, as well as U.S. Federal Indian Boarding Schools. Despite some efforts by the U.S. government to make amends for the overthrow of Hawai’i’s monarchy, the legacy of colonization and cultural genocide contribute to ongoing health disparities for Native Hawaiian people.

The Spanish-American War

Copy link to The Spanish-American War

The peace treaty signed at the end of the war between the U.S. and Spain in 1898 provided independence to Cuba and gave the U.S. control of Puerto Rico, Guam, and the Philippines, with the Philippines eventually gaining independence in 1946. While residents of Puerto Rico and Guam are U.S. citizens, they are denied voting rights. The U.S. occupation and actions in these areas have had adverse impacts on the health of local and Indigenous people due to exposure to residual toxic waste disposed by the U.S. military and destruction of fertile land, negatively impacting diets and contributing to high rates of chronic conditions.

1900 to 1929

American Eugenics and the Forced Sterilization of Women of Color and Low-Income Women

Copy link to American Eugenics and the Forced Sterilization of Women of Color and Low-Income Women

The American Eugenics movement had origins in emerging theories of White supremacy and the belief that society would be improved without physical or mental illness. The American Eugenics movement eventually became legalized through eugenic sterilization laws in the early 1900s. Forced sterilization efforts targeted low-income communities of color as well as people with disabilities. In 1927, the U.S. Supreme Court made a decision in Buck v. Bell that upheld the Virginia Eugenical Sterilization Act of 1924, allowing the Commonwealth to sterilize people they considered to be unfit to have children. The decision helped pave the way for the enactment of other state sterilization laws. A study by the U.S. General Accounting Office found that between the years 1973-1976, more than 3,000 American Indian and Alaska Native women were sterilized without their permission. The mass sterilizations were influenced by the Family Planning Services and Population Research Act of 1970, which subsidized sterilizations for Medicaid and Indian Health Service patients. In 1974, a case found that two adolescent Black sisters in Montgomery, Alabama were coerced into federally funded sterilizations. The case revealed that many women of color had been sterilized under government programs. As a result of this case, a requirement was established for doctors to obtain informed consent before performing sterilization procedures. Evidence suggests that inappropriate sterilization practices have continued in the modern day, including among women detained by U.S. Immigration and Customs Enforcement.

The Flexner Report

Copy link to The Flexner Report

The Flexner report was a landmark study funded by the American Medical Association and the Carnegie Foundation to assess the state of medical education in Canada and the U.S. The report’s recommendations contributed to the closure of five out of seven established medical schools that primarily trained Black physicians. In subsequent years, the number of trained Black physicians diminished greatly, while the number of White physicians increased. Today, Black physicians remain underrepresented in the health care workforce, with most of them training at the remaining two historically Black medical schools: Meharry Medical College and Howard University. In 2008, the American Medical Association issued a public apology for its past discriminatory practices against Black physicians and has since developed a policy and strategic framework aimed at addressing health equity, including creating a Center for Health Equity.

Tulsa Race Massacre

Copy link to Tulsa Race Massacre

The destruction of Tulsa was a continuation of many racially-motivated massacres that began in 1917 and continued into the early 1920s. Known as the Red Summer, this period was marked by violence against Black people and was influenced by the Great Migration of Black people from the South to the Northern U.S. and the return of Black veterans from World War I. The Tulsa massacre was one of the worst instances of racial violence in U.S. history and resulted in the displacement of approximately 10,000 people and the destruction of nearly 1,500 homes and businesses. Estimates of mortality from this event range from 30 to 300 deaths. In 1997, Oklahoma formed the Tulsa Race Riot Commission to document and investigate the Tulsa massacre.

Ozawa v. United States, United States v. Thind, and The Immigration Act of 1924 (Johnson-Reed Act)

Copy link to Ozawa v. United States, United States v. Thind, and The Immigration Act of 1924 (Johnson-Reed Act)

In 1922 and 1923, the Supreme Court ruled that Takao Ozawa and Bhagat Singh Thind were ineligible for naturalization because they were not White. Following the United States v. Thind ruling, many Asian Indian American people who had been naturalized had their citizenship status rescinded. The Immigration Act of 1924 continued the legacy of exclusion of Asian immigrants from entry into the U.S., particularly people from Japan. These two Supreme Court cases and the exclusionary immigration policies of the time specified that Asian people were not “free White persons” and, therefore, were excluded from becoming naturalized U.S. citizens. These policies were enacted following the Red Scare of 1919-1920, a period when many people in the U.S. feared the rise of perceived support of communist, socialist, or anarchist ideology, which prompted nationalist ideologies within the U.S. and fears of immigrants and foreigners.

Snyder Act

Copy link to Snyder Act

The Snyder Act gave U.S.-born American Indian people full citizenship and provided them with the right to vote (as American Indian people had been excluded from voting rights despite the passage of the Fifteenth Amendment in 1870). However, states did not implement voting rights universally for American Indian people until nearly a half-century following the Snyder Act. The exclusion of American Indian voters persists today via voter registration and literacy barriers, as well as poor investment into resources and infrastructure on reservations.

1930 to 1939

The U.S. Public Health Service (USPHS) Untreated Syphilis Study at Tuskegee

Copy link to The U.S. Public Health Service (USPHS) Untreated Syphilis Study at Tuskegee

The Untreated Syphilis Study at Tuskegee was a 40-year experiment conducted by the U.S. Public Health Service that studied the progression of untreated syphilis in 600 poor, Black sharecroppers without their consent. Participants were told they were receiving free government medical care but not that they had syphilis. They were left untreated when treatment for syphilis became available so researchers could study the progression of the disease. Years later, in 1974, the National Research Act created the National Commission for the Protection of Human Subjects of Biomedical and Behavioral Research, which developed principles of ethical research conduct and informed consent standards. The history of Tuskegee and other instances of medical experimentation on Black people is one factor contributing to mistrust of researchers and the health care system and has contributed to increased mortality among Black men due to decreased use of health care services. In 2024, the CDC Foundation launched an endowed scholarship program to support the Voices For Our Fathers Legacy Foundation scholarships in recognition of the experiences of the Black men involved in the Untreated Syphilis Study at Tuskegee. The program seeks to raise a $5 million endowment that will provide annual $100,000 scholarships for the descendants of the Black men who were a part of the study.

The Home Owners’ Loan Corporation Act

Copy link to The Home Owners’ Loan Corporation Act

The Home Owners’ Loan Corporation was authorized by the federal government to grade residential neighborhoods based on their mortgage security. Neighborhoods that were considered low risk for banks and other mortgage lenders were marked green, while neighborhoods that were considered hazardous were marked red (redlining). One of the factors that determined the grading of neighborhoods was the racial makeup of the community that lived there. Redlining resulted in racial segregation and large inequities in economic opportunity that have ongoing negative associations with health today, including disproportionate exposure to environmental health risks, such as extreme heat.   

The Social Security Act (SSA) and Social Security Amendments

Copy link to The Social Security Act (SSA) and Social Security Amendments

Amidst the Great Depression, the SSA was passed to create a federal safety net and general welfare system for older adults, persons who were unemployed, and persons with disabilities. In 1954, the SSA Amendments initiated a disability insurance program (Social Security Disability Insurance) providing additional economic protections for workers with disabilities aged 50-64 and for retired or deceased workers’ dependent adult children who developed disabilities before the age of 18. Social Security plays a large role for income in retirement for people of color, who are less likely to have accumulated wealth or benefits from pensions or retirement savings, which has implications for health. Research suggests that the improvements in socioeconomic status resulting from the Social Security program are associated with improvements in health among older adults in the U.S., including declines in mortality.

Title V Maternal and Child Health Block Grant Program

Copy link to Title V Maternal and Child Health Block Grant Program

Enacted as part of the Social Security Act, the Title V program’s original purpose and design focused on addressing the impacts of poverty on maternal and child health following the Great Depression. Today, the program provides grant funding to states and jurisdictions to provide services to pregnant women, infants, and children, including children with special health care needs.

National Labor Relations Act (NLRA)

Copy link to National Labor Relations Act (NLRA)

The NLRA expanded union rights resulting in higher wages and benefits (such as health insurance) but excluded multiple industries (such as service, domestic, and agricultural workers and independent contractors) and allowed unions to discriminate against workers of color in other industries. The Fair Labor Standards Act passed in 1938 established standards pertaining to minimum wage, overtime pay, recordkeeping, and youth employment, but also excluded agricultural workers until the 1960s. The NLRA’s exclusion of domestic and agricultural industries had disproportionate impacts on people of color, resulting in a higher proportion of people of color working in lower-earning jobs and in jobs that do not provide benefits, including health insurance.

1940 to 1959

Japanese American Incarceration During World War II (WWII)

Copy link to Japanese American Incarceration During World War II (WWII)

In reaction to the attacks on Pearl Harbor and the ensuing war, President Roosevelt signed an Executive Order that established Japanese incarceration camps, wherein people of Japanese descent, including U.S. citizens, were incarcerated. The Supreme Court ruled incarceration camps during WWII as constitutional despite the inhumane conditions of the camps. In addition to forced displacement and loss of livelihood, Japanese American people lived under hazardous conditions in the camps. They experienced long-term health impacts including post-traumatic stress disorder and poorer physical health, which have ongoing intergenerational impacts on health and well-being today. In recognition of the harms done to Japanese American people during their incarceration in WWII, the Office of Redress Administration (ORA) was established under the Civil Liberties Act of 1988. The ORA was tasked with administering a ten-year restitution program that provided a non-taxable $20,000 payment to eligible people of Japanese ancestry.

Hospital Survey and Construction Act

Copy link to Hospital Survey and Construction Act

The Hospital Survey and Construction Act (informally known as the Hill-Burton Act) provided construction grants and loans to build public hospitals in high need areas. Many facilities in the South used Hill-Burton funds, which disallowed blatant discrimination against Black patients but continued to codify the idea of “separate but equal.” Federal funds from the Act were used to build, maintain, and expand “separate but equal” hospitals and other health facilities that segregated patients and medical providers by race. Following growth in hospital capacity resulting from the funds, a study found that, in the South, only 6% of hospitals offered unrestricted services to Black people, 31% did not admit any Black people to their facilities under any conditions, and 47% had segregated wards for White and Black people, while in the North, 83% of hospitals reported some degree of integrated services.

HeLa Cell Line

Copy link to HeLa Cell Line

Following her death due to cervical cancer in 1951, scientists at Johns Hopkins Hospital took and used samples of cancerous cells for medical research from Henrietta Lacks, a 31-year-old Black mother of five from Virginia, without her or her family’s knowledge or consent. Lacks’ cells have become one of the most vital cell lines (HeLa Cell Line) in medical research and have been used to develop the polio vaccine and in cancer, AIDS, and COVID-19 research. The use of Lack’s cells is part of a long line of non-consensual and uninformed medical research and experimentation practices on Black people. In recent years, scientific boards have revised the Federal Policy for the Protection of Human Subjects (The Common Rule) to increase protections of people who participate in research studies. Johns Hopkins recognizes that the collection of Lacks’ cells was reflective of the lack of consent laws in the 1950s and that the practice would be considered unethical today. Over the years, Johns Hopkins has worked with the Lacks family to honor Henrietta Lacks and her contribution to science and health advancement as well as to improve research practices.

The Immigration and Nationality Acts (INA) (McCarren-Walter Act and the Hart-Celler Act)

Copy link to The Immigration and Nationality Acts (INA) (McCarren-Walter Act and the Hart-Celler Act)

The INA of 1952 reformed aspects of immigration law, including ending Chinese exclusion from immigration and adding an immigration system of preference for skilled workers and those who were family members of U.S. citizens and lawful permanent residents. However, the law still upheld the national origins quota that mainly affected people of Asian origin. The INA of 1965 reversed the U.S. policy of restricting immigration by national origin, banning discrimination in the issuance of visas by “race, sex, nationality, place of birth and/or residence.” The shift in policy reflected the rapidly changing global geopolitical climate, with many countries in Asia, Africa, and Central and South America gaining independence and the formation of multilateral organizations. After the passage of the law, the U.S. experienced a large increase in immigration and a reversal of trends, with a dramatic decrease in the proportion of immigrants from Europe and an increase in immigration from other regions.

“Operation Wetback”

Copy link to “Operation Wetback”

The derogatory termed “Operation Wetback” initiative resulted in the deportation of at least one million Mexican people. The program was enacted during a time when Southwestern states were reliant on agricultural labor from Mexico and encouraged temporary migration into the U.S. through the Bracero Program. In 1951, a Commission on Migratory Labor released a report that blamed Mexican workers for low wages and expressed concerns that returning soldiers and citizens would be unable to find work in the Southwest. The cross-border collaboration between the Mexican and U.S. governments during “Operation Wetback” expanded migration control along the U.S.-Mexico border. “Operation Wetback” was a continuation of a pattern of deportation of Mexican and Mexican American people, including the repatriation of close to 2 million Mexican and Mexican-American people during the 1930s. The mass deportation of immigrant populations and people of color during difficult economic times has occurred throughout American history and was brought back to the forefront of American consciousness during the Trump Administration. 

Brown v. Board of Education

Copy link to Brown v. Board of Education

The National Association for the Advancement of Colored People (NAACP) began challenging segregation in public education in the late 1940s by encouraging Black parents to enroll their children in all-White schools. The all-White schools rejected the Black students’ applications. Following the rejections, the NAACP filed class action lawsuits that claimed that the education offered at Black schools was inferior to that offered at White schools, which violated the Fourteenth Amendment equal protection clause. The Supreme Court agreed and ruled that having separate educational facilities for Black and White students was unequal. The Brown v. Board of Education decision struck down the “separate but equal” doctrine of the Plessy v. Ferguson decision and was a key precursor to the Civil Rights Movement.

Establishment of the Indian Health Service (IHS)

Copy link to Establishment of the Indian Health Service (IHS)

The federal government has a trust responsibility to meet the health care needs of American Indian and Alaska Native people. Established in 1955, the IHS is the primary mechanism through which the federal government fulfills its trust responsibility to provide health care to AIAN people. However, the IHS is not health insurance and has been historically underfunded and unable to meet their health care needs. AIAN people continue to have lower life expectancies than other racial and ethnic groups and fare worse across numerous health measures. 

Civil Rights Movement

Copy link to Civil Rights Movement

The mid-1900s were marked by a Black people-led nationwide movement that included sit-ins in North Carolina, the Montgomery bus boycott, the March on Washington, and other key events that sought to end racial segregation and achieve equal rights. In 1957, President Eisenhower enacted the Civil Rights Act of 1957, which established the Civil Rights Section of the Justice Department and the federal Civil Rights Commission. It provided the federal government with the ability to investigate obstacles to individuals’ right to vote and instances of discrimination, as well as to develop solutions to address them.

1960 to 1969

President’s Committee on Equal Employment Opportunity and Affirmative Action

Copy link to President’s Committee on Equal Employment Opportunity and Affirmative Action

President Kennedy established the President’s Committee on Equal Employment Opportunity via Executive Order and required government employers to practice nondiscrimination in their hiring practices and “take affirmative action to ensure that applicants are employed and that employees are treated during employment, without regard to their race, creed, color, or national origin.” The Executive Order was implemented in the wake of World War II and during the Civil Rights Movement. As military members began returning to the U.S., gains made by people of color and women in employment and other sectors began to recede. The Executive Order sought to rectify this situation and ensure equitable hiring practices.

Simkins v. Moses H. Cone Memorial Hospital

Copy link to Simkins v. Moses H. Cone Memorial Hospital

Dr. Simkins, a dentist frustrated with the conditions of the all-Black hospitals he worked in, filed a lawsuit against two local hospitals with the assistance of the National Association for the Advancement of Colored People. Dr. Simkins won this landmark federal case, arguing that the hospitals, as Hill Burton funding recipients, failed to provide equal protection as required by the Constitution. The case set the precedent for ending overt segregation and discrimination in hospital settings. The 1964 Civil Rights Act prohibited programs that receive federal funds from discriminating on the basis of race, creed, or national origin. The subsequent establishment of Medicare in 1965, which included federal funding to support hospitals and made them subject to the Civil Rights Act, led to the eventual desegregation of hospitals and health care facilities.

Supplemental Nutrition Assistance Program (SNAP)

Copy link to Supplemental Nutrition Assistance Program (SNAP)

SNAP was established by the U.S. Department of Agriculture to address food insecurity and hunger in the U.S. by providing support to lower income families. SNAP grew out of the Food Stamps program, which was introduced in the 1930s during the Great Depression to address poverty and food insecurity. Overall, people of color are more likely to experience food insecurity and to have incomes below poverty compared to White people. Research shows that SNAP reduces poverty and food insecurity, promotes positive health outcomes, lowers health care costs, and reduces disparities in food insecurity.

Federally Qualified Health Centers and the Health Center Program

Copy link to Federally Qualified Health Centers and the Health Center Program

The Economic Opportunity Act of 1964 was passed as part of efforts to combat poverty in the U.S. The Act sought to increase educational and training opportunities to expand employment options and to address many social and economic drivers of poverty. A major health-related legacy of the Economic Opportunity Act was the development of Federally Qualified Health Centers or community health centers (CHCs). The nation’s first CHCs were launched in 1965 as part of a small demonstration program within the Office of Economic Opportunity and made permanent by Congress. CHCs were placed in areas with high levels of poverty and were tasked with providing comprehensive health services to low-income residents of those neighborhoods. Today, hundreds of CHCs across the U.S. serve low-income, medically underserved communities. Some health centers focus on meeting the needs of specific populations. For example, members of the Association of Asian Pacific Community Health Organizations are located in areas with high concentrations of medically underserved Asian American, Native Hawaiian, and Pacific Islander people and lead efforts to provide linguistically and culturally appropriate care for these groups. The federal Migrant Health Program funds health centers across the country that specialize in providing care to farmworkers and their families.

Civil Rights Act and the Voting Rights Act

Copy link to Civil Rights Act and the Voting Rights Act

The Civil Rights Act of 1964 and the Voting Rights Act of 1965 prohibited discrimination by race, sex, religion, color, or national origin, enforced the desegregation of schools, and guaranteed the right to vote as well as equality in employment, use of and access to federally funded programs, and access to public areas. While the Civil Rights Acts did not end discrimination, they ended the Jim Crow era laws and provided legal and legislative avenues for people to uphold these ideals and challenge instances of discrimination and inequitable treatment. The impact of the Voting Rights Act was immediate; a quarter of a million new Black voters were registered in 1965. Research suggests that civil rights protections for people of color have positively impacted health.

Legacies of Malcolm X and Dr. Martin Luther King Jr.

Copy link to Legacies of Malcolm X and Dr. Martin Luther King Jr.

Dr. Martin Luther King Jr. and Malcolm X were prominent leaders of the Civil Rights Movement. While both leaders had different approaches to addressing racial inequality, they had shared missions of uplifting Black people within the U.S. and globally. Malcolm X was assassinated in 1965 and his legacy continues to this day. He popularized Black pride, autonomy, and independence among Black people. Dr. Martin Luther King was assassinated in 1968; his liberation work continues to inspire civil rights movements and liberation movements across the globe.

The Chicano Movement

Copy link to The Chicano Movement

The Chicano Movement sought to achieve equity in labor and politics for Mexican American people. Amid growing political and social activism following World War II, the National Farm Workers Association (NFWA) was founded by Cesar Chavez and other Chicano activists to defend farmworker rights. The NFWA was a predecessor to the United Farm Workers Organizing Committee, which made major gains in voter registration among Mexican American people, gained labor contracts, and improved working conditions for farmworkers. The Chicano Movement has had many impacts including increased equality in education and increasing Mexican American representation among teaching staff, working to ensure that health care forms are available in both Spanish and English, and solidifying the Hispanic community as an important voting bloc in the U.S.

Medicare and Medicaid

Copy link to Medicare and Medicaid

The 1965 Social Security Amendments (SSA Amendments) established Medicare as a nationwide health insurance program for adults age 65 and older and some younger people with disabilities. The SSA Amendments also established Medicaid as a joint federal-state health insurance program for certain low-income adults and children and long-term care program for adults 65 and older and younger adults with disabilities. Medicare and Medicaid were preceded by the Kerr-Mills Act in 1960 that provided funds to states that chose to cover health care services for older adults with incomes above levels needed to qualify for public assistance. Today, Medicaid, along with the Children’s Health Insurance Program, which was established in 1997, provide health and long-term care coverage to millions of low-income individuals in the U.S. and are a key source of funding for hospitals, community health centers, physicians, and nursing homes. Medicaid is a major source of coverage for people of color, helping to ensure access to care and providing financial protection from health care costs. Medicare provides coverage to more than 60 million people ages 65 and older and younger adults with long-term disabilities. Nearly a quarter of beneficiaries are people of color. The program has helped to mitigate racial and ethnic inequities in health care, including leading to the desegregation of hospitals.

Loving v. Virginia

Copy link to Loving v. Virginia

Through the mid-20th century, Jim Crow and other state anti-miscegenation laws banned interracial marriages throughout many parts of the U.S. In 1958, Richard and Mildred Loving, a married interracial couple, were arrested and convicted of violating Virginia’s Racial Integrity Act. Amongst other racially discriminatory policies, the law prohibited interracial marriage. In 1964, the Lovings sought to have their sentences vacated, stating that the court’s decision violated their Fourteenth Amendment rights to equal protection under the law. After several losses in the lower courts, in 1967, the Supreme Court decided in favor of the Lovings, stating that anti-miscegenation laws did violate the Fourteenth Amendment equal protection clause by restricting marriage due to race. By allowing interracial couples to marry, Loving v. Virginia expanded access to government benefits associated with marriage. The case also informed later Supreme Court decisions on the right to marry, including Obergefell v. Hodges, which extended the right to marry to same sex couples across the nation, and, in turn, extended access to benefits, including health insurance coverage.   

The Fair Housing Act (Title VIII of the Civil Rights Act of 1968)

Copy link to The Fair Housing Act (Title VIII of the Civil Rights Act of 1968)

Expanding on previous legislation, the Act prohibited discrimination based on race, religion, national origin, sex, disability, and family status for the sale, rental, and financing of housing. Despite this law, racial disparities in home ownership and wealth and housing segregation have persisted. Research documents a strong connection between housing and health. The impacts of housing segregation on health are manifold but have been associated with poorer pregnancy outcomes and increased mortality, particularly for Black communities.

1970 to 1979

Title X Family Planning Program

Copy link to Title X Family Planning Program

The Title X Family Planning Program was established to address the rise in adverse reproductive health outcomes and unplanned pregnancies in the mid-20th century and aimed to ensure that all people had access to comprehensive and preventive reproductive health care regardless of income. Since their development, Title X clinics have been a key source of reproductive care for low-income women and women of color. Over the years, Title X clinics have faced programmatic changes in federal funding for abortion services, which have impacted people’s access to and use of Title X clinics and reproductive health care.  

Roe v. Wade

Copy link to Roe v. Wade

In this Supreme Court case, Jane Roe challenged a Texas law that made abortion illegal in all cases except when necessary to save a woman’s life, arguing that the law violated the Constitutional right to privacy. The court’s decision decriminalized abortion nationwide. Following the court’s decision, Congress enacted the Hyde Amendment, which prohibited the use of federal funds in Medicaid and other public programs to pay for abortions outside of the exceptions of rape, incest, or if the abortion is deemed medically necessary. The Hyde Amendment disproportionately impacts people of color, who are more likely to be insured by Medicaid. The June 2022 Supreme Court ruling in Dobbs v. Jackson  overturned the longstanding Constitutional right to abortion and eliminated federal standards on abortion access that had been established by earlier decisions, allowing states to establish laws protecting or restricting abortion. The overturning of Roe v. Wade will likely disproportionately impact people of color, as they are more likely to seek abortions and more likely to face structural barriers that will make it more difficult to travel out of state for an abortion, including more limited access to health care and fewer financial and transportation resources. Increased barriers to abortion for people of color may widen the already existing large disparities in maternal and infant health, have negative economic consequences for families, and increase the risk of criminalization for people of color.

Earned Income Tax Credit (EITC)

Copy link to Earned Income Tax Credit (EITC)

The EITC was established in 1975 to provide financial assistance to low-income, working families with children and is the largest refundable tax credit for low-to-middle-income families. Evaluations of the EITC have found that it lowers overall inequality between Black and White households. The EITC has boosted the incomes of millions of women of color, with some evidence that receiving EITC benefits is associated with increased birthweight for infants born to Black women. Other research suggests that income from the EITC has long-term benefits for educational attainment and greater health improvements with more generous EITC benefits. 

Indian Self Determination and Education Assistance Act (ISDEAA)

Copy link to Indian Self Determination and Education Assistance Act (ISDEAA)

The ISDEAA was enacted in the midst of many civil rights movements and aimed to reverse some of the paternalistic policies directed toward American Indian people and to strengthen and restore Tribal sovereignty. The Act allowed the U.S. Department of Interior and the U.S. Department of Health and Human Services to contract with federally recognized Tribes for federal services. Over time amendments have been made to the ISDEAA, many of which have sought to make the self-governance legislation permanent as well as further strengthen Tribal sovereignty.

Special Supplemental Nutrition Program for Women, Infants, and Children (WIC)

Copy link to Special Supplemental Nutrition Program for Women, Infants, and Children (WIC)

WIC is a federal program that provides funding to states to help them provide nutritious foods, health care referrals, and nutritional information to low-income women and children under the age of five who may be at risk of or are experiencing food insecurity. Research has found that participation in WIC is associated with improved infant health outcomes (reduced likelihood of preterm birth and decreased infant mortality), with some evidence of reduced inequities for low-income mothers and mothers of color.

The Indian Child Welfare Act (ICWA)

Copy link to The Indian Child Welfare Act (ICWA)

The ICWA governs jurisdiction over the removal of American Indian children from their families in custody, foster care, and adoption cases and gives Tribal governments exclusive jurisdiction over children who live on a reservation. The Act was put in place during a time when many American Indian children were being separated from their families and being adopted by White, non-Native families. Often, the rationale for separating these children from their families was rooted in the assimilation doctrine of the time and not performed in the best interest of the children or their families. Over time, the ICWA helped in the reversal of efforts to forcibly assimilate American Indian people into White dominant culture.

1980 to 1989

The HIV/AIDS epidemic

Copy link to The HIV/AIDS epidemic

The first cases of what would later become known as acquired immunodeficiency syndrome (AIDS) were reported in the U.S. in 1981. Although there have been some promising trends such as reductions in new HIV infections among some groups, HIV continues to have a disproportionate impact on certain populations, particularly people of color, gay and bisexual men, men who have sex with men, and transgender women. Because of these disproportionate impacts, overall federal investment in HIV plays an important role in addressing the epidemic for these groups. In 1998, President Clinton created the Minority AIDS Initiative (MAI) in response to advocacy efforts by leaders in the Black community and Centers for Disease Control and Prevention data that showed the disproportionate impact of HIV on Black people. The MAI is the first program with resources focused on addressing the impact of HIV in disproportionately affected communities. It aimed to strengthen organizations serving communities of color in an effort to improve HIV-related health outcomes and reduce HIV-related disparities. Though a relatively small investment compared to other federal HIV funding, the initiative plays an important role in providing direct services to historically marginalized racial and ethnic groups. In August 2022, the White House Office of National AIDS policy developed and released the National HIV/AIDS strategy (2022-2025), which outlined the nation’s action plan for ending HIV in the U.S. by 2030 and recognized racism as a driver of persistent disparities in the HIV epidemic.

The Migrant and Seasonal Agricultural Worker Protection Act (MSPA)

Copy link to The Migrant and Seasonal Agricultural Worker Protection Act (MSPA)

Lack of clear guidance on responsibilities and obligations of agricultural employers to guarantee migrant worker protections led to the passage of the MSPA, the main federal law protecting farmworkers. The MSPA requires farm labor contractors to register with the U.S. Department of Labor and establish employment standards pertaining to wages, housing, transportation, and working conditions for migrant and seasonal agricultural workers. Despite these protections, migrant farmers continue to be subject to many labor abuses such as wage theft, unsafe working, and substandard living situations. Migrant farmworkers, a large majority of whom are Mexican immigrants, have higher morbidity and mortality compared to the general population due to occupational hazards (including higher exposures to pesticides, carcinogens, and extreme weather conditions), substandard living conditions, and barriers to accessing health care services.

Report of the Secretary’s Task Force on Black and Minority Health and Establishment of the Office of Minority Health

Copy link to Report of the Secretary’s Task Force on Black and Minority Health and Establishment of the Office of Minority Health

The Report of the Secretary’s Task Force on Black and Minority Health, also known as the Heckler Report, was the first government-led national comprehensive study on the health status of people of color. The report quantified excess deaths due to health disparities and identified the predominant causes of mortality for people of color. The report also outlined recommendations to reduce health disparities and identified a need to improve national data collection for Hispanic, Asian American, and American Indian and Alaska Native populations. The establishment of the Office of Minority Health within the U.S. Department of Health and Humans Services (HHS) was one of the Heckler Report’s most significant outcomes. It was established to improve health outcomes among communities of color and eliminate health disparities among racial and ethnic groups through the development of government-level health policies and programs. In 2010, the Affordable Care Act established Offices of Minority Health within each of the six agencies within HHS and redesignated the National Center on Minority Health and Health Disparities within the National Institutes of Health as the National Institute on Minority Health and Health Disparities.

Anti-Drug Abuse Act

Copy link to Anti-Drug Abuse Act

The Act introduced mandatory minimum sentencing for trafficking cocaine, with harsher punishments for crack than for powder cocaine. The law resulted in disproportionately longer sentencing for Black people compared to White people. Prior to its enactment, the average federal drug sentence for Black people was 11% higher than for White people. Four years later, the average federal drug sentence for Black people was 49% higher than White people’s sentences. Mandatory minimum sentences for drug offenses continue to be used in federal courts today. Research shows racial and ethnic disparities in incarceration rates and finds that people with a history of incarceration have worse mental and physical health compared to the general population.

Immigration Reform and Control Act (IRCA)

Copy link to Immigration Reform and Control Act (IRCA)

The Act introduced civil and criminal penalties for the conscious hiring of immigrants or individuals unauthorized to work in the U.S while offering legalization to undocumented immigrants who had immigrated prior to 1982. Building upon IRCA, the Illegal Immigration Reform and Immigration Responsibility Act of 1996 added resources for border policing and verification of employment credentials to enforce immigration restrictions. The legislation had multiple economic and health impacts on undocumented workers, including increased barriers to work, loss of benefits, such as health insurance, and higher likelihood of working in low-wage professions with no rights or protections from discrimination.

Emergency Medical Treatment and Active Labor Act (EMTALA)

Copy link to Emergency Medical Treatment and Active Labor Act (EMTALA)

EMTALA required hospital emergency departments that accept Medicare payments to provide appropriate medical screening examinations and stabilization services to anyone seeking treatment for medical conditions, regardless of citizenship, immigration status, or ability to pay. EMTALA was enacted to mitigate concerns around “patient dumping,” a practice of hospitals transferring patients to another hospital without appropriate medical screening or treatment. However, recent research points to ongoing disparities in access to hospital care, finding that uninsured patients and patients with Medicaid coverage are more likely to be transferred to another hospital compared to patients with private coverage even when accounting for hospital care capabilities and patient characteristics. It also finds that uninsured patients are more likely to be discharged from the emergency department. Given that people of color are more likely to be uninsured and covered by Medicaid, they may be disproportionately affected by these transfer and discharge patterns.

1990 to 1999

The Americans with Disabilities Act (ADA)

Copy link to The Americans with Disabilities Act (ADA)

The ADA established civil rights to promote equal opportunity and independent living for all people with disabilities and banned discrimination based on disability in the realms of daily life as well as employment, schooling, and transportation. While this law was passed more than thirty years ago, people with disabilities still face challenges to accessing health care and disparities in health. American Indian and Alaska Native and Black people have a higher prevalence of disability compared to other groups.

The Disadvantaged Minority Health Improvement Act

Copy link to The Disadvantaged Minority Health Improvement Act

The Act amended the Public Health Service Act to address health concerns among individuals from disadvantaged communities, including people of color’s access to health care and health professionals. The Act established the provision of grants to provide primary health services to residents of public housing and replaced provisions and added new eligibility requirements related to grants provided to health professions schools for programs of excellence in education for minorities.

The National Institutes of Health (NIH) Revitalization Act

Copy link to The National Institutes of Health (NIH) Revitalization Act

The Act mandates the NIH to ensure the inclusion of women and people of color in NIH-funded clinical research in a manner appropriate to the research question under study to ensure generalizability to the entire population. However, challenges in achieving racial and ethnic diversity in clinical trials persist.  Analysis of data from 2000 to 2020 found that trials continued to under-enroll participants from underrepresented racial and ethnic groups. In 2022, the U.S. Food and Drug Administration issued new draft guidance aimed at increasing diversity in clinical trials.

The Family Medical Leave Act (FMLA)

Copy link to The Family Medical Leave Act (FMLA)

The FMLA requires certain employers to provide covered workers with unpaid, job-protected leave for family and medical reasons, including the birth or adoption of a child or care for serious illness or injury. While FMLA has been associated with positive impacts on parental and infant health outcomes, parental leave inequities persist, particularly in terms of access to paid leave. The FMLA has provided job security to millions of workers who need to take time off work for a qualifying reason; however, many workers remain unprotected by FMLA because small employers are exempt, and, even in covered worksites, not all employees are eligible. Bureau of Labor Statistics analyses have found that Hispanic and Black workers are less likely than their White counterparts to have access to paid family leave, and Black women are more likely than White women to report losing pay for missing work to care for kids who are sick and cannot attend school.

Violent Crime Control and Law Enforcement Act

Copy link to Violent Crime Control and Law Enforcement Act

The Violent Crime Control and Law Enforcement Act of 1994, commonly referred to as the Clinton Crime Bill, was the largest federal crime bill, providing extensive federal funding for prisons, criminal prevention programs, police expansion, and the Justice Department. The bill contained provisions increasing law enforcement accountability and protections for survivors of sexual assault but increased the presence of police enforcement in neighborhoods of color, exacerbating racial disparities in criminal justice involvement. Black people are more likely to be killed by police than White people, and over the course of a lifetime 1 in every 1,000 Black men can expect to be killed by the police. Further, larger shares of Hispanic, Black, and American Indian and Alaska Native adults report recent experiences with police mistreatment compared with White adults. This disproportionate exposure to police violence has been found to have negative mental health outcomes for Black people. Research has found that people who live in neighborhoods with more stop-and-frisk encounters are more likely to have poor health outcomes.

Executive Orders that Address Climate Change and Environmental Justice

Copy link to Executive Orders that Address Climate Change and Environmental Justice

President Clinton announced an Executive Order on Federal Actions to Address Environmental Justice in Minority Populations and Low-Income Populations in 1994. The Executive Order directs federal agencies to identify and address disproportionate health and environmental impacts on “minority and low-income populations,” develop an environmental justice strategy, and promote nondiscrimination in federal programs that affect health and the environment as well as provide information to disproportionately impacted communities. In 2021, the Biden Administration issued an Executive Order on Tackling the Climate Crisis at Home and Abroad, which emphasizes a government-wide approach to address the climate crisis and established the National Climate Task Force and Office of Climate Change and Health Equity. In April 2023, the White House announced the Executive Order on Revitalizing Our Nation’s Commitment to Environmental Justice for All that reaffirms the whole-of-government commitment to environmental justice, directs federal agencies to consider measures to address and prevent disproportionate environmental and health impacts on communities, strengthen engagement with communities in decision making, advance science and research related to environmental justice, establish a new Office of Environmental Justice, and implement federal agency assessments of environmental justice efforts.

Personal Responsibility and Work Opportunity Reconciliation Act (PRWORA)

Copy link to Personal Responsibility and Work Opportunity Reconciliation Act (PRWORA)

The PRWORA, also known as the Welfare Reform Act, changed the federal financing structure for cash assistance for low-income families, established new eligibility criteria for accessing cash benefits, including mandatory work requirements, and imposed time limits on the receipt of cash benefits. The Act also established a new restriction that prevented many lawfully present immigrants from receiving federal non-cash public assistance benefits, including Medicaid, until five years after receiving “qualified” immigration status. Following the law, there were substantial declines in lawfully present immigrants’ use of all major benefit programs, including Medicaid, leading to increases in uninsured rates among immigrants. There were also declines in program participation among citizen children in low-income immigrant families. Disparities in coverage among lawfully present immigrants and children in mixed immigration status families persist today.

The Children’s Health Insurance Program (CHIP)

Copy link to The Children’s Health Insurance Program (CHIP)

CHIP is a joint federal-state program that provides health insurance coverage to uninsured children in families whose incomes are too high to qualify for Medicaid but who can’t afford private coverage that was created (originally as the State Children’s Health Insurance Program) as part of the Balanced Budget Act of 1997. Since its enactment, CHIP has played a pivotal role in reducing the uninsured rate for children, providing health insurance for many children of color and reducing racial disparities in children’s coverage, particularly for Black and Hispanic children. The program also has been found to have positive implications for school performance and long-term educational attainment.

2000 to 2019

Minority Health and Health Disparities Research and Education Act

Copy link to Minority Health and Health Disparities Research and Education Act

Congress passed this Act to support research on minority health and health disparities in addition to medical training for students from underrepresented backgrounds in 2000. The Act created the National Center on Minority Health and Health Disparities within the National Institutes of Health (NIH), which was redesignated as the National Institute on Minority Health and Health Disparities in 2010. The Center developed the first NIH Health Disparities Strategic Plan and Budget aimed at reducing and eliminating health disparities.

Hurricane Katrina

Copy link to Hurricane Katrina

Hurricane Katrina ravaged the Gulf Coast region in August 2005, with Louisiana, Mississippi, and Alabama bearing the brunt of the damage. The storm led to substantial loss of life and property damage and had significant health impacts, including negative impacts on people’s quality of life, worsening their financial situations, housing, health outcomes and health care access. Many of the storm’s adverse impacts were disproportionately distributed across racial and ethnic groups, with African American people being more likely to report financial troubles and issues with health coverage and housing compared to White people. Ten years after the storm, fewer African American residents reported that they felt helped by recovery efforts compared to White people.

The Immigrant Children’s Health Improvement Act (ICHIA)

Copy link to The Immigrant Children’s Health Improvement Act (ICHIA)

The ICHIA option was adopted as a part of the broader Children’s Health Insurance Program reauthorization law (CHIPRA). It allows states to receive federal funds for providing Medicaid and CHIP coverage to lawfully residing immigrant children and pregnant people without the five-year waiting period established by the Personal Responsibility and Work Opportunity and Reconciliation Act. Over time, a growing number of states have adopted the ICHIA option for children and pregnant individuals. While ICHIA has increased public insurance coverage for lawfully present children and pregnant people, there is no option to eliminate the five-year wait for lawfully present immigrant adults.

Patient Protection and Affordable Care Act (ACA)

Copy link to Patient Protection and Affordable Care Act (ACA)

The ACA implemented a comprehensive set of health reforms, including large expansions in health insurance coverage through both the creation of health insurance Marketplaces with tax subsidies and an expansion of Medicaid to low-income adults. Data show that following implementation of the ACA coverage expansions in 2014, there were large gains in health coverage across racial and ethnic groups, with larger increases for people of color compared to White people that narrowed disparities in coverage. Despite these gains, racial and ethnic disparities in coverage remain. Adoption of the Medicaid expansion in the remaining non-expansion states could help further close coverage disparities. Research suggests that Medicaid expansion is linked to increased access to care and improvements in some health outcomes and has contributed to reductions in racial disparities in health coverage.

Deferred Action for Childhood Arrivals (DACA)

Copy link to Deferred Action for Childhood Arrivals (DACA)

The DACA policy was created through executive action by President Obama in 2012. DACA protects eligible young adults who were brought to the U.S. as children from deportation and provides them with work authorization for temporary, renewable periods. While DACA protects an individual from removal action for a certain time, it does not provide a pathway to U.S. citizenship. DACA has enabled over 900,000 immigrants to stay in the U.S., go to school, and contribute to the economy through gainful employment. Studies have found that DACA eligibility helps improve physical and mental health, and can improve the well-being of children of DACA recipients. However, people who are likely eligible for DACA are much more likely than U.S.-born individuals in their age group to be uninsured. When implemented, DACA recipients remained ineligible for federally funded health coverage. In April 2023, the Biden Administration began pursuing administrative action to expand eligibility for health coverage to DACA recipients.

Immigration to the U.S. from Central America

Copy link to Immigration to the U.S. from Central America

Increases in migration into the U.S. from El Salvador, Guatemala, and Honduras in recent years have been fueled by political unrest, unprecedented levels of violence related to drug cartels, and gang activity in the Central American region. Changes in immigration and border policies have impacts on the health outcomes and experiences of immigrants, particularly at the U.S. border. Temporary Protected Status (TPS) for immigrants from El Salvador and Honduras was terminated in 2017 and 2018; however, effective June 9, 2023, people from these countries will be able to temporarily extend their TPS status. In 2023, the Biden Administration announced actions focused on increasing enforcement at the Southwest Border and extending TPS status for individuals from Venezuela.

Black Lives Matter (BLM) Movement

Copy link to Black Lives Matter (BLM) Movement

The BLM movement was sparked by the murders of 17-year-old Trayvon Martin in 2012 and Michael Brown and Eric Garner in 2014. It has since become a clarion call to protest injustice against Black people internationally. In 2020, amplified by the police killing of George Floyd, the BLM movement inspired international protests against police brutality and brought attention to the systemic racism faced by the Black community. The combination of the COVID-19 pandemic, which disproportionately impacted communities of color, and the BLM protests shed light on the impact of racism and systemic discrimination on the health of people of color. Research also shows that Black people’s repeated and chronic exposure to stressors associated with racism and discrimination drive rapid biological aging and poorer health outcomes. Other recent research highlights the link between experiences with racism and discrimination and poorer health and well-being.

Travel Ban Executive Orders and Presidential Proclamations also Known as the “Muslim Travel Bans or Trump Travel Bans”

Copy link to Travel Ban Executive Orders and Presidential Proclamations also Known as the “Muslim Travel Bans or Trump Travel Bans”

Between 2017 and 2020, the Trump Administration issued  Executive Orders 13769 and 13780 and Presidential Proclamations 9645, 9723, and 9983 that limited the number of refugees admitted to the country, suspended the U.S. Refugee Admissions Program, and restricted travel into the United States from several countries, many of which are Muslim majority countries. In 2021, the Biden Administration issued the Proclamation on Ending Discriminatory Bans on Entry to the United States that revoked the Executive Orders and Presidential Proclamations. The series of Muslim Travel Bans was a continuation of racial profiling and Islamophobia directed toward Muslim people, Middle Eastern and North African people, and South Asian people, that had escalated following the September 11, 2001 attacks.

2020 to Present

COVID-19 Pandemic

Copy link to COVID-19 Pandemic

The COVID-19 pandemic negatively impacted the overall U.S. population, contributing to the most significant two-year decline in life expectancy experienced in the U.S. in roughly a century. However, the pandemic disproportionately affected some groups, including people of color, which may have long-term impacts on health and well-being and widen racial and ethnic disparities in health and health care. Following the onset of the pandemic, the federal government declared a public health emergency and enacted legislation to respond to COVID-19 and support people during the pandemic, including legislation that helped stabilize and expand health coverage. These changes included a temporary requirement that Medicaid programs keep people continuously enrolled during the pandemic in exchange for enhanced federal funds. However, the continuous enrollment provision in Medicaid ended in March 2023, and millions of people have been disenrolled since states began processing renewals.  

Increases in Anti-Asian Violence and Stop Asian Hate Movement

Copy link to Increases in Anti-Asian Violence and Stop Asian Hate Movement

Amid the COVID-19 pandemic, there was a significant rise in hate crimes against Asian people in the U.S. These recent events are reflective of ongoing discrimination against Asian and Native Hawaiian or Pacific Islander (NHOPI) people dating back to the 1800s. Growing awareness of anti-Asian violence and discrimination have heightened attention to addressing mental health needs among Asian and NHOPI people and improving availability of disaggregated data to understand their health needs. In response to the rise in anti-Asian actions, the Biden Administration implemented the COVID-19 Hate Crimes Act and an Executive Order on Advancing Equity, Justice, and Opportunity for Asian Americans, Native Hawaiians, and Pacific Islanders, which established the White House Initiative on Asian American, Native Hawaiians, and Pacific Islanders.

Addressing Disparities in Clinical Algorithms, Tools, and Guidelines

Copy link to Addressing Disparities in Clinical Algorithms, Tools, and Guidelines

Amid the COVID-19 pandemic, awareness of disparities stemming from clinical tools, algorithms, and guidelines increased. For example, low accuracy of pulse oximeters in measuring oxygen saturation in darker skin was found to potentially contribute to worse outcomes for Black and Hispanic patients with COVID-19. In addition, clinical calculators across multiple specialties assign differential risk for certain diseases or conditions based on race, which may contribute to undertreatment and overtreatment of some groups and lead to delays in diagnosis and clinical care. Race also plays a factor in some medication prescribing decisions. For example, the U.S. Food and Drug Administration approved BiDil as a race-specific drug to treat heart failure among Black people in 2005. While the drug is still approved as a race-based drug, there has been critique for misguided marketing due to inaccurately using race as a proxy for genotype. The health care system is increasingly using artificial intelligence and algorithms to guide health decisions. Research has shown that these algorithms may have racial bias because the underlying data on which they are trained may be biased and/or may not reflect a diverse population. There have been growing efforts within the medical community to re-evaluate and revise practices around the use of race within clinical care, including the American Medical Association’s adoption of new policies recognizing race as a social construct and the removal of race from clinical calculators in some institutions.

Title 42 Restrictions on Border Entry

Copy link to Title 42 Restrictions on Border Entry

Title 42 is a public health authority that authorizes the Director of the Centers for Disease Control and Prevention to suspend entry of individuals into the U.S. to protect public health. This authority was implemented in response to the COVID-19 pandemic to allow for quick expulsion of migrants, including asylum seekers, seeking entry into the U.S. at the land borders. Research suggests that Title 42 expulsions negatively impacted the health and well-being of migrant families. Title 42 border restrictions were lifted on May 11, 2023, contributing to concerns about the potential impacts of rising immigration activity at the border

Declaration of Racism as a Serious Public Health Threat

Copy link to Declaration of Racism as a Serious Public Health Threat

The Unequal Treatment: Confronting Racial and Ethnic Disparities in Health Care report documented systemic racism as a major cause of racial health disparities in the United States in 2003. However, it was not until nearly twenty years later that the federal government declared racism a public health threat and identified addressing disparities and advancing racial health equity as key federal priorities. The stark impact of the initial COVID-19 pandemic on communities of color and growth in recognition of the harms caused by systemic racism following the police killings of George Floyd and Breonna Taylor highlighted the underlying impact of racism on health and well-being. Amid this growing recognition, the Centers for Disease Control and Prevention declared racism to be a serious public health threat and highlighted new efforts to address racism as a driver of racial and ethnic health inequities. Other medical societies and organizations, such as the American Medical Association, American Psychological Association, and states and localities also formally acknowledged the role of racism as a public health issue and outlined planned actions to address systemic racism and advance health equity.

Executive Orders on Advancing Equity

Copy link to Executive Orders on Advancing Equity

President Biden issued an Executive Order on Advancing Racial Equity and Support for Underserved Communities Through the Federal Government on January 20, 2021. The Executive Order outlined equity as a priority for the federal government broadly, as well as a key part of the pandemic response and recovery efforts. Federal agencies were directed with developing Equity Action Plans that outlined concrete strategies and commitments to addressing systemic barriers across the federal government. Later in 2021, President Biden issued an Executive Order on Diversity, Equity, Inclusion, and Accessibility in the Federal Workforce.

Dobbs v. Jackson

Copy link to Dobbs v. Jackson

The June 2022 Supreme Court ruling in Dobbs v. Jackson overturned the longstanding Constitutional right to abortion and eliminated federal standards on abortion access that had been established by earlier decisions, allowing states to establish laws protecting or restricting abortion. People of color are likely to be disproportionately affected by state actions to prohibit or implement extensive restrictions on abortion, as they are more likely to seek abortions and more likely to face structural barriers that will make it more difficult to travel out of state for an abortion, including more limited access to health care and fewer financial and transportation resources. Increased barriers to abortion for people of color may widen the already existing large disparities in maternal and infant health, have negative economic consequences for families, and increase risk of criminalization for people of color.

Students for Fair Admissions Inc v. President and Fellows of Harvard College

Copy link to Students for Fair Admissions Inc v. President and Fellows of Harvard College

In June 2023, the Supreme Court ruled that institutions of higher education could no longer explicitly consider race as a factor in admissions decision-making processes. This decision is expected to decrease diversity in higher education, a trend that has been observed in states that eliminated affirmative action and experienced declines in enrollment for Black, Hispanic and Indigenous people. Leaders in the fields of medicine and public health have decried the decision stating that it could harm efforts to diversify the physician workforce, which could widen health disparities. Black and Hispanic people remain underrepresented in the U.S. physician workforce. Research shows that a racially and ethnically diverse health care workforce positively impacts health and health care access among underserved groups. Research also shows that Hispanic, Black, and Asian adults who have more visits with health care providers who share their racial or ethnic background report more frequent positive and respectful interactions with health care providers.

KFF would like to thank Dean Daniel Dawes, School of Global Health, Meharry Medical College; Dr. Gilbert Gee, Fielding School of Public Health, University of California, Los Angeles; and Dr. Michelle Tong, University of California, San Francisco School of Medicine for their invaluable inputs, insights, suggestions, and support throughout the planning and development of this project.

News Release

Record ACA Marketplace Signups for 2024 Are Driven in Part by Medicaid Unwinding and More Affordable Coverage 

From early April to the end of September 2023, enrollment in the individual market grew by 5.7%.

Published: Jan 11, 2024

Enrollment in the Affordable Care Act (ACA) Marketplaces will hit another record high in 2024, with sign-ups to date topping 20 million—already 4 million above last year’s record high.

The Medicaid unwinding, enhanced Marketplace subsidies that make coverage more affordable, as well as increased marketing, outreach, and enrollment assistance have all played a role in this growth, according to a new analysis from KFF.

Marketplace sign-ups have nearly doubled since 2020. The Medicaid unwinding is likely contributing to 2024’s record-high enrollment. States provided continuous enrollment in Medicaid during most of the pandemic, but disenrollments resumed in April.

Unlike most previous years, the individual market grew mid-year in 2023, outside the open enrollment window and at a time when attrition normally occurs. From early April to the end of September 2023, enrollment in the individual market grew by 5.7%, or just over 1 million enrollees. The only other time the ACA individual market recently saw mid-year growth was in 2021, when the American Rescue Plan’s enhanced subsidies were first rolled out.

Enhanced subsidies make coverage more affordable generally and ease the transition from Medicaid to private coverage, with zero-premium plans available to more people with low incomes. In addition to these new enrollees, enhanced subsidies may also be helping current enrollees maintain their coverage. The enhanced subsidies will expire at the end of 2025, requiring Congress to decide whether to extend them using additional federal funding.

News Release

How Has History Shaped Racial and Ethnic Health Disparities?  

Published: Jan 11, 2024

KFF’s new interactive timeline explores how history has shaped racial and ethnic health disparities and the lasting effects that persist to this day. The timeline describes major U.S. federal policies and events since the early 1800s that are linked to present-day health disparities. It also covers policies that impact health coverage and access to care, medicine, and social and economic policies that influence health as well as efforts to tackle inequalities.

The timeline includes 80 entries categorized as “Health & Medicine” or “Broader Policies.” Users can navigate through historical periods to see the expansive selections of historical events. Clicking on an entry reveals a description of the relevant event, an archival image referencing the event, and the ability to explore the entries in more detail via original source material.

While not exhaustive, the timeline provides context for the challenge of addressing current health and healthcare disparities, acknowledging the complex history that shapes them.