The HIV/AIDS Epidemic in the United States: The Basics
This fact sheet was updated on October 9, 2024 to reflect new data sources.
Key Facts
Box 1: Snapshot of the U.S. Epidemic Today
- Number of estimated new HIV infections: 31,800
- Number of estimated people living with HIV: 1.2 million
- Estimated percent of people with HIV who don’t know it: 13%
- Estimated percent of people with HIV virally suppressed: 57%
- The first cases of what would later become known as AIDS were reported in the United States (U.S.) in June of 1981. Today, there are more than 1.2 million people estimated to be living with HIV in the U.S. and there are an estimated 31,800 new infections (cases among people who are both diagnosed and undiagnosed) in 2022. While care and treatment can make HIV a manageable chronic condition, about 8,000 people die with HIV-related illness as a contributing cause of death each year.
- HIV continues to have a disproportionate impact on certain populations, particularly people of color, gay and bisexual men and other men who have sex with men, and transgender women.
- HIV testing is important for both treatment and prevention efforts. While knowledge of HIV status is growing, in 2022, an estimated 13% of those with HIV were unaware they were HIV-positive.
- Antiretroviral therapy (ART) has substantially reduced HIV-related morbidity and mortality, improved long-term outcomes for people with HIV, and plays a key role in HIV prevention. Treatment guidelines recommend initiating treatment as soon as one is diagnosed with HIV. When an individual with HIV is on antiretroviral therapy and the level of HIV in their body is undetectable, there is no risk of transmission through sex. Still, many people with HIV are not in care, on treatment, or virally suppressed.
- Pre-exposure prophylaxis (PrEP) offers important prevention opportunities, but uptake has but the majority of those who could benefit from the medication have not been prescribed it and racial/ethnic disparities persist.
- Numerous federal and local government departments and agencies are involved in the domestic HIV/AIDS response, which together provide disease surveillance, prevention, care, support services, and health insurance coverage. Additionally, the private sector and community-based organizations provide services for people with and at increased risk for HIV.
Box 2: Key Terms
- HIV Incidence – the estimated number of new HIV infections that occur across a particular period, including among people who are both diagnosed and undiagnosed HIV (in this fact sheet, referred to as “new infections”).
- HIV diagnoses – the number of people who have been diagnosed with HIV in a particular period, regardless of when HIV transmission occurred.
- HIV prevalence – the estimated number of people living with HIV over a particular period. (In this fact sheet, prevalence estimates include people with both diagnoses and undiagnosed HIV.)
- Viral suppression – Viral suppression refers to having less than 200 copies of HIV per milliliter of blood, typically achieved by consistently taking antiretroviral treatment. It means that the level of HIV virus in the body is very low and sometimes even undetectable. Viral suppression affords individuals with HIV optimal health outcomes and also prevents transmission to others, sometimes referred to as “treatment as prevention.” National numbers presented in this factsheet are estimates.
- Receipt of medical care – Receipt of medical care is a measure of HIV care engagement and refers to having at least 1 viral load or CD4 test during the year. Engaging in HIV care can lead to improved outcomes and access to HIV treatment. National numbers presented in this factsheet are estimates.
Overview
- More people are living with HIV in the U.S. than ever before, largely due to successful HIV treatment which extends the lifespan, but also because new HIV infections continue to occur.
- Current U.S. HIV treatment guidelines recommend initiating ART as soon as one is diagnosed with HIV, and new research has underscored the importance of starting treatment early. Engaging in treatment early and consistently affords individuals with HIV optimal care outcomes including improved health, quality of life, and life expectancy, as well as offering preventative benefits. When an individual with HIV is consistently engaged with antiretroviral therapy and the level of HIV in their body is undetectable, there is effectively no risk of sexual transmission.
- However, looking at estimates across the continuum from HIV diagnosis to viral suppression reveals missed opportunities for addressing the epidemic. According to the Centers for Disease Control and Prevention (CDC), while many people with HIV are diagnosed (87%), far fewer receive medical care (66%), and fewer still are virally suppressed (57%), though each of these estimates has increased over time. Viral suppression is greater among those who are in medical care but many face systemic social barriers that can make care engagement challenging.
- Yet, there have been some promising trends, as the number of new HIV infections (among those diagnosed and undiagnosed) declined by an estimated 76% between 1984 and 2022 and by 19% more recently (between 2010 and 2022). Still, an estimated 31,800 new infections occurred in the U.S. in 2022, and declines were not seen among all populations.
- Initially, HIV-related mortality rates (deaths with HIV noted as the underlying cause of death), rose steadily through the 1980s and peaked in 1995, but have dropped by 9-fold since then, and by over half since 2010. This is largely due to ART, but also to decreasing HIV incidence. Still, in 2022, nearly 5,000 people died with HIV as the underlying cause of death and about 8,000 died with HIV as a contributing cause of death.
- In 2022, most newly diagnosed cases of HIV occurred among gay and bisexual men and other men who have sex with men (67%). An additional 4% occurred among gay and bisexual men with a history of injection drug use. Diagnoses attributable to injection drug use alone have declined significantly over time and accounted for 7% of diagnoses in 2022. Transmission through heterosexual sex accounted for 22% of HIV diagnoses.
- HIV testing is important for both treatment and prevention efforts and rapid testing is now more widely available. While knowledge of HIV status is growing, in 2022, 13% of those with HIV were estimated to be unaware they are HIV-positive. Knowledge of HIV status is important because individuals with HIV can engage in care and treatment to achieve optimal health outcomes and can take steps to prevent transmission. Testing also offers an opportunity for those who are HIV negative to engage in prevention opportunities. Routine HIV testing is recommended for all people ages 13-64, and most forms of health insurance cover HIV testing, usually without cost-sharing.
- PrEP is a safe and highly effective preventive medication that reduces the risk of acquiring HIV through sex by 99% and injection drug use by 74% when taken as prescribed. While the number of persons prescribed and covered for PrEP by insurance has almost doubled between 2018 (221,026) and 2022 (437,425), the CDC estimates that approximately 64% of the more than 1.2 million Americans who could benefit from PrEP are not yet accessing it, and significant racial/ethnic disparities persist.
- Post-exposure prophylaxis (PEP), medication used after a high-risk event to prevent HIV seroconversion, also offers a prevention opportunity, including reducing risk by more than 80% if started within 72 hours of possible HIV exposure.
Impact Across the Country
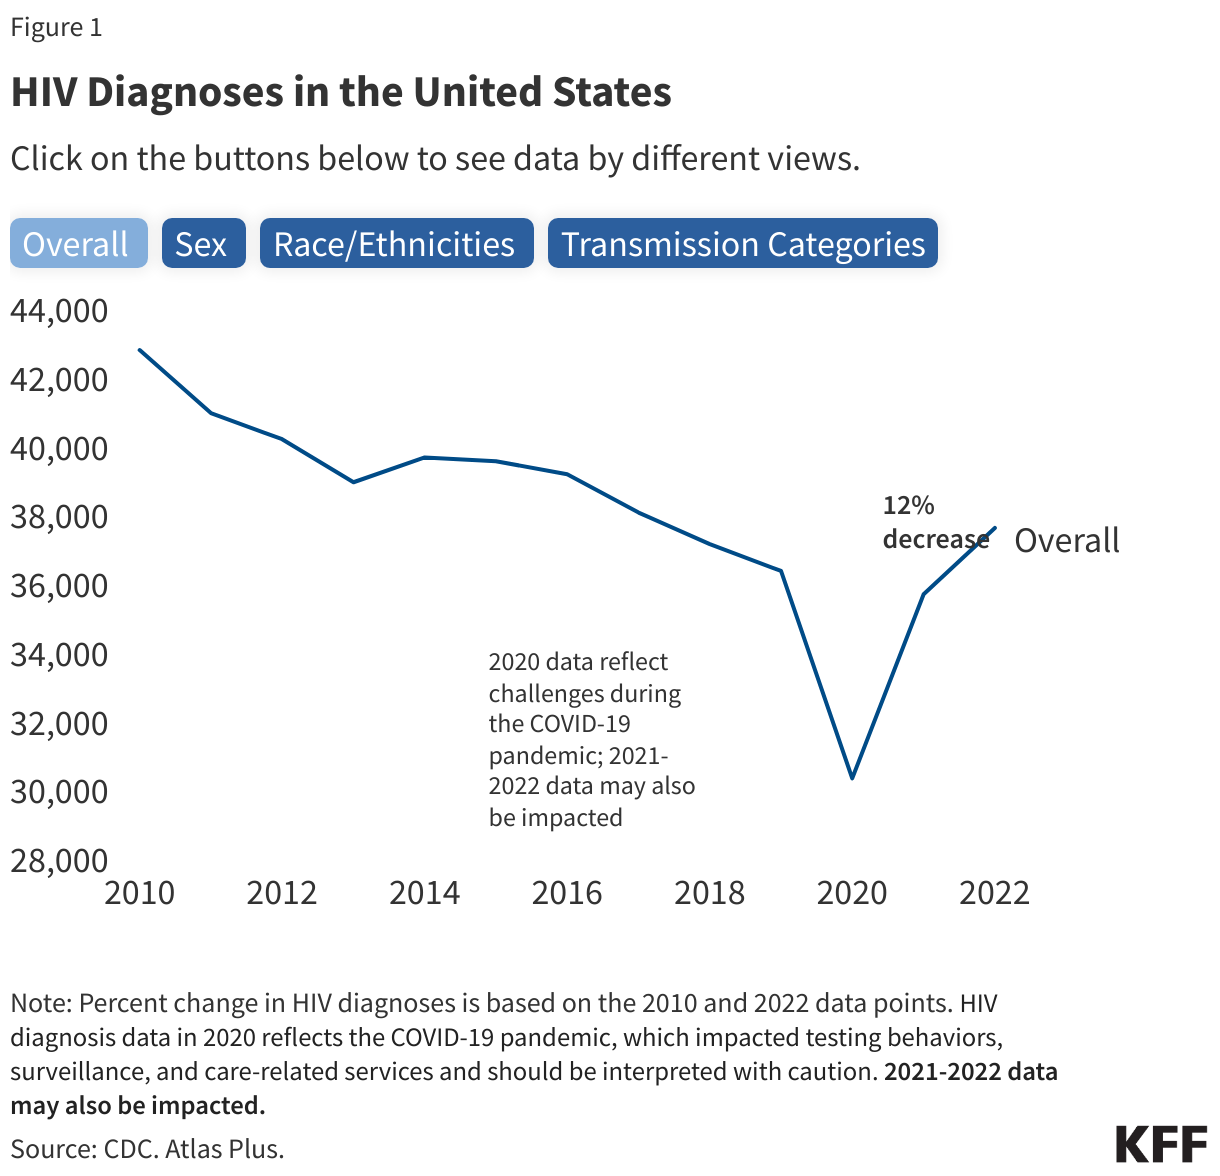
- Annual HIV diagnoses have declined by 12% between 2010 and 2022. Factors such as updated treatment guidelines, increased knowledge of status, and the availability of PrEP have contributed to these decreases. However, this decline has not occurred evenly across all populations (described below).
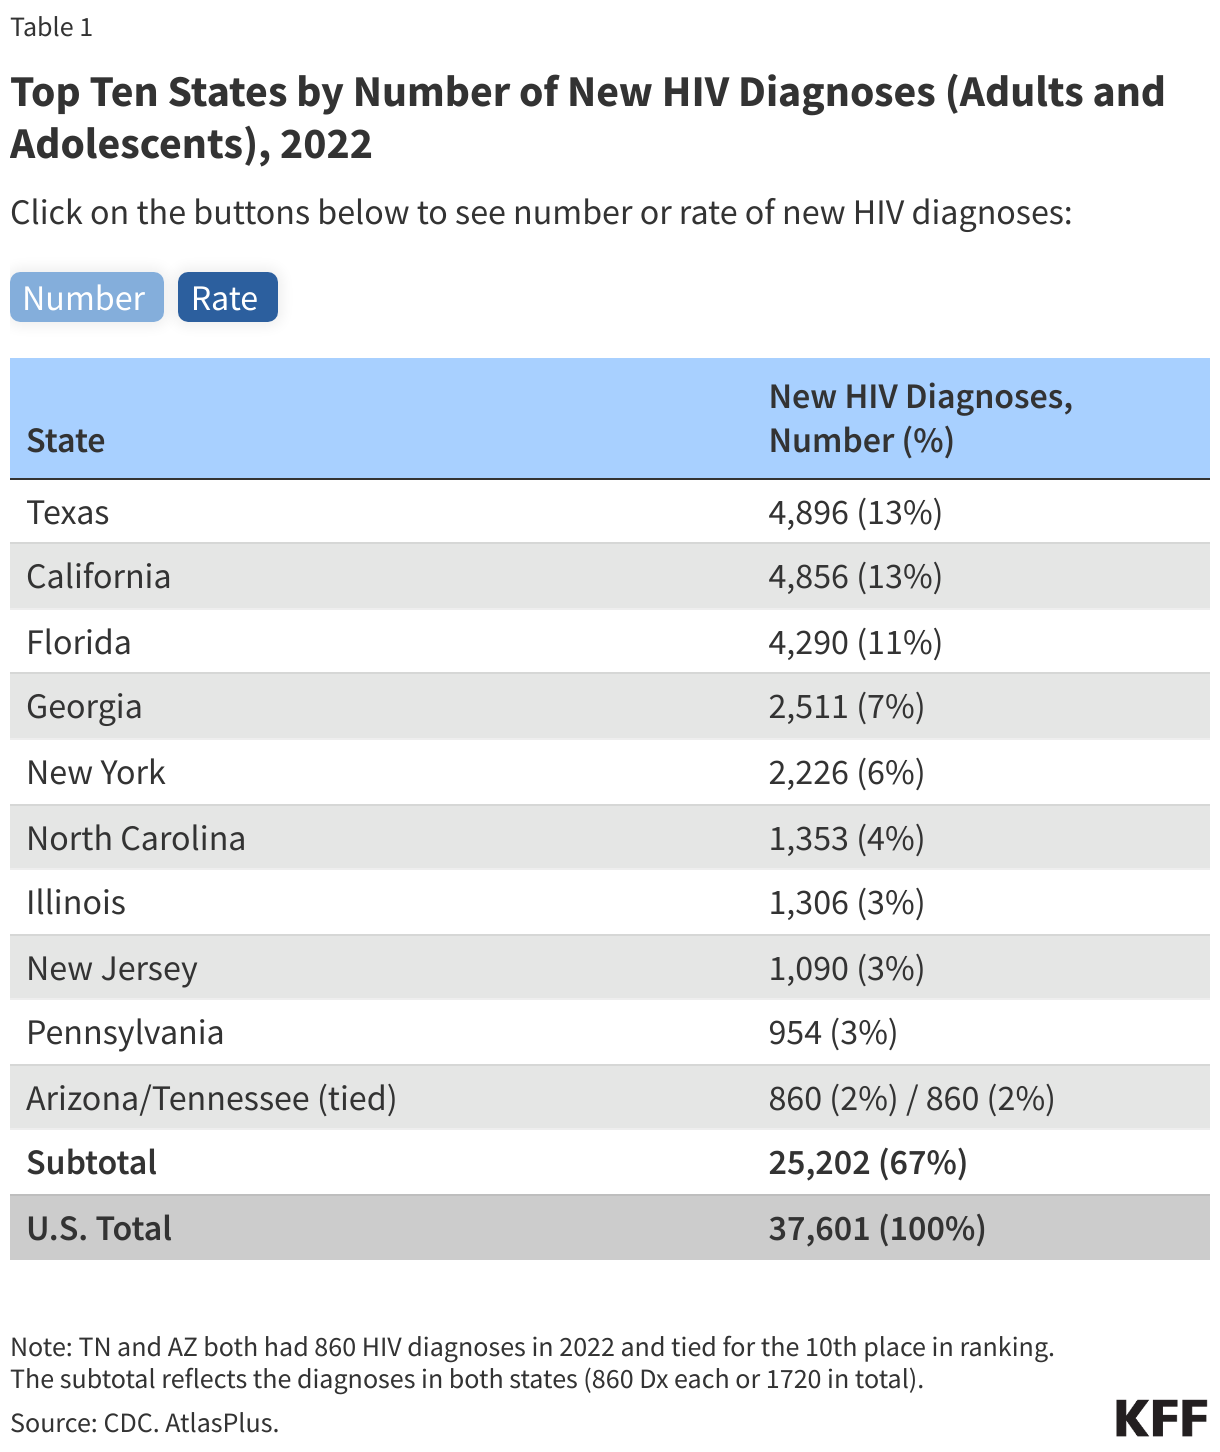
- Although HIV has been reported in all 50 states, the District of Columbia, and U.S. territories, the impact of the epidemic is not uniformly distributed. The top ten states in terms of number of HIV diagnoses are home to 55% of the U.S. population and accounted for about two-thirds (67%) of diagnoses among adults and adolescents in 2022 (Table 1). Regionally, the South saw a disproportionate burden and accounted for over half of HIV diagnoses in 2022.
- Rates of HIV diagnoses among adults and adolescents per 100,000 provide a different measure of the epidemic’s impact, since they reflect the concentration of diagnoses after accounting for differences in population size across states/regions. Among states, the District of Columbia (D.C) has the highest ratein the nation (36.6), nearly 3 times the national rate (13.3), followed by Georgia which has a rate (27.4) twice that of the national rate. Eight of the top 10 states by rate are in the South.
- HIV diagnoses are concentrated primarily in large U.S. metropolitan areas (80% in 2022), with rates highest in Miami/Fort Lauderdale, Memphis, and Atlanta.
Impact on Communities of Color
- People of color have been disproportionately affected by HIV/AIDS since the beginning of the epidemic, and represent the majority of new HIV diagnoses, people living with HIV disease, and deaths among people with HIV.
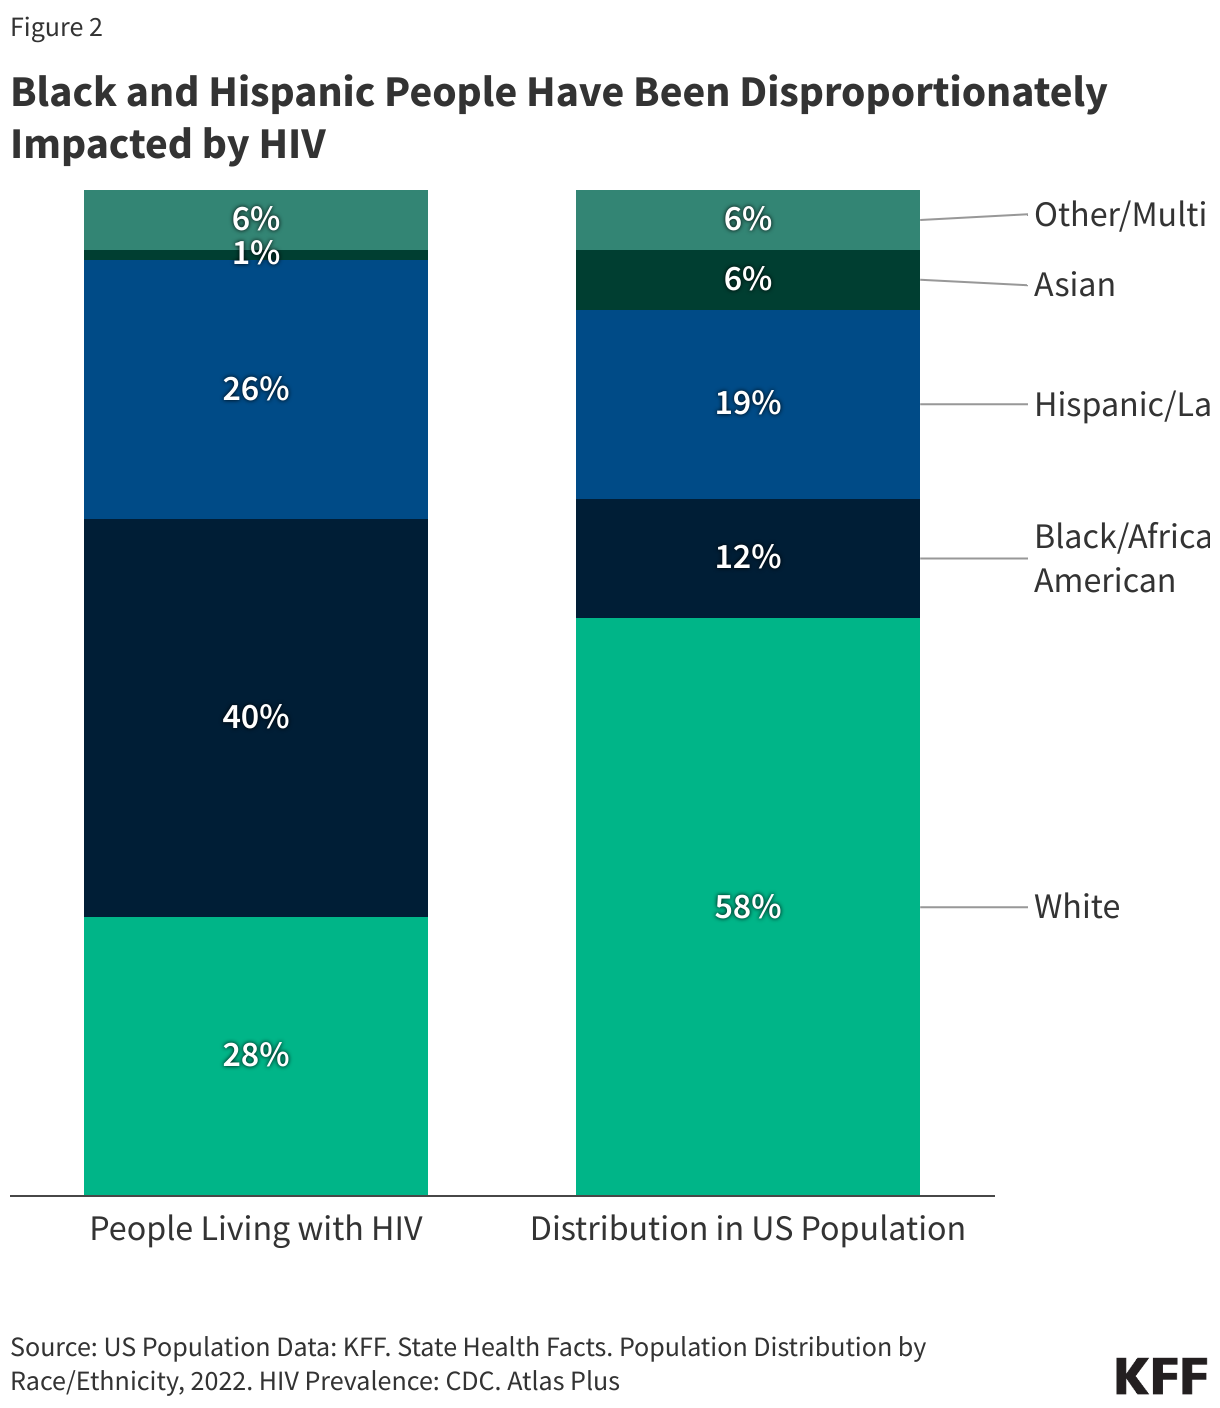
- Black and Latino people account for a disproportionate share of new HIV diagnoses, relative to their size in the U.S. population. Black people account for more people living with HIV than any other racial or ethnic group – in 2022, an estimated 40% of people living with HIV in the U.S. are Black despite Black people accounting for just 12% of the U.S. population. About a quarter of people living with HIV are Hispanic/Latino (26%) but Hispanic/Latino people make up 19% of the U.S. population (see Figure 2).
- In 2022, Black adults and adolescents also had the highest rate of new HIV diagnoses (41.6 per 100,000), followed by Latino people (23.4). Whereas rates of HIV diagnoses were lower among White (5.3) and Asian (4.6) people.
- Looking at recent trends, from 2010 to 2022, only Hispanic/Latino and Asian people experienced an increase in HIV diagnoses (24% and 26% increases, respectively), while all other groups of people by race/ethnicity, sexes, and transmission categories saw decreases in HIV diagnoses. (See Figure 1.)
- In 2022, Black people accounted for more than four in ten (43%) deaths among people with diagnosed HIV. Survival after an AIDS diagnosis is lower for Black people than for other racial/ethnic groups, and Black people have had the highest age-adjusted death rate due to HIV disease throughout most of the epidemic. HIV ranks higher as a cause of death for Black and Latino people, compared with White people.
Impact on Women
- In 2022, 22% of all people living with HIV (268,800) were estimated to be women.
- From 2010 to 2022, HIV diagnoses among women decreased by 25%, while they decreased by 8% among men. In more recent years, the rate of decrease in HIV diagnoses has slowed for both groups. (See Figure 1.)
- Women of color are particularly affected by the HIV/AIDS epidemic. In 2022, Black women accounted for half (50%) of new HIV diagnoses among women while shares of diagnoses were lower in White (24%), Latina (20%), and Asian (1%) women.
Impact on Young People
- Teens and young adults continue to be at higher risk for HIV than other age groups, with those under 35 accounting for 56% of HIV diagnoses in 2022 (those ages 13-24 accounted for 19% and those ages 25-34 accounted for 37%). Most young people acquire HIV sexually.
- Among young people, gay and bisexual men and people of color have been particularly affected.
- Perinatal HIV transmission, from an HIV-positive parent to their baby, has declined significantly in the U.S., largely due to increased testing efforts among pregnant people and ART which can prevent mother-to-child transmission. However, the rate for perinatally acquired HIV is 5 times higher among births for Black people (5.5) than the national rate (1.1).
Impact on Gay and Bisexual Men
(Data in this section are based on individuals who acquired HIV through male-to-male sexual contact or male-to-male sexual contact and injection drug use.)
- Male-to-male sexual contact accounts for most HIV diagnoses (71% in 2022) and men who have sex with men account for most people living with HIV (63% in 2022). (See Figure 1.)
- Among gay and bisexual men, Hispanic/Latino men accounted for the largest number of diagnoses (9,507) in 2022, followed by Black men (9,092). Young Black gay and bisexual men (ages 13-24) accounted for 49% of diagnoses among all men ages 13-24.
- Overall, from 2010 to 2022, HIV diagnoses among gay and bisexual men decreased by 4%. However, more recently (between 2018 and 2022), HIV diagnoses increased by 21% among Latino gay and bisexual men.
The U.S. Government Response
- In FY 2022, U.S. federal funding to combat HIV in the U.S. was estimated to be $35.8 billion. Most funding was for care and treatment ($28.7 billion) through the Medicaid and Medicare programs. Cash and housing assistance totaled $3.3 billion, followed by research ($2.7 billion) and prevention ($1.1 billion).
- Numerous federal departments and agencies are involved in the domestic HIV/AIDS response and key government programs that provide health insurance coverage, care, and support to people with HIV in the U.S. include Medicaid, Medicare, the Ryan White HIV/AIDS Program, and the Housing Opportunities for Persons with HIV/AIDS Program (HOPWA). Social Security’s income programs for people with disabilities (SSI and SSDI) are important sources of support. The Centers for Disease Control and Prevention (CDC) leads U.S. surveillance and prevention activities, which are carried out in conjunction with state and local health departments. In addition to government efforts, a wide range of community and other organizations provide services for people with HIV and those at increased risk for HIV.
- The U.S. has had a National HIV/AIDS Strategy (NHAS) since 2010 when it was first adopted under President Obama. The NHAS sets out and tracks national goals related to the domestic epidemic and has evolved over time to account for changing policy environments and to align with the science.
- In 2019, the Trump Administration launched the “Ending the HIV Epidemic Initiative” (EHE), a federal effort to reduce new HIV infections in the United States. The initiative, which is part of NHAS, was built on efforts made by the Obama Administration and continues under the Biden Administration and targets the regions hardest hit by the HIV epidemic. It has also been accompanied by an infusion of federal funding, marking the first significant increases for HIV programs in many years. In FY24 EHE funding totaled $573.25 million.