KFF designs, conducts and analyzes original public opinion and survey research on Americans’ attitudes, knowledge, and experiences with the health care system to help amplify the public’s voice in major national debates.
A new KFF policy watch explains some of the hurdles the state of Florida still must clear before it can implement its novel plan to make some prescription drugs more affordable by importing them from Canada.
Florida’s plan represents the first time the Food and Drug Administration (FDA) has granted authority for a state to safely import prescription drugs from another country. However, the state must take some additional steps to move forward with the program and may face other challenges that could delay or even block implementation:
Florida officials will need to obtain approval from the FDA for each drug they seek to import. The state also will have to test the quality of such drugs and ensure that drug labels meet FDA standards.
The Canadian government has expressed concern about the potential impact of this importation program on the drug supply for Canadians and could impose barriers for importation to the U.S.
The drug industry’s lobbying group, the Pharmaceutical Research and Manufacturers of America (PhRMA), has opposed drug importation in the past and may file new legal or administrative challenges to prevent the plan from being implemented.
Beyond implementation challenges, KFF experts unpack other questions related to Florida’s plan, including who will benefit from any savings and what types of drugs will (and will not) qualify for importation. Some of the most expensive drugs, such as biologics, are ineligible for importation.
KFF polling has consistently shown that high prescription drug costs are a concern for the American public and there is strong bipartisan support for many measures to make medications more affordable, including allowing the importation of drugs from Canada.
To see other data and analyses related to efforts to address prescription drug costs, visit kff.org.
On January 5, 2024, the FDA authorized the state of Florida to import certain prescription drugs from Canada, an approach designed to give Floridians access to lower drug prices paid by people in Canada. This announcement has received a great deal of attention because it is the first time the FDA has granted authority for a state to safely import prescription drugs from another country. KFF polling has consistently shown that high prescription drug costs are a concern for the American public, with strong bipartisan support for several proposals to make medications more affordable, including allowing the importation of drugs from Canada. However, Florida must now take additional steps before the FDA will allow any drugs to be imported, and could face other obstacles to implementation, meaning Floridians may not see the benefits of these efforts for some time to come.
How did the FDA’s decision come about and what did the FDA authorize Florida to do?
Policymakers from both parties at both the federal and state levels have talked about importation of prescription drugs from other countries as a strategy to lower drug prices for many years. The door to Florida’s new state importation program was opened by a 2020 final rule creating this new pathway to import drugs from Canada and was reinforced by a 2021 executive order from the Biden Administration directing the FDA to work with states to import prescription drugs from Canada. Florida Governor and GOP presidential candidate Ron DeSantis and his administration have been seeking to gain approval to implement an importation plan for over three years.
The FDA has now authorized Florida’s drug importation program from Canada for a period of two years, stating that it met the requirements that importation would provide savings to consumers without sacrificing health and safety. According to the state’s January 5, 2024 press release, this program will save Florida up to $183 million in the first year of implementation, and based on Florida’s October 20, 2023 estimate of cost savings, these savings will accrue to the state’s Medicaid program. Whether any Floridians will pay lower out-of-pocket costs on imported drugs is unclear.
What are the obstacles to implementation?
Even with FDA approval, Florida will need to meet additional requirements before the plan can be implemented and overcome other potential roadblocks. For example, before Florida is permitted to import any drugs from Canada, it will need to submit a pre-import request to the FDA for each drug they seek to import, and can only import that drug if the FDA approves that request. The state of Florida will also be required to conduct quality testing of the drugs and ensure that drug labels meet FDA standards.
It is also possible that the Canadian government may impose barriers for importation to the U.S. Canadian law limits the sale of drugs outside of Canada that could create or worsen supply issues for Canadians. In response to the recent FDA action, Health Canada recently released a statement saying, “the Government of Canada is taking all necessary action to safeguard the drug supply and ensure Canadians have access to the prescription drugs they need” and added, “bulk importation will not provide an effective solution to the problem of high drug prices in the U.S.”
Other interested parties, including the Pharmaceutical Research and Manufacturers of America (PhRMA), may also seek to prevent the plan from being implemented, and PhRMA has previously filed a lawsuit and citizen petition challenging the importation pathway. Soon after the FDA issued its response to Florida, PhRMA issued a statement saying that importation of drugs from Canada “poses a serious danger to public health.”
Will all Floridians benefit and which drugs will qualify?
Florida’s importation program is limited both in terms of who could be helped and which drugs could potentially be imported. Imported drugs will only be available for people receiving services through certain state agencies and government programs, including people covered under Medicaid, people served through county health departments, and others residing in certain state facilities. The program does not extend to people with other types of insurance, such as employer insurance, or the uninsured.
The FDA’s approval of Florida’s importation plan represents a political victory for the state in its long-standing efforts to implement its program, but this victory may be more symbolic than real when it comes to the impact on drug prices overall for the state’s residents. The Biden Administration can also notch another policy win in the area of drug spending, on top of its other actions to lower prescription drug costs included in the Inflation Reduction Act of 2022. Among the drug pricing provisions in this law are a cap on insulin copays under Medicare, a cap on annual out-of-pocket costs for retail prescriptions under Medicare Part D, and requiring the federal government to negotiate the price of some high-spending drugs under Medicare.
With states eager to adopt various approaches to tackle the problem of high drug prices, the FDA’s green light to Florida for its importation program is likely to encourage other states to make similar moves in this direction. But Florida’s importation program still faces obstacles before it can be implemented, and even then, its reach and impact may be somewhat limited, meaning that the issue of high drug prices is likely to remain top of mind for the public.
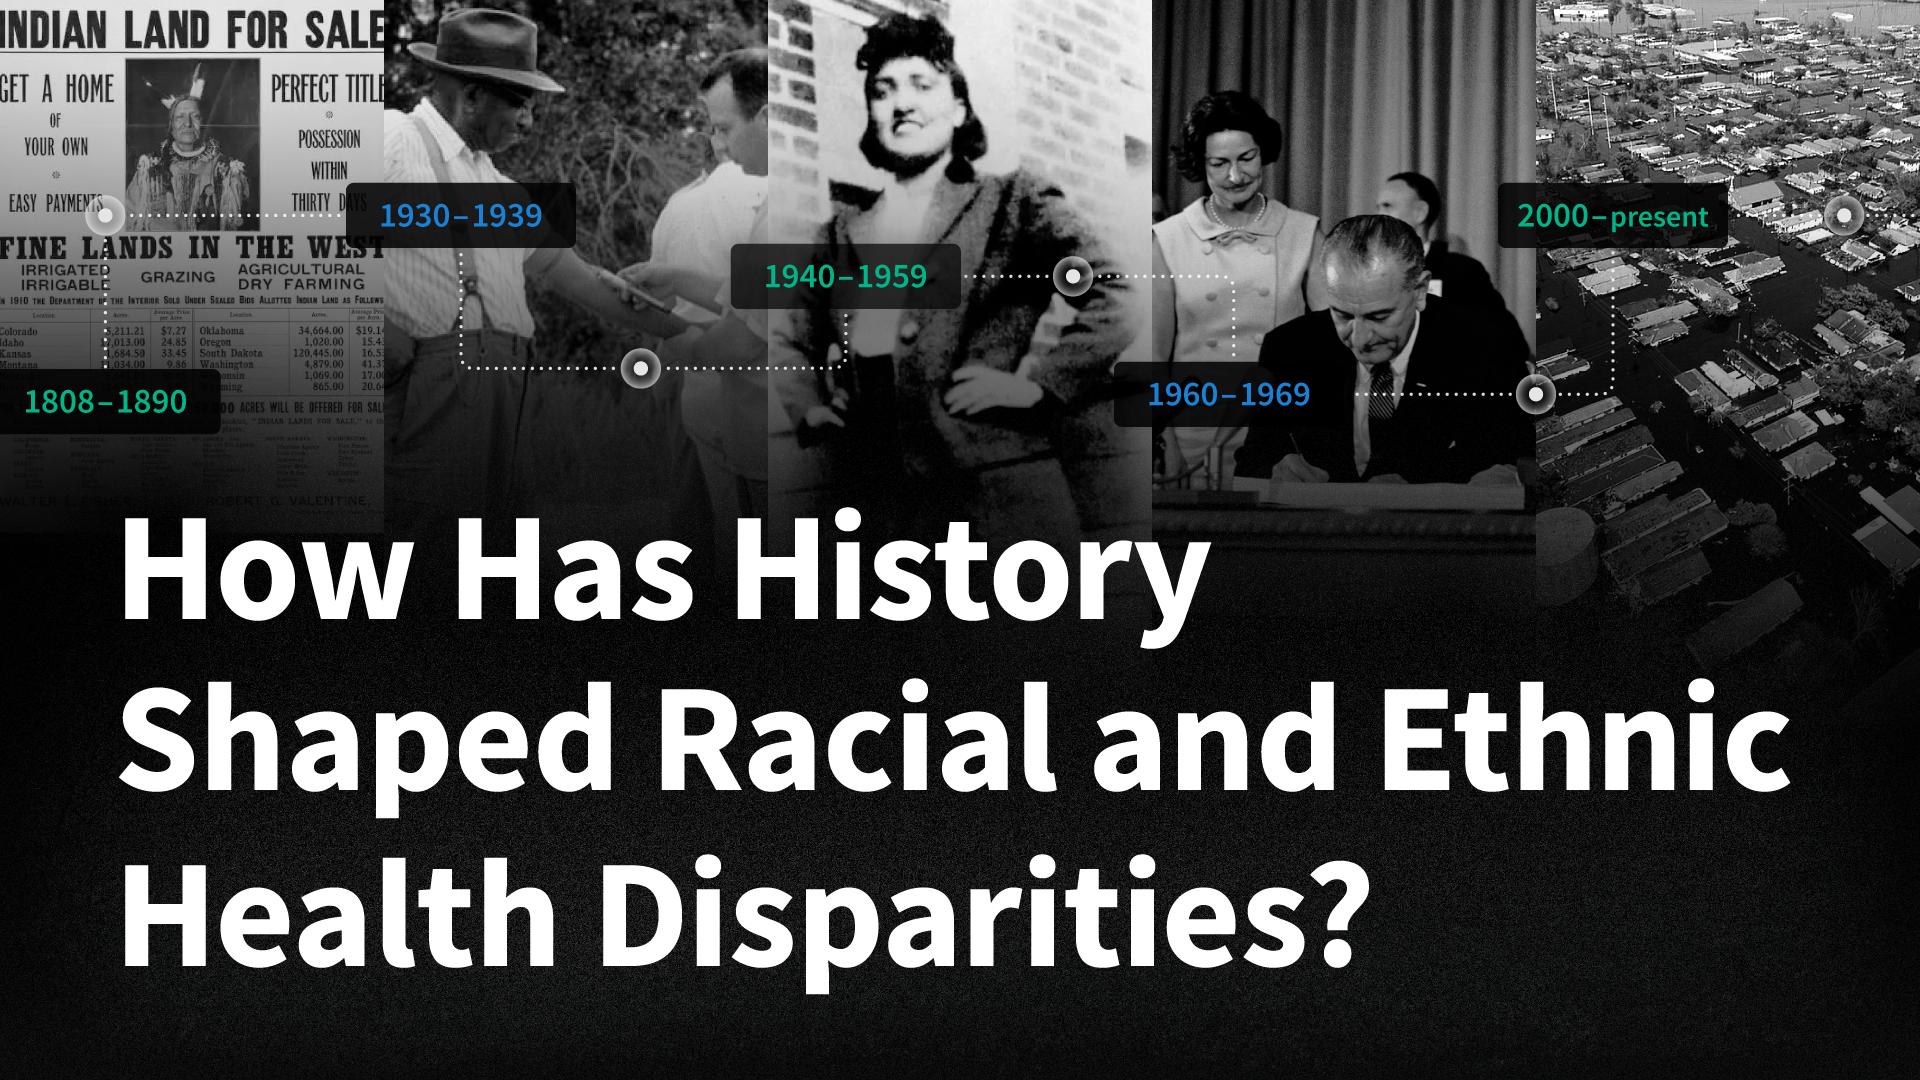
How History Has Shaped Racial and Ethnic Health Disparities
A Timeline of Policies and Events
This timeline offers a historical view of significant U.S. federal policies and events spanning the early 1800s to today that have influenced present-day health disparities. It covers policies that directly impacted health coverage and access to care, relevant events in medicine, social and economic policies and developments that influence health, and efforts to tackle inequalities. Some events impacting people of color, like the Louisiana Purchase, Westward Expansion and the Transatlantic Slave Trade, predate this timeline. While not exhaustive, the timeline aims to provide context for addressing disparities, acknowledging the complex history that shapes racial and ethnic health and health care disparities that persist today.
Cover of “On the Treatment of Vesico-Vaginal Fistula,” a treatment derived through experimentation on enslaved women (National Library of Medicine)
The importation of enslaved people from foreign countries was outlawed in 1808. This ban had profound economic implications, as it increased the value of the existing enslaved populations and spurred slave owners to focus on their reproductive viability, contributing to medical experimentation on enslaved women. For example, while renowned for his contributions to the field of obstetrics and gynecology, Dr. J Marion Sims developed new surgical techniques through medical experiments on enslaved women, including Anarcha, Lucy, and Betsey in Alabama from 1845 to 1849. Dr. Francois Marie Prevost honed his cesarean surgical procedure by practicing on at least 30 enslaved women in Haiti and Louisiana during the 1830s. Dr. Ephraim McDowell, considered the father of abdominal surgery, developed surgical treatments for ovarian cancer in the early 1800s, often on enslaved women. The experimental procedures were often conducted without anesthesia due to the inaccurate belief that Black people felt less pain than White people. This racial bias in pain perception persists in modern medicine, affecting the way medical students and residents view and treat pain among different racial groups. In recent years, there have been efforts to reevaluate the ethics of these physicians’ work and acknowledge the exploitation of enslaved women in the development of modern reproductive surgical procedures, especially in the context of the ongoing maternal health crisis.
Sioux boys as they arrived at the Indian Training School at Carlisle Barracks (Library of Congress)
While first initiated in 1819, the U.S. implemented policies establishing and supporting Indian boarding schools across the nation into the late 20th century. These schools were designed to culturally assimilate American Indian, Alaska Native (AIAN), and Native Hawaiian children by forcibly removing them from their families and communities as part of efforts to dispossess them from their native lands. The children suffered severe abuse and neglect. Many children died at these institutions and were buried in unmarked and marked graves on the school grounds. In 2022, an investigation by the Bureau of Indian Affairs identified ongoing impacts of the school system, including loss of life, territories and wealth, negative impacts on physical and mental health and Tribal and family relations, and erosion of the use of Tribal languages as well as religious and cultural practices.
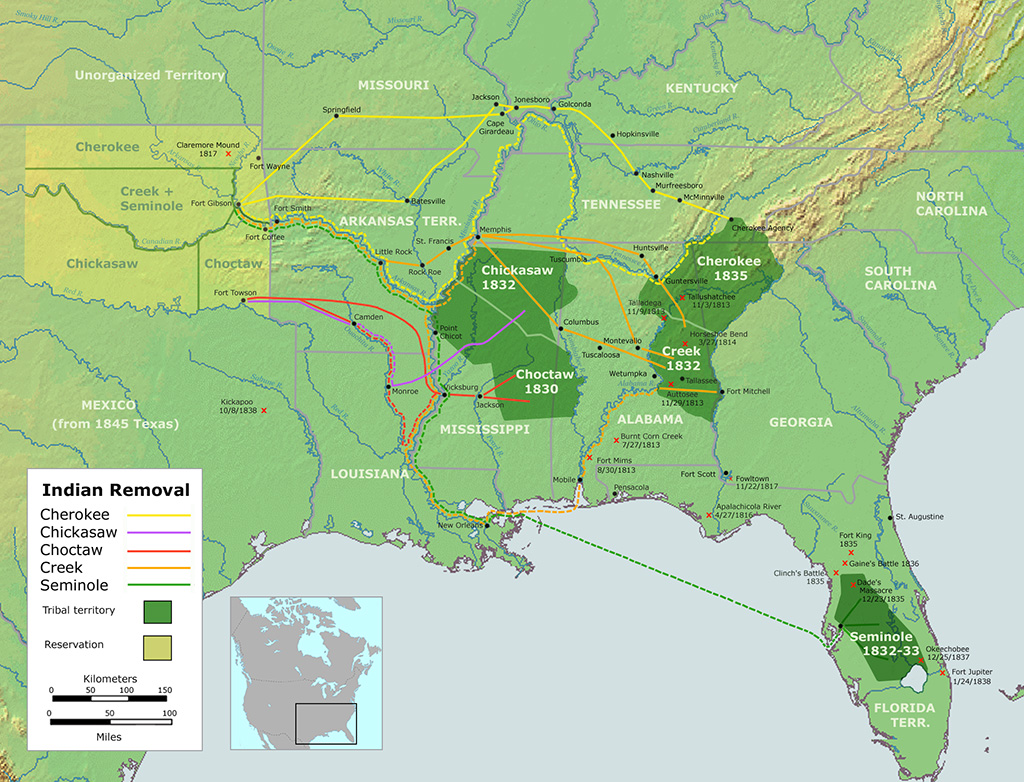
Map of the Trail of Tears, depicting the routes taken by Native Americans to relocate from Southeastern U.S. (Wikimedia / Creative Commons / Handbook of North American Indians)
The Supreme Court’s Johnson v. McIntosh decision established legal doctrine surrounding Indigenous ownership of land in 1823. The decision determined that American Indian people did not have legal ownership of the land they inhabited, laying down the foundation for the forced displacement of American Indian Tribes. The Indian Removal Act of 1830 authorized the forced relocation of American Indian Tribes from the Southeast U.S. to the Midwestern and Western parts of the country and started the Trail of Tears. The forced resettlement resulted in approximately 100,000 American Indian people losing their lives, homes and Tribal lands. The loss of lands and people from this period resulted in a substantial loss of Indigenous knowledge, languages, and traditions and continues to impact American Indian people today.
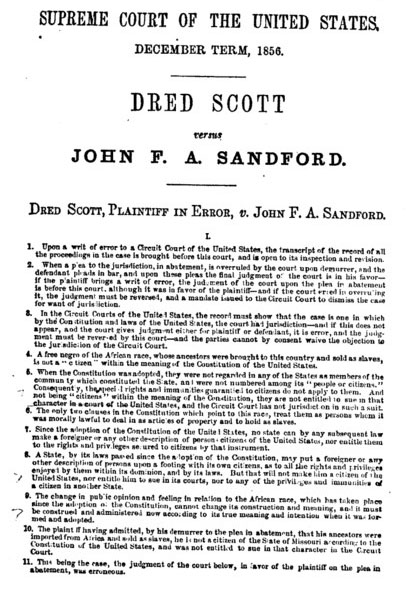
Decision in the case of Dred Scott v. John F. A. Sandford (Library of Congress)
Dred and Harriet Scott, enslaved persons in the state of Missouri, sought freedom from their enslavers in 1846 under the assumption that their temporary residence in a free state/territory freed them from slavery. Their judicial fight for freedom continued for 11 years and gained notoriety as slavery became a major political issue in the U.S. In 1857, Chief Justice Taney read the majority opinion stating that enslaved people were not citizens of the U.S. and, therefore, could not file cases at the federal level. Further, it established that the federal government did not have the power to prohibit slavery in its territories.
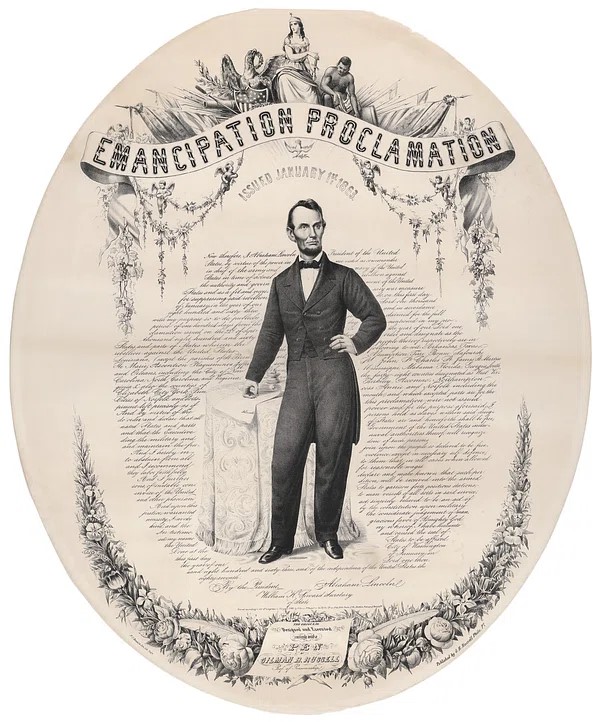
The proclamation declared the end of slavery in the Confederacy. While it did not codify the illegality of slavery, it signaled a shift in the purpose of the Civil War from one that focused on the preservation of the Union to one that was focused on the end of slavery. The Emancipation Declaration was a significant milestone that helped pave the way for the Reconstruction Amendments that outlawed slavery and involuntary servitude.
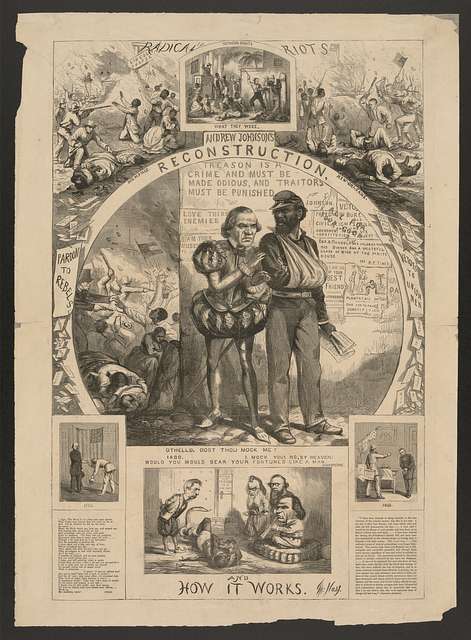
Cartoon depiction of Andrew Johnson with an African American Civil War veteran (Library of Congress)
The Thirteenth, Fourteenth, and Fifteenth Amendments, collectively known as the Reconstruction Amendments, outlawed slavery and involuntary servitude; granted citizenship to anyone born in the U.S. and equal protection to all people; and extended the right to vote to Black men, respectively. The Reconstruction Amendments were designed to enforce the declaration of the end of slavery, provide equality for freed Black people, and provide people with legislative pathways to uphold equal rights and treatment under the law. However, they were quite unsuccessful in fulfilling their objectives, particularly in states where lynchings, Black Codes, and Jim Crow laws were established to further disenfranchise Black people. The Reconstruction Amendments served as foundational documents for the civil rights movements of the 1950s and 1960s, as well as other equal rights movements.
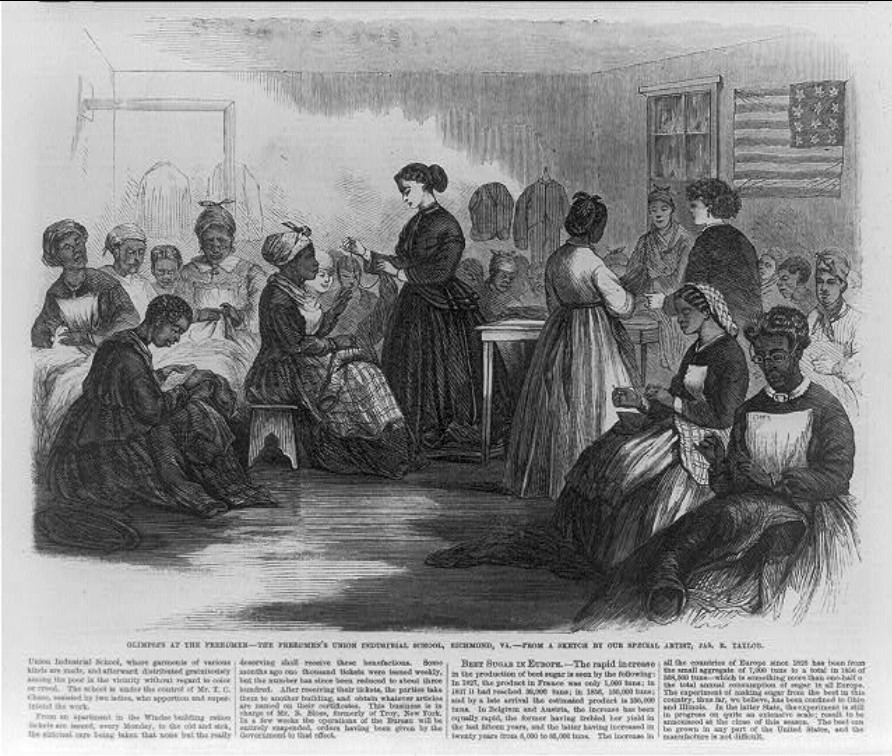
The Freedmen’s Union Industrial School in Richmond, Virginia (Library of Congress)
The Acts established a Bureau for the Relief of Freedmen and Refugees whose role was to provide social, economic, and occupational resources to displaced Southerners and freed Black people after the Civil War. Like many other Reconstruction Era actions, the Bureau was shut down in 1872 due to pervasive racism and lack of funding. The Freedmen’s Bureau is recognized as one of the earliest examples of race-conscious or affirmative action in the U.S. The Bureau has a complicated legacy because, while it provided medical assistance to more than a million freed people and established over 1,000 schools for Black people in the American South, including Historically Black Colleges and Universities, it made little to no headway in land redistribution and the advancement of civil rights for Black people.
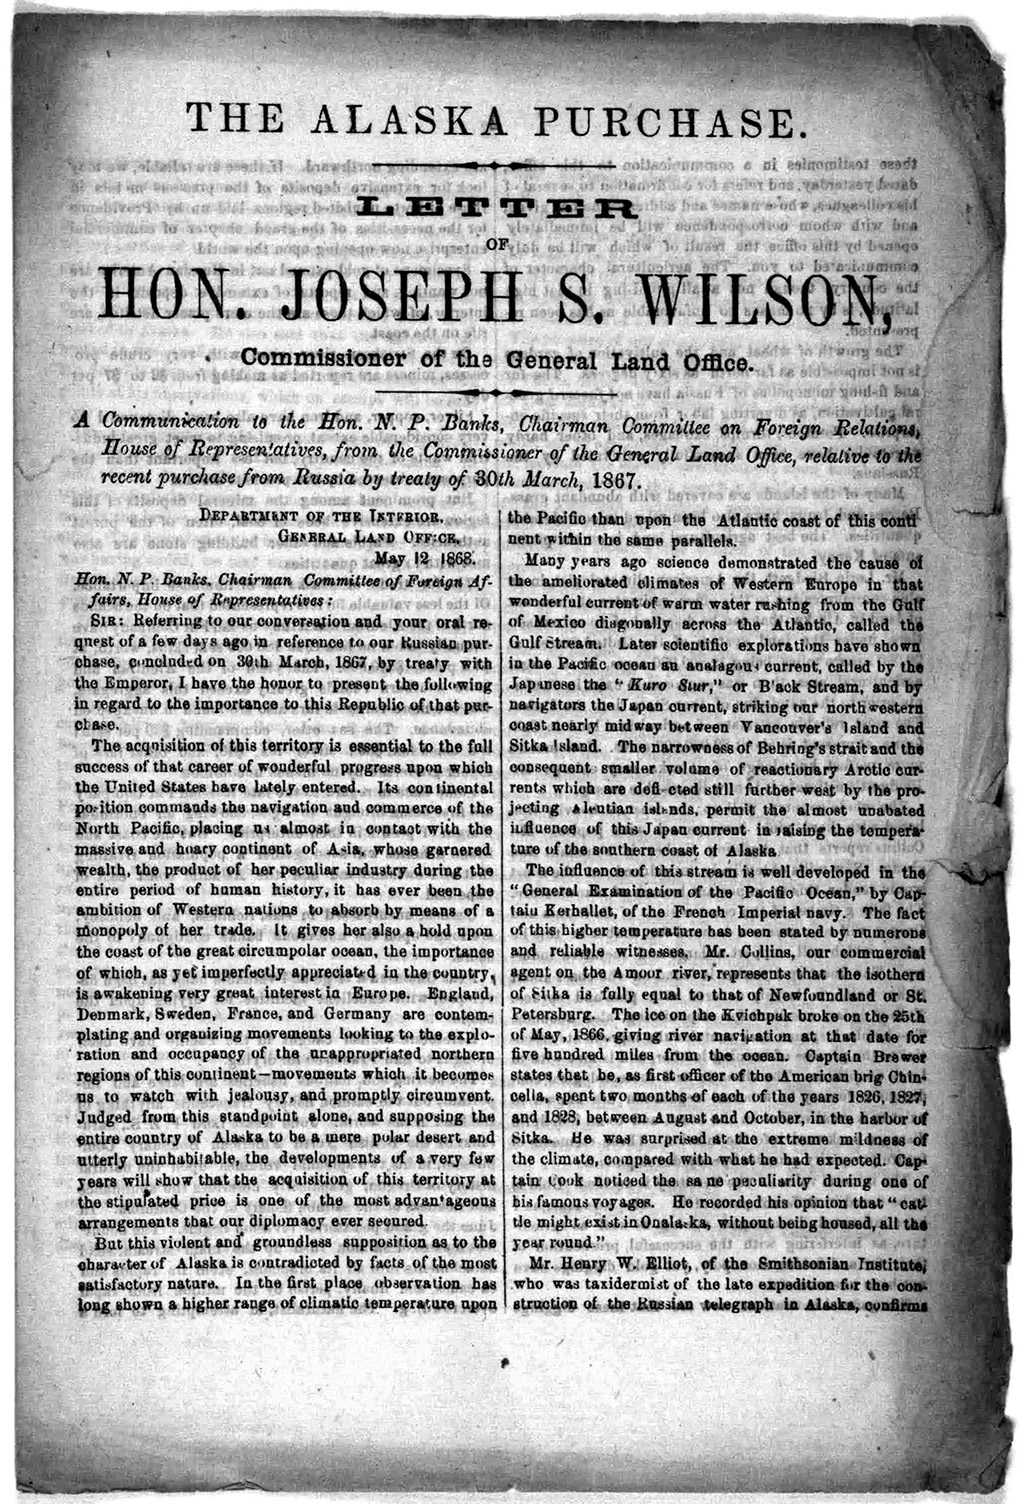
The Alaska purchase letter of Hon. Joseph S. Wilson, Commissioner of the General Land Office (Library of Congress)
The U.S. purchased Alaska from Russia on October 18, 1867 as part of American expansionist efforts. The Alaska Purchase, also known as the Treaty of Cession, excluded Alaska Natives from the rights provided to White people under the new U.S. government, including ownership of most of the land. Prior to the Alaska Purchase, the Alaska Native population had already dwindled due to the introduction of new diseases by the Russians. After the U.S. took over, the Alaska Native population continued to experience disenfranchisement and loss of their ancestral lands. In 1921, the Snyder Act eventually provided them full citizenship and the right to vote, and, in 1971, President Nixon ceded 44 million acres of federal land back to Alaska Native people.
Leonard Medical School graduating class of 1889 (Shaw University/ Wikimedia Commons)
Historically Black Colleges and Universities (HBCUs) are institutions of higher education that were established before 1964 to educate persons of African descent. HBCUs were founded in response to the exclusion of African American students from traditional colleges and universities due to segregation. In the late 19th century, there were seven Black medical colleges. After the 1910 Flexner report, only two remained — Meharry Medical College and Howard University. Today, Black doctors remain underrepresented in the health care workforce, and HBCU graduates make up 70% of Black doctors and dentists.
Cartoon on Irish and Chinese immigration to the United States (Library of Congress)
The law implemented a ten-year ban on Chinese laborers immigrating to the U.S., representing the first example of federal law restricting entry of an ethnic group. The initial ten-year ban was extended until 1943, ending after China and the U.S. established an alliance during World War II. The Act was informed by the 1877 Joint Special Committee to Investigate Chinese Immigration, which found that White laborers opposed Chinese immigration out of fear of loss of employment due to the low wage labor provided by Chinese immigrants. The Exclusion Act set a precedent for restricting immigration on the basis of race and fueled xenophobic sentiment and mistreatment of Chinese people in America that is still present today and rose amid the COVID-19 pandemic.
Advertisement for Indian land for sale (Library of Congress)
As part of efforts to break up reservation and Tribal lands, the Dawes Act authorized the president to distribute reservation land commonly held by Tribal members into allotments to individuals. In addition, the Dawes Commission created methods for identifying Tribal membership, including the development of the Dawes Rolls that identify ancestry through Tribal lineage. In the 1930s, some Tribes began using blood quantum requirements to determine eligibility for land distribution and other entitlements. While the policy was portrayed as an effort to protect American Indian property rights and alleviate poverty among American Indians, it reflected beliefs that American Indian people should assimilate to White culture and principles. These policies contributed to weakening of Native American conditions, as the land allotted to individuals included areas that were unsuitable for farming, some nomadic Native cultures did not easily adapt to an agricultural existence, and millions of acres of Tribal land were ultimately lost when sold to non-Native people.
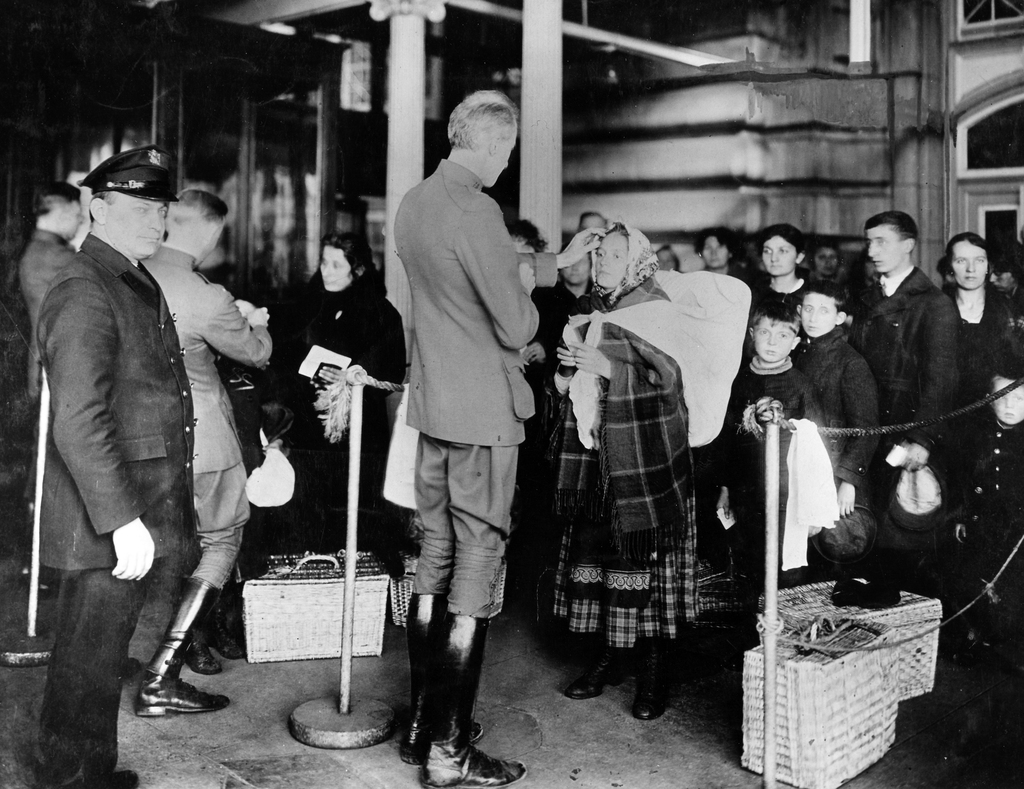
Public Health Service officers examining immigrants arriving to Ellis Island immigration station, New York (Wikimedia Commons)
The Act centralized the immigration enforcement authority of the federal government, extended immigration inspection to land borders, and expanded the list of excludable and deportable immigrants to include people who are likely to become a public charge, as well as those with infectious diseases. The law was passed during a period of increased immigration into the U.S. and led to further immigration exclusions following the Chinese Exclusion Act in 1882. The 1891 law set precedent for the Immigration Acts of 1903, 1907, and 1917, which established health and certain work status restrictions as well as literacy requirements for immigration that resulted in limiting immigration primarily from Asia and Mexico and reinforcing xenophobic sentiment.
U.S. Public Health Service (USPHS) Medical Inspections of Immigrants
U.S inspectors conducting eye exams at Ellis Island immigration station, New York (Library of Congress)
With increasing immigration starting in the 1880s and through the next century and growing concern about job displacement by immigrants and the potential spread of infectious diseases, the USPHS carried out medical examinations of immigrant populations entering the U.S. and identified whether they would become public charges (i.e., likely to become dependent on the government for support). In the late 19th and early 20th century, Asian and Mexican immigrants and Jewish immigrants from Eastern Europe were disproportionately impacted by these activities. Public charge determinations continue to be applied to immigrants in the U.S. today. The Trump Administration made changes to public charge determinations that extended them to take into account the use of non-cash government programs, including health care. These changes have since been rescinded by the Biden Administration, although many immigrant families continue to have fears and concerns about accessing health care and other non-cash assistance programs even if they and/or their children are eligible.
Black man drinking at “Colored” water cooler in streetcar terminal, Oklahoma City, Oklahoma (Library of Congress)
This Supreme Court ruling validated racial segregation by finding that the equal protection principles mandated by the Fourteenth Amendment could be honored with facilities that were “separate but equal.” Plessy v. Ferguson occurred in the aftermath of Reconstruction, during a time when conservative Democrats sought to roll back the gains made by Black people. The ruling has had long-term negative impacts on Black people’s access to opportunities, including quality health care, particularly in states that adopted laws upholding segregation within medical facilities, agencies, and societies. The legacy of the “separate but equal” ruling continued through state and local statutes (Jim Crow laws) through the mid-1960s (until its abolition by the Civil Rights Act in 1964). Ultimately, the combined effects of these statutes denied Black people the right to vote and attain educational or vocational opportunities, contributing to income, wealth, and health inequities that persist today.
San Francisco Call newspaper announces the U.S. flag raised in Hawai’i (Library of Congress/ Chronicling America: Historic American Newspaper)
Sanford Dole and the U.S. government dethroned the Hawaiian monarch Queen Lili’uokalani, following concerns that Hawai’i may become part of the European empire. Hawai’i, an independent sovereign nation, was officially annexed in 1898, as part of U.S. efforts to extend its territory and political power in the Pacific. Following Hawai’i’s occupation by Western people in the 1800s, the Native Hawaiian population was decimated due to the introduction of multiple infectious diseases, and their language and culture eroded with the institution of Christian and English boarding schools, as well as U.S. Federal Indian Boarding Schools. Despite some efforts by the U.S. government to make amends for the overthrow of Hawai’i’s monarchy, the legacy of colonization and cultural genocide contribute to ongoing health disparities for Native Hawaiian people.
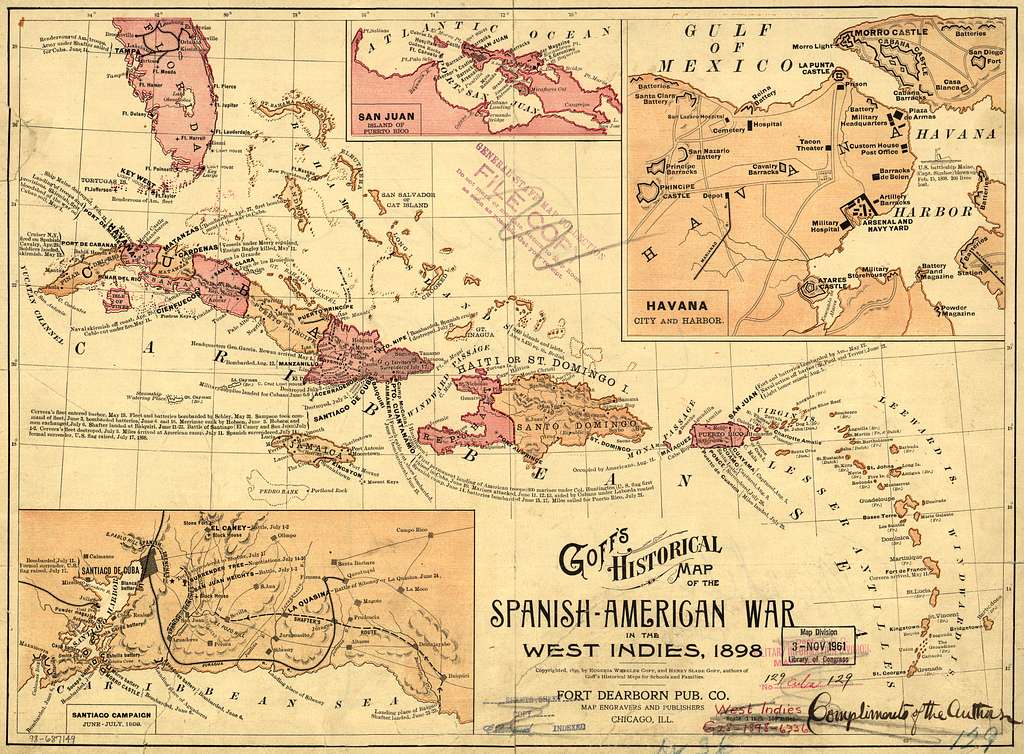
Goff’s historical map of the Spanish-American War in the West Indies (Library of Congress)
The peace treaty signed at the end of the war between the U.S. and Spain in 1898 provided independence to Cuba and gave the U.S. control of Puerto Rico, Guam, and the Philippines, with the Philippines eventually gaining independence in 1946. While residents of Puerto Rico and Guam are U.S. citizens, they are denied voting rights. The U.S. occupation and actions in these areas have had adverse impacts on the health of local and Indigenous people due to exposure to residual toxic waste disposed by the U.S. military and destruction of fertile land, negatively impacting diets and contributing to high rates of chronic conditions.
1900 to 1929
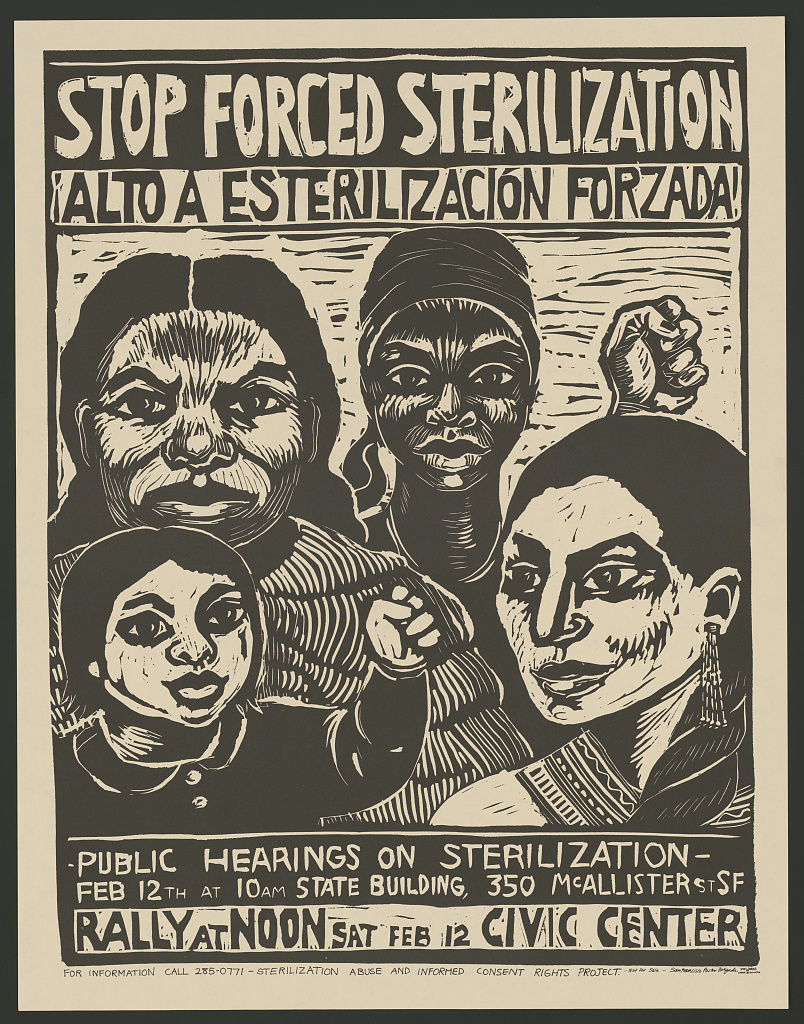
American Eugenics and the Forced Sterilization of Women of Color and Low-Income Women
Poster for rally to stop forced sterilization (Library of Congress)
The American Eugenics movement had origins in emerging theories of White supremacy and the belief that society would be improved without physical or mental illness. The American Eugenics movement eventually became legalized through eugenic sterilization laws in the early 1900s. Forced sterilization efforts targeted low-income communities of color as well as people with disabilities. In 1927, the U.S. Supreme Court made a decision in Buck v. Bell that upheld the Virginia Eugenical Sterilization Act of 1924, allowing the Commonwealth to sterilize people they considered to be unfit to have children. The decision helped pave the way for the enactment of other state sterilization laws. A study by the U.S. General Accounting Office found that between the years 1973-1976, more than 3,000 American Indian and Alaska Native women were sterilized without their permission. The mass sterilizations were influenced by the Family Planning Services and Population Research Act of 1970, which subsidized sterilizations for Medicaid and Indian Health Service patients. In 1974, a case found that two adolescent Black sisters in Montgomery, Alabama were coerced into federally funded sterilizations. The case revealed that many women of color had been sterilized under government programs. As a result of this case, a requirement was established for doctors to obtain informed consent before performing sterilization procedures. Evidence suggests that inappropriate sterilization practices have continued in the modern day, including among women detained by U.S. Immigration and Customs Enforcement.
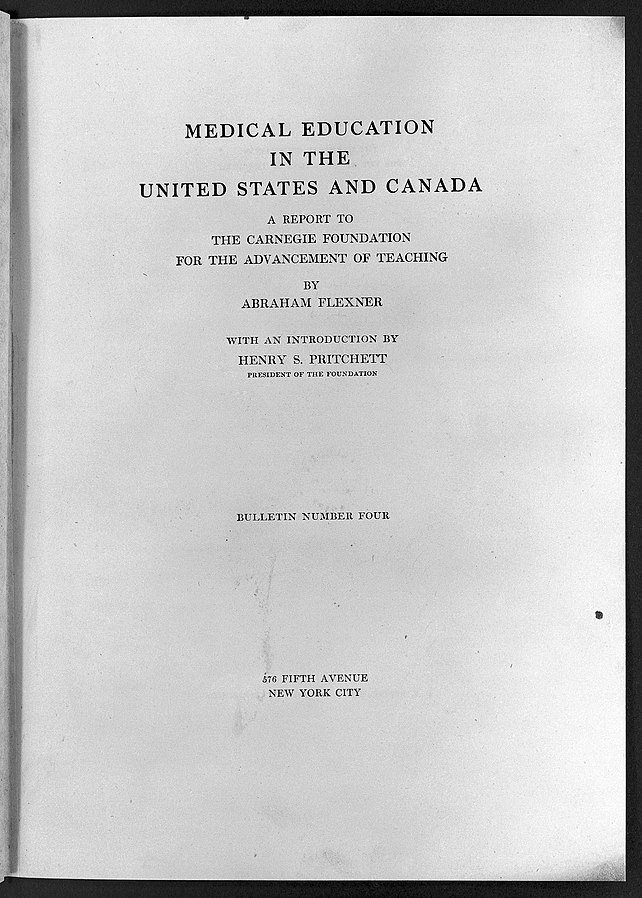
Cover page of the Flexner Report (Wellcome Collection)
The Flexner report was a landmark study funded by the American Medical Association and the Carnegie Foundation to assess the state of medical education in Canada and the U.S. The report’s recommendations contributed to the closure of five out of seven established medical schools that primarily trained Black physicians. In subsequent years, the number of trained Black physicians diminished greatly, while the number of White physicians increased. Today, Black physicians remain underrepresented in the health care workforce, with most of them training at the remaining two historically Black medical schools: Meharry Medical College and Howard University. In 2008, the American Medical Association issued a public apology for its past discriminatory practices against Black physicians and has since developed a policy and strategic framework aimed at addressing health equity, including creating a Center for Health Equity.
Greenwood Neighborhood on fire, Tulsa, Oklahoma (Library of Congress)
The destruction of Tulsa was a continuation of many racially-motivated massacres that began in 1917 and continued into the early 1920s. Known as the Red Summer, this period was marked by violence against Black people and was influenced by the Great Migration of Black people from the South to the Northern U.S. and the return of Black veterans from World War I. The Tulsa massacre was one of the worst instances of racial violence in U.S. history and resulted in the displacement of approximately 10,000 people and the destruction of nearly 1,500 homes and businesses. Estimates of mortality from this event range from 30 to 300 deaths. In 1997, Oklahoma formed the Tulsa Race Riot Commission to document and investigate the Tulsa massacre.
Ozawa v. United States, United States v. Thind, and The Immigration Act of 1924 (Johnson-Reed Act)
In 1922 and 1923, the Supreme Court ruled that Takao Ozawa and Bhagat Singh Thind were ineligible for naturalization because they were not White. Following the United States v. Thind ruling, many Asian Indian American people who had been naturalized had their citizenship status rescinded. The Immigration Act of 1924 continued the legacy of exclusion of Asian immigrants from entry into the U.S., particularly people from Japan. These two Supreme Court cases and the exclusionary immigration policies of the time specified that Asian people were not “free White persons” and, therefore, were excluded from becoming naturalized U.S. citizens. These policies were enacted following the Red Scare of 1919-1920, a period when many people in the U.S. feared the rise of perceived support of communist, socialist, or anarchist ideology, which prompted nationalist ideologies within the U.S. and fears of immigrants and foreigners.
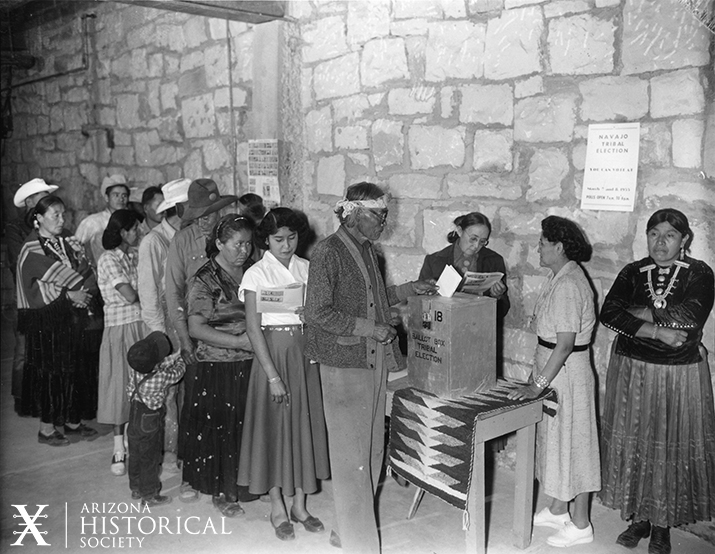
Navajo voters cast their ballots in the 1955 Tribal election (Arizona Historical Society)
The Snyder Act gave U.S.-born American Indian people full citizenship and provided them with the right to vote (as American Indian people had been excluded from voting rights despite the passage of the Fifteenth Amendment in 1870). However, states did not implement voting rights universally for American Indian people until nearly a half-century following the Snyder Act. The exclusion of American Indian voters persists today via voter registration and literacy barriers, as well as poor investment into resources and infrastructure on reservations.
1930 to 1939
The U.S. Public Health Service (USPHS) Untreated Syphilis Study at Tuskegee
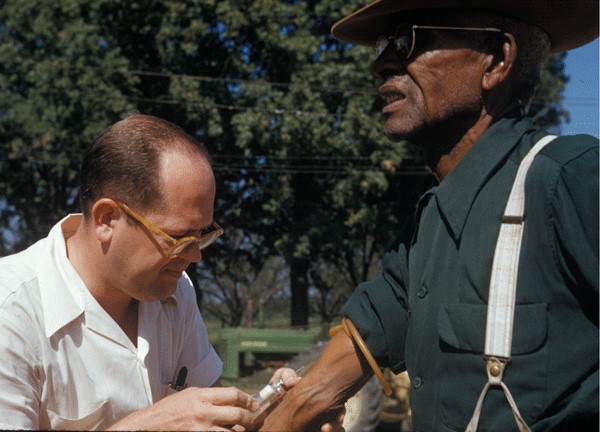
Doctor injects test subject with placebo as a part of the USPHS Untreated Syphilis Study at Tuskegee (Centers for Disease Control and Prevention)
The Untreated Syphilis Study at Tuskegee was a 40-year experiment conducted by the U.S. Public Health Service that studied the progression of untreated syphilis in 600 poor, Black sharecroppers without their consent. Participants were told they were receiving free government medical care but not that they had syphilis. They were left untreated when treatment for syphilis became available so researchers could study the progression of the disease. Years later, in 1974, the National Research Act created the National Commission for the Protection of Human Subjects of Biomedical and Behavioral Research, which developed principles of ethical research conduct and informed consent standards. The history of Tuskegee and other instances of medical experimentation on Black people is one factor contributing to mistrust of researchers and the health care system and has contributed to increased mortality among Black men due to decreased use of health care services. In 2024, the CDC Foundation launched an endowed scholarship program to support the Voices For Our Fathers Legacy Foundation scholarships in recognition of the experiences of the Black men involved in the Untreated Syphilis Study at Tuskegee. The program seeks to raise a $5 million endowment that will provide annual $100,000 scholarships for the descendants of the Black men who were a part of the study.
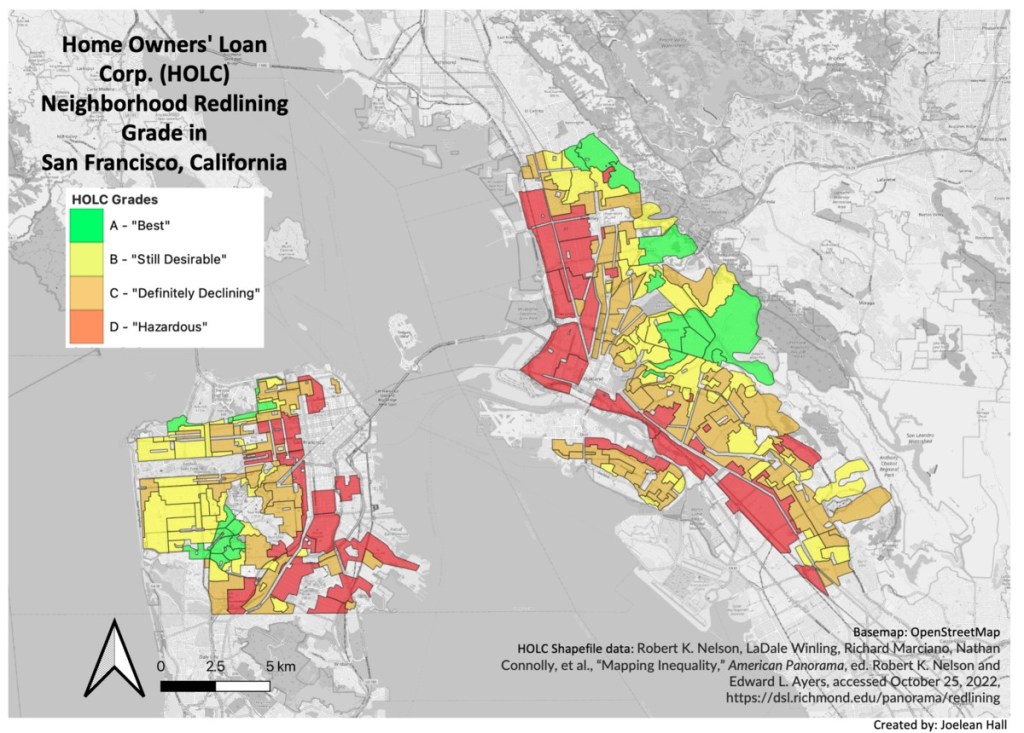
Home Owner’s Loan Corporation map of redlining in San Francisco, California (Joelean Hall/ “Mapping Inequality” American Panorama / Wikicommons Creative Commons)
The Home Owners’ Loan Corporation was authorized by the federal government to grade residential neighborhoods based on their mortgage security. Neighborhoods that were considered low risk for banks and other mortgage lenders were marked green, while neighborhoods that were considered hazardous were marked red (redlining). One of the factors that determined the grading of neighborhoods was the racial makeup of the community that lived there. Redlining resulted in racial segregation and large inequities in economic opportunity that have ongoing negative associations with health today, including disproportionate exposure to environmental health risks, such as extreme heat.
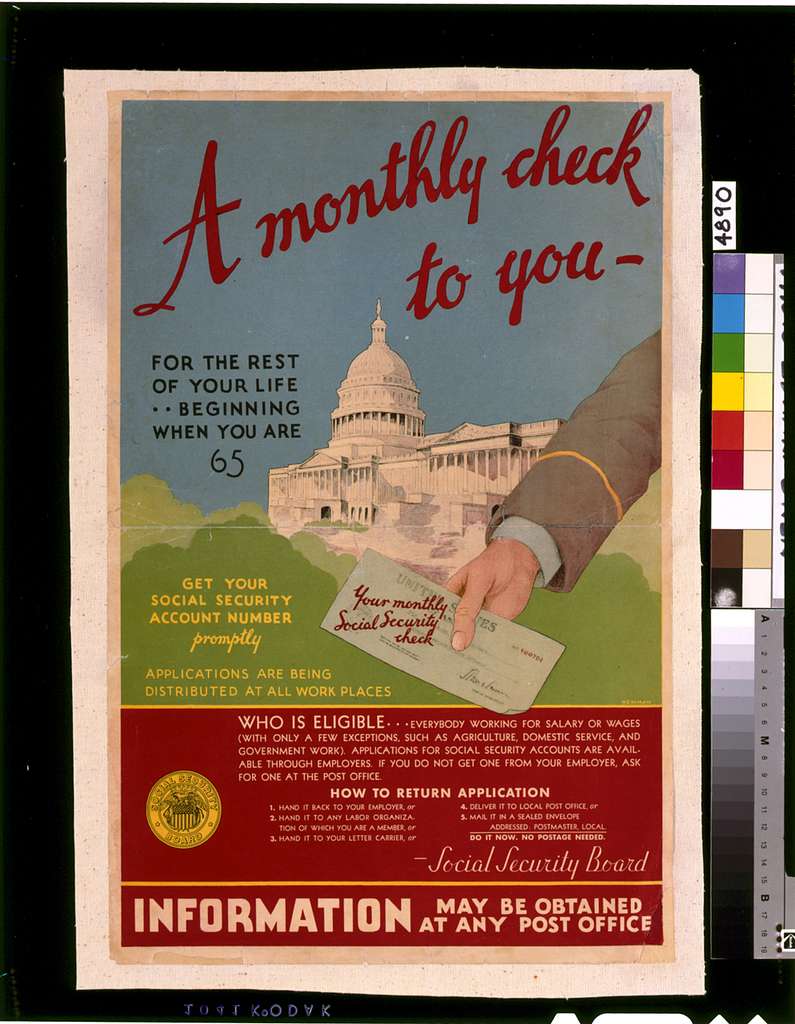
The Social Security Act (SSA) and Social Security Amendments
Poster with information on eligibility for Social Security (Library of Congress)
Amidst the Great Depression, the SSA was passed to create a federal safety net and general welfare system for older adults, persons who were unemployed, and persons with disabilities. In 1954, the SSA Amendments initiated a disability insurance program (Social Security Disability Insurance) providing additional economic protections for workers with disabilities aged 50-64 and for retired or deceased workers’ dependent adult children who developed disabilities before the age of 18. Social Security plays a large role for income in retirement for people of color, who are less likely to have accumulated wealth or benefits from pensions or retirement savings, which has implications for health. Research suggests that the improvements in socioeconomic status resulting from the Social Security program are associated with improvements in health among older adults in the U.S., including declines in mortality.
Title V Maternal and Child Health Block Grant Program
Enacted as part of the Social Security Act, the Title V program’s original purpose and design focused on addressing the impacts of poverty on maternal and child health following the Great Depression. Today, the program provides grant funding to states and jurisdictions to provide services to pregnant women, infants, and children, including children with special health care needs.
The NLRA expanded union rights resulting in higher wages and benefits (such as health insurance) but excluded multiple industries (such as service, domestic, and agricultural workers and independent contractors) and allowed unions to discriminate against workers of color in other industries. The Fair Labor Standards Act passed in 1938 established standards pertaining to minimum wage, overtime pay, recordkeeping, and youth employment, but also excluded agricultural workers until the 1960s. The NLRA’s exclusion of domestic and agricultural industries had disproportionate impacts on people of color, resulting in a higher proportion of people of color working in lower-earning jobs and in jobs that do not provide benefits, including health insurance.
1940 to 1959
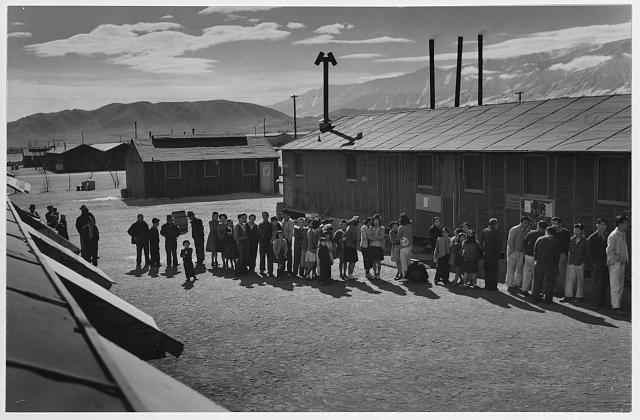
Japanese American Incarceration During World War II (WWII)
Mess line at noon in Manzanar Relocation Center, California (Library of Congress)
In reaction to the attacks on Pearl Harbor and the ensuing war, President Roosevelt signed an Executive Order that established Japanese incarceration camps, wherein people of Japanese descent, including U.S. citizens, were incarcerated. The Supreme Court ruled incarceration camps during WWII as constitutional despite the inhumane conditions of the camps. In addition to forced displacement and loss of livelihood, Japanese American people lived under hazardous conditions in the camps. They experienced long-term health impacts including post-traumatic stress disorder and poorer physical health, which have ongoing intergenerational impacts on health and well-being today. In recognition of the harms done to Japanese American people during their incarceration in WWII, the Office of Redress Administration (ORA) was established under the Civil Liberties Act of 1988. The ORA was tasked with administering a ten-year restitution program that provided a non-taxable $20,000 payment to eligible people of Japanese ancestry.
Grace Hospital in Morganton, North Carolina, which was funded in part by the Hill-Burton Act (Blue Ridge Healthcare Foundation)
The Hospital Survey and Construction Act (informally known as the Hill-Burton Act) provided construction grants and loans to build public hospitals in high need areas. Many facilities in the South used Hill-Burton funds, which disallowed blatant discrimination against Black patients but continued to codify the idea of “separate but equal.” Federal funds from the Act were used to build, maintain, and expand “separate but equal” hospitals and other health facilities that segregated patients and medical providers by race. Following growth in hospital capacity resulting from the funds, a study found that, in the South, only 6% of hospitals offered unrestricted services to Black people, 31% did not admit any Black people to their facilities under any conditions, and 47% had segregated wards for White and Black people, while in the North, 83% of hospitals reported some degree of integrated services.
Henrietta Lacks around the year 1945 (Rebecca Skloot, The Immortal Life of Henrietta Lacks, Crown Books)
Following her death due to cervical cancer in 1951, scientists at Johns Hopkins Hospital took and used samples of cancerous cells for medical research from Henrietta Lacks, a 31-year-old Black mother of five from Virginia, without her or her family’s knowledge or consent. Lacks’ cells have become one of the most vital cell lines (HeLa Cell Line) in medical research and have been used to develop the polio vaccine and in cancer, AIDS, and COVID-19 research. The use of Lack’s cells is part of a long line of non-consensual and uninformed medical research and experimentation practices on Black people. In recent years, scientific boards have revised the Federal Policy for the Protection of Human Subjects (The Common Rule) to increase protections of people who participate in research studies. Johns Hopkins recognizes that the collection of Lacks’ cells was reflective of the lack of consent laws in the 1950s and that the practice would be considered unethical today. Over the years, Johns Hopkins has worked with the Lacks family to honor Henrietta Lacks and her contribution to science and health advancement as well as to improve research practices.
The Immigration and Nationality Acts (INA) (McCarren-Walter Act and the Hart-Celler Act)
Issei citizenship ceremony in 1960 (Japanese American Museum of Oregon/ Flickr Images Creative Commons)
The INA of 1952 reformed aspects of immigration law, including ending Chinese exclusion from immigration and adding an immigration system of preference for skilled workers and those who were family members of U.S. citizens and lawful permanent residents. However, the law still upheld the national origins quota that mainly affected people of Asian origin. The INA of 1965 reversed the U.S. policy of restricting immigration by national origin, banning discrimination in the issuance of visas by “race, sex, nationality, place of birth and/or residence.” The shift in policy reflected the rapidly changing global geopolitical climate, with many countries in Asia, Africa, and Central and South America gaining independence and the formation of multilateral organizations. After the passage of the law, the U.S. experienced a large increase in immigration and a reversal of trends, with a dramatic decrease in the proportion of immigrants from Europe and an increase in immigration from other regions.
Young Mexican boy cutting spinach, La Pryor, Texas (Library of Congress)
The derogatory termed “Operation Wetback” initiative resulted in the deportation of at least one million Mexican people. The program was enacted during a time when Southwestern states were reliant on agricultural labor from Mexico and encouraged temporary migration into the U.S. through the Bracero Program. In 1951, a Commission on Migratory Labor released a report that blamed Mexican workers for low wages and expressed concerns that returning soldiers and citizens would be unable to find work in the Southwest. The cross-border collaboration between the Mexican and U.S. governments during “Operation Wetback” expanded migration control along the U.S.-Mexico border. “Operation Wetback” was a continuation of a pattern of deportation of Mexican and Mexican American people, including the repatriation of close to 2 million Mexican and Mexican-American people during the 1930s. The mass deportation of immigrant populations and people of color during difficult economic times has occurred throughout American history and was brought back to the forefront of American consciousness during the Trump Administration.
The National Association for the Advancement of Colored People (NAACP) began challenging segregation in public education in the late 1940s by encouraging Black parents to enroll their children in all-White schools. The all-White schools rejected the Black students’ applications. Following the rejections, the NAACP filed class action lawsuits that claimed that the education offered at Black schools was inferior to that offered at White schools, which violated the Fourteenth Amendment equal protection clause. The Supreme Court agreed and ruled that having separate educational facilities for Black and White students was unequal. The Brown v. Board of Education decision struck down the “separate but equal” doctrine of the Plessy v. Ferguson decision and was a key precursor to the Civil Rights Movement.
Logo of the Indian Health Service (United States Department of Health and Human Services)
The federal government has a trust responsibility to meet the health care needs of American Indian and Alaska Native people. Established in 1955, the IHS is the primary mechanism through which the federal government fulfills its trust responsibility to provide health care to AIAN people. However, the IHS is not health insurance and has been historically underfunded and unable to meet their health care needs. AIAN people continue to have lower life expectancies than other racial and ethnic groups and fare worse across numerous health measures.
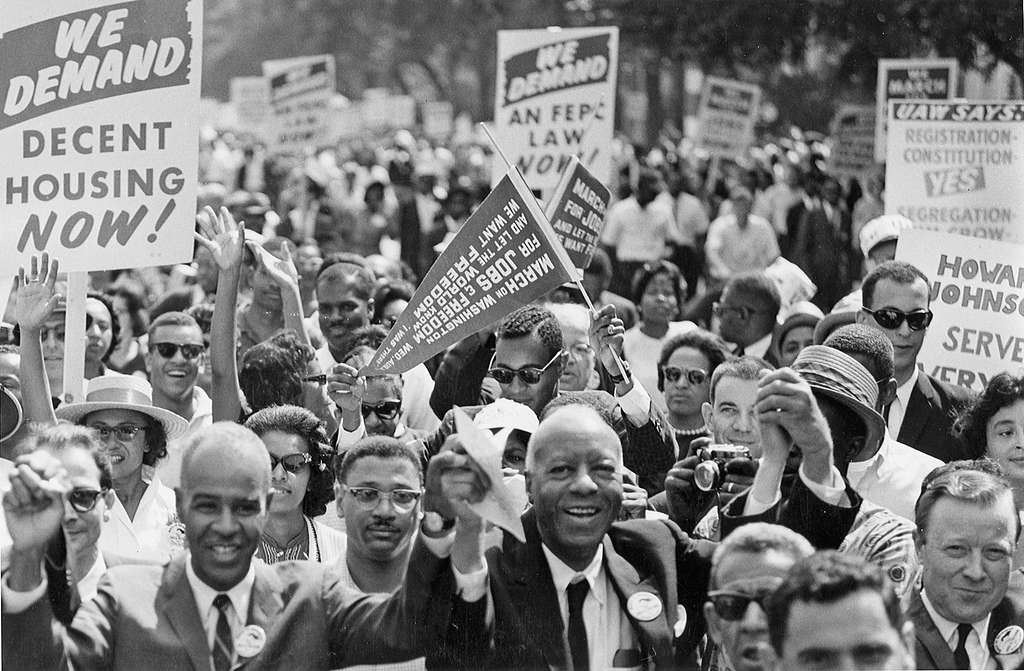
People gathered for the Civil Rights March on Washington D.C. in 1961 (National Archives and Records)
The mid-1900s were marked by a Black people-led nationwide movement that included sit-ins in North Carolina, the Montgomery bus boycott, the March on Washington, and other key events that sought to end racial segregation and achieve equal rights. In 1957, President Eisenhower enacted the Civil Rights Act of 1957, which established the Civil Rights Section of the Justice Department and the federal Civil Rights Commission. It provided the federal government with the ability to investigate obstacles to individuals’ right to vote and instances of discrimination, as well as to develop solutions to address them.
1960 to 1969
President’s Committee on Equal Employment Opportunity and Affirmative Action
President Kennedy established the President’s Committee on Equal Employment Opportunity via Executive Order and required government employers to practice nondiscrimination in their hiring practices and “take affirmative action to ensure that applicants are employed and that employees are treated during employment, without regard to their race, creed, color, or national origin.” The Executive Order was implemented in the wake of World War II and during the Civil Rights Movement. As military members began returning to the U.S., gains made by people of color and women in employment and other sectors began to recede. The Executive Order sought to rectify this situation and ensure equitable hiring practices.
Dr. Simkins, a dentist frustrated with the conditions of the all-Black hospitals he worked in, filed a lawsuit against two local hospitals with the assistance of the National Association for the Advancement of Colored People. Dr. Simkins won this landmark federal case, arguing that the hospitals, as Hill Burton funding recipients, failed to provide equal protection as required by the Constitution. The case set the precedent for ending overt segregation and discrimination in hospital settings. The 1964 Civil Rights Act prohibited programs that receive federal funds from discriminating on the basis of race, creed, or national origin. The subsequent establishment of Medicare in 1965, which included federal funding to support hospitals and made them subject to the Civil Rights Act, led to the eventual desegregation of hospitals and health care facilities.
The first printed food stamps (Library of Congress)
SNAP was established by the U.S. Department of Agriculture to address food insecurity and hunger in the U.S. by providing support to lower income families. SNAP grew out of the Food Stamps program, which was introduced in the 1930s during the Great Depression to address poverty and food insecurity. Overall, people of color are more likely to experience food insecurity and to have incomes below poverty compared to White people. Research shows that SNAP reduces poverty and food insecurity, promotes positive health outcomes, lowers health care costs, and reduces disparities in food insecurity.
Federally Qualified Health Centers and the Health Center Program
The Economic Opportunity Act of 1964 was passed as part of efforts to combat poverty in the U.S. The Act sought to increase educational and training opportunities to expand employment options and to address many social and economic drivers of poverty. A major health-related legacy of the Economic Opportunity Act was the development of Federally Qualified Health Centers or community health centers (CHCs). The nation’s first CHCs were launched in 1965 as part of a small demonstration program within the Office of Economic Opportunity and made permanent by Congress. CHCs were placed in areas with high levels of poverty and were tasked with providing comprehensive health services to low-income residents of those neighborhoods. Today, hundreds of CHCs across the U.S. serve low-income, medically underserved communities. Some health centers focus on meeting the needs of specific populations. For example, members of the Association of Asian Pacific Community Health Organizations are located in areas with high concentrations of medically underserved Asian American, Native Hawaiian, and Pacific Islander people and lead efforts to provide linguistically and culturally appropriate care for these groups. The federal Migrant Health Program funds health centers across the country that specialize in providing care to farmworkers and their families.
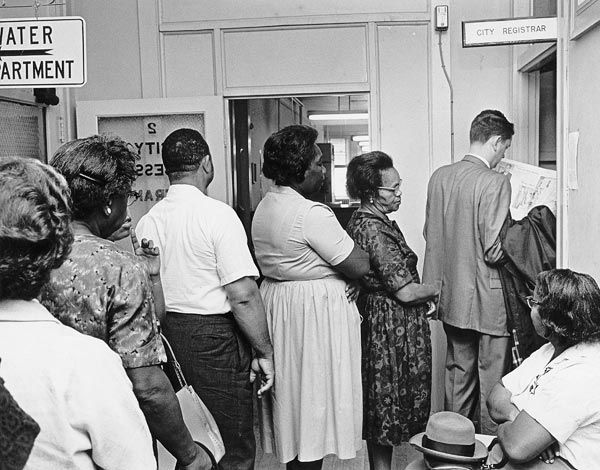
People of Virginia waiting in line to register to vote (The Library of Virginia and the Library of Congress)
The Civil Rights Act of 1964 and the Voting Rights Act of 1965 prohibited discrimination by race, sex, religion, color, or national origin, enforced the desegregation of schools, and guaranteed the right to vote as well as equality in employment, use of and access to federally funded programs, and access to public areas. While the Civil Rights Acts did not end discrimination, they ended the Jim Crow era laws and provided legal and legislative avenues for people to uphold these ideals and challenge instances of discrimination and inequitable treatment. The impact of the Voting Rights Act was immediate; a quarter of a million new Black voters were registered in 1965. Research suggests that civil rights protections for people of color have positively impacted health.
Legacies of Malcolm X and Dr. Martin Luther King Jr.
Dr. Martin Luther King Jr. and Malcolm X attend King’s press conference on the Civil Rights Act of 1964 at the U.S. Capitol (Library of Congress)
Dr. Martin Luther King Jr. and Malcolm X were prominent leaders of the Civil Rights Movement. While both leaders had different approaches to addressing racial inequality, they had shared missions of uplifting Black people within the U.S. and globally. Malcolm X was assassinated in 1965 and his legacy continues to this day. He popularized Black pride, autonomy, and independence among Black people. Dr. Martin Luther King was assassinated in 1968; his liberation work continues to inspire civil rights movements and liberation movements across the globe.
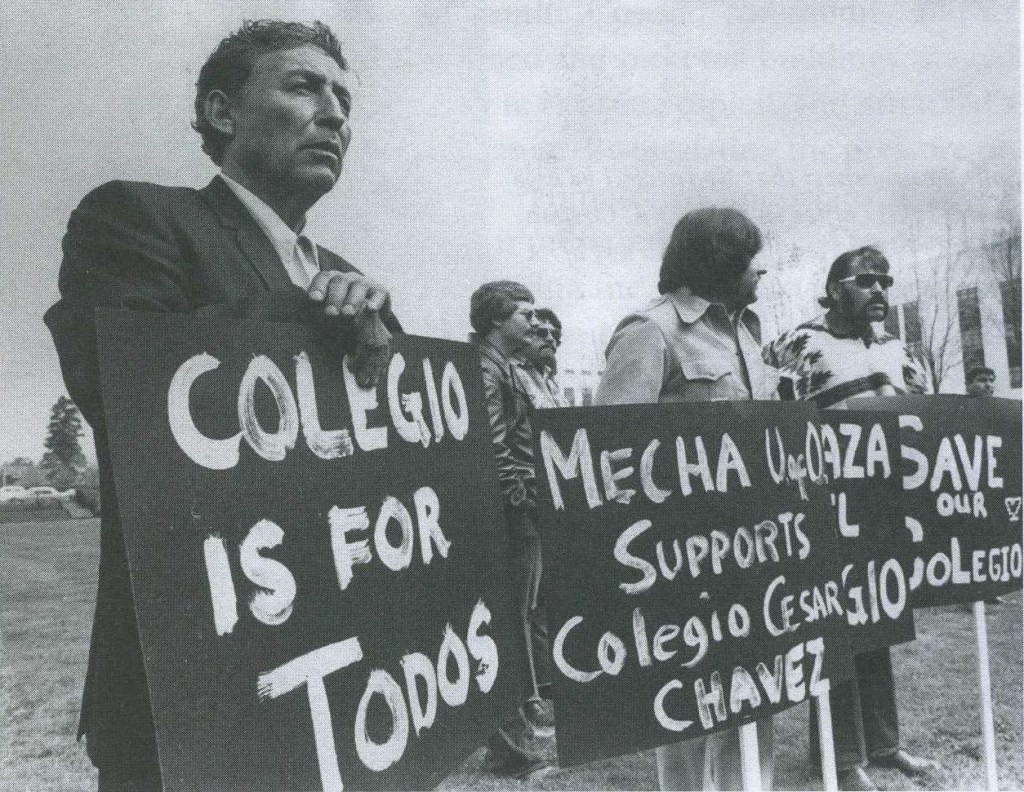
Protesters rally against the shutdown of the first Chicano/Latino university, Cesar Chavez University (Wikimedia Commons Creative Commons)
The Chicano Movement sought to achieve equity in labor and politics for Mexican American people. Amid growing political and social activism following World War II, the National Farm Workers Association (NFWA) was founded by Cesar Chavez and other Chicano activists to defend farmworker rights. The NFWA was a predecessor to the United Farm Workers Organizing Committee, which made major gains in voter registration among Mexican American people, gained labor contracts, and improved working conditions for farmworkers. The Chicano Movement has had many impacts including increased equality in education and increasing Mexican American representation among teaching staff, working to ensure that health care forms are available in both Spanish and English, and solidifying the Hispanic community as an important voting bloc in the U.S.
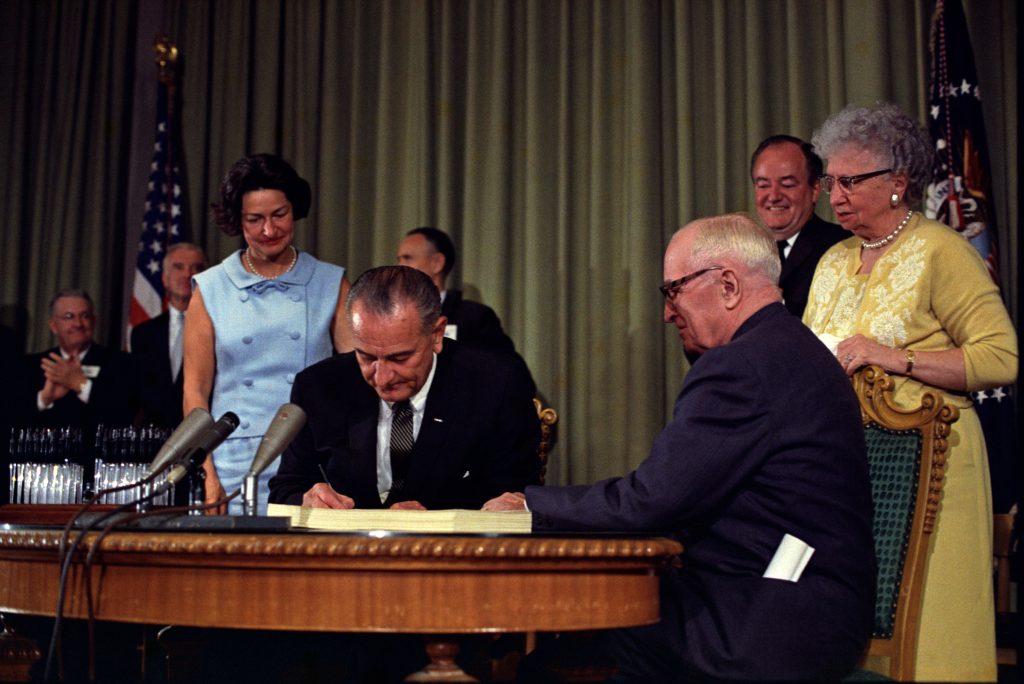
President Lyndon B. Johnson signs Medicare Bill at the Harry S. Truman Library (Lyndon Baines Johnson Library and Museum, Independence, Missouri)
The 1965 Social Security Amendments (SSA Amendments) established Medicare as a nationwide health insurance program for adults age 65 and older and some younger people with disabilities. The SSA Amendments also established Medicaid as a joint federal-state health insurance program for certain low-income adults and children and long-term care program for adults 65 and older and younger adults with disabilities. Medicare and Medicaid were preceded by the Kerr-Mills Act in 1960 that provided funds to states that chose to cover health care services for older adults with incomes above levels needed to qualify for public assistance. Today, Medicaid, along with the Children’s Health Insurance Program, which was established in 1997, provide health and long-term care coverage to millions of low-income individuals in the U.S. and are a key source of funding for hospitals, community health centers, physicians, and nursing homes. Medicaid is a major source of coverage for people of color, helping to ensure access to care and providing financial protection from health care costs. Medicare provides coverage to more than 60 million people ages 65 and older and younger adults with long-term disabilities. Nearly a quarter of beneficiaries are people of color. The program has helped to mitigate racial and ethnic inequities in health care, including leading to the desegregation of hospitals.
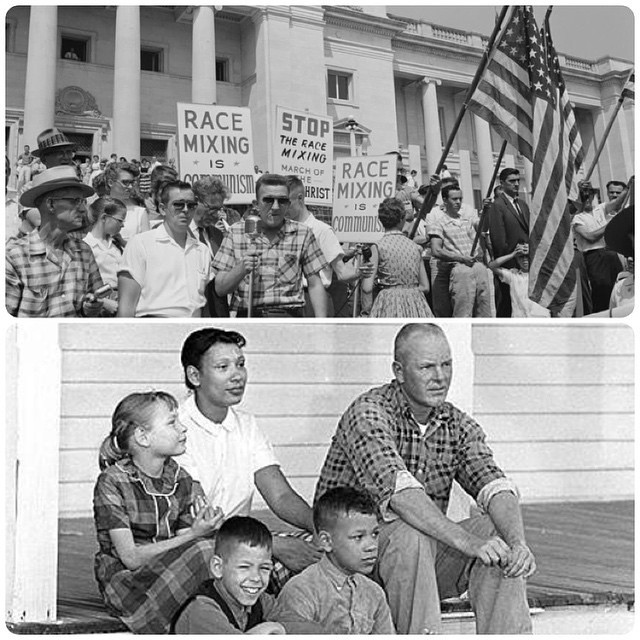
A protest against the end of anti-miscegenation laws, Mildred and Richard Loving and their family (Soullfull / Flickr Images Creative Commons)
Through the mid-20th century, Jim Crow and other state anti-miscegenation laws banned interracial marriages throughout many parts of the U.S. In 1958, Richard and Mildred Loving, a married interracial couple, were arrested and convicted of violating Virginia’s Racial Integrity Act. Amongst other racially discriminatory policies, the law prohibited interracial marriage. In 1964, the Lovings sought to have their sentences vacated, stating that the court’s decision violated their Fourteenth Amendment rights to equal protection under the law. After several losses in the lower courts, in 1967, the Supreme Court decided in favor of the Lovings, stating that anti-miscegenation laws did violate the Fourteenth Amendment equal protection clause by restricting marriage due to race. By allowing interracial couples to marry, Loving v. Virginia expanded access to government benefits associated with marriage. The case also informed later Supreme Court decisions on the right to marry, including Obergefell v. Hodges, which extended the right to marry to same sex couples across the nation, and, in turn, extended access to benefits, including health insurance coverage.
The Fair Housing Act (Title VIII of the Civil Rights Act of 1968)
A protest for fair housing in Lake City, Washington (Seattle Municipal Archives/ Flickr Images Creative Commons)
Expanding on previous legislation, the Act prohibited discrimination based on race, religion, national origin, sex, disability, and family status for the sale, rental, and financing of housing. Despite this law, racial disparities in home ownership and wealth and housing segregation have persisted. Research documents a strong connection between housing and health. The impacts of housing segregation on health are manifold but have been associated with poorer pregnancy outcomes and increased mortality, particularly for Black communities.
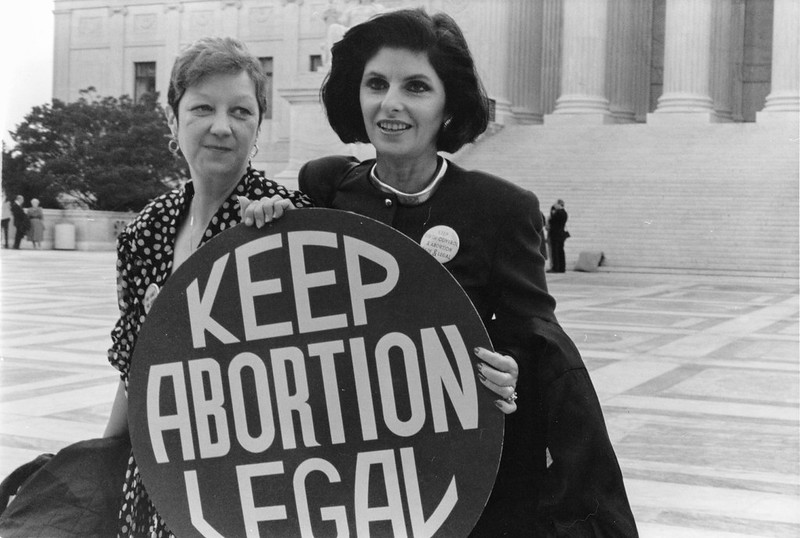
The Title X Family Planning Program was established to address the rise in adverse reproductive health outcomes and unplanned pregnancies in the mid-20th century and aimed to ensure that all people had access to comprehensive and preventive reproductive health care regardless of income. Since their development, Title X clinics have been a key source of reproductive care for low-income women and women of color. Over the years, Title X clinics have faced programmatic changes in federal funding for abortion services, which have impacted people’s access to and use of Title X clinics and reproductive health care.
Norma McCorvey, known as Jane Roe, and her attorney Gloria Allred stand outside the Supreme Court (Lorie Shaull / Flickr Images Creative Commons)
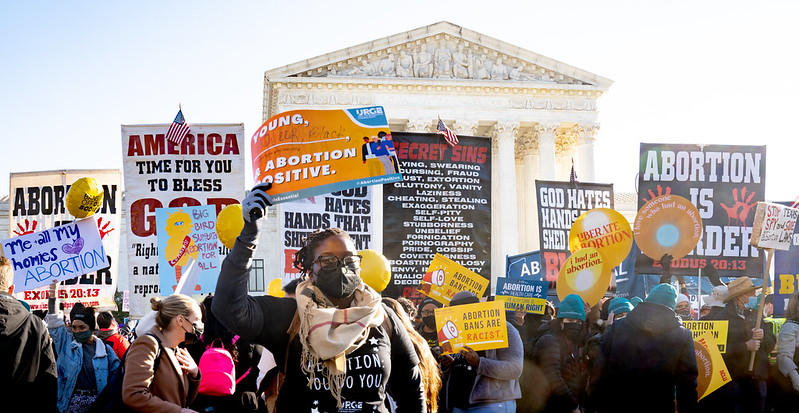
In this Supreme Court case, Jane Roe challenged a Texas law that made abortion illegal in all cases except when necessary to save a woman’s life, arguing that the law violated the Constitutional right to privacy. The court’s decision decriminalized abortion nationwide. Following the court’s decision, Congress enacted the Hyde Amendment, which prohibited the use of federal funds in Medicaid and other public programs to pay for abortions outside of the exceptions of rape, incest, or if the abortion is deemed medically necessary. The Hyde Amendment disproportionately impacts people of color, who are more likely to be insured by Medicaid. The June 2022 Supreme Court ruling in Dobbs v. Jackson overturned the longstanding Constitutional right to abortion and eliminated federal standards on abortion access that had been established by earlier decisions, allowing states to establish laws protecting or restricting abortion. The overturning of Roe v. Wade will likely disproportionately impact people of color, as they are more likely to seek abortions and more likely to face structural barriers that will make it more difficult to travel out of state for an abortion, including more limited access to health care and fewer financial and transportation resources. Increased barriers to abortion for people of color may widen the already existing large disparities in maternal and infant health, have negative economic consequences for families, and increase the risk of criminalization for people of color.
The EITC was established in 1975 to provide financial assistance to low-income, working families with children and is the largest refundable tax credit for low-to-middle-income families. Evaluations of the EITC have found that it lowers overall inequality between Black and White households. The EITC has boosted the incomes of millions of women of color, with some evidence that receiving EITC benefits is associated with increased birthweight for infants born to Black women. Other research suggests that income from the EITC has long-term benefits for educational attainment and greater health improvements with more generous EITC benefits.
Indian Self Determination and Education Assistance Act (ISDEAA)
President Gerald R. Ford greets the Chairman of the Kiowa Tribe and other Native Americans at a campaign rally in Oklahoma (National Archives/ Gerald R Ford White House Photographs)
The ISDEAA was enacted in the midst of many civil rights movements and aimed to reverse some of the paternalistic policies directed toward American Indian people and to strengthen and restore Tribal sovereignty. The Act allowed the U.S. Department of Interior and the U.S. Department of Health and Human Services to contract with federally recognized Tribes for federal services. Over time amendments have been made to the ISDEAA, many of which have sought to make the self-governance legislation permanent as well as further strengthen Tribal sovereignty.
Special Supplemental Nutrition Program for Women, Infants, and Children (WIC)
WIC is a federal program that provides funding to states to help them provide nutritious foods, health care referrals, and nutritional information to low-income women and children under the age of five who may be at risk of or are experiencing food insecurity. Research has found that participation in WIC is associated with improved infant health outcomes (reduced likelihood of preterm birth and decreased infant mortality), with some evidence of reduced inequities for low-income mothers and mothers of color.
The ICWA governs jurisdiction over the removal of American Indian children from their families in custody, foster care, and adoption cases and gives Tribal governments exclusive jurisdiction over children who live on a reservation. The Act was put in place during a time when many American Indian children were being separated from their families and being adopted by White, non-Native families. Often, the rationale for separating these children from their families was rooted in the assimilation doctrine of the time and not performed in the best interest of the children or their families. Over time, the ICWA helped in the reversal of efforts to forcibly assimilate American Indian people into White dominant culture.
The first cases of what would later become known as acquired immunodeficiency syndrome (AIDS) were reported in the U.S. in 1981. Although there have been some promising trends such as reductions in new HIV infections among some groups, HIV continues to have a disproportionate impact on certain populations, particularly people of color, gay and bisexual men, men who have sex with men, and transgender women. Because of these disproportionate impacts, overall federal investment in HIV plays an important role in addressing the epidemic for these groups. In 1998, President Clinton created the Minority AIDS Initiative (MAI) in response to advocacy efforts by leaders in the Black community and Centers for Disease Control and Prevention data that showed the disproportionate impact of HIV on Black people. The MAI is the first program with resources focused on addressing the impact of HIV in disproportionately affected communities. It aimed to strengthen organizations serving communities of color in an effort to improve HIV-related health outcomes and reduce HIV-related disparities. Though a relatively small investment compared to other federal HIV funding, the initiative plays an important role in providing direct services to historically marginalized racial and ethnic groups. In August 2022, the White House Office of National AIDS policy developed and released the National HIV/AIDS strategy (2022-2025), which outlined the nation’s action plan for ending HIV in the U.S. by 2030 and recognized racism as a driver of persistent disparities in the HIV epidemic.
The Migrant and Seasonal Agricultural Worker Protection Act (MSPA)
Filipino immigrants cut and load lettuce, Imperial Valley, California (Library of Congress)
Lack of clear guidance on responsibilities and obligations of agricultural employers to guarantee migrant worker protections led to the passage of the MSPA, the main federal law protecting farmworkers. The MSPA requires farm labor contractors to register with the U.S. Department of Labor and establish employment standards pertaining to wages, housing, transportation, and working conditions for migrant and seasonal agricultural workers. Despite these protections, migrant farmers continue to be subject to many labor abuses such as wage theft, unsafe working, and substandard living situations. Migrant farmworkers, a large majority of whom are Mexican immigrants, have higher morbidity and mortality compared to the general population due to occupational hazards (including higher exposures to pesticides, carcinogens, and extreme weather conditions), substandard living conditions, and barriers to accessing health care services.
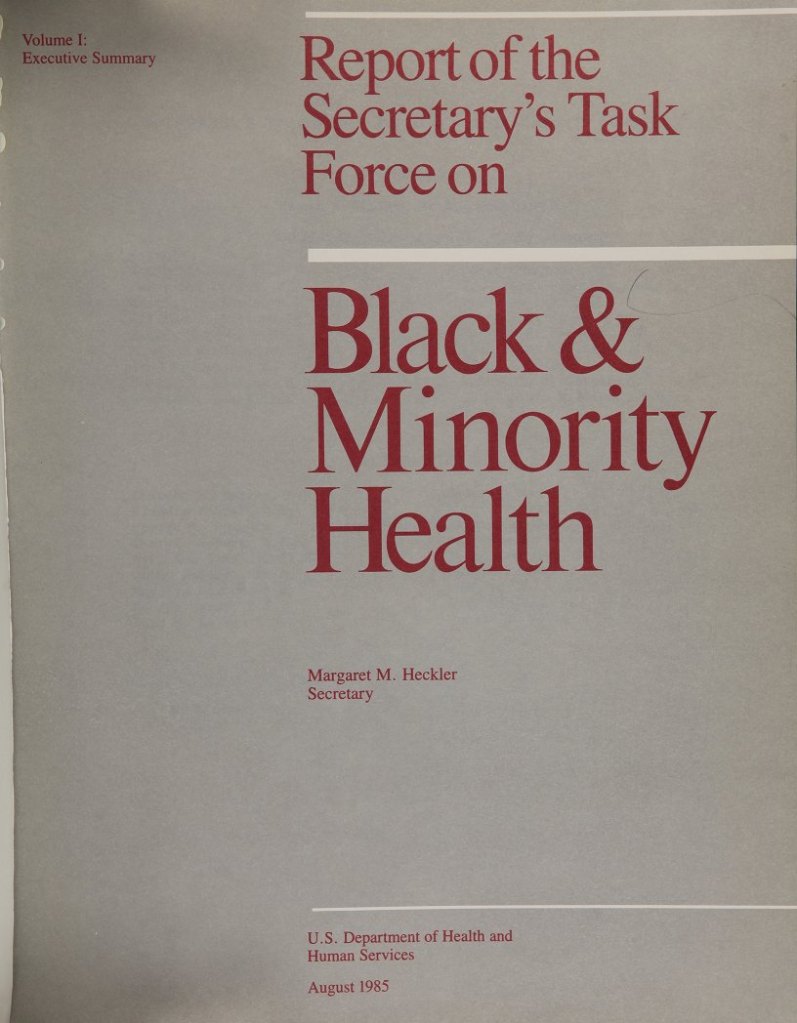
Report of the Secretary’s Task Force on Black and Minority Health and Establishment of the Office of Minority Health
Cover of The Report of the Secretary’s Task Force on Black and Minority Health (Heckler Margaret/ Centers for Disease Control and Prevention)
The Report of the Secretary’s Task Force on Black and Minority Health, also known as the Heckler Report, was the first government-led national comprehensive study on the health status of people of color. The report quantified excess deaths due to health disparities and identified the predominant causes of mortality for people of color. The report also outlined recommendations to reduce health disparities and identified a need to improve national data collection for Hispanic, Asian American, and American Indian and Alaska Native populations. The establishment of the Office of Minority Health within the U.S. Department of Health and Humans Services (HHS) was one of the Heckler Report’s most significant outcomes. It was established to improve health outcomes among communities of color and eliminate health disparities among racial and ethnic groups through the development of government-level health policies and programs. In 2010, the Affordable Care Act established Offices of Minority Health within each of the six agencies within HHS and redesignated the National Center on Minority Health and Health Disparities within the National Institutes of Health as the National Institute on Minority Health and Health Disparities.
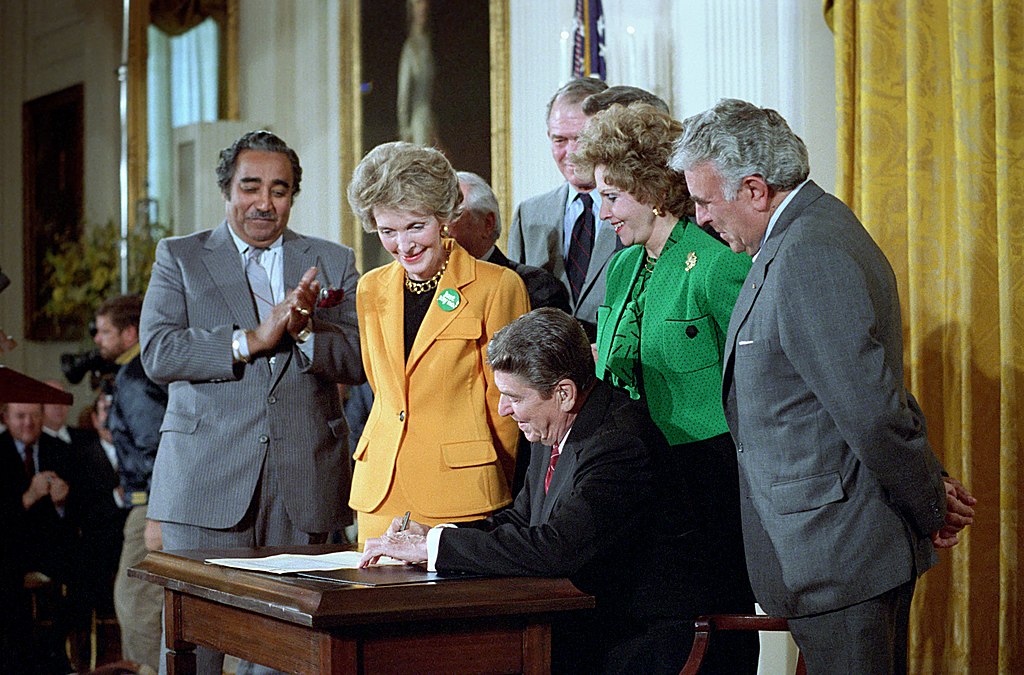
President Ronald Reagan signing H.R. 5484, known as the Anti Drug Abuse Act, White House (National Archives/ Reagan White House Photographs)
The Act introduced mandatory minimum sentencing for trafficking cocaine, with harsher punishments for crack than for powder cocaine. The law resulted in disproportionately longer sentencing for Black people compared to White people. Prior to its enactment, the average federal drug sentence for Black people was 11% higher than for White people. Four years later, the average federal drug sentence for Black people was 49% higher than White people’s sentences. Mandatory minimum sentences for drug offenses continue to be used in federal courts today. Research shows racial and ethnic disparities in incarceration rates and finds that people with a history of incarceration have worse mental and physical health compared to the general population.
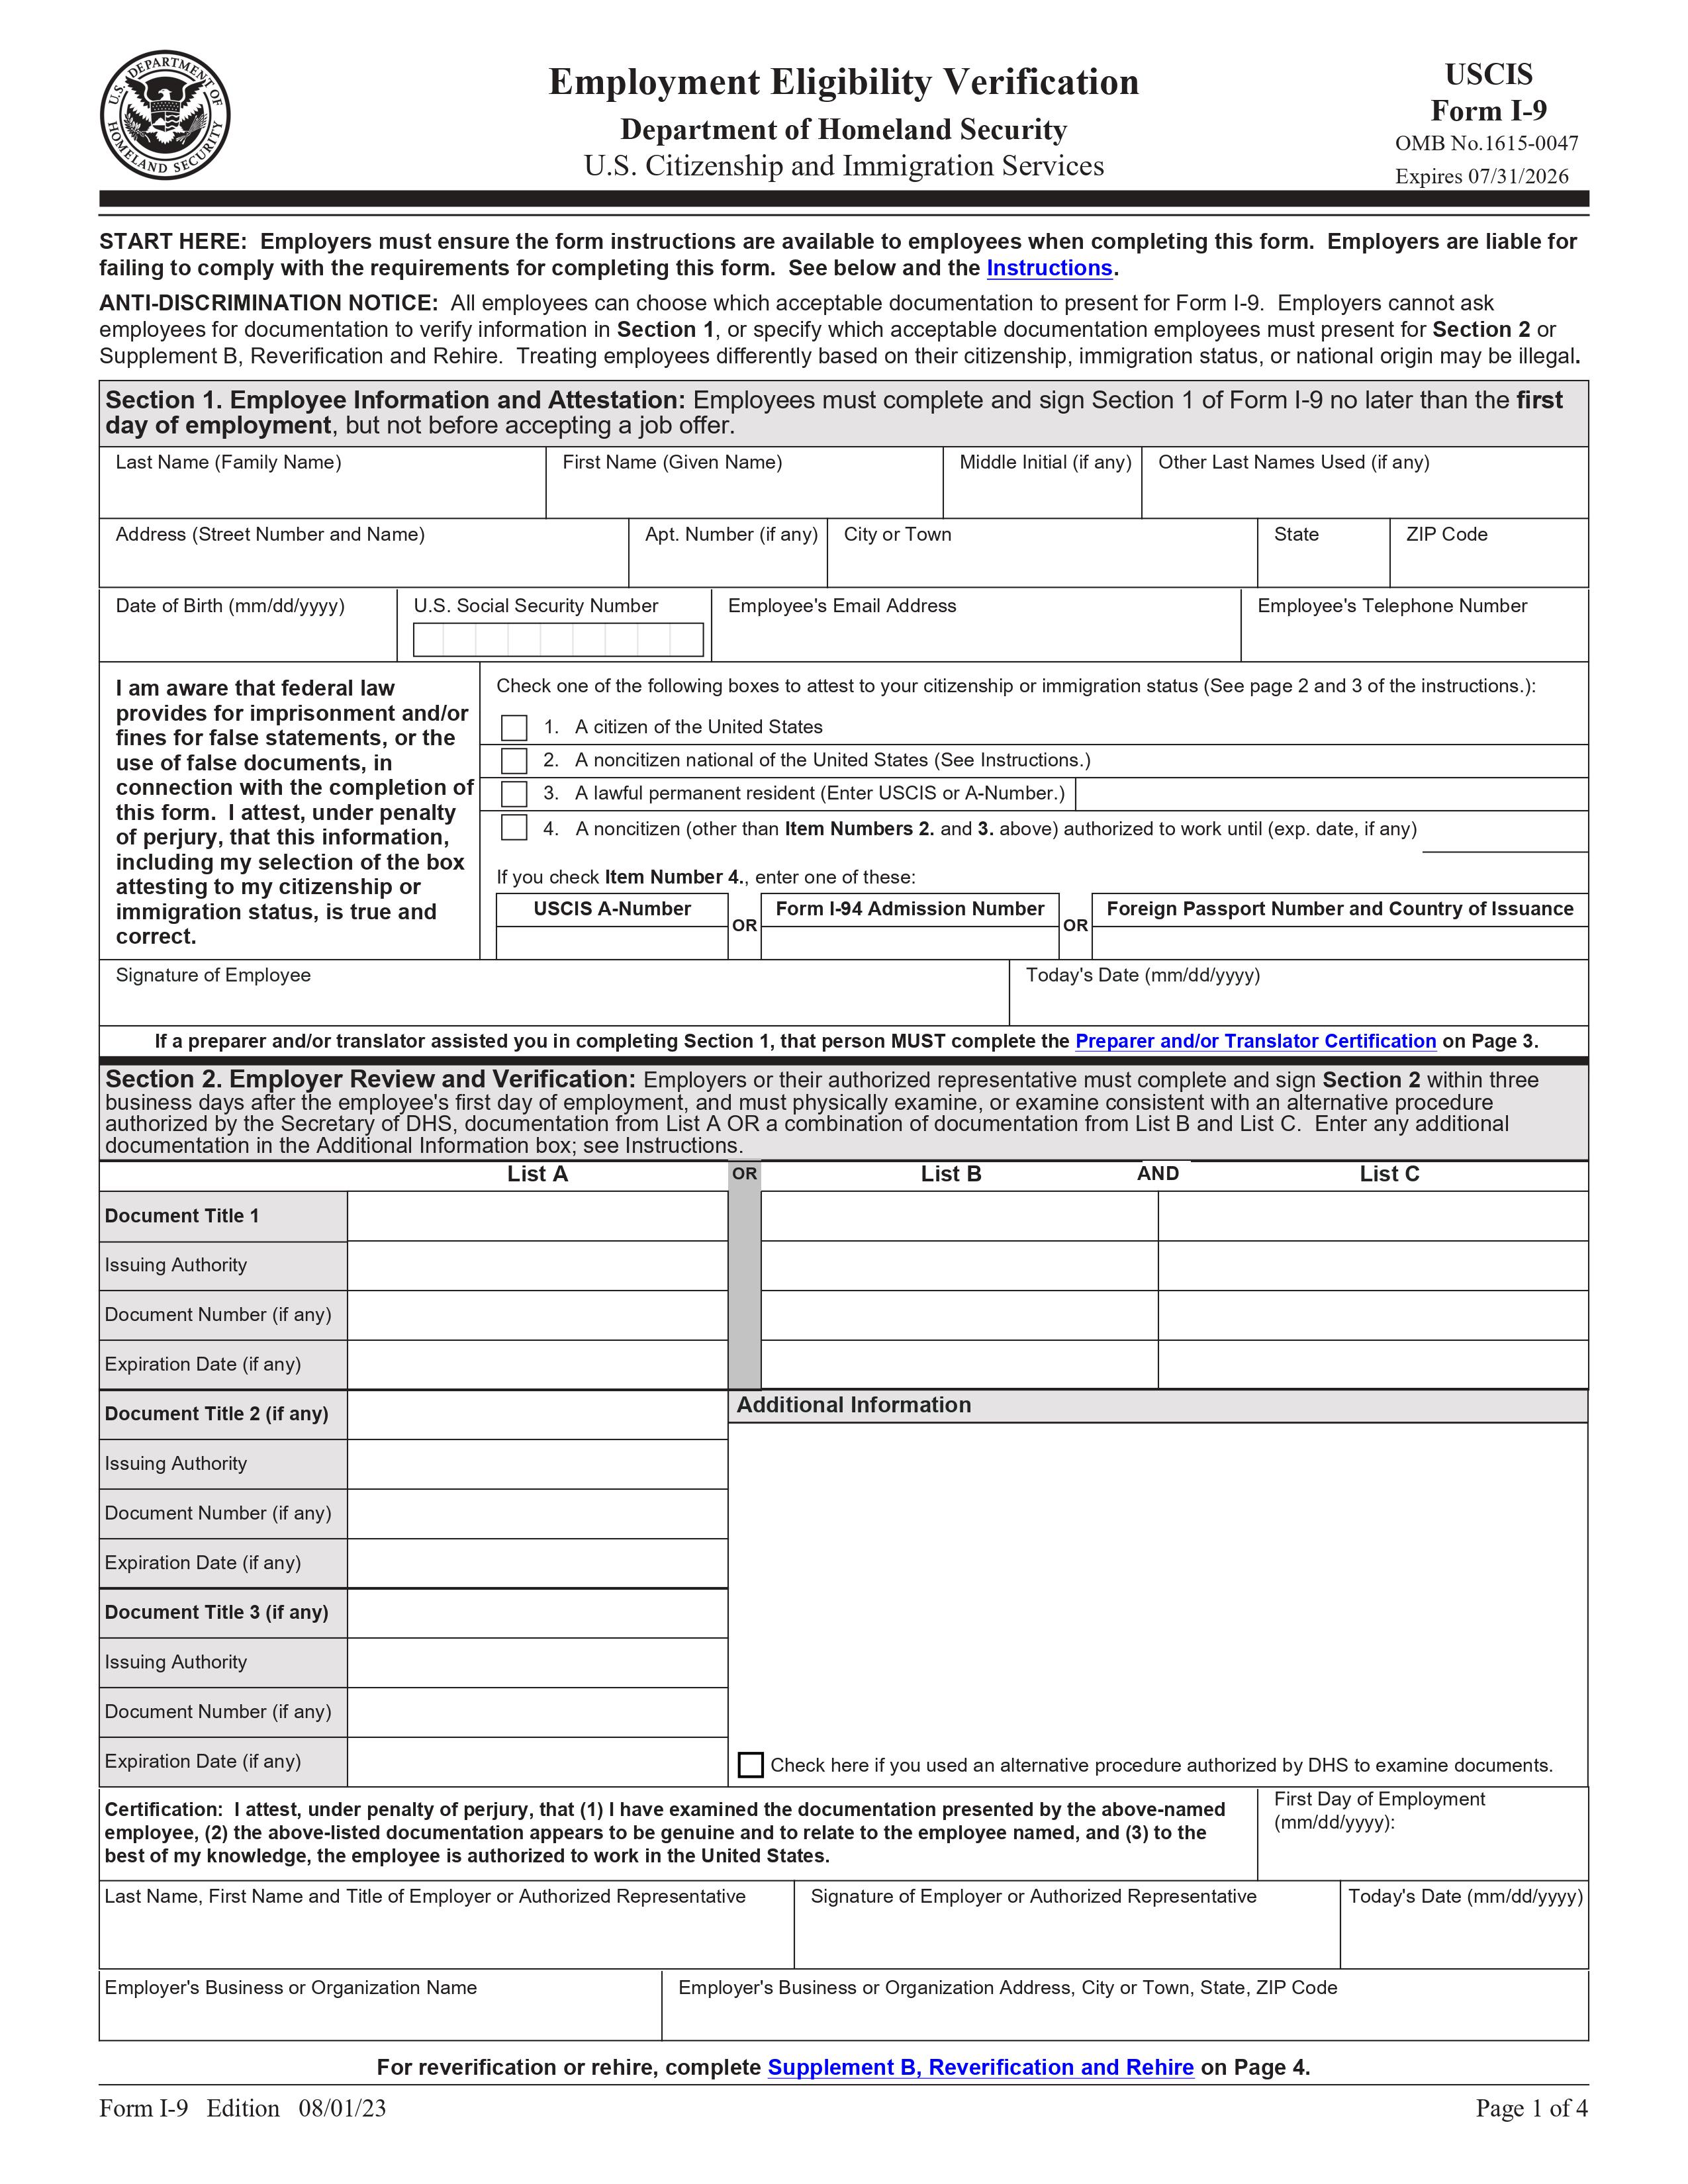
An I-9 Employment Eligibility Verification form, which is used to verify a person’s identity and authorization for employment in the U.S. (Dept. of Homeland Security / U.S Citizenship and Immigration Services)
The Act introduced civil and criminal penalties for the conscious hiring of immigrants or individuals unauthorized to work in the U.S while offering legalization to undocumented immigrants who had immigrated prior to 1982. Building upon IRCA, the Illegal Immigration Reform and Immigration Responsibility Act of 1996 added resources for border policing and verification of employment credentials to enforce immigration restrictions. The legislation had multiple economic and health impacts on undocumented workers, including increased barriers to work, loss of benefits, such as health insurance, and higher likelihood of working in low-wage professions with no rights or protections from discrimination.
Emergency Medical Treatment and Active Labor Act (EMTALA)
Emergency room department entrance, Chicago Illinois (UChicago Medicine)
EMTALA required hospital emergency departments that accept Medicare payments to provide appropriate medical screening examinations and stabilization services to anyone seeking treatment for medical conditions, regardless of citizenship, immigration status, or ability to pay. EMTALA was enacted to mitigate concerns around “patient dumping,” a practice of hospitals transferring patients to another hospital without appropriate medical screening or treatment. However, recent research points to ongoing disparities in access to hospital care, finding that uninsured patients and patients with Medicaid coverage are more likely to be transferred to another hospital compared to patients with private coverage even when accounting for hospital care capabilities and patient characteristics. It also finds that uninsured patients are more likely to be discharged from the emergency department. Given that people of color are more likely to be uninsured and covered by Medicaid, they may be disproportionately affected by these transfer and discharge patterns.
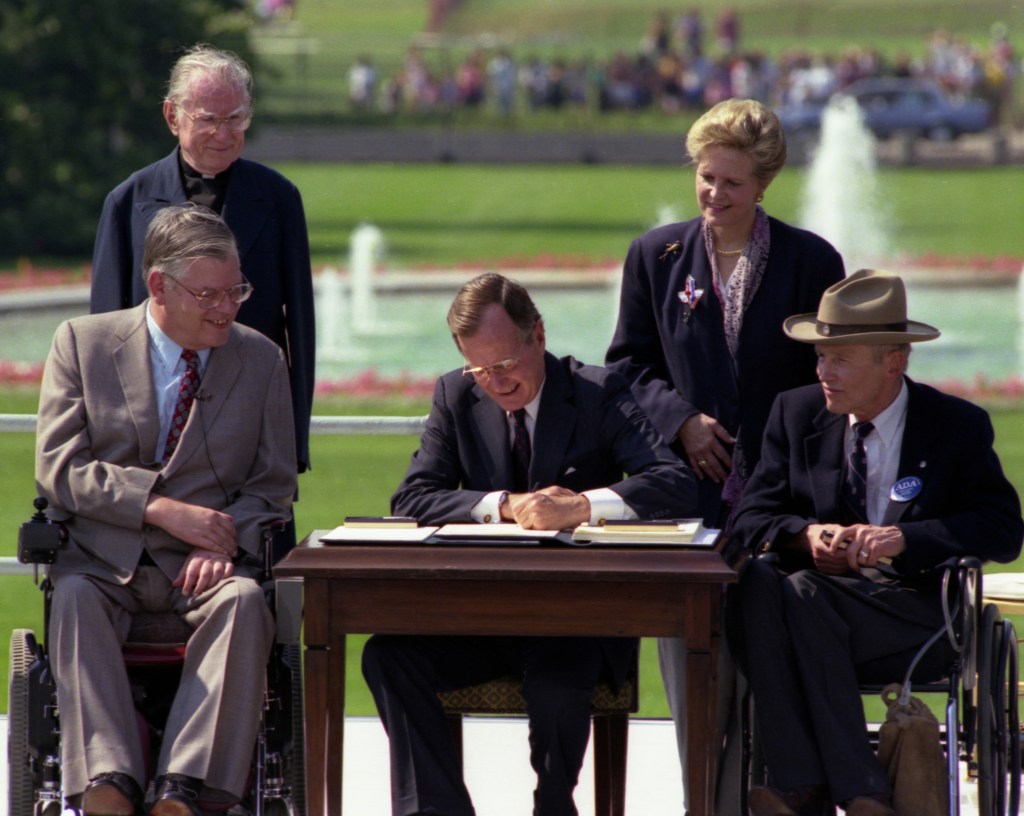
President George H.W. Bush signs the Americans with Disabilities Act, White House (National Archives/ George H.W. Bush Presidential Photographs)
The ADA established civil rights to promote equal opportunity and independent living for all people with disabilities and banned discrimination based on disability in the realms of daily life as well as employment, schooling, and transportation. While this law was passed more than thirty years ago, people with disabilities still face challenges to accessing health care and disparities in health. American Indian and Alaska Native and Black people have a higher prevalence of disability compared to other groups.
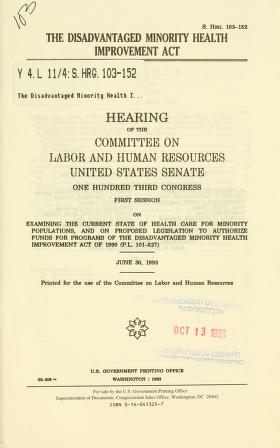
Cover page of the Senate hearing on the Disadvantaged Minority Health Improvement Act (Boston Public Library to Internet Archive)
The Act amended the Public Health Service Act to address health concerns among individuals from disadvantaged communities, including people of color’s access to health care and health professionals. The Act established the provision of grants to provide primary health services to residents of public housing and replaced provisions and added new eligibility requirements related to grants provided to health professions schools for programs of excellence in education for minorities.
The National Institutes of Health (NIH) Revitalization Act
The Act mandates the NIH to ensure the inclusion of women and people of color in NIH-funded clinical research in a manner appropriate to the research question under study to ensure generalizability to the entire population. However, challenges in achieving racial and ethnic diversity in clinical trials persist. Analysis of data from 2000 to 2020 found that trials continued to under-enroll participants from underrepresented racial and ethnic groups. In 2022, the U.S. Food and Drug Administration issued new draft guidance aimed at increasing diversity in clinical trials.
The FMLA requires certain employers to provide covered workers with unpaid, job-protected leave for family and medical reasons, including the birth or adoption of a child or care for serious illness or injury. While FMLA has been associated with positive impacts on parental and infant health outcomes, parental leave inequities persist, particularly in terms of access to paid leave. The FMLA has provided job security to millions of workers who need to take time off work for a qualifying reason; however, many workers remain unprotected by FMLA because small employers are exempt, and, even in covered worksites, not all employees are eligible. Bureau of Labor Statistics analyses have found that Hispanic and Black workers are less likely than their White counterparts to have access to paid family leave, and Black women are more likely than White women to report losing pay for missing work to care for kids who are sick and cannot attend school.
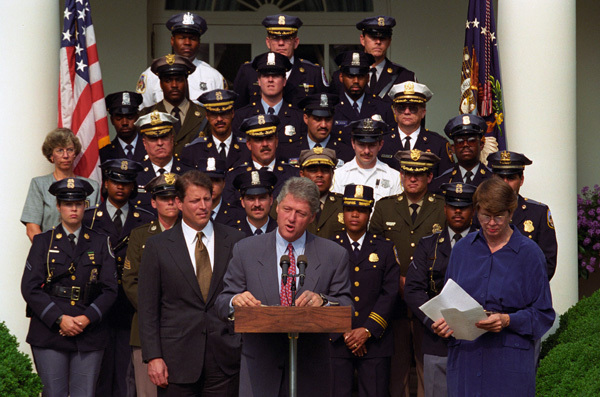
President Bill Clinton gives his Anti-Crime Initiative announcement at the White House (Ralph Alswag/ National Archives)
The Violent Crime Control and Law Enforcement Act of 1994, commonly referred to as the Clinton Crime Bill, was the largest federal crime bill, providing extensive federal funding for prisons, criminal prevention programs, police expansion, and the Justice Department. The bill contained provisions increasing law enforcement accountability and protections for survivors of sexual assault but increased the presence of police enforcement in neighborhoods of color, exacerbating racial disparities in criminal justice involvement. Black people are more likely to be killed by police than White people, and over the course of a lifetime 1 in every 1,000 Black men can expect to be killed by the police. Further, larger shares of Hispanic, Black, and American Indian and Alaska Native adults report recent experiences with police mistreatment compared with White adults. This disproportionate exposure to police violence has been found to have negative mental health outcomes for Black people. Research has found that people who live in neighborhoods with more stop-and-frisk encounters are more likely to have poor health outcomes.
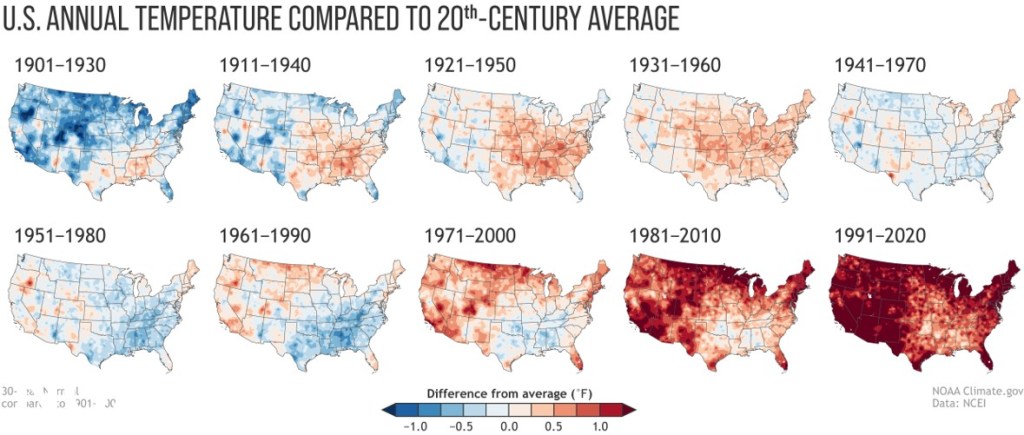
Executive Orders that Address Climate Change and Environmental Justice
Maps illustrating temprerature increases in the U.S. over time (National Oceanic and Atmospheric Administration (NOAA) National Centers for Environmental Information (NCEI))
Personal Responsibility and Work Opportunity Reconciliation Act (PRWORA)
The PRWORA, also known as the Welfare Reform Act, changed the federal financing structure for cash assistance for low-income families, established new eligibility criteria for accessing cash benefits, including mandatory work requirements, and imposed time limits on the receipt of cash benefits. The Act also established a new restriction that prevented many lawfully present immigrants from receiving federal non-cash public assistance benefits, including Medicaid, until five years after receiving “qualified” immigration status. Following the law, there were substantial declines in lawfully present immigrants’ use of all major benefit programs, including Medicaid, leading to increases in uninsured rates among immigrants. There were also declines in program participation among citizen children in low-income immigrant families. Disparities in coverage among lawfully present immigrants and children in mixed immigration status families persist today.
CHIP is a joint federal-state program that provides health insurance coverage to uninsured children in families whose incomes are too high to qualify for Medicaid but who can’t afford private coverage that was created (originally as the State Children’s Health Insurance Program) as part of the Balanced Budget Act of 1997. Since its enactment, CHIP has played a pivotal role in reducing the uninsured rate for children, providing health insurance for many children of color and reducing racial disparities in children’s coverage, particularly for Black and Hispanic children. The program also has been found to have positive implications for school performance and long-term educational attainment.
2000 to 2019
Minority Health and Health Disparities Research and Education Act
Congress passed this Act to support research on minority health and health disparities in addition to medical training for students from underrepresented backgrounds in 2000. The Act created the National Center on Minority Health and Health Disparities within the National Institutes of Health (NIH), which was redesignated as the National Institute on Minority Health and Health Disparities in 2010. The Center developed the first NIH Health Disparities Strategic Plan and Budget aimed at reducing and eliminating health disparities.
Aerial view shows flooding in New Orleans, Louisiana four days after Hurricane Katrina (National Archives/ Combined Military Service Digital Photographic Files)
Hurricane Katrina ravaged the Gulf Coast region in August 2005, with Louisiana, Mississippi, and Alabama bearing the brunt of the damage. The storm led to substantial loss of life and property damage and had significant health impacts, including negative impacts on people’s quality of life, worsening their financial situations, housing, health outcomes and health care access. Many of the storm’s adverse impacts were disproportionately distributed across racial and ethnic groups, with African American people being more likely to report financial troubles and issues with health coverage and housing compared to White people. Ten years after the storm, fewer African American residents reported that they felt helped by recovery efforts compared to White people.
The Immigrant Children’s Health Improvement Act (ICHIA)
The ICHIA option was adopted as a part of the broader Children’s Health Insurance Program reauthorization law (CHIPRA). It allows states to receive federal funds for providing Medicaid and CHIP coverage to lawfully residing immigrant children and pregnant people without the five-year waiting period established by the Personal Responsibility and Work Opportunity and Reconciliation Act. Over time, a growing number of states have adopted the ICHIA option for children and pregnant individuals. While ICHIA has increased public insurance coverage for lawfully present children and pregnant people, there is no option to eliminate the five-year wait for lawfully present immigrant adults.
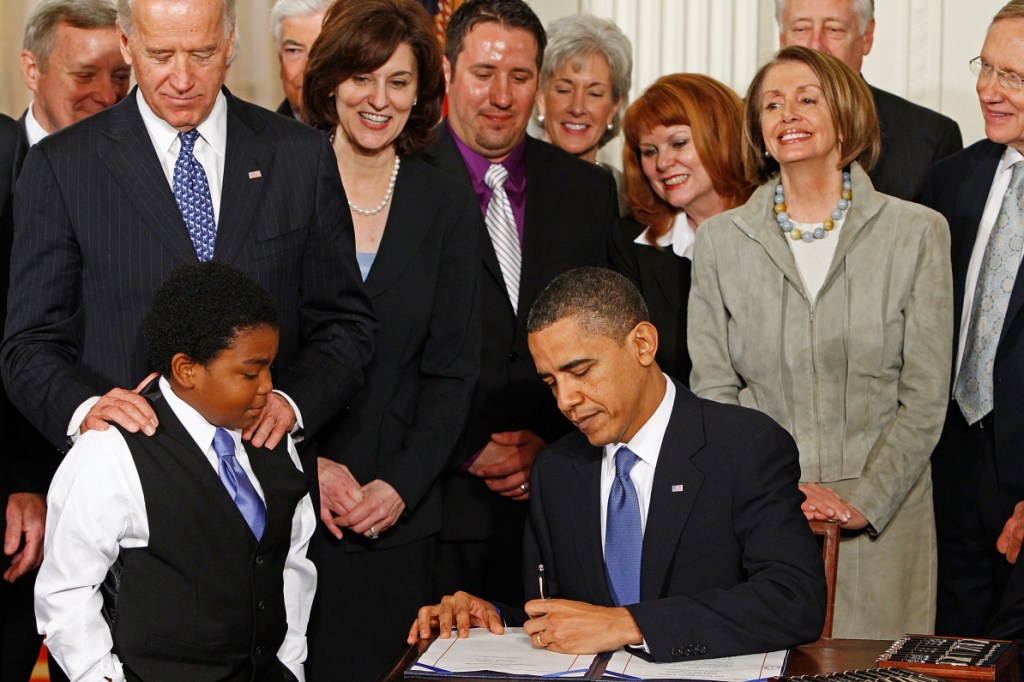
President Obama signs the Health Care and Education Reconciliation Act, White House (Chip Somodevilla/Getty Images)
The ACA implemented a comprehensive set of health reforms, including large expansions in health insurance coverage through both the creation of health insurance Marketplaces with tax subsidies and an expansion of Medicaid to low-income adults. Data show that following implementation of the ACA coverage expansions in 2014, there were large gains in health coverage across racial and ethnic groups, with larger increases for people of color compared to White people that narrowed disparities in coverage. Despite these gains, racial and ethnic disparities in coverage remain. Adoption of the Medicaid expansion in the remaining non-expansion states could help further close coverage disparities. Research suggests that Medicaid expansion is linked to increased access to care and improvements in some health outcomes and has contributed to reductions in racial disparities in health coverage.
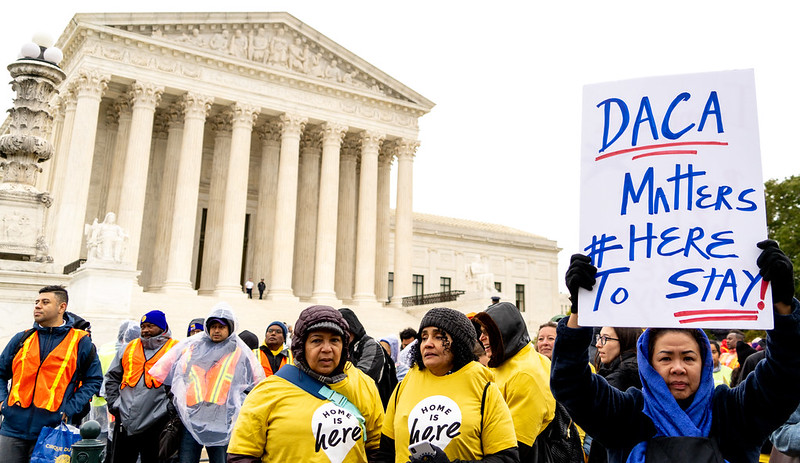
Rally by the Supreme Court as the DACA cases are heard inside (Victoria Pickerin/ Flickr Images Creative Commons)
The DACA policy was created through executive action by President Obama in 2012. DACA protects eligible young adults who were brought to the U.S. as children from deportation and provides them with work authorization for temporary, renewable periods. While DACA protects an individual from removal action for a certain time, it does not provide a pathway to U.S. citizenship. DACA has enabled over 900,000 immigrants to stay in the U.S., go to school, and contribute to the economy through gainful employment. Studies have found that DACA eligibility helps improve physical and mental health, and can improve the well-being of children of DACA recipients. However, people who are likely eligible for DACA are much more likely than U.S.-born individuals in their age group to be uninsured. When implemented, DACA recipients remained ineligible for federally funded health coverage. In April 2023, the Biden Administration began pursuing administrative action to expand eligibility for health coverage to DACA recipients.
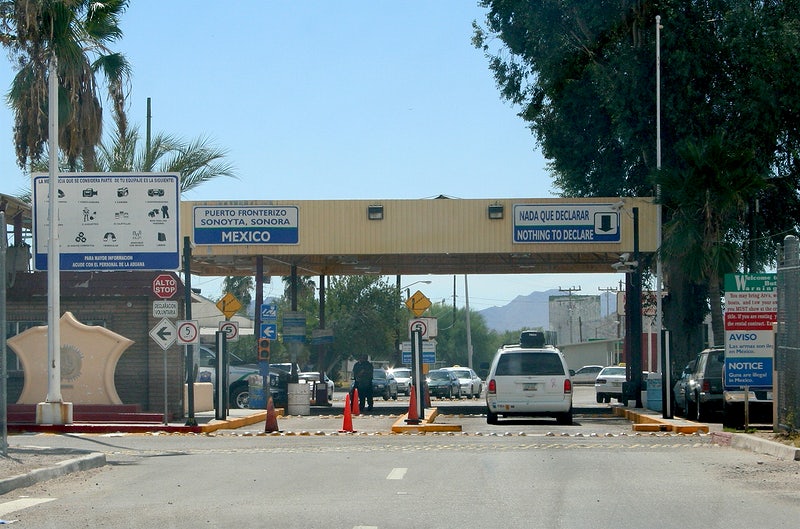
Border entry point between Lukeville, Arizona and Sonoyta, Mexico (Alan Levine/ Flickr Images Creative Commons)
Increases in migration into the U.S. from El Salvador, Guatemala, and Honduras in recent years have been fueled by political unrest, unprecedented levels of violence related to drug cartels, and gang activity in the Central American region. Changes in immigration and border policies have impacts on the health outcomes and experiences of immigrants, particularly at the U.S. border. Temporary Protected Status (TPS) for immigrants from El Salvador and Honduras was terminated in 2017 and 2018; however, effective June 9, 2023, people from these countries will be able to temporarily extend their TPS status. In 2023, the Biden Administration announced actions focused on increasing enforcement at the Southwest Border and extending TPS status for individuals from Venezuela.
The BLM movement was sparked by the murders of 17-year-old Trayvon Martin in 2012 and Michael Brown and Eric Garner in 2014. It has since become a clarion call to protest injustice against Black people internationally. In 2020, amplified by the police killing of George Floyd, the BLM movement inspired international protests against police brutality and brought attention to the systemic racism faced by the Black community. The combination of the COVID-19 pandemic, which disproportionately impacted communities of color, and the BLM protests shed light on the impact of racism and systemic discrimination on the health of people of color. Research also shows that Black people’s repeated and chronic exposure to stressors associated with racism and discrimination drive rapid biological aging and poorer health outcomes. Other recent research highlights the link between experiences with racism and discrimination and poorer health and well-being.
Travel Ban Executive Orders and Presidential Proclamations also Known as the “Muslim Travel Bans or Trump Travel Bans”
Between 2017 and 2020, the Trump Administration issued Executive Orders 13769 and 13780 and Presidential Proclamations 9645, 9723, and 9983 that limited the number of refugees admitted to the country, suspended the U.S. Refugee Admissions Program, and restricted travel into the United States from several countries, many of which are Muslim majority countries. In 2021, the Biden Administration issued the Proclamation on Ending Discriminatory Bans on Entry to the United States that revoked the Executive Orders and Presidential Proclamations. The series of Muslim Travel Bans was a continuation of racial profiling and Islamophobia directed toward Muslim people, Middle Eastern and North African people, and South Asian people, that had escalated following the September 11, 2001 attacks.
The COVID-19 pandemic negatively impacted the overall U.S. population, contributing to the most significant two-year decline in life expectancy experienced in the U.S. in roughly a century. However, the pandemic disproportionately affected some groups, including people of color, which may have long-term impacts on health and well-being and widen racial and ethnic disparities in health and health care. Following the onset of the pandemic, the federal government declared a public health emergency and enacted legislation to respond to COVID-19 and support people during the pandemic, including legislation that helped stabilize and expand health coverage. These changes included a temporary requirement that Medicaid programs keep people continuously enrolled during the pandemic in exchange for enhanced federal funds. However, the continuous enrollment provision in Medicaid ended in March 2023, and millions of people have been disenrolled since states began processing renewals.
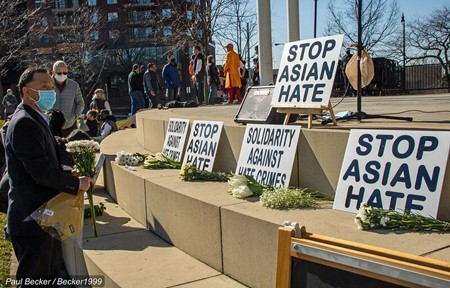
Increases in Anti-Asian Violence and Stop Asian Hate Movement
Amid the COVID-19 pandemic, awareness of disparities stemming from clinical tools, algorithms, and guidelines increased. For example, low accuracy of pulse oximeters in measuring oxygen saturation in darker skin was found to potentially contribute to worse outcomes for Black and Hispanic patients with COVID-19. In addition, clinical calculators across multiple specialties assign differential risk for certain diseases or conditions based on race, which may contribute to undertreatment and overtreatment of some groups and lead to delays in diagnosis and clinical care. Race also plays a factor in some medication prescribing decisions. For example, the U.S. Food and Drug Administration approved BiDil as a race-specific drug to treat heart failure among Black people in 2005. While the drug is still approved as a race-based drug, there has been critique for misguided marketing due to inaccurately using race as a proxy for genotype. The health care system is increasingly using artificial intelligence and algorithms to guide health decisions. Research has shown that these algorithms may have racial bias because the underlying data on which they are trained may be biased and/or may not reflect a diverse population. There have been growing efforts within the medical community to re-evaluate and revise practices around the use of race within clinical care, including the American Medical Association’s adoption of new policies recognizing race as a social construct and the removal of race from clinical calculators in some institutions.
Asylum seekers to the U.S. wait at the U.S. and Mexico border (Sandor Csudai/ KNUM.org. Creative Commons)
Title 42 is a public health authority that authorizes the Director of the Centers for Disease Control and Prevention to suspend entry of individuals into the U.S. to protect public health. This authority was implemented in response to the COVID-19 pandemic to allow for quick expulsion of migrants, including asylum seekers, seeking entry into the U.S. at the land borders. Research suggests that Title 42 expulsions negatively impacted the health and well-being of migrant families. Title 42 border restrictions were lifted on May 11, 2023, contributing to concerns about the potential impacts of rising immigration activity at the border.
Declaration of Racism as a Serious Public Health Threat
The Unequal Treatment: Confronting Racial and Ethnic Disparities in Health Care report documented systemic racism as a major cause of racial health disparities in the United States in 2003. However, it was not until nearly twenty years later that the federal government declared racism a public health threat and identified addressing disparities and advancing racial health equity as key federal priorities. The stark impact of the initial COVID-19 pandemic on communities of color and growth in recognition of the harms caused by systemic racism following the police killings of George Floyd and Breonna Taylor highlighted the underlying impact of racism on health and well-being. Amid this growing recognition, the Centers for Disease Control and Prevention declared racism to be a serious public health threat and highlighted new efforts to address racism as a driver of racial and ethnic health inequities. Other medical societies and organizations, such as the American Medical Association, American Psychological Association, and states and localities also formally acknowledged the role of racism as a public health issue and outlined planned actions to address systemic racism and advance health equity.
Protestors outside the Supreme Court while the Dobbs v. Jackson case is argued inside the court (Victoria Pickerin/ Flickr Images Creative Commons)
The June 2022 Supreme Court ruling in Dobbs v. Jackson overturned the longstanding Constitutional right to abortion and eliminated federal standards on abortion access that had been established by earlier decisions, allowing states to establish laws protecting or restricting abortion. People of color are likely to be disproportionately affected by state actions to prohibit or implement extensive restrictions on abortion, as they are more likely to seek abortions and more likely to face structural barriers that will make it more difficult to travel out of state for an abortion, including more limited access to health care and fewer financial and transportation resources. Increased barriers to abortion for people of color may widen the already existing large disparities in maternal and infant health, have negative economic consequences for families, and increase risk of criminalization for people of color.
Students for Fair Admissions Inc v. President and Fellows of Harvard College
In June 2023, the Supreme Court ruled that institutions of higher education could no longer explicitly consider race as a factor in admissions decision-making processes. This decision is expected to decrease diversity in higher education, a trend that has been observed in states that eliminated affirmative action and experienced declines in enrollment for Black, Hispanic and Indigenous people. Leaders in the fields of medicine and public health have decried the decision stating that it could harm efforts to diversify the physician workforce, which could widen health disparities. Black and Hispanic people remain underrepresented in the U.S. physician workforce. Research shows that a racially and ethnically diverse health care workforce positively impacts health and health care access among underserved groups. Research also shows that Hispanic, Black, and Asian adults who have more visits with health care providers who share their racial or ethnic background report more frequent positive and respectful interactions with health care providers.
KFF would like to thank Dean Daniel Dawes, School of Global Health, Meharry Medical College; Dr. Gilbert Gee, Fielding School of Public Health, University of California, Los Angeles; and Dr. Michelle Tong, University of California, San Francisco School of Medicine for their invaluable inputs, insights, suggestions, and support throughout the planning and development of this project.
News Release
Record ACA Marketplace Signups for 2024 Are Driven in Part by Medicaid Unwinding and More Affordable Coverage
From early April to the end of September 2023, enrollment in the individual market grew by 5.7%.
Enrollment in the Affordable Care Act (ACA) Marketplaces will hit another record high in 2024, with sign-ups to date topping 20 million—already 4 million above last year’s record high.
The Medicaid unwinding, enhanced Marketplace subsidies that make coverage more affordable, as well as increased marketing, outreach, and enrollment assistance have all played a role in this growth, according to a new analysis from KFF.
Marketplace sign-ups have nearly doubled since 2020. The Medicaid unwinding is likely contributing to 2024’s record-high enrollment. States provided continuous enrollment in Medicaid during most of the pandemic, but disenrollments resumed in April.
Unlike most previous years, the individual market grew mid-year in 2023, outside the open enrollment window and at a time when attrition normally occurs. From early April to the end of September 2023, enrollment in the individual market grew by 5.7%, or just over 1 million enrollees. The only other time the ACA individual market recently saw mid-year growth was in 2021, when the American Rescue Plan’s enhanced subsidies were first rolled out.
Enhanced subsidies make coverage more affordable generally and ease the transition from Medicaid to private coverage, with zero-premium plans available to more people with low incomes. In addition to these new enrollees, enhanced subsidies may also be helping current enrollees maintain their coverage. The enhanced subsidies will expire at the end of 2025, requiring Congress to decide whether to extend them using additional federal funding.
KFF’s new interactive timeline explores how history has shaped racial and ethnic health disparities and the lasting effects that persist to this day. The timeline describes major U.S. federal policies and events since the early 1800s that are linked to present-day health disparities. It also covers policies that impact health coverage and access to care, medicine, and social and economic policies that influence health as well as efforts to tackle inequalities.
The timeline includes 80 entries categorized as “Health & Medicine” or “Broader Policies.” Users can navigate through historical periods to see the expansive selections of historical events. Clicking on an entry reveals a description of the relevant event, an archival image referencing the event, and the ability to explore the entries in more detail via original source material.
While not exhaustive, the timeline provides context for the challenge of addressing current health and healthcare disparities, acknowledging the complex history that shapes them.
With More than Half of Medicaid Enrollees Awaiting their Renewal Process, New Report Highlights Lessons Learned that Can Inform State Efforts and Reduce Disenrollments for “Procedural” Reasons
Interviews in Four States Suggest Strategies to Improve Enrollee Communication and Boost Number of Medicaid Enrollees Moving to Marketplace Coverage
At the beginning of 2024, nine months into states’ efforts to unwind the Medicaid continuous enrollment provision and reverify enrollees’ eligibility, states have completed renewals for less than half of all enrollees.
To gain a better understanding of what challenges states are facing and the effects of different unwinding strategies, KFF interviewed state Medicaid officials in Arizona, Indiana, and Pennsylvania, as well as others involved, including representatives from Medicaid, managed care plans, legal aid organizations, and Marketplace navigators in Arizona, Florida, Indiana, and Pennsylvania. A new report highlights some key insights stemming from those interviews. For example:
The volume of renewals, systems issues, and staffing shortages have posed significant challenges to states and, in turn, enrollees. In response, states have taken steps to streamline renewal processes and increase automated renewals. As of December, all study states except Florida had adopted waivers to increase automated renewal rates, and state officials noted that flexibilities related to verifying income and assets were most helpful at increasing those rates.
States have also used an array of outreach strategies and partnered with multiple entities involved in the unwinding to reach Medicaid enrollees. All four states have increased communications with enrollees using emails, texts, and phone calls in addition to mailed notices. However, participants in the states said Medicaid renewal and termination notices can be difficult to understand, and long call center wait times hinder the ability of enrollees to get needed help.
Some individuals who are disenrolled from Medicaid for procedural reasons are re-enrolling after a gap in coverage. While data on the share of people reenrolling are limited, study states are conducting additional outreach to enrollees who have been procedurally disenrolled to encourage them to complete the renewal process so they can reenroll if still eligible. Interview participants reported that, even with enhanced Affordable Care Act Marketplace premium subsidies, affordability remains a barrier to enrollment for people trying to transition from Medicaid to Marketplace coverage. The number of people disenrolled from Medicaid who enroll in Marketplace coverage remains modest in all four states, according to the people interviewed.
Nationally, the latest KFF tracking shows nearly 14.4 million people have been disenrolled and nearly 27 million reenrolled in Medicaid coverage. While many who are disenrolled may churn back onto Medicaid or transition to other coverage, many will likely become uninsured.
The report, Unwinding of Medicaid Continuous Enrollment: Key Themes from the Field, is available here.
During the COVID-19 pandemic, states kept people continuously enrolled in Medicaid in exchange for enhanced federal funding. With the end of continuous enrollment on March 31, 2023, states are required to complete an eligibility renewal for all Medicaid and CHIP enrollees by May 2024 – a process commonly referred to as “unwinding.” KFF survey data show that despite outreach, as of early November more than one-third (36%) of Medicaid enrollees had heard nothing at all about unwinding. As of January 2024, states had renewal outcomes for more than four in ten enrollees with over 14 million people disenrolled and more than 27 million reenrolled in Medicaid coverage. In December 2023, growing concern over loss of Medicaid coverage for children prompted federal officials to issue additional guidance with strategies to protect coverage and to write letters to nine states with large declines in Medicaid child enrollment, urging them to take up additional policy options to prevent disenrollments due to paperwork, or procedural, issues.
Data are important to help monitor how unwinding is going across states, but trackers and dashboards only tell part of the unwinding story. Medicaid eligibility is complex, and outcomes are the result of federal and state policy decisions but also the result of how those policies are implemented and how well eligibility and other systems work. This brief examines the perspectives of state officials and others involved in the unwinding process. KFF worked with PerryUndem to conduct interviews with representatives from Medicaid managed care plans, primary care associations, legal aid and other advocacy organizations, and navigator organizations in four states: Arizona, Florida, Indiana and Pennsylvania. In addition, the report draws on broader state input from interviews with Medicaid officials as part of the 23rd annual budget survey of Medicaid officials conducted by KFF and Health Management Associates (HMA) from June to September 2023 (early in the unwinding process). The brief provides information on outreach and engagement, renewal processes and coverage transitions, providing lessons for the ongoing unwinding process, as well as for how to conduct more effective Medicaid renewals generally in the future. Key takeaways include the following:
Communication and Engagement
States have used an array of outreach strategies and partnered with multiple entities involved in unwinding to reach Medicaid enrollees. All states reported using traditional communication campaigns with mailers and paid advertising, and some states have added text messaging and targeted outreach to certain populations, including users of long-term services and supports and people with limited English proficiency. To encourage consistent messaging and information, all four study states have developed toolkits for partner organizations that included printable and digital materials. Study states credited new strategies to update contact information, such as using the National Change of Address database and accepting updated contact information from managed care organizations (MCOs), with reductions in returned mail. While enhanced outreach efforts were generally viewed as positive, some participants said enrollees have been overwhelmed by the volume of contact they have received and, in some cases, unclear messages have led to confusion.
State engagement with those involved with unwinding was described as a positive aspect of unwinding, and feedback loops have helped identify early problems. Many states, including three of the study states, increased engagement and coordination with others involved in unwinding, holding regular meetings to provide updates and review data. In the study states, participants noted these meetings have provided an opportunity to create feedback loops to alert states to potential problems and build relationships in the process. In contrast, limited state engagement and communication contributed to more reports of problems with the unwinding process and frustration among groups involved with the unwinding.
Renewal Processes
The volume of renewals, systems issues, and staffing shortages have posed significant challenges to states. Across many states, older systems that require manual workarounds to meet federal requirements have exacerbated staffing shortages and negatively impact the processing of renewals. While systems are generally working well in Arizona and Indiana, Pennsylvania’s system was not designed to conduct ex parte renewals for a large number of Medicaid enrollees, increasing the burden on eligibility staff to manually process most renewals. Study state officials noted that staffing shortages and inexperienced staff have contributed to backlogs and disenrollments of people who are likely still eligible early in the process; these states responded with additional training and other efforts to increase staff.
States have taken steps to streamline renewal processes and increase ex parte, or automated, renewals. As of January 2024, all study states except Florida had adopted a range of 1902(e)(14) waivers and other flexibilities to increase ex parte rates and streamline renewals. Guidance from CMS in December 2023 announced these waivers will be available through the end of 2024 unless approved for a longer duration. A number of states, including Indiana, have also taken steps to increase ex parte renewals for people who qualify on the basis of disability or over age 65, referred to as non-MAGI populations. When asked about the most helpful flexibilities, states most often pointed to those allowing use of Supplemental Nutrition Access Program (SNAP) data to renew Medicaid, streamlining renewals for those with no and low income, and waiving the asset limit test. Officials in the study states have prioritized ex parte renewals, both automated and manual, as a strategy for reducing procedural disenrollments.
All four study states have increased the number of communication touch points with enrollees. In an effort to improve response rates, study states increased the number of enrollee contacts during the renewal process. For example, Pennsylvania went from sending one mailer ahead of the renewal notice to adding 11 enrollee contacts. States have also expanded communication modes to include emails, texts, and phone calls in addition to mailed notices.
Participants in all four study states reported that Medicaid renewal and termination notices can be difficult to understand. Participants described a variety of problems with notices, from lack of clarity on what actions or documentation are needed for renewal to misleading or incorrect information. Issues with notices were most acute in Florida where advocates have filed a lawsuit, contending notices are confusing, fail to explain why individuals lost Medicaid coverage, and sometimes include incorrect information.
Participants reported challenges getting through to call centers when enrollees needed assistance with their renewals, particularly for people with limited English proficiency. According to study participants, call center wait times are often long and it can be difficult to connect with someone able to assist with complicated cases. Advocates noted wait times were longer for those requesting a language other than English. These problems were echoed by state officials in a number of states.
Coverage Transitions
Some individuals who are disenrolled from Medicaid for procedural reasons are reenrolling after a gap in coverage. While most states are not reporting data on the number of people reenrolling in Medicaid, two study states (Arizona and Pennsylvania) are reporting these data. In Arizona, about half of people who complete their renewal during the 90-day reconsideration period have their coverage reinstated. States have increased communication with people procedurally disenrolled who may be eligible – Arizona and Pennsylvania send letters following disenrollment to let people know they still have time to regain their coverage without completing a new application. Participants noted that when process and systems issues result in disenrollment, it can undermine peoples’ trust in the system and can discourage them from completing their renewal or reapplying.
While children in some states are seamlessly transitioning to CHIP, in other states children are experiencing gaps in coverage. When children in Arizona and Indiana are found to be ineligible for Medicaid, the states automatically enroll them in CHIP, if eligible, without any action required from the family. Participants reported that challenges and glitches with a recent change in Pennsylvania to integrate the CHIP eligibility system with Medicaid have led to some children losing coverage. While information for children determined ineligible for Medicaid is automatically transferred to CHIP, slow processing times may lead to gaps in coverage for some children.
Participants reported that even with enhanced Marketplace premiums, affordability remains a barrier to enrollment. Respondents generally said that account transfers to the Marketplace were happening as expected; however, the number of people disenrolled from Medicaid who enroll in Marketplace coverage remains low in all study states. Participants said that for some people, the deductibles and cost sharing are too high. They also noted that not everyone is aware that Marketplace coverage is an option.
As states continue processing renewals for the more than half of enrollees whose eligibility must be still redetermined, the perspectives of state officials and others involved in unwinding provide valuable insights into what is working well and where there are challenges and room for improvement. States can make changes in the near term to help enrollees maintain Medicaid or transition to other coverage during the unwinding period, but they can also apply the lessons learned to make longer-term improvements to Medicaid renewal processes.
Issue Brief
Introduction
During the COVID-19 pandemic, states kept people continuously enrolled in Medicaid in exchange for enhanced federal funding. With the end of continuous enrollment on March 31, 2023, states began the process of redetermining eligibility for all Medicaid enrollees and disenrolling those who are no longer eligible or whose eligibility could not be determined – a process commonly referred to as “unwinding.” KFF survey data show that despite outreach, as of early November more than one-third (36%) of Medicaid enrollees had heard nothing at all about unwinding. As of January 2024, states had renewal outcomes for more than four in ten enrollees with over 14 million people disenrolled and more than 27 million reenrolled in Medicaid coverage. Data are important to help monitor how unwinding is going across states, but trackers and dashboards only tell part of the unwinding story. Medicaid eligibility is complex, and outcomes are the result of federal and state policy decisions but also the result of how those policies are implemented and how well eligibility and other systems work.
Leading up to unwinding, the federal government issued guidance and provided states with the option to adopt a range of new policies to help promote continuity of coverage (in Medicaid for those who remain eligible or though other coverage for those who are no longer eligible). States have been engaged in unprecedented levels of new outreach, but the volume of redeterminations coupled with workforce shortages and systems issues present challenges. Focus groups with enrollees revealed that while many have been able to successfully renew Medicaid coverage, many were disenrolled due to confusion and barriers to completing the renewal process. While some who were disenrolled transitioned to other coverage, many who were disenrolled faced challenges navigating appeals and also experienced out of pocket costs or gaps in access to needed care. By December 2023, the federal government had issued additional guidance and sent letters to nine states with the largest amounts of children losing Medicaid urging them to do adopt additional federal strategies to prevent families from losing coverage due to paperwork, or procedural, issues. CMS identified the top five actions states could take to reduce procedural disenrollments: improve auto-renewal (or ex parte) rates, adopt additional unwinding waivers, partner with managed care plans, support coverage transitions, and reduce call center wait times.
To gain a better understanding of what is working well during the unwinding and where there may be opportunities to improve processes, KFF worked with PerryUndem to conduct detailed interviews with state officials in Arizona, Indiana, and Pennsylvania, as well as with others involved in unwinding including representatives from Medicaid managed care plans, primary care associations (PCAs) representing federally qualified health centers (FQHCs), legal aid and other advocacy organizations, and navigator groups in Arizona, Florida, Indiana, and Pennsylvania. These states were selected because they provided early data, have a large and diverse Medicaid population, and, collectively, are geographically and politically diverse (see the Appendix for more information on key policies and characteristics in the study states).
In addition, as part of our Annual Medicaid Budget Survey for State Fiscal Years 2023 and 2024, KFF worked with Health Management Associates (HMA) to survey Medicaid directors in all 50 states and DC, as well as conduct a follow-up telephone interview, with the goal of identifying and tracking trends in Medicaid spending, enrollment, and policymaking. To address current issues, the survey and phone interview included questions regarding Medicaid unwinding. This report synthesizes themes from these interviews and the survey, examining the perspectives of states and other participants on outreach and engagement, renewal processes during the unwinding period, and coverage transitions. See the methods box at the end of this report for more detail.
This report describes state and other participant experiences with Medicaid unwinding to provide additional context for a range of policy options adopted by states through temporary 1902(e)(14) waivers to address unwinding challenges and unwinding data. These perspectives provide examples of innovation, as well as continued challenges, during the first months of unwinding. These interviews occurred over multiple months. State Medicaid unwinding is a quickly evolving landscape, as new data, greater experience, and CMS guidance influence what is happening in the field.
Outreach and Engagement
Broad Takeaways Across All States
Interviews with states about outreach strategies during the unwinding of the Medicaid continuous enrollment provision revealed that most states have used multiple outreach strategies, with states noting it was difficult to isolate the most effective strategies because they have used a “no stone unturned” approach. In addition to more traditional communication campaigns using mailers, billboards, and print/radio/TV advertising, at least 15 states have used text messaging to conduct outreach. Most states were working with a wide range of groups to reach Medicaid enrollees, including MCOs, providers (like community health centers, other primary care providers, and pharmacies), community-based organizations, navigator/assister organizations, and faith-based groups. To increase the capacity of community partners to assist with outreach, some states provided outreach grants to local organizations.
Some states mentioned focusing particular attention on certain populations. Several states described specific outreach to users of long-term services and supports (LTSS) through outbound calls, in-person assistance, and working with nursing facilities and direct care providers to enable them to assist enrollees with renewals. A few states also mentioned outreach targeting people in rural areas, tribal populations, and non-English speaking populations as well as efforts aimed at certain zip codes. While most state interviews took place over the summer, some states mentioned back-to-school outreach or working directly with children’s groups.
Despite various strategies to increase enrollee response, including by making mail more visible using “urgent” stamps or colored envelopes (e.g., a pink letter campaign in Hawaii and yellow envelopes in Texas), states continue to struggle with enrollee nonresponse. However, a few states noted that as a result of aggressive outreach to update contact information and flexibilities to accept contact information from certain partners, they have experienced reduced rates of returned mail.
Outreach Strategies
Study states are using an array of strategies to reach out to enrollees. States have introduced new methods of communications and greatly increased their enrollee outreach, expanding the number of touchpoints before renewal. All four study states offeredpubliclyavailablecommunication toolkits for partner organizations to use, which included printable materials like posters, postcards, and handouts, as well as digital materials for social media, email, or content that can be embedded into websites. Indiana has offered to print and distribute these materials to external groups at no cost. Study states have also used traditional press to raise awareness; in Pennsylvania, for example, participants commended the Secretary of the Department of Human Services for travelling across the state and holding numerous unwinding press conferences to raise awareness at the local level. To increase the reach of messaging, state officials referenced strategies such as translating outreach materials for non-English speakers. Arizona officials noted electronic communication as an effective method to reach transient populations.
Many entities involved with unwinding have been conducting outreach to amplify state efforts. Some MCOs, newly able to provide direct outreach to enrollees as a result of 1902(e)(14) waiver flexibilities adopted in three study states (Florida is the only state that has not adopted any of these waivers), mentioned they would like to see these flexibilities become permanent so they can continue this outreach after the unwinding period ends. Innovative approaches to outreach include virtual renewal training events (an Indiana MCO reported thousands of attendees for such an event) and coordination between MCOs and FQHCs so providers can work with individuals due for renewal. Some participants in Arizona and Florida noted that direct local marketing and word of mouth can be more effective than statewide ads.
Targeted outreach messages and multiple strategies to update contact information have helped to reduce returned mail. State officials reported that supplementing their outreach efforts with information from the National Change of Address (NCOA) database has been effective for automatically updating mailing addresses and targeting outreach. Pennsylvania conducted a call campaign to people identified via the database as having a change of address, while Arizona credits the NCOA database for a precipitous drop in returned mail. State officials and MCO representatives both reported that receiving contact information from MCOs has also been helpful. Arizona, Indiana, and Pennsylvania have obtained 1902(e)(14) waivers to obtain updated contact information from MCOs. In Arizona, an MCO representative reported that they are able to check enrollees’ contact information with the state’s files and, if needed, MCO staff can provide the updated information to the state.
Despite significant outreach, navigators and those providing legal aid noted that some messages have created confusion and not all enrollees were aware that Medicaid disenrollments had resumed. In Pennsylvania, participants provided examples of enrollees not receiving phone calls, text messages, or letters even after updating their contact information, leaving them unaware that they need to be on the lookout for renewal paperwork. Similarly, Florida participants encountered individuals who signed up for electronic notifications and then never received an email. An Indiana participant spoke of the opposite issue, however: enrollees were overwhelmed by the large number of calls they were receiving about renewing their coverage. Florida navigators and advocates commented that unclear messaging and poor translations led to confusion about renewals and coverage status for enrollees.
“But we’re also doing things we’ve never done. The level of outreach, engagement, advertising; you know, we have never sent text messages before, we have never sent these emails before, we haven’t done all of these reminder calls.” – Indiana State Official
“We also have met with our MCOs regularly. We started with a series of webinars and then moved to a work group that they, I think, host a every couple of weeks, so that we can continue to ask questions or answer questions about their outreach and their activity with individuals in regard to the unwinding. We provide them direction on the kinds of messaging that we’d like to see, and they submit their own kind of versions to speak to their members. Whether that be text messages, emails, regular mail, phone call, call scripts, call center scripts everything to us, and we process a review of that.” – Pennsylvania State Official
“When they’re talking with a member they’re verifying the address and the phone number on file. If it is not the correct one that is being fed to us on our eligibility file then there is a way to go in, and they can provide that information so that it gets updated through AHCCCS [the state Medicaid agency].” – Arizona Participant
“They were receiving text messages that put them in a panic that like, ‘wait a minute we’re, we’ve lost coverage?…’ The messaging that was sent [to] our community was poor translations and then also confusing.” – Florida Participant
Stakeholder Coordination
Three of the study states hold regular meetings with groups involved in unwinding to coordinate efforts, and participants value this increased engagement. These states convene regular meetings, which began before the start of the unwinding period, to provide updates on unwinding plans, review the latest unwinding data, and share updated outreach materials and messages. Arizona holds large monthly meetings with about 100 participants as well as smaller meetings to focus on unwinding data that resulted in the state expanding its data reporting and developing a comprehensive unwinding dashboard. In Pennsylvania, the stakeholder meetings include multiple officials from the Department of Human Services, which administers Medicaid, and the state-based Marketplace, known as Pennie, and help to promote interagency coordination as well as coordination with stakeholders. Participants in Arizona, Indiana, and Pennsylvania all described the increased engagement with the state Medicaid agency as a bright spot during the unwinding. Florida was the only study state that did not have regular meetings with external groups involved in unwinding, though some study participants reported meeting with state officials individually. In lieu of meetings with the state, participants said they coordinated with each other to share information and experiences.
Feedback loops have helped states identify problems early in the unwinding process. Participants noted that regular meetings provide a forum for sharing on-the-ground experiences and alerting states to problems people are encountering with the renewal process. State officials said getting input about potential problems enables them to assess the situation and determine whether changes to processes or policies are needed. While participants agreed that states did not address all issues or did not respond as quickly as they wanted in all cases, the willingness of states to communicate about issues and engage over possible solutions helped build trust in the process.
Where there has been limited state engagement and communication, there are more reports of problems with the unwinding process and frustration among others working on unwinding. While participants in Florida indicated they were able to work individually with staff involved in the unwinding to resolve problems with specific cases, they said it has been harder to address issues like long call center wait times and problems with notices at a more systemic level. The reported lack of communication from the state has created a more adversarial situation, leading to a civil rights complaint and a lawsuit. Florida participants also described using press conferences and media calls to raise awareness broadly and for the state without direct access to a state meeting.
“We conduct a routine meeting every month… It’s nonprofit providers groups there, it’s legal services, attorneys there, it’s a healthcare advocates there, and they come to us with many questions about how the process is going and what our policies look like. We do our best to answer them, provide them information, hear what they have to say about our approach and make changes when we feel it’s necessary to do so.” – Pennsylvania State Official
“In Indiana our Medicaid Department is called FSSA, and FSSA has been incredibly transparent in what their plan was and the processes and the waivers that they were going to be applying for.…I also think that FSSA’s willingness to accept criticism and to listen to Hoosiers and stakeholders that, you know, you’re thinking about this process, it’s not working.” – Indiana Participant
Renewal Processes During the Unwinding
Broad Takeaways Across All StatesAll states cited the volume of renewals, systems issues, and staffing shortages as the most significant challenges during the Medicaid unwinding period. At least 11 states reported that their systems were old or difficult to use. A few states noted that it has been difficult to implement systems changes on “clunky” old systems and that the systems were not set up to produce real-time analytics to help inform unwinding efforts. In many states, the system issues exacerbated staffing shortages that states said negatively impacted the processing of renewals. Several mentioned that their staff was not experienced enough to handle the large workload, mostly due to high turnover among eligibility workers. One state cited a 20% staff vacancy rate, and another state pointed to low morale and burn-out among staff.
Most states mentioned they were taking steps to increase ex parte, or automated, renewals to reduce the burden on eligibility staff and enrollees; however, going into unwinding, there was variation across states in their ability to conduct ex parte reviews. In particular, some states that were previously unable to conduct ex parte renewals for non-MAGI populations (those who qualify on the basis of disability or being over age 65) reported newly adding ex parte reviews for some or all non-MAGI groups. As of January 2024, states have adopted a range of 1902(e)(14) waivers and other flexibilities to increase ex parte rates and streamline renewals. When asked about the most helpful flexibilities, states most often pointed to those allowing use of Supplemental Nutrition Access Program (SNAP) data to renew Medicaid, streamlining renewals for those with zero and low income, and waiving the asset limit test.
A few states specifically noted challenges with call centers and reported actions to enhance call center operations. For example, Arkansas upgraded call centers to better track metrics and to reduce call wait times. Virginia is using outbound calls to assist seniors and people with disabilities, and after seeing fewer online renewals than expected, the state began redirecting calls from county offices to the statewide call center to help reduce the burden on local agencies.
Eligibility Systems
While eligibility and renewal systems are generally working well in Arizona and Indiana, Pennsylvania is hampered by an outdated system that requires manual workarounds to comply with federal requirements. Arizona has prioritized automated eligibility processes for many years to help balance efficiency, cost effectiveness, and accountability. Officials noted that the state has added data sources and refined business rules for checking eligibility, which have increased ex parte rates and reduced demands on staff. Pennsylvania’s system, however, cannot conduct ex parte renewals for people enrolled in Medicaid and another program, such as SNAP or Temporary Assistance for Needy Families (TANF), or for non-MAGI enrollees. To address this limitation, the state implemented a mitigation plan requiring manual ex parte reviews before terminating coverage during the unwinding.
Respondents reported both benefits and drawbacks to having Medicaid eligibility systems that are integrated with other benefit programs. Integrated eligibility systems allow people to apply for and renew coverage for multiple benefit programs at once, and all four study states have Medicaid eligibility systems that are integrated with CHIP and social benefit programs like SNAP and TANF. Officials in Arizona and Indiana reported that data sharing across programs has helped improve ex parte renewal rates and simplify renewal processes. However, some Florida participants expressed concern that information provided during SNAP renewals, which occur more frequently than Medicaid renewals, can trigger a Medicaid review and potentially lead to people being disenrolled from Medicaid. State officials also reported that it can be more challenging to make changes to integrated systems because of the need to reconcile complex eligibility rules across programs.
Even where systems are working well, the volume of renewals poses challenges, and most system changes can take time to implement. State officials reported challenges “turning on” normal eligibility functions after three years of continuous enrollment, especially after states implemented changes to their systems during the pandemic that needed to be undone. In Arizona, officials noted that they are continually making changes to their systems, but at the start of the unwinding, the number of needed changes meant they could not test everything before going into production. Officials in Arizona and Indiana discussed having procedures for identifying problems and working closely with their vendors to fix things as they come up. However, because some systems changes can take longer to implement, states reported having to adopt manual workarounds for certain groups while developing more permanent changes.
“We have a weekly system ticket triage where we have policy operations and systems folks from both our vendor and internally, that are looking at ticket issues that are coming up. And we have definitely identified some…We are continually making changes…In the middle of everything else we implemented our 12-month postpartum. We are working on continuous eligibility…We’re trying to do everything at once, and sometimes the testing just can’t catch it all.” – Arizona State Official
Staffing
Respondents cited staffing shortages as an ongoing challenge contributing to slower processing of renewals and backlogs. Indiana officials noted that inexperienced eligibility staff coupled with staffing shortages led to renewal backlogs early in the unwinding, although the number of pending cases at the end of the month has since improved. Some respondents also noted that staffing shortages disproportionately affect certain communities. For example, Pennsylvania officials found that staffing shortages are more concentrated in urban areas where there is greater competition for workers. In Florida, participants echoed reports that staff shortages at call centers have led to longer wait times for Spanish-speakers compared to English-speakers.
Study participants noted that new and inadequately trained staff may be contributing to disenrollments of people who are still eligible. Federal guidance requires states to assess eligibility for all Medicaid pathways before disenrolling someone from coverage. However, according to participants, inexperienced staff may not be doing this full assessment before sending a termination notice. Participants in Pennsylvania noted this problem in counties with high turnover among eligibility workers and began adding information on additional eligibility pathways to paperwork they help people submit. Arizona officials acknowledged that training issues combined with the high volume of renewals each month increased the likelihood that staff would make mistakes or “cut corners” that could lead to incorrect eligibility determinations. They have sought to address this issue by providing additional training.
“We did have some backlog initially, due to we had a lot of new staff or existing staff that hadn’t done this in many years, and then just the people who are not used to doing renewals and so they have a lot of questions, and they want to reach out, which is absolutely what we want them to do. But we’ve made progress in reducing the number of renewals that are not yet completed at the end of the month… We’re definitely monitoring it, but we are seeing a trend in a good direction.” – Indiana State Official
“There’s been some good work on just trying to think through the processes and the impact on the staff. At the same time, I think staff are frustrated, overwhelmed and, you know there’s a lot of new staff who really don’t know the rules or the system very well. So, they’re the ones who are going to miss anything that requires manual review, that’s how things can go wrong.” – Pennsylvania Participant
Streamlining Renewals
States have taken steps to streamline the renewal process and increase their ex parte renewal processes. Arizona and Indiana opted to align renewal dates for all household members to reduce the number of times a family must respond to a renewal request. Three of the study states have also adopted temporary federal flexibilities using 1902(e)(14) waivers to improve ex parte rates, especially for cases where no income or assets are returned from state databases (Table 1). Study states have also taken steps outside of the federal flexibilities to improve ex parte rates. For example, Indiana added the Asset Verification System in 2020, improving the state’s ability to conduct ex parte renewal for non-MAGI enrollees, which, as noted above, is a challenge in many states.
Most study state officials noted that federal flexibilities related to verifying income and assets have been particularly helpful for increasing ex parte rates. When asked which federal strategies they would like to see made permanent, Arizona and Indiana officials cited the zero- and low-income strategies. These waivers allow states to complete ex parte renewals in cases where no income data are returned from state databases if the state had verified or accepted an attestation of no income or income below 100% of the federal poverty level (FPL) in the past 12 months. Indiana officials said that unemployed people can have trouble producing documentation of zero income. Arizona officials also found that the zero- and low-income strategies are generally low-risk for erroneously renewing coverage for someone who is over-income. Officials argued that it is unusual for someone’s previously verified income to increase a large amount without that person’s higher income appearing in state databases.
While all respondents expressed concern over procedural disenrollment rates, state officials noted that strategies to increase ex parte renewals have helped to lower those rates. Notably, in guidance released in December 2023, federal officials pointed to analysis showing that increasing ex parte rates is the most effect strategy to reducing procedural disenrollments. Procedural disenrollments occur when there is no definitive determination of ineligibility, and high procedural disenrollment rates could mean that some people losing Medicaid may still be eligible. While disenrollment rates across study states are similar, there is greater variation in procedural disenrollment rates; procedural disenrollments as a share of completed redeterminations range from 28% in Indiana to 15% in Arizona (Table 2). In Arizona and Indiana, officials prioritized automated processes as a way to reduce the number of people needing to complete paperwork who could potentially lose coverage for procedural reasons. Similarly, Pennsylvania officials found that the manual ex parte process they have put in place is effective at reducing procedural disenrollments because eligibility workers look at every case before terminating coverage. Notably, Pennsylvania is one of 29 states (but the only study state) that had been conducting ex parte renewals at the household level, rather than the individual level, contributing to some inappropriate procedural terminations (as of December 2023, Pennsylvania has nearly completed reinstatements for affected enrollees). State officials also credited increased outreach efforts as a major factor in reducing procedural terminations.
In response to questions about procedural disenrollments, Arizona and Indiana are reporting additional data on the reason for procedural disenrollments on their unwinding dashboards. For example, Arizona added data to their state dashboard showing that roughly three-quarters of procedural terminations were among people who the state had identified as over-income or aging out of coverage. Indiana began adding footnotes to their monthly Centers for Medicare and Medicaid Services (CMS) unwinding reports showing about one-third of procedural terminations also had “a non-procedural” reason for termination (e.g., over the income or asset limit, moving out of state, or death). The differences in the share of people with a non-procedural reason for closure may be partially explained by different data matching procedures in each state. Study participants in both states have also requested data on procedural terminations by zip code, which they believe will help more effectively target outreach. In response, Arizona recently published an interactive map showing zip codes at “low” or “high” risk of disenrollment, but could not provide exact counts out of privacy concerns.
“I think that the zero-income strategy is really helpful. We are working on the SNAP/TANF strategy, so that is number one…I think that all of the ones that we’ve adopted, if CMS were to say these are available permanently now, we would definitely look into, do we want to keep them? They were things that are helpful and common sense.” – Indiana State Official
Enrollee Communication and Notices
All four study states have increased the number of communication touch points when enrollees cannot be renewed via ex parte processes, including sending multiple reminder notices through the mail, email, and text. Pennsylvania, for example, went from just sending a mailer 90 days ahead of renewal to adding 11 “touches,” which include reaching out 90, 60, 30, and five days before a renewal is due. Study participants noted that enrollees who enrolled in Medicaid for the first time during continuous enrollment needed additional reminders and education about completing Medicaid renewals. In Indiana, one participant said that they have begun a consumer campaign focused on encouraging individuals to open letters from the state after hearing from multiple people that they were ignoring incoming letters because they incorrectly assumed no action was needed.
Study participants in all four states reported that Medicaid renewal and termination notices can be difficult to understand and, in some cases, provide misleading or incorrect information. While participants noted myriad issues with notices, Florida advocates were the most critical of the state’s notices. In Florida, advocates have filed a lawsuit over notices, contending that termination notices are confusing, fail to explain why individuals lost Medicaid coverage, and sometimes include incorrect information. Florida participants also described situations where enrollees were requested to provide information or documentation that is not necessary for renewal and noted that it is often unclear which individuals have been denied coverage within a household. Arizona and Pennsylvania participants observed that, for some enrollees, the notices are not clear on what actions or documents are needed for renewal. Other areas of concern include poor translations and notices not being translated into requested languages. An Indiana participant said the notices informing parents that their child has been transitioned to CHIP coverage were confusing because families receive one notice about disenrollment from Medicaid and separate notice indicating enrollment in CHIP. Across multiple study states, participants also said that termination notices included language discouraging people from requesting continued benefits while they appeal their coverage denial.
Some states have made changes to fix incorrect information or to provide additional clarifying information in notices. While changing Medicaid notice language can be a lengthy process, participants reported situations in which states corrected notice language or adopted creative workarounds to improve information shared with enrollees. In Arizona, participants noted that early in the unwinding termination notices included incorrect information about maintaining coverage during an appeal; the state has since corrected the language. In Indiana, at the request of participants, the state added brightly colored inserts to notices that include additional clarifying information.
“Sometimes it’ll come back and say all of the individuals were denied for coverage, right? …And then the next page, this person approved and enrolled. And it’s like; are they all denied, are they enrolled?… Do I have coverage, do I not?” – Florida Participant
Assisting Enrollees with Renewals and Appeals
Participants involved in unwinding reported challenges getting through to call centers when enrollees needed assistance with their renewals, with some enrollees never receiving needed help. According to participants, call center wait times can be lengthy and it can be challenging to be connected to a staffer able to answer questions, especially for complicated cases. One Florida participant said some people will carry their phone on speaker phone for hours waiting to get through to the Florida Department of Children and Families (DCF) and sometimes calls can be disconnected. A Pennsylvania participant also noted long call center wait times for some enrollees. An Indiana participant observed the quality of call center assistance can vary, with some newer employees less able to resolve enrollees’ issues.
Non-English language speakers have experienced more difficulty with call centers. An Arizona advocate observed that individuals with limited English proficiency faced longer wait times and could sometimes have their calls dropped. In Florida, participants noted that while an English speaker may wait 30-45 minutes, a Spanish speaker could end up waiting hours. In Pennsylvania, a participant similarly reported that requesting a language other than English can lead to longer wait times, and occasionally if Spanish interpreter lines are busy, people will be rolled over to the English lines. In Indiana, one navigator noted that some call center staff will not allow bilingual navigators to join calls or speak on behalf of their client, requiring that a call center interpreter be used instead which can create additional confusion.
Some participants in the study states noted challenges with timeframes for responding to renewal notices. Some study state participants noted that the timeframes to respond to a renewal notice or to find other coverage after receiving a termination notice are too short. Florida advocates wanted the state to consider adopting flexibilities offered by CMS to extend the timeframe for renewals to help address this issue. Participants in Pennsylvania also noted that the window to return renewal packets is short and results in difficulty submitting documents by the deadline, especially if there are mail delays.
In Arizona and Indiana, MCOs are able to help their members complete renewals and contract with outside vendors or navigator to provide that assistance. Generally, MCOs are prohibited from assisting enrollees with completing renewals; however, during the unwinding, Arizona and Indiana obtained 1902(e)(14) waivers that allow MCOs to help their members complete renewals. MCO respondents in both states said they are working with vendors because of the scale of the task and compliance concerns. In Arizona, an MCO participant spoke of how they have been able to pass on lists from the state of enrollees coming due for renewal to a vendor to do targeted outreach and education. This vendor collects information over the phone for members, helps gather supporting documents, and submits the renewal on their behalf. In Indiana, one MCO participant also used a vendor to set up an in-house call center for member renewal questions.
“The renewal notices, there is a very short window for them to be returned, and folks who are getting those notices sometimes are not getting them until after the deadline, or after the date that it’s supposed to come back. So, depending on the mail system and depending on when it was date-stamped as to the Department of Human Services, the stamp put on it, and it actually being put in the mail, there’s a little lag time in there we’re starting to see. So, that response time is shortened and then that backs up the entire process.” – Pennsylvania Participant
Coverage Transitions
Broad Takeaways Across All States
At the time of our interviews, it was still relatively early in the unwinding process and most states said data on coverage transitions were limited. States specifically mentioned the lack of information on people reenrolling in Medicaid after being disenrolled, also known as churn, as a factor contributing to uncertainly about overall net Medicaid enrollment projections for the fiscal year. Among the few states able to track reenrollment in Medicaid, churn rates of people reenrolling within a short period varied from about 25% to 40%. The ability of states to track transitions to the Marketplace varied by Marketplace type—all interviewed states operating a state-based Marketplace reported some ability to track information on enrollment in Marketplace plans while states that rely on the federally-facilitated Marketplace were waiting on the release of federal data. Fewer states were able to track transitions to private coverage and did so through indirect means, including surveys and information from MCOs.
‘Churning’ Back on to Medicaid
State officials and other study participants acknowledge that some individuals who are disenrolled from Medicaid for procedural reasons reenroll after a short period. At the time of the interviews, state officials explained they were just getting data on churn among those who were disenrolled for procedural reasons and had not had time to analyze the data. Both Arizona and Pennsylvania are now reporting data on the number of people reenrolling in Medicaid. Pennsylvania state officials mentioned they are considering working with a vendor to identify and follow up with individuals procedurally disenrolled who may still be eligible. Other participants also spoke about their experiences with enrollee churn. An Arizona participant noted that nearly half of individuals who re-apply during the reconsideration period are renewed, indicating that eligible individuals are being dropped and losing coverage. An MCO in Indiana said that the initial files shared by the state made it difficult to analyze churn, though the MCO is currently assessing improved data elements from the state. Study states have also implemented new communication methods to target people who are procedurally disenrolled. Both Arizona and Pennsylvania send letters following disenrollment to let people know they still have time to renew coverage.
Study participants reported that losing Medicaid despite being eligible creates confusion and distrust in the community, leading some people to choose not to reapply. Navigators and advocates described how being dropped from Medicaid, particularly because the state did not process their paperwork before the due date, causes some enrollees to lose trust in the ability of navigators and other to provide needed help and in the program overall. That frustration can lead them to give up on the process and not work to complete a renewal or reapply, if needed. Indiana community outreach groups, including chaplaincy programs, are working on rebuilding trust in the community to assist in getting people reenrolled.
“When people are contacting [AHCCCS], over 50% of them that have been terminated procedurally, are being reinstated. So to us this is concerning because it’s indicative of a potentially high rate of erroneous terminations that are happening.” – Arizona Participant
“What’s happening is when there are barriers, people just give up. There is like, ‘whatever, I just pray I don’t get sick, or I’ll go to the emergency room for care, or I’ll continue to go to my community health center where they’re gonna charge me based on the sliding fee.’ Then, they don’t sign up for Medicaid anymore, whether they qualify or they don’t.” – Pennsylvania Participant
Transitions to CHIP and the Marketplace
Arizona and Indiana auto-enroll eligible children into CHIP ensuring a seamless coverage transition, but other study participants reported gaps in coverage for some children transitioning to CHIP in Florida and Pennsylvania. When children in Arizona and Indiana are found to be ineligible for Medicaid, the states automatically enroll them in CHIP, if eligible, without any action required from the family. Though, as noted above, participants in Indiana said unclear notices about the transition created confusion for some families. Pennsylvania recently integrated CHIP into their Medicaid eligibility system, a project that had been planned for years, but coincided with the start of the unwinding period. Study participants reported that there were challenges with the rollout and system glitches have led to some children losing coverage. In Florida, participants noted that children no longer eligible for Medicaid have their information automatically transferred to CHIP; however, slow processing times lead to gaps in coverage for some children. A December 2023 letter from federal officials to Florida’s governor raised concerns about child disenrollments and encouraged the state to adopt additional strategies to reduce child disenrollments, such as utilizing more federal flexibilities as well as eliminating CHIP premiums and lockout periods, which help with transitions from Medicaid to CHIP.
Although many people who are no longer eligible for Medicaid qualify for subsidized Marketplace coverage, study participants said affordability remains a barrier to enrollment. Respondents generally said that account transfers to the Marketplace were happening as expected; however, the number of people disenrolled from Medicaid who enroll in Marketplace coverage remains low in all study states. Even with heavily subsidized premiums and cost-sharing for the lowest-income enrollees, participants said that for some people, the deductibles and cost sharing are too high. They also pointed out that not everyone is aware of Marketplace coverage as an option and that educating people about premiums, cost-sharing, benefits, and the Marketplace generally is an ongoing need. Awareness of the Marketplace is low in Pennsylvania, which launched its State-Based Marketplace, Pennie, during the pandemic. Pennsylvania’s statewide press campaign has been held jointly between the Department of Human Services and Pennie to increase awareness.
Navigators in states using the Federally-facilitated Marketplace (FFM) described problems with the quality of the contact information they receive through the Medicaid Assister Community (MAC) program. The purpose of the MAC is to provide navigators with lists of people disenrolled from Medicaid whom navigators are expected to contact with information about applying for Marketplace coverage. However, navigators participating in the program in the three study states using the FFM (Arizona, Florida, and Indiana) identified common challenges. They reported outdated or missing contact information, and some data erroneously included minors (who navigators cannot contact) and people who still qualified for Medicaid. The volume of people to contact overwhelmed navigators, with one organization reporting having to contact thousands of consumers each week; however, bad data meant the number of people who enroll in the Marketplace is low.
“I think cost is a barrier. I think that is the problem because the premiums have consistently gone up over the last six to seven years…. It’s a bit of a sticker shock when you go from state insurance to over to the Federal Exchange or even to your employer. Sometimes your employer coverage can be more than Marketplace.” – Indiana Participant
Looking Ahead
At the beginning of 2024, nine months into the unwinding process, states have completed renewals for less than half of all enrollees. While many who are disenrolled may “churn” back to Medicaid or transition to other coverage, many will likely become uninsured. People who are uninsured face more barriers to care, go without needed care and also may experience higher out of pocket costs and medical debt.
Data are important to help monitor how unwinding is going across states, but trackers and dashboards only tell part of the unwinding story. Medicaid eligibility is complex, and outcomes are the result of federal and state policy decisions but also the result of how those policies are implemented and how well eligibility and other systems work. Gaining perspectives from state officials, others involved with unwinding and enrollees provides valuable insights into what is working well and where there are challenges and room for improvement to efficiently identify those who are no longer eligible and help those who are eligible maintain coverage.
With more than half of renewals still to be completed, there is time to learn from experience. Key themes from the interviews include:
Efforts to enhance outreach and stakeholder engagement such as:
Supplementing broad outreach strategies aimed at raising awareness with targeted messaging that is directed at certain populations who are at greater risk of not completing their renewals may help increase renewal response rates;
Use of the NCOA database and partnering with MCOs can help to reduce returned mail;
Collaborating with stakeholders to reach enrollees and also to establish feedback loops can help to continue to identify problems even as initial issues are addressed;
Efforts to improve renewal processes that include:
Adopting federal flexibilities to streamline renewals and increase ex parte rates can simultaneously help to reduce the burden on overloaded staff and reduce procedural disenrollments among those who remain eligible;
Improving communication with enrollees, including notices and call center access, can reduce enrollee confusion and increase the likelihood that individuals are able to resolve problems;
Efforts to smooth transitions to other coverage such as:
Auto enrollment of eligible children into CHIP can support seamless coverage transitions and reduce the number of children experiencing a gap in coverage; and
Greater coordination with the Marketplace can increase awareness of that coverage option and improvements to the MAC program, particularly enhancement of data quality, could lead to a greater number of people transitioning from Medicaid to Marketplace coverage.
States will continue the process of unwinding continuous enrollment through much of 2024. Any steps they take in the near term to improve systems and processes to help people who are still eligible maintain Medicaid and those who are no longer eligible transition to other coverage can reduce the number of people who become uninsured. Looking ahead, lessons learned from this experience can be used to inform policy changes and direct resources to more successful outreach and other strategies for reaching and communicating with enrollees and to make longer-term improvements to Medicaid renewal processes.
Methods
A total of 15 interviews were conducted, including one written response, in the four study states between August and November: three with state officials (we did not talk with state officials in Florida), two with managed care organization (MCO) representatives, three with legal aid organizations, and six with state navigators/assisters and primary care associations (PCAs) representing federally qualified health centers (FQHCs) (some PCA organizations also act as navigators and assisters). PerryUndem assisted with the logistics and facilitating interviews. The Medicaid budget survey, conducted by KFF and HMA, was sent to state Medicaid directors in June 2023. Forty-four states participated in a follow-up telephone interview, conducted between July and September 2023. (Florida, Minnesota, and South Carolina did not respond to the 2023 survey or telephone interview, and Alabama, New Hampshire, New Jersey, and Washington did not participate in the follow-up telephone interview.)
Appendix
The appendix tables below summarize some of the key criteria used in selecting study states.
Most nonprofit hospitals and hospital systems had enough cash on hand in 2022 to cover operating expenses for an extended period of time, though about one-in-10 had relatively low levels to cover their expenses, which potentially could leave them vulnerable in a financial crisis, a new KFF analysis finds.The analysis comes as the hospital industry pushes for increases in Medicare and Medicaid reimbursement levels and Congress considers legislation that would reduce hospital revenues, such as through site-neutral payment reform. It looks at “days cash on hand” at 274 nonprofit hospitals and health systems rated by S&P Global, which are estimated to collectively account for more than half of all nonprofit hospitals and about two thirds of nonprofit beds. The measure is one of several that S&P Global uses to assess hospitals’ financial health and determine their credit rating. Those with more days of cash on hand are better able to weather financial challenges, such as low operating margins.
The analysis finds:
Nearly three-quarters (73%) of nonprofit hospitals and health systems analyzed had at least “strong” levels of cash on hand based on the S&P’s standard definitions – enough to cover at least 150 days of expenses for health systems or 160 days of expenses for stand-alone hospitals.
An additional one-in-six (18%) had “adequate” levels of cash on hand – enough to cover 100-150 days for hospital systems or 110-160 days for stand-alone hospitals.
About one-in-10 (9%) analyzed hospitals and health systems had fewer days of available cash on hand, which the ratings agency considers “vulnerable” or “highly vulnerable.”
The total share of non-profit hospitals and health systems with “vulnerable” or “highly vulnerable” levels of days cash on hand may be larger, since the as the S&P data analyzed underrepresents groups that are more likely to face financial challenges, such as small and rural hospitals.
Across all analyzed hospitals and hospital systems, the average levels of days cash on hand stood at 218 days in 2022, similar to the levels in 2019 but down from a recent peak during the early years of the COVID-19 pandemic.
Policymakers, employers, insurers and others have expressed concern about the cost of hospital care in the United States, which totaled $1.4 trillion in 2022, contributing to higher health insurance premiums; lower wages for workers; and greater out-of-pocket spending, medical debt, and barriers to care for patients. At the same time, hospital industry representatives and others have pointed to recent financial challenges facing the sector and have pushed for increases in Medicare and Medicaid reimbursement levels and lobbied against legislation that would reduce hospital revenues, such as through site-neutral payment reform. Operating margins decreased by a large amount between 2021 and 2022. Industry reports suggest that operating margins haveimproved in 2023 but tend to remain below pre-pandemic levels.
However, operating margins capture only one component of the financial health of hospitals and health systems. This data note examines “days cash on hand”—another measure of financial standing that estimates the number of days that an entity could cover their cash expenses using available reserves. Hospitals and health systems with more days of cash on hand are better able to weather financial challenges, such as low operating margins. This analysis includes nonprofit hospitals and health systems from 2019 through 2022 based on data from S&P Global, a credit rating agency. The S&P data in this analysis include an estimated 56 percent of all nonprofit hospitals and 65 percent of all nonprofit hospital beds but underrepresent entities that are likely to be more financially vulnerable, such as relatively small hospitals, rural hospitals, and hospitals with relatively low commercial prices. See Methodsfor more details. Highlights include the following:
In 2022, most nonprofit hospitals and health systems analyzed (73%) had at least “strong” days of cash on hand, though about one in ten (9%) had “vulnerable” or “highly vulnerable” levels. This is based on S&P’s standard categories for days cash on hand, which it uses along with other financial measures, such as operating margins and debt burden, to assign credit ratings to nonprofit hospitals and health systems.
The majority of nonprofit hospitals and health systems with negative margins in this analysis (60%) had at least “strong” days cash on hand. As might be expected, most nonprofit hospitals and health systems with “vulnerable” or “highly vulnerable” days cash on hand in this analysis (81%) had negative operating margins.
The average days of cash on hand among nonprofit hospitals and health systems analyzed was similar in 2022 (218 days) to pre-pandemic levels (225 days in 2019).
The financial reserves (unrestricted cash and investments) of nonprofit hospitals and health systems analyzed increased early in the pandemic before falling in 2022; the latter trend coincided with decreases in the value of stocks and other investments that have likely stabilized or increased with 2023 market improvements.
Discussions about hospitals’ financial challenges often focus on operating margins, though days of cash on hand provide different and complementary information about the financial standing of hospitals and health systems. Operating margins provide useful information about the short-term financial standing of a given hospital or health system, i.e., the extent to which they are earning a profit on patient care and other operating activities. However, two entities with the same operating margins in a given year may be in a much different financial position depending, for example, on their days of cash on hand. Hospitals and health systems with more days of cash on hand are better able to weather financial challenges, such as low operating margins for a period of time. This may be especially salient in the aftermath of the pandemic. Hospitals and health systems with more days of cash on hand also have access to more resources internally that can be used to invest in operations, and they may be able to qualify for lower interest rates when borrowing money, all else equal, both of which may facilitate their growth and competitiveness over the long term. Although having a high level of days cash on hand points to one source of financial strength, it is possible that a given hospital or health system may also have challenges that are captured by other metrics, such as low operating margins or a high debt burden.
Results
In 2022, most nonprofit hospitals and health systems analyzed (73%) had at least “strong” levels of days cash on hand, though about one in ten (9%) had “vulnerable” or “highly vulnerable” (less than “adequate”) levels. Days of cash on hand is defined as financial reserves (unrestricted cash and investments) divided by daily cash expenses. Categories of this measure (e.g., “strong”) are based on S&P’s standard rubric for evaluating days cash on hand, which it uses along with other financial measures to assign credit ratings to nonprofit hospitals and health systems. Credit ratings indicate the likelihood that entities will be able to repay their long-term debt. S&P’s categories correspond to a range of days cash on hand. For example, “strong” levels correspond to 150-200 days for systems (160-205 days for stand-alone hospitals) and “adequate” levels correspond to 100-150 days for systems (110-160 days for stand-alone hospitals) (See Methods for the complete list). S&P may adjust these categories based on other available information, such as reports that a system is planning to spend some of its reserves on upcoming infrastructure projects.
The total share of nonprofit hospitals and health systems that are “vulnerable or highly vulnerable” in the US is likely to be larger than this estimate derived from S&P data because certain types of hospitals that are more likely to have financial challenges are underrepresented, such as small hospitals, rural hospitals, and hospitals with relatively low commercial prices (see Methods for details about the sample).
The majority of nonprofit hospitals and health systems with negative operating margins in this analysis had at least “strong” levels of days cash on hand in 2022, though, as might be expected, having fewer days of cash on hand among nonprofit hospitals and health systems was associated with negative operating margins in 2022. Sixty percent of the nonprofit hospitals and health systems with negative operating margins in this analysis had at least “strong” levels of days cash on hand in 2022. Hospitals and health systems with more days of cash on hand are better able to weather operating losses, all else equal. Nonetheless, about four out of five (81%) nonprofit hospitals and health systems in this analysis with “vulnerable” or “highly vulnerable” days of cash on hand had negative operating margins in 2022.
Average days of cash on hand among nonprofit hospitals and health systems analyzed was similar in 2022 to pre-pandemic levels. The nonprofit hospitals and health systems in this analysis had an average of 225 days of cash on hand in 2019 and nearly the same number, 218 days of cash on hand, in 2022, when weighting entities by their daily cash expenses. In the years between, average days cash on hand increased (from 225 days in 2019 to 267 days 2021) before decreasing to an amount close to pre-pandemic levels. To put this in context, S&P generally considers 218 days to be a “very strong” level of days cash on hand. As noted above, it is likely that this analysis excludes nonprofit hospitals and health systems with relatively few days of cash on hand on average, though the hospitals in this analysis encompass a large portion of the nonprofit sector, including an estimated 56 percent of nonprofit hospitals and 65 percent of nonprofit hospital beds.
Financial reserves and daily cash expenses among nonprofit hospitals and health systems analyzed increased by a similar rate from 2019 to 2022. Financial reserves are defined to include all cash and investments (such as stocks) that are “unrestricted” (i.e., available for any purpose), while daily cash expenses reflect annual operating expenses minus non-cash expenses (i.e. depreciation and amortization), divided by 365 (see Methods for more on definitions). From 2019 to 2022, total financial reserves and daily cash expenses among nonprofit hospitals and health systems grew by a similar rate: 23% and 27%, respectively (data not shown). Daily cash expenses increased throughout this period likely due in part to increases in labor costs and increases in the cost of medical and other supplies as a result of high inflation rates. Financial reserves increased at a faster rate than expenses in 2020 and 2021 before dropping in 2022. Financial reserves may grow due to many factors, including profits from patient care and other operating activities, income from investments (such as stock dividends), increases in the market value of investments, profits from the sale of investments, income from selling off nonfinancial assets (such as property or joint venture businesses), and new loans (to the extent that they exceed the amount repaid on existing loans). Financial reserves may decrease for similar but opposite reasons and other factors, such as spending on new buildings, medical equipment, and information systems. Growth in the size of hospitals and health systems through mergers and acquisitions could also contribute to increases in both financial reserves and daily cash expenses over time.
Financial reserves for nonprofit hospitals and health systems analyzed fell with the value of stocks and other investments in 2022 that have likely stabilized or increased with 2023 market improvements. Financial reserves fell by $64 billion in 2022 among the nonprofit hospitals and health systems in this analysis while the market value of their stocks and other financial investments decreased by $70 billion. If stocks and other financial investments had instead retained their value in 2022, then financial reserves would have increased by $6 billion rather than decreasing by $64 billion among the nonprofit hospitals and health systems in this analysis (and average days of cash on hand would have fallen by 22 days rather than 49 days in that year).
The value of financial investments among nonprofit hospitals and health systems have likely stabilized or increased with 2023 market improvements. For example, the S&P 500 increased by 24 percent in calendar year 2023 after decreasing by 20 percent in calendar year 2022. Nonetheless, data are not yet available to provide a full picture of how nonprofit hospital and health system stock portfolios and other investments have performed in 2023.
While financial reserves decreased in 2022, they increased by a larger amount earlier in the pandemic, leading to an overall increase from $446 billion in 2019 to $548 billion in 2022 among the nonprofit hospitals and health systems in this analysis, a $102 billion change. Hospitals and health systems received large amounts of government relief during the COVID-19 pandemic that may have contributed to this increase in financial reserves. Had hospitals not received pandemic relief dollars, operating losses, as applicable, would need to have been covered with existing financial reserves or cash obtained through other means (such as by taking out new loans or selling assets, like property). Pandemic relief dollars and other one-time sources of operating revenue, together known as “nonrecurring operating revenues”, totaled $52 billion from 2019 through 2022 among the nonprofit hospitals and health systems in this analysis, most of which, $29 billion, was received in 2020. It is likely that pandemic relief dollars made up the large majority of these nonrecurring operating revenues, as totals jumped from $13 million in 2019 to $29 billion in 2020 (i.e., the beginning of the pandemic) among the nonprofit hospitals and health systems in this analysis (before falling to $14 billion in 2021 and $8 billion in 2022).
Discussion
Many nonprofit hospitals and health systems had at least “strong” levels of days cash on hand in 2022, and averages among a large number of nonprofit entities were similar in 2022 to pre-pandemic levels. This result adds some nuance to recent stories about the financial challenges facing hospitals and health systems, which have informed policy debates about government reimbursement and funding for these entities. Although operating margins dropped by a large amount in 2022—likely due to the erosion of pandemic relief funds, costs associated with labor shortages, and increased supply expenses due to high inflation rates, among other factors—many nonprofit hospitals and health systems had a large financial cushion as of 2022 to help weather these challenges. Reports suggest that operating margins have improved in 2023—perhaps due to decreases in labor expenses and increases in volume and reimbursement rates, among other factors—but that they tend to remain below pre-pandemic levels. As hospitals continue to adjust to these financial challenges, those with more days of cash on hand will be better positioned to absorb operating losses, all else equal.
About ten percent of nonprofit hospitals and health systems in this analysis had “vulnerable” or “highly vulnerable” levels of days cash on hand in 2022, and it is likely that the percent would be higher if the analysis included all nonprofit hospitals and health systems in the US. While this analysis includes more than half of all nonprofit hospitals, it underrepresents certain types of hospitals that may be more likely to have financial challenges, such as small hospitals, rural hospitals, and hospitals with relatively low commercial prices. About four in five of the entities in this analysis with “vulnerable” or “highly vulnerable” levels of days cash on hand also had negative operating margins. This subset of nonprofit hospitals and health systems could be especially challenged to maintain current services or remain open. At the same time, 60 percent of the nonprofit hospitals and health systems in this analysis with negative operating margins had at least “strong” days cash on hand, suggesting some capacity to manage through challenging times.
Better, more complete, and standardized information about the days of cash on hand at hospitals and health systems could provide policymakers with a greater understanding of the financial status of these entities and which entities have a weaker or stronger footing. The federal government does not currently collect standardized information about days of cash on hand, which is why this analysis relies on data provided by S&P. Information about profitability is often based on cost reports submitted by many hospitals to the federal government, but cost reports are less standardized than the data used for this analysis and are missing key details that are necessary to provide reliable information about days of cash on hand. Some states have begun to fill in gaps in financial data by requiring that hospitals and health systems report additional and more standardized information. Such information would improve the understanding of how financially vulnerable hospitals are performing and inform policy pertaining to hospital costs and finances.
Methods
Data. We obtained financial data for a large number of nonprofit entities from S&P Global RatingsDirect, which collects and standardizes information from audited financial statements as part of their process for generating credit ratings. These financial data typically encompass every component of a given health system, including hospitals, other providers, and, in some cases, health plans (the largest example being Kaiser Permanente). Hospitals and health systems use different reporting periods for their audited financial statements in a given year. For 2022, the three most common reporting periods accounted for the large majority (96%) of hospitals and health systems in our analysis: January 2022 to December 2022 (39% of hospitals and health systems), July 2021 to June 2022 (33%), and October 2021 to September 2022 (25%). When focusing on entities with calendar year reporting periods, we found a slightly larger decrease in average days of cash on hand (from 226 to 214 days).
In some instances, S&P data may include entities with overlapping financial data (e.g., a health system and a subset of the health system that was recently acquired and continues to receive a credit rating), which would lead to double-counting. We attempted to identify these cases by flagging: (1) entities with the same ultimate parent organization in S&P’s data and (2) entities that were matched to the same health system based on information from the American Hospital Association (AHA) Annual Survey Database (see below). In those rare instances, we retained the larger entity.
We relied on the American Hospital Association (AHA) Annual Survey Database to help create and describe our sample (see below). We matched S&P entities to AHA data using a combination of name, ZIP code, and state. We linked S&P entities that could not be matched based on these variables through a manual review process. Our matches could be inaccurate in some instances for a variety of reasons. For example, S&P and AHA data could identify system membership differently in certain scenarios, in which case we may include some hospitals that are not part of the financial data for a given system or exclude some hospitals that are.
Measures. Our analysis focuses on days of cash on hand, which equals financial reserves divided by daily cash expenses. Financial reserves are defined to include all unrestricted cash and investments (such as stocks) but to exclude restricted cash and investments, which are legally constrained to serve a particular purpose (such as to fund the construction of a new facility). Daily cash expenses are defined as (operating expenses – depreciation and amortization) / 365. Categories of days cash on hand are based on S&P’s standard rubric (though the agency may adjust these categories based on other available information, such as reports that a system is planning to spend some of its reserves on upcoming infrastructure projects). Categories include the following:
Extremely strong: >275 days for standalone hospitals; >250 days for systems
Very strong: 205-275 days for standalone hospitals; 200-250 days for systems
Strong: 160-205 days for standalone hospitals; 150-200 days for systems
Adequate: 110-160 days for standalone hospitals; 100-150 days for systems
Vulnerable: 80-110 days for standalone hospitals; 70-100 days for systems
Highly vulnerable: <80 days for standalone hospitals; <70 days for systems
Our analysis includes average days of cash on hand weighted by daily cash expenses as well as some total dollar amounts (e.g., aggregate financial reserves). Larger health systems, by definition, contribute more to weighted averages and total dollar amounts. For example, the five largest health systems accounted for 22% percent of total daily cash expenses in 2022. The number of and trends in days of cash on hand were similar when looking at medians (224 in 2019 and 217 in 2022), which do not give additional weight to larger health systems. Similarly, most nonprofit hospitals and health systems in this analysis trended in the same direction as aggregate dollar amounts, with most exhibiting overall increases in financial reserves and daily cash expenses from 2019 and 2022 (84% and 98% of entities, respectively). Although there tended to be an increase in cumulative financial reserves from 2019 through 2022, most entities (88%) experienced decreases in financial reserves in 2022 and in the market value of financial investments (94% of entities) in that year. Nearly half (46%) of those with decreases in financial reserves in 2022 also had larger decreases in the market value of financial investments.
From 2020 through 2022, days cash on hand was higher than it otherwise would have been by what was likely a small number of days due to the deferral of Social Security payroll taxes under the Coronavirus, Aid, Relief and Economic Security (CARES) Act. In particular, employers were allowed to defer their share of these taxes that would otherwise have been due from March 27 through December 31, 2020. They were required to pay at least half of the deferred amount by December 31, 2021 and any remainder by December 31, 2022. We evaluated the magnitude of this benefit based on cleaned financial data for eight health systems in Massachusetts with October to September reporting periods. Among these health systems, the payroll tax deferral had the largest effect on days cash on hand in 2021 (ranging from zero to six days for an average of four days) and the smallest effect in 2022 (ranging from zero to three days for an average of one day). About four in ten (39%) hospitals and health systems evaluated in this data note had calendar year reporting periods; the payroll tax deferral should not have affected days cash on hand for these entities in 2022 if it were fully repaid by December 31, 2022, as required. S&P data on financial reserves and days cash on hand do not include Medicare advance payments.
Sample. We excluded some S&P hospitals and health systems from our analysis. First, we dropped for-profit hospitals and health systems. For-profit entities tend to maintain low financial reserves—and therefore have low days of cash on hand—as they face pressure to return excess cash to stockholders through dividends. Second, we excluded public hospitals and health systems, as there are a relatively small number of these entities in S&P data. Third, we excluded hospitals and health systems that were missing data for at least one year from 2019 through 2022. Fourth, we excluded hospitals and health systems when most of the reporting period for a given year fell in the prior calendar year (e.g., April 2021 to March 2022 reporting periods for 2022). Fifth, we dropped a small number of entities that appeared to overlap with others. Sixth, we dropped a small number of entities based in the US Territories. Finally, we dropped entities that we were unable to match to AHA data, which helped us narrow the sample to private, nonprofit hospitals and health systems. We defined nonprofit systems as those in which a majority of member hospitals were nonprofit.
After these changes, our analysis included 274 nonprofit hospitals and health systems. Based on our match to AHA data, these entities accounted for an estimated 56 percent of nonprofit hospitals in 2021 and 65 percent of nonprofit hospital beds.
Our analysis encompasses a large portion of nonprofit hospitals and health systems, but it excludes, among other entities, those that have not applied for a credit rating through S&P. To evaluate how representative our data are, we compared the characteristics of nonprofit hospitals with cost report data that could and could not be matched to S&P entities based on: (1) RAND Hospital Data, which is a cleaned and processed version of annual cost report data submitted by Medicare-certified hospitals to the Healthcare Cost Report Information System (HCRIS), (2) the RAND Price Transparency Study, and (3) AHA data. We found that our sample underrepresents small hospitals, rural hospitals, hospitals that are not part of a multihospital system, and hospitals with relatively low commercial prices. Excluded hospitals also had lower operating margins on average in 2022 but appeared to be similar to included hospitals based on Medicaid inpatient discharge shares. Our analysis excluded government hospitals, which tend to have lower days of cash on hand, as well as for-profit hospitals, which tend to maintain less financial reserves due to their organizational structure.
Although our analysis includes a distinct set of hospitals and health systems, it also encompasses a large portion of the nonprofit sector. Other, more comprehensive hospital data, such as HCRIS or AHA survey data, do not include reliable information about days of cash on hand. For example, cost reports collect information at the hospital level, but financial reserves are often held at the system level. In those scenarios, cost report data would understate the financial reserves that are available to the hospital.
This work was supported in part by Arnold Ventures. KFF maintains full editorial control over all of its policy analysis, polling, and journalism activities.
Nancy Kane, an independent consultant, provided input for this analysis.
In a given year, a small portion of the population is responsible for a very large percentage of total health spending. This slideshow explores the variation in health spending across the population through an analysis of the 2021 Medical Expenditure Panel Survey (MEPS) data. The analysis finds that, in 2021, 5% of the population accounted for nearly half of all health spending. At the other end of the spectrum, the 50% of the population with lowest total health spending accounted for only 3%.
It also examines spending variation by age, gender, race, insurance status and presence of certain health conditions.
The chart collection is part of the Peterson-KFF Health System Tracker, an online information hub dedicated to monitoring and assessing the performance of the U.S. health system.