KFF designs, conducts and analyzes original public opinion and survey research on Americans’ attitudes, knowledge, and experiences with the health care system to help amplify the public’s voice in major national debates.
A new KFF resource tracks dozens of state laws and policies that restrict access to gender-affirming care among young people. Gender-affirming care supports and affirms gender identity through social, psychological, behavioral, or medical interventions.
As state laws and policies restricting youth access to gender-affirming care proliferate, KFF’s new tracker assesses this landscape, describing the content of laws and policy, identifying groups of people (in addition to young people) who are impacted (e.g., providers, parents, and educators), the types of penalties providers face, the basis and status of legal challenges, and other key information. The tracker will be updated regularly to reflect the evolving environment. Additionally, a related KFF analysis examines expansion in state actions to limit youth access to gender-affirming care.
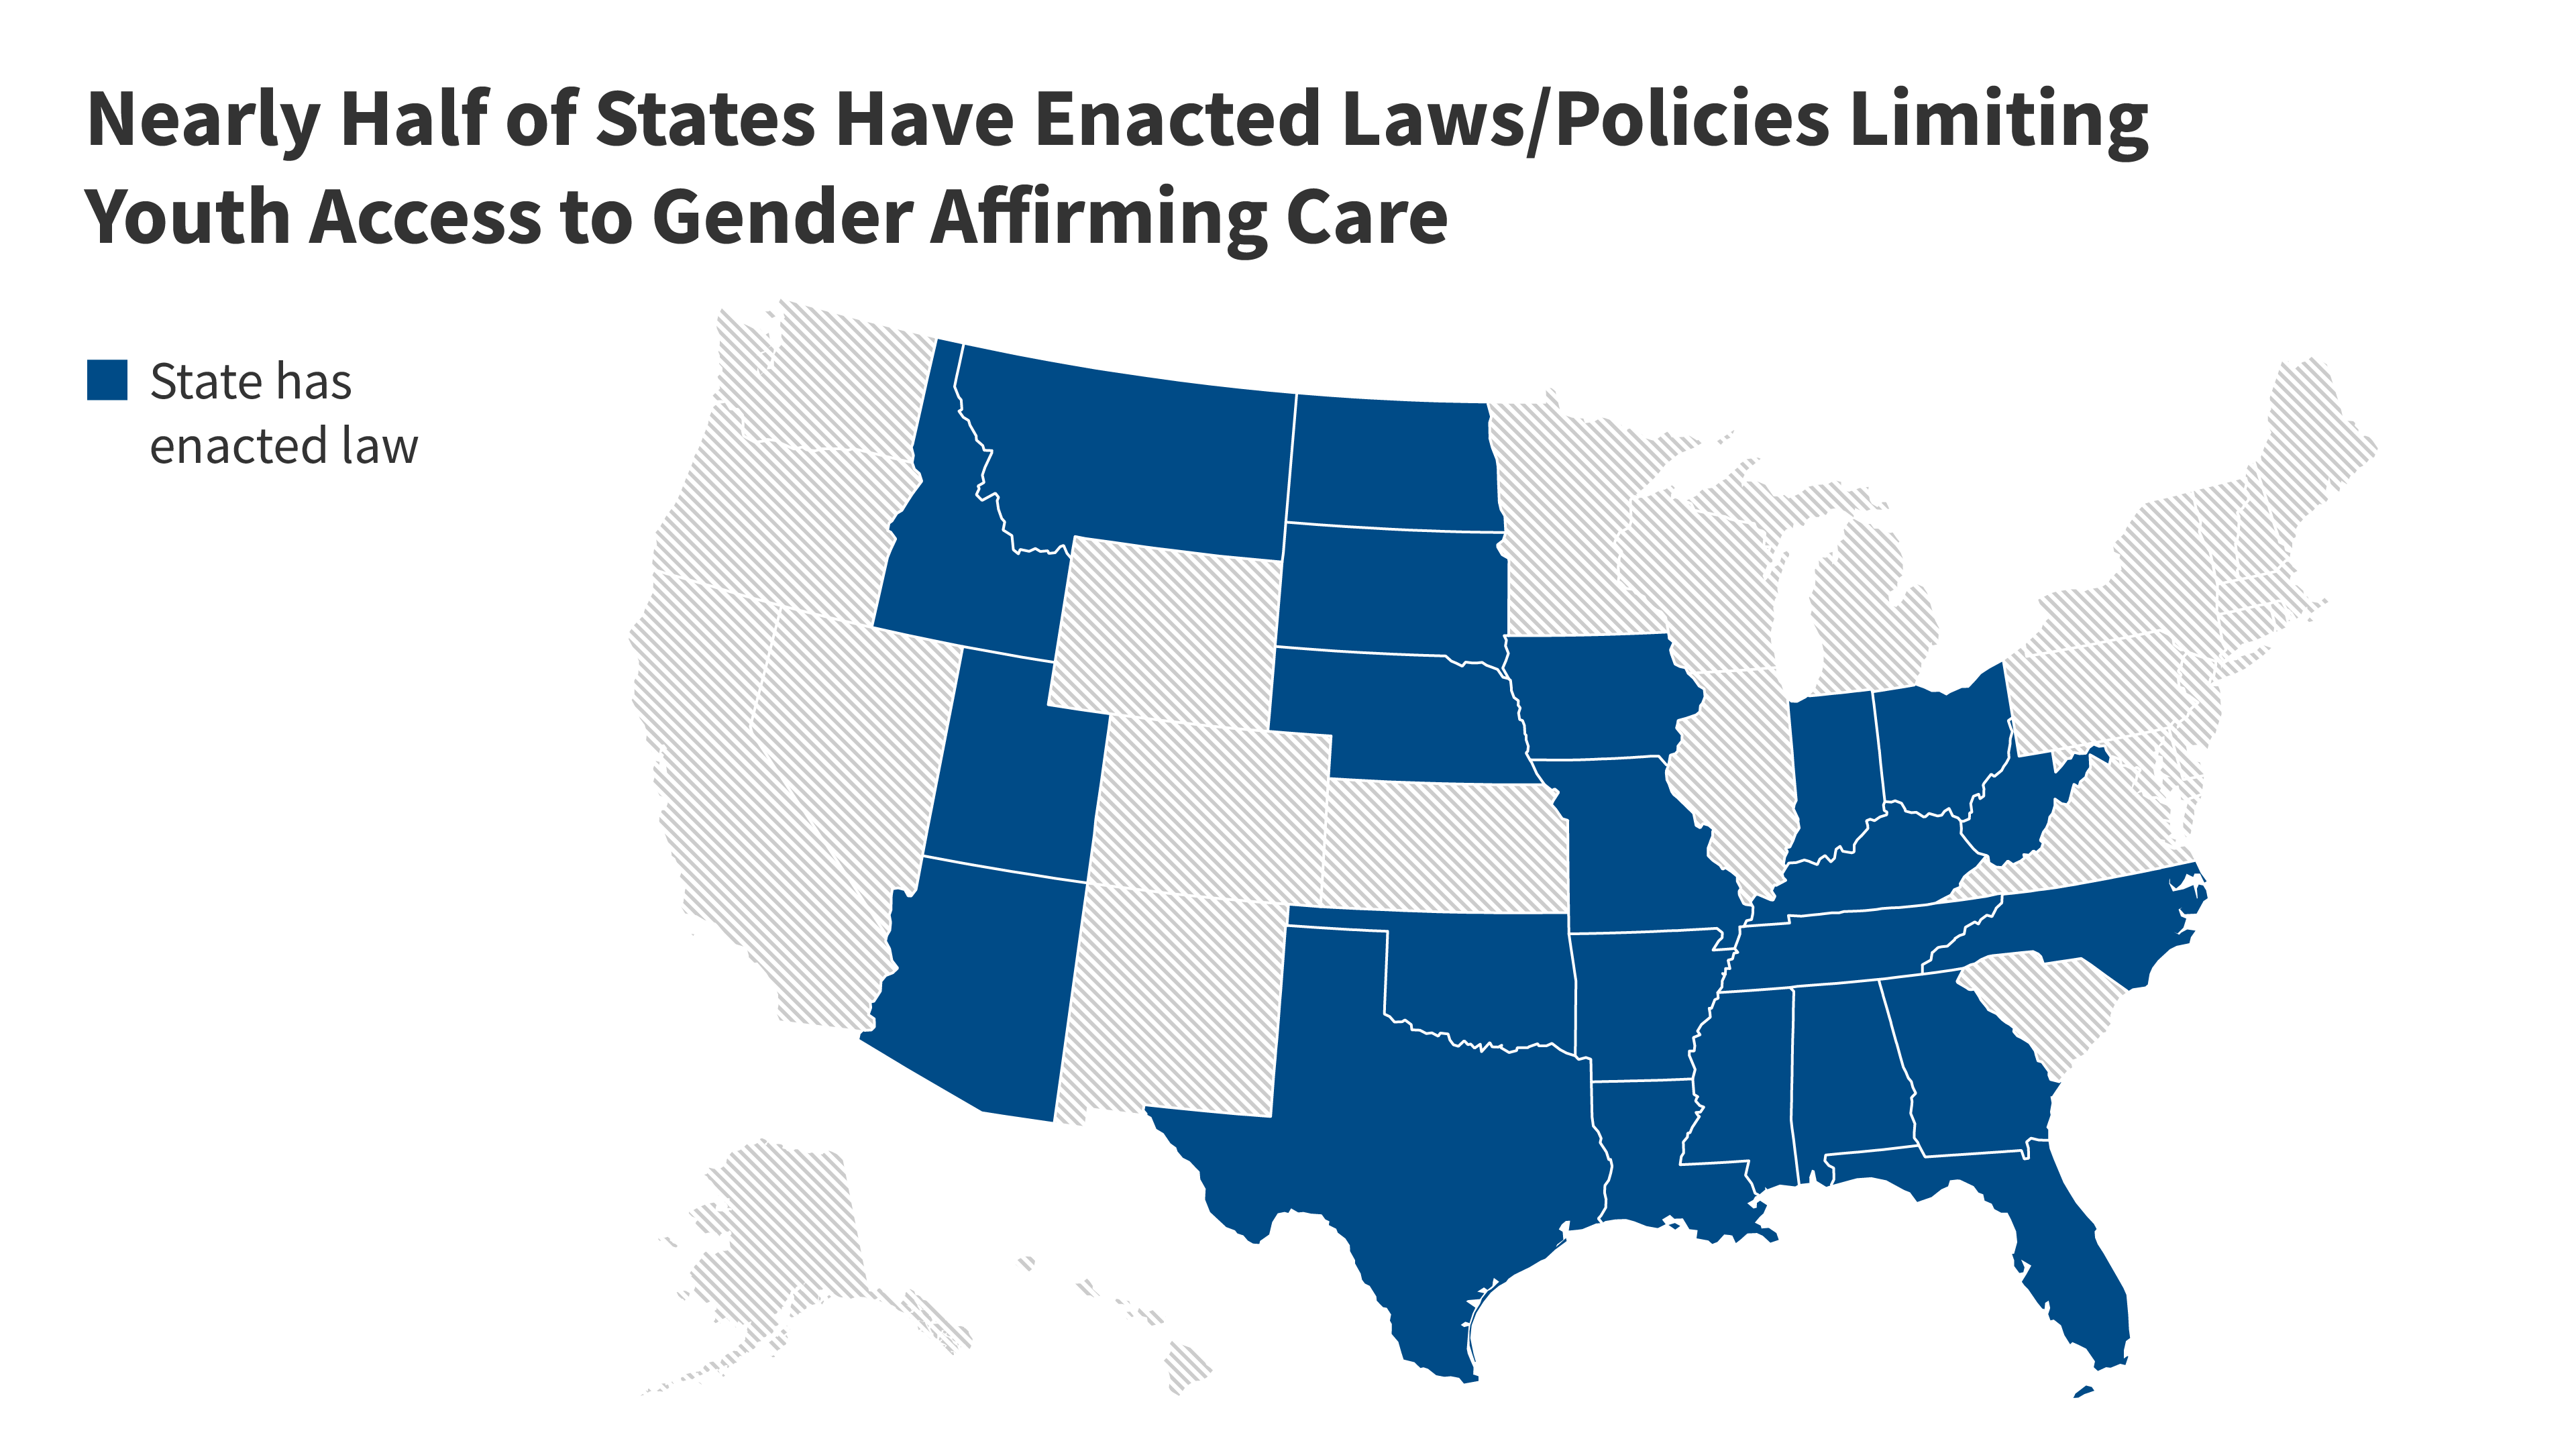
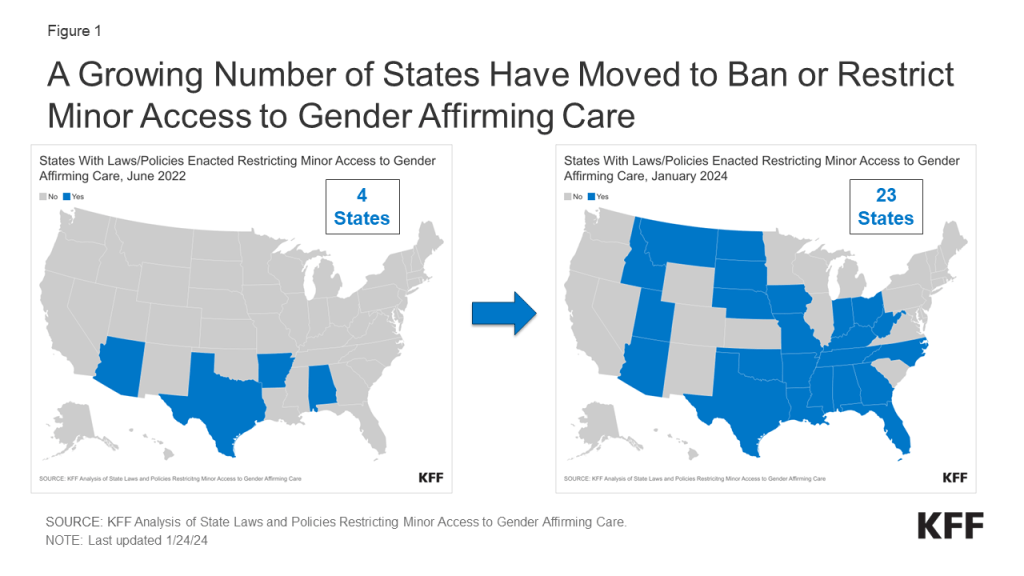
The past few years have seen a rapid increase in the number of states enacting laws and other policies that restrict minors’ access to gender-affirming care. In the last 18 months, the number of states with laws or policies limiting minors’ access to gender affirming care has increased more than five-fold, climbing from just four states in June 2022 to 23 by January 2024.
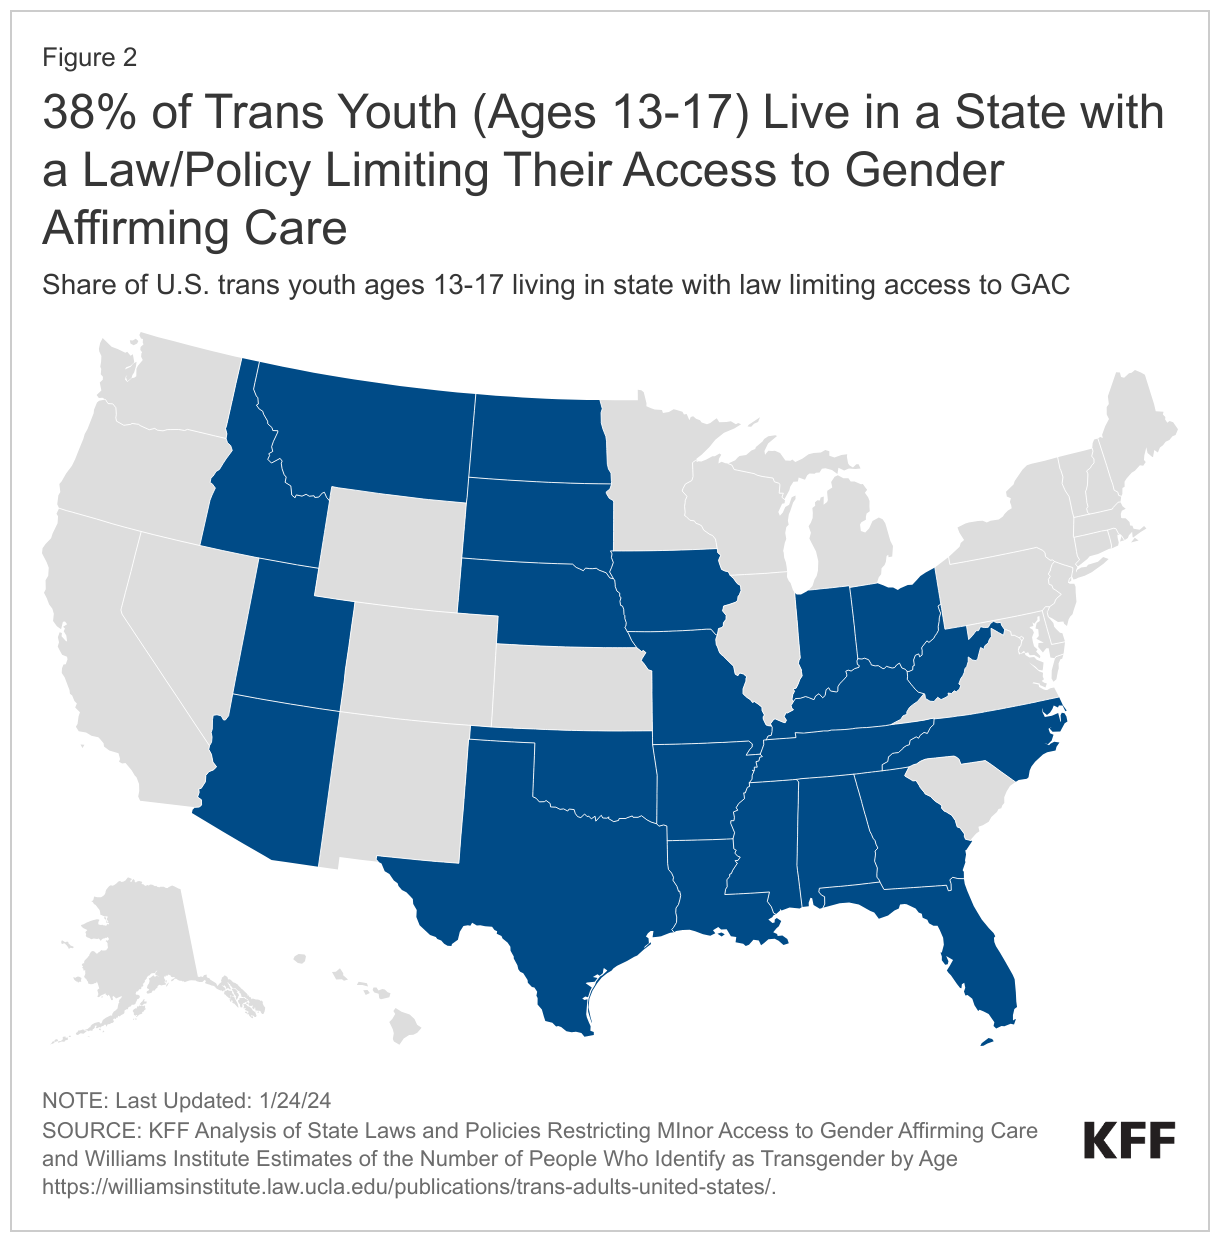
The 23 states with laws and policies limiting youth access to gender affirming care are home to an estimated 38% of young trans people between the ages of 13-17.
In 2021, 12.9 million people received health coverage through both the Medicare and Medicaid programs. For those “dual-eligible individuals,” Medicare is the primary payer and covers medical acute and post-acute care, including skilled nursing facility services and home health care. Medicaid wraps around Medicare coverage by paying Medicare premiums and in most cases, cost sharing. Most dual-eligible individuals (9.5 million people in 2021) are also eligible for Medicaid benefits that are not otherwise covered by Medicare, including long-term services and supports (LTSS), vision, and dental care (referred to here as Medicaid “wraparound services” for dual-eligible individuals).
Dual-eligible individuals tend to have low incomes, high rates of long-term disabilities, and multiple chronic conditions. Without coverage of wraparound services under Medicaid, some dual-eligible individuals might be unable to obtain services such as eye exams, treatment for cavities, help bathing and moving to avoid bedsores; or they may have to make difficult choices between paying out-of-pocket for those types of services and paying for their groceries. But Medicaid coverage of these services varies widely across states, potentially leading to variation in access and use among dual-eligible individuals.
This issue brief describes the share of dual-eligible individuals with full Medicaid benefits who use wraparound services, including institutional LTSS, home- and community-based services (HCBS), vision services, dental care, and non-emergency medical transportation (NEMT); and how use of these services varies by state and select demographic characteristics of enrollees. The analysis includes 7.2 million individuals with at least 10 months of full Medicaid coverage in 2019 Medicaid claims data from T-MSIS (see Methods). The analysis presents data from 2019, which are expected to be more representative of non-pandemic utilization trends than data from 2020, the most recent year of data available when the analysis was conducted. Key takeaways include:
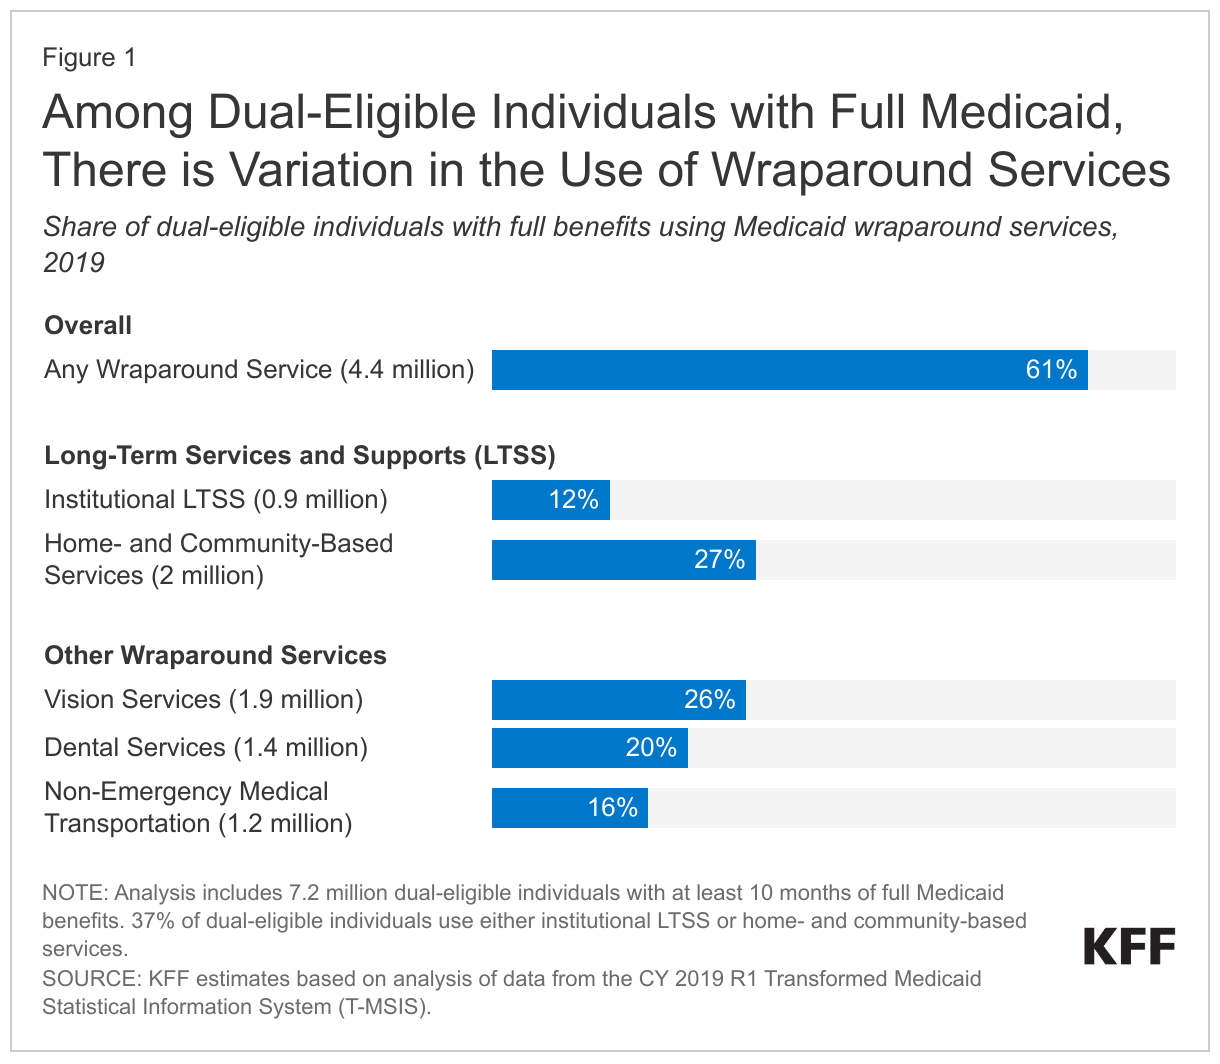
Just over 6 in 10 (61%) of the 7.2 million dual-eligible individuals with at least 10 months of full Medicaid coverage (4.4 million people) use at least one Medicaid wraparound service.
Around one-fourth of full-benefit dual-eligible individuals use home- and community-based services (27%) or vision services (26%), while rates of use are lower for dental care (20%), NEMT (16%), and institutional LTSS (12%). Over one-third of dual-eligible individuals (37%) use some type of LTSS—either institutional care or HCBS.
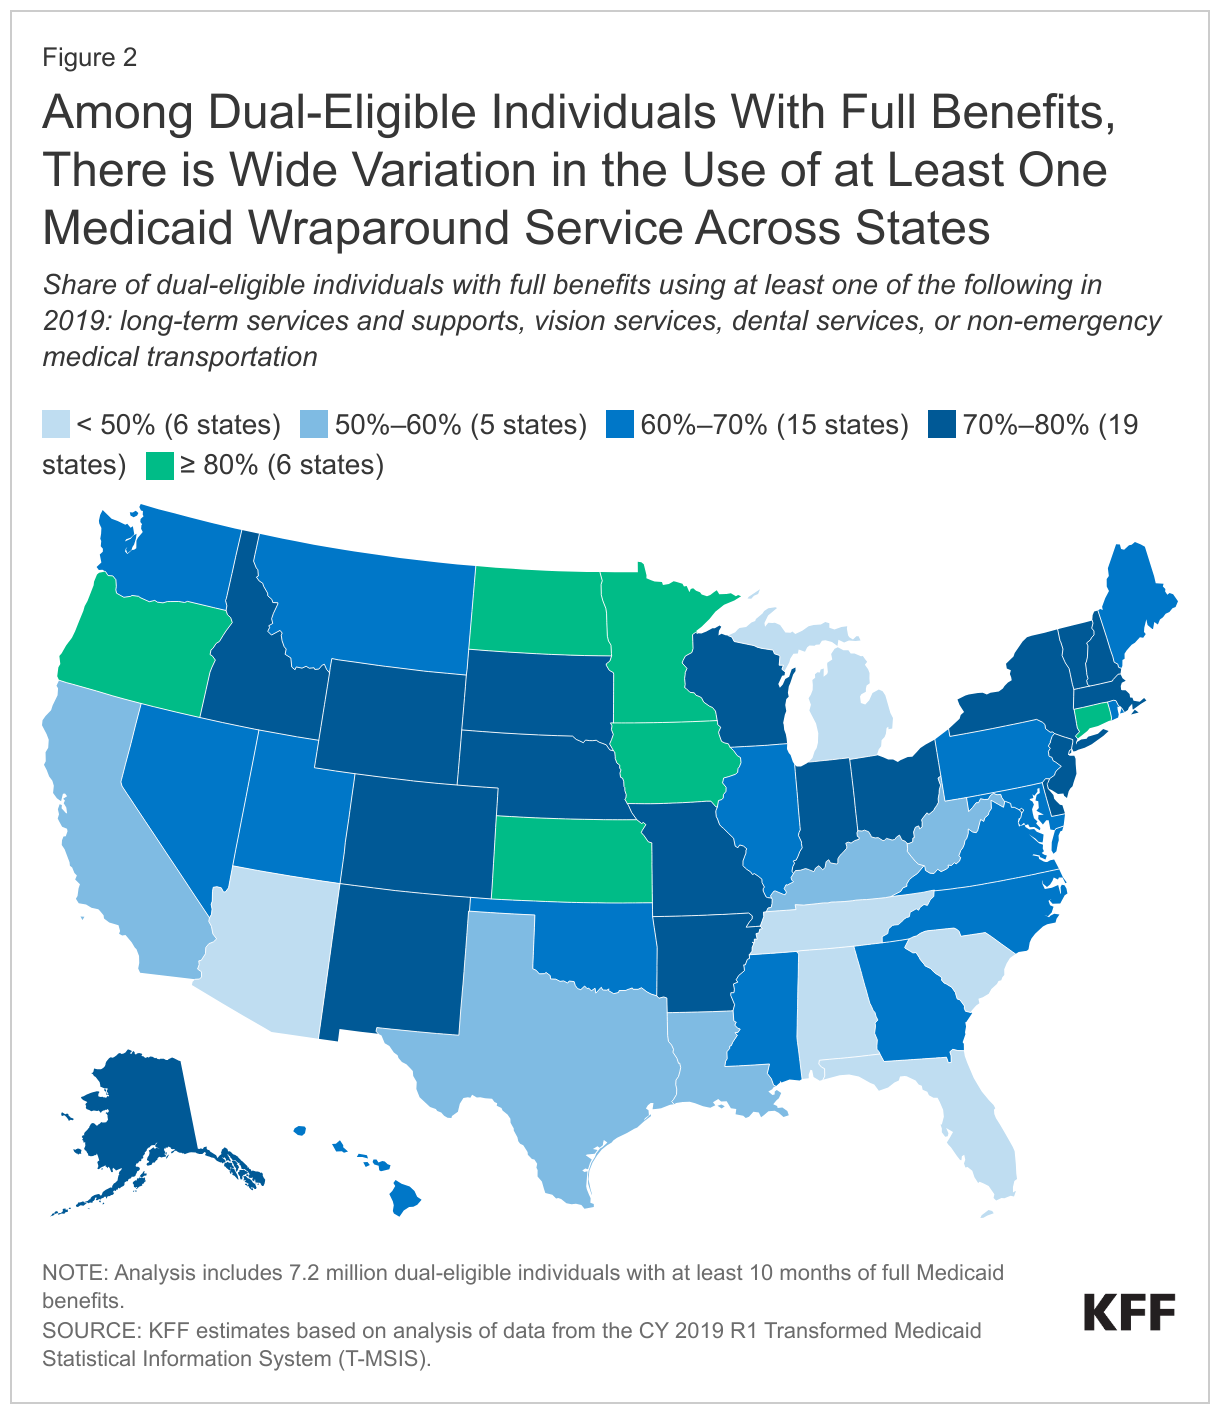
The percentage of full-benefit dual-eligible individuals that use at least one Medicaid wraparound service in 2019 ranges from 32% in Florida to 88% in Minnesota. That variation stems from variation in rates of use for all specific services included in the analysis.
Dual-eligible individuals who are Hispanic use Medicaid wraparound services at lower rates than those who are not Hispanic (50% use one or more wraparound service compared with 61%-65% among other racial and ethnic groups).
Dual-eligible individuals who are ages 65 and older have higher rates of use of institutional LTSS and vision services than those who are younger and qualify for coverage based on a disability (16% vs. 5%, and 28% vs. 24%).
Variation in rates of Medicaid wraparound service use may stem from differences in peoples’ health status, demographic characteristics, states’ coverage of various services, enrollees’ awareness of Medicaid’s benefits, type of Medicare coverage, and other factors that affect people’s need for and access to care.
How many dual-eligible individuals use Medicaid wraparound services and how does the use of services vary across service types?
Among the 7.2 million dual-eligible individuals with at least 10 months of full Medicaid, roughly 61% (4.4 million) of dual-eligible individuals with full Medicaid benefits use at least one Medicaid wraparound service, but rates of use for individual services are lower (Figure 1). The wraparound services in this analysis include services that states are required to cover and services that states may elect to cover. Required services include nursing facility care (which is part of institutional LTSS), home health care (which is part of HCBS), and NEMT. Optional services include dental care, vision care, and all HCBS other than home health. Rates of use by dual-eligible individuals for Medicaid wraparound services by type of service are:
27% for HCBS (2 million dual-eligible individuals),
26% for vision care (1.9 million),
20% for dental care (1.4 million),
16% for NEMT (1.2 million), and
12% for institutional LTSS (0.9 million) (Figure 1).
Rates of use for wraparound services among dual-eligible individuals differ from rates for Medicaid enrollees who are eligible because they have a disability or are ages 65 and older but don’t have Medicare. Such enrollees tend to be younger than dual-eligible individuals because most people ages 65 and older do have Medicare. As a result, they have lower rates of use of institutional LTSS and HCBS, but relatively similar rates of use for other wraparound services (Appendix Figure 1).
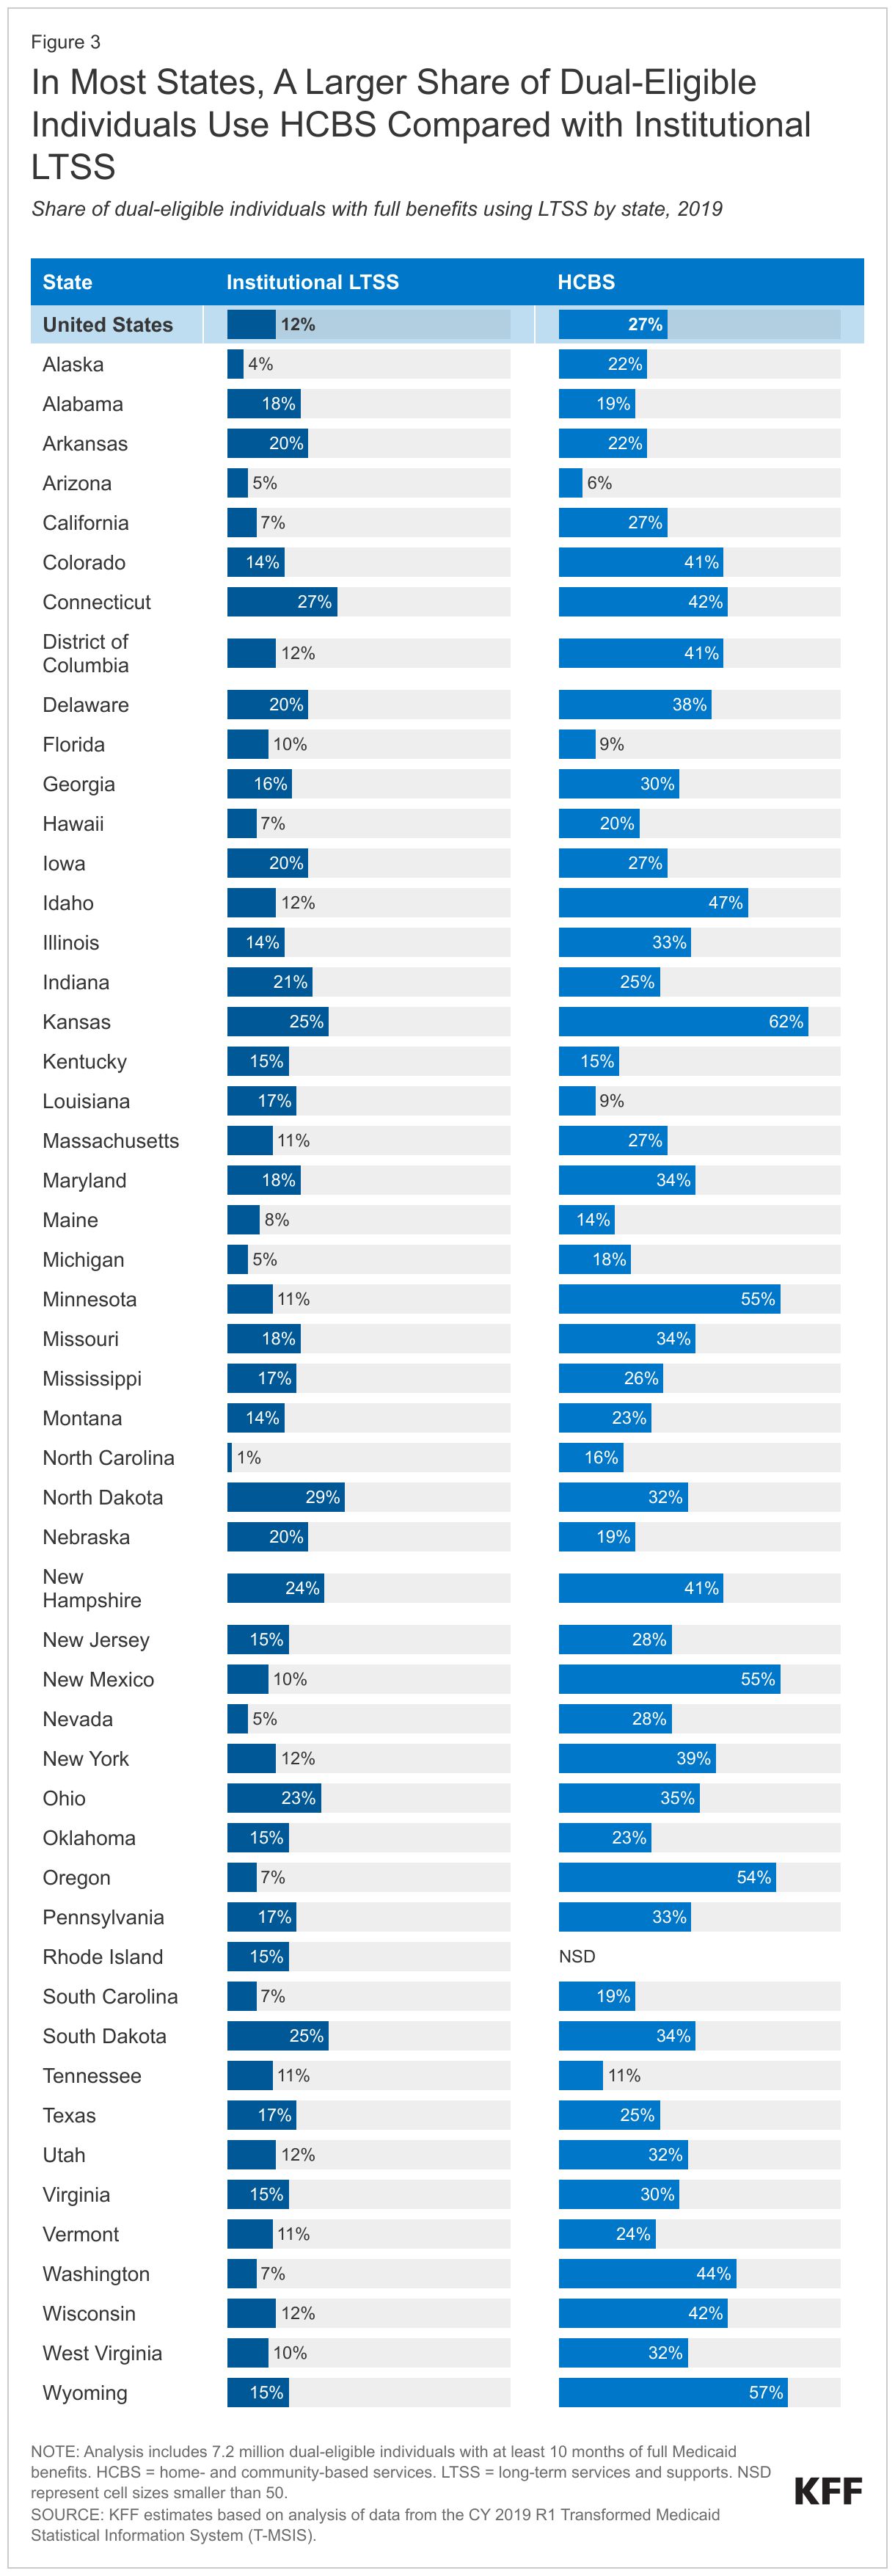
For LTSS wraparound services, a larger share of dual-eligible individuals with full Medicaid benefits use HCBS than institutional LTSS (Figure 1). LTSS are generally provided either in institutional settings, such as a nursing facility or an intermediate care facility for people with intellectual disabilities, or in home- and community-based settings. HCBS include a broad range of benefits, such as access to personal care, adult day care, and senior centers, which are all optional benefits, except for home health care (which is also covered by Medicare). Within Medicaid in 2020, more Medicaid enrollees use HCBS than institutional LTSS and in this analysis, over twice as many dual-eligible individuals use HCBS compared with institutional LTSS (27% compared with 12% respectively). In 2020, dual-eligible individuals who used any Medicaid wraparound LTSS accounted for nearly two-thirds of all people who used Medicaid LTSS that year.
For non-LTSS wraparound services, rates of use were highest for vision care, followed by dental care, and NEMT (Figure 1). For the purposes of this analysis, vision care is defined to exclude services that are covered by traditional Medicare such as treatment for cataracts and glaucoma. Vision care includes eye exams and eyewear (contacts or eyeglasses) and dental care includes oral exams, routine cleanings, and more extensive services such as fillings, extractions, and root canals (see Methods for more details). NEMT provides those in need with assistance getting to and from non-emergency medical appointments and covers a broad range of modes of transportation including taxis, buses, vans, and personal vehicles. Wraparound vision and dental services are generally not covered by traditional Medicare but are often covered by Medicare Advantage plans as supplemental benefits.
How does the use of wraparound services vary across states?
The percentage of full-benefit dual-eligible individuals using at least one Medicaid wraparound service ranges from 32% in Florida to 88% in Minnesota (Figure 2). In Alabama, Arizona, Florida, Michigan, South Carolina, and Tennessee, fewer than half of dual-eligible individuals use any Medicaid wraparound services. Among those states, Alabama and Florida have relatively low rates of use for all specific services. More than 8 in 10 use one or more wraparound services in Connecticut, Iowa, Kansas, Minnesota, North Dakota, and Oregon, with Minnesota having high rates of each of the services except institutional LTSS.
In 45 states, more dual-eligible individuals with full benefits use HCBS than institutional LTSS, but there is wide variation in rates of HCBS use across states (Figure 3). Higher rates of HCBS use stem from initiatives to remove what has been referred to as the “institutional bias” in Medicaid. The percentage of full-benefit dual-eligible individuals who use HCBS ranges from less than 10% in Arizona, Florida, and Louisiana to over 50% in Kansas, Minnesota, New Mexico, Oregon, and Wyoming. However, some of those low rates of HCBS use may reflect states’ difficulty reporting HCBS service use in the Medicaid claims data: For example, a prior KFF analysis noted that HCBS users were likely undercounted in Rhode Island on account of missing HCBS records. States with high rates of HCBS use among dual-eligible individuals also tend to have high rates of HCBS use among other Medicaid enrollees (Appendix Figure 2).
The percentage of dual-eligible individuals who use institutional LTSS ranges from fewer than 5% in Alaska and North Carolina to more than 25% in Connecticut and North Dakota. Beyond states’ coverage policies, the age and health status of dual-eligible individuals is a determinant for LTSS use: KFF analyses find that overall, Medicaid enrollees who use LTSS tend to be older and have long-term health conditions.
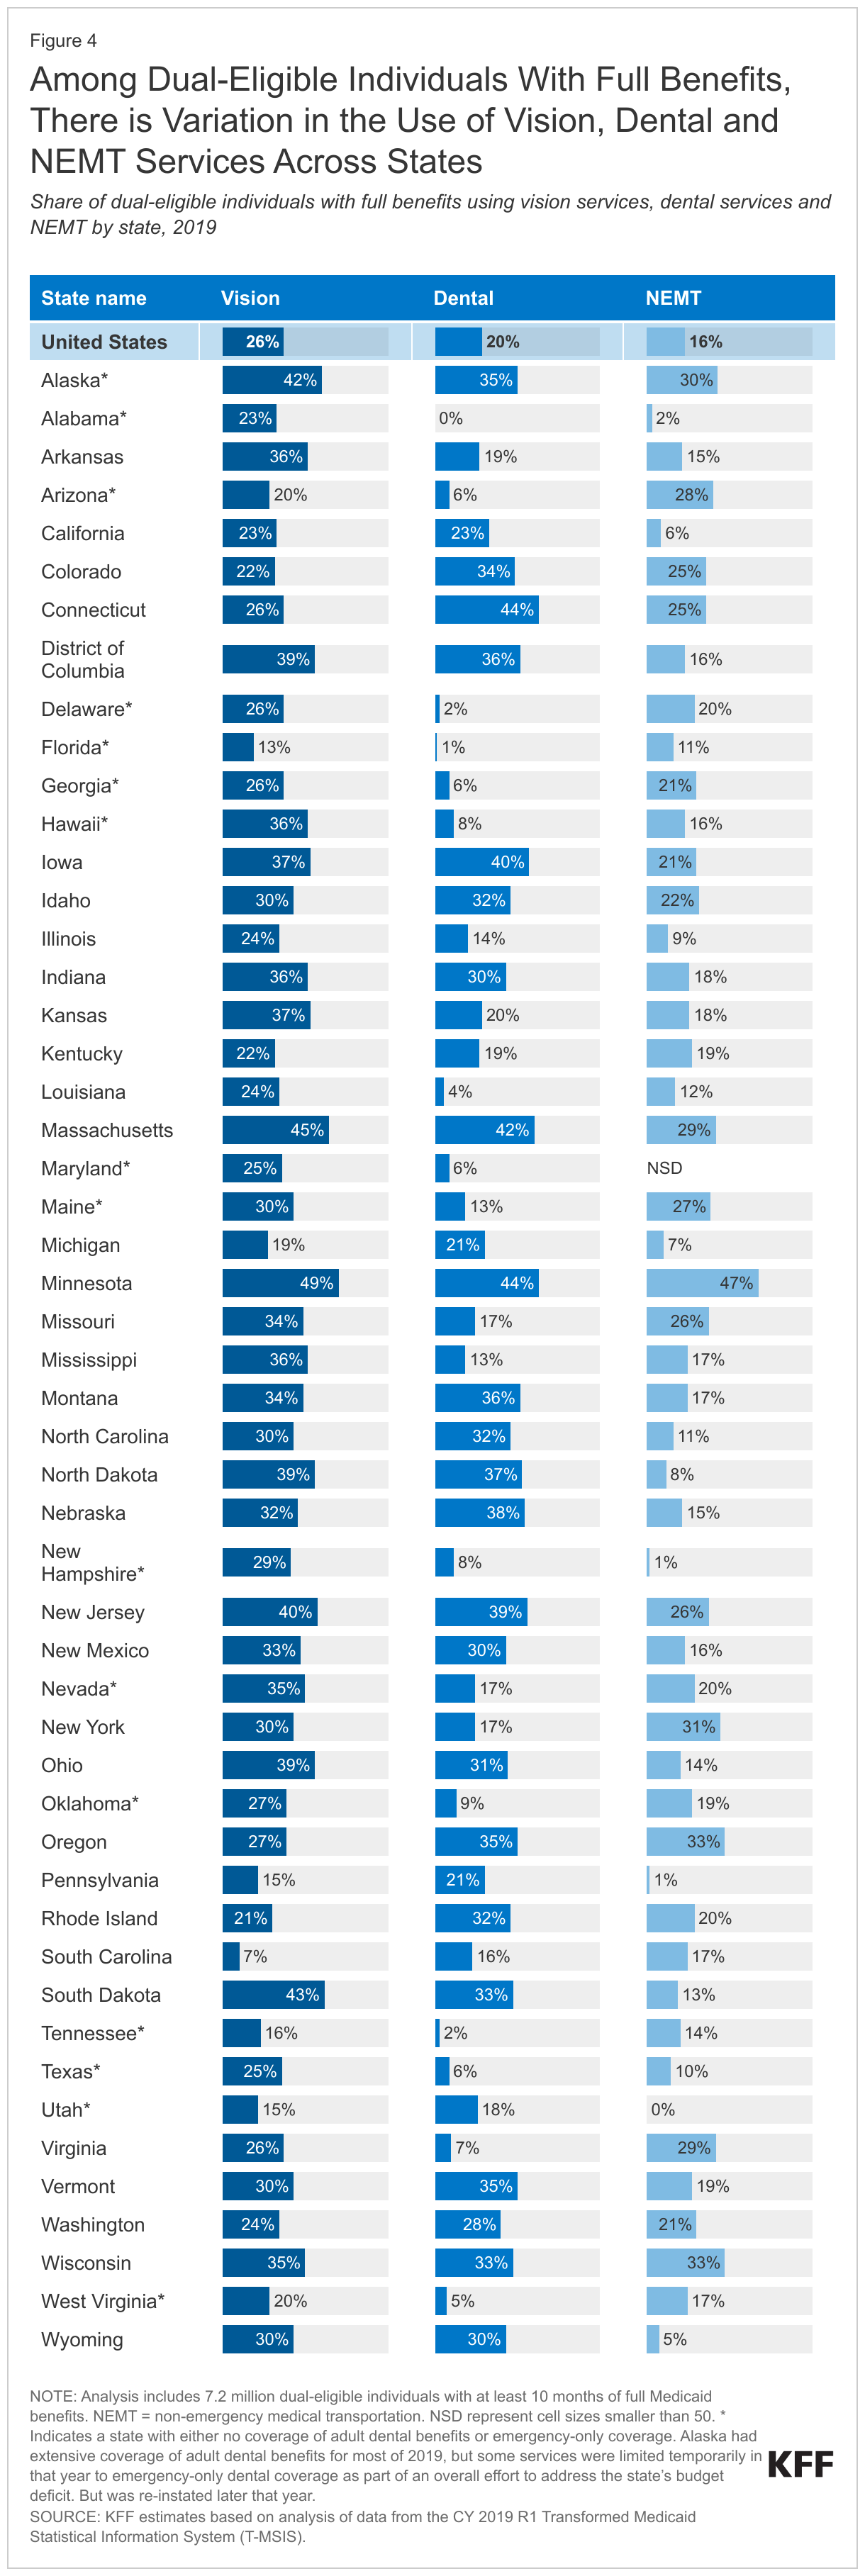
Across states, the percentage of dual-eligible individuals that use the non-LTSS wraparound services, vision, dental, and NEMT, ranges from the low single digits to nearly half (Figure 4). Such variation may stem from Medicaid coverage and administrative policies as states with higher rates of use among dual-eligible individuals also have higher rates of use among other Medicaid enrollees (Appendix Figure 2).
Vision. The percentage of full-benefit dual-eligible individuals who use Medicaid wraparound vision services ranges from 7% in South Carolina to almost 50% in Minnesota, which may reflect, in part, differences in Medicaid coverage of vision services.
Dental. The percentage of dual-eligible individuals who used Medicaid wraparound dental services ranges from 1% or fewer in Florida and Alabama to 44% in Connecticut and Minnesota, also reflecting, in part, differences in coverage of adult dental benefits. Among the 14 states with fewer than 10% of dual-eligible individuals using dental services, all but one state had either no coverage of adult dental benefits or emergency-only coverage.
Non-Emergency Medical Transportation. The percentage of full-benefit dual-eligible individuals who use NEMT ranges from 1% or fewer of dual-eligible individuals in Utah, New Hampshire, and Pennsylvania to 47% in Minnesota. Other studies have found that there is significant variation in NEMT access across states, but also significant variation in states’ reporting of NEMT use.
Variation across states in the use of wraparound services reflects a host of factors including factors that are common across all Medicaid enrollees regardless of whether they have Medicare, but also including factors that are unique to dual-eligible individuals. States that have higher percentages of dual-eligible individuals using wraparound services often have higher use rates among Medicaid-only enrollees who are eligible because they have a disability or are ages 65 and older (Appendix Figure 2). Similarities in the variation of use rates between dual-eligible individuals and Medicaid-only enrollees highlight the role of Medicaid-specific factors in determining how readily people access wraparound services. Some of the factors that are common across all Medicaid enrollees regardless of whether they have Medicare include:
States’ coverage of each wraparound service,
States’ administrative policies that make it easier or harder for people to access the services,
The number of providers of each service and their appointment availability (which reflects states’ payment rates among other factors), and
The extent to which records of services are completely and properly reported in the data.
Other factors affect rates of service use that are unique to dual-eligible individuals including:
People’s need for services such as LTSS, dental and vision services (which reflects the characteristics of states’ dual-eligible individuals),
Dual-eligible individuals’ awareness of Medicaid wraparound service availability and coverage, and
Dual-eligible individuals’ access to wraparound services in programs other than Medicaid (such as Medicare Advantage plans).
How does the use of wraparound services vary across dual-eligible individuals with different demographic characteristics?
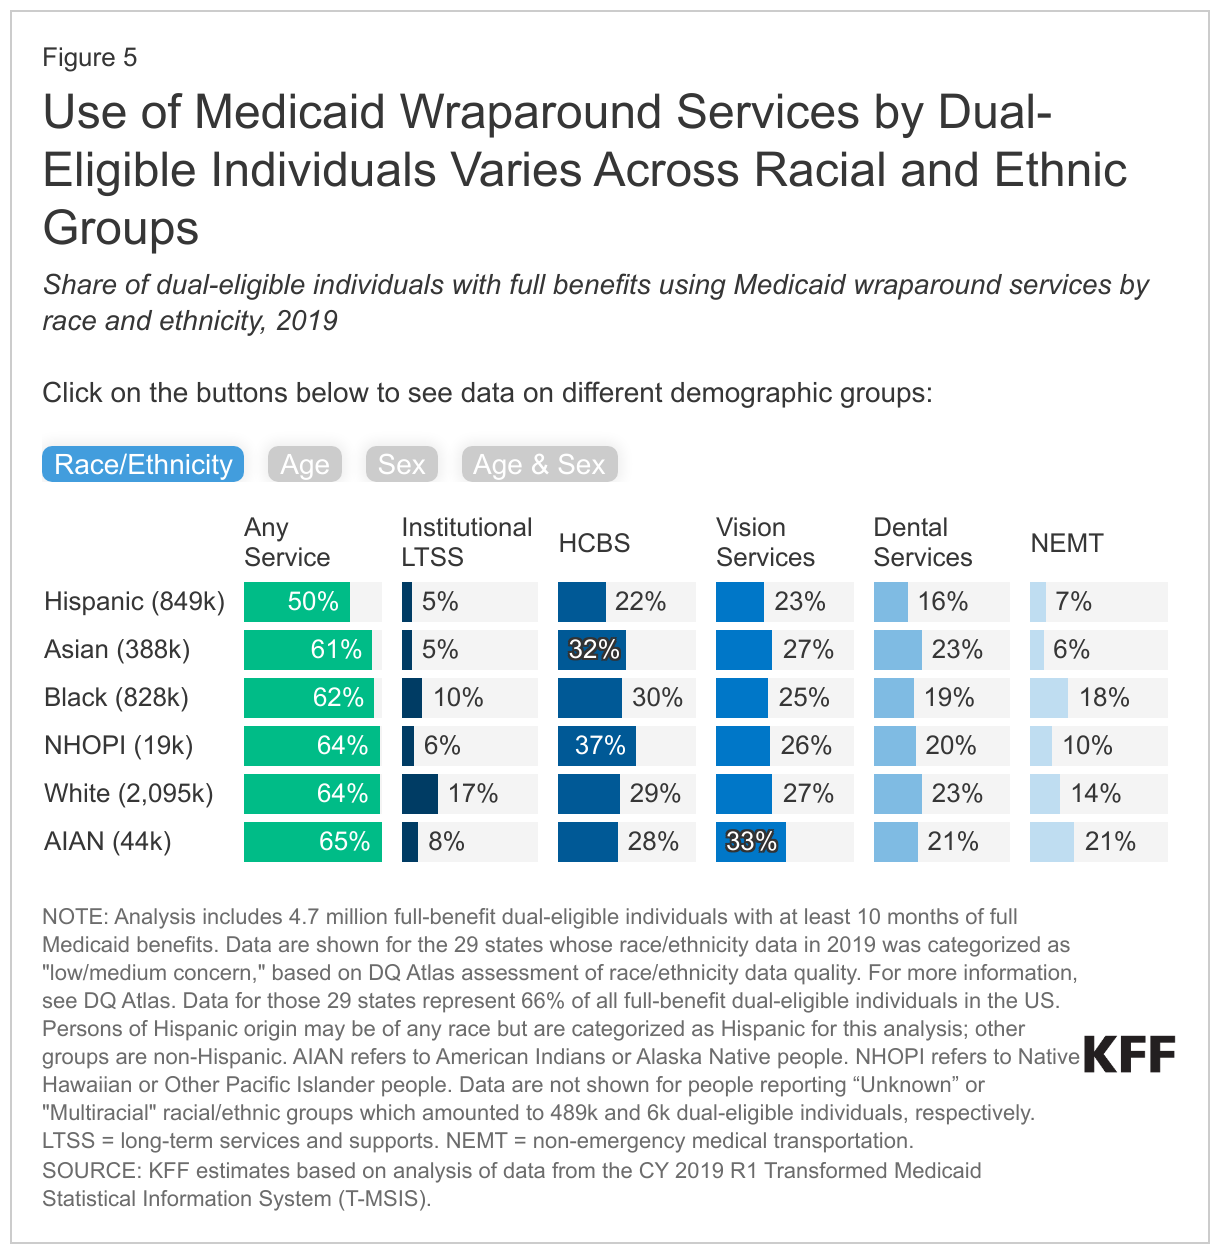
Full-benefit dual-eligible individuals who are Hispanic use Medicaid wraparound services at lower rates than other racial and ethnic groups (Figure 5, Race/Ethnicity tab). Only half of dual-eligible individuals who are Hispanic access one or more wraparound services whereas over 60% of all other groups do. The overall disparity reflects differences in use rates for all specific service types, which are below 10% for institutional LTSS and NEMT, 16% for dental care, and below 25% for HCBS and vision services. Dual-eligible individuals who are Asian also have low use rates for institutional LTSS (5%) and NEMT (6%), but 23% use dental services, 27% use vision services, and nearly one-third use HCBS. The highest rates of service use are among dual eligible individuals who are American Indian or Alaskan Native (65% overall which reflects high rates of vision service use), White (64% overall which reflects high rates of institutional LTSS use), and Native Hawaiian or Other Pacific Islander (64% which reflects high rates of HCBS use). (These rates are among the 29 states that reported “low/medium concern” with the quality of their race and ethnicity data in 2019; these 29 states account for 66% of the dual-eligible population; see Methods for additional details).
Dual-eligible individuals ages 65 and older use institutional LTSS at a rate that is over three times higher than the rate for those under age 65 (16% compared with 5%), but they use dental services at a lower rate (Figure 5, Age tab). The percentage of dual-eligible individuals who use one or more wraparound services is 63% for those ages 65 and older and 59% for those under age 65. Differences in use rates are small for HCBS, vision services, and NEMT, but larger for dental services: 24% of those under age 65 use dental services compared with 17% of those ages 65 and older.
Among all dual-eligible individuals with full Medicaid, females use wraparound services at higher rates than males, but among those under age 65, rates of LTSS use are slightly higher for males (Figure 5, Sex and Age & Sex tabs). When age is not accounted for, males and females use individual services at similar rates, but a higher percentage of females use one or more service (64% compared with 58%). When males and females are grouped by age, males under age 65 have slightly higher rates of LTSS use (both institutional and HCBS), but lower rates of use for other services and lower rates of use overall.
What are the policy implications of variation in use of Medicaid wraparound services?
Medicaid provides wraparound services such as long-term services and supports, vision and dental care, and non-emergency medical transportation for dual-eligible individuals who tend to have low incomes, high rates of long-term disabilities, and chronic conditions. Among the 7.2 million dual-eligible individuals with at least 10 months of full Medicaid, 61% (4.4 million people) use at least one Medicaid wraparound service; however, use varies considerably by type of service and across states. The variation across states may be due to a number of factors, including differences in peoples’ health status, demographic characteristics, states’ coverage of various services, enrollees’ awareness of Medicaid’s benefits, and type of Medicare coverage among dual-eligible beneficiaries.
What do rates of wraparound service use suggest regarding the health and wellbeing of dual-eligible individuals and potential disparities among various groups? Dual-eligible individuals who are Hispanic have lower rates of use for all wraparound services as do people living in certain states, but it is unknown whether those lower rates reflect limited access to care, difficulty in navigating care and benefits across the two programs, or lower levels of need between different groups. For most services, the variation across states in rates of use is similar among dual-eligible individuals and Medicaid enrollees without Medicare who are eligible because of their age or disability. Those similarities suggest that specific features of state Medicaid programs—such as coverage levels, the availability of providers that take Medicaid, and the ease of accessing Medicaid services—may play some role in determining what share of dual-eligible individuals access wraparound services within a given state.
What are the implications of variation in the use of Medicaid wraparound services across states for dual-eligible individuals who are enrolled in traditional Medicare? According to a separate KFF analysis, 55% of dual-eligible individuals with full Medicaid benefits were in traditional Medicare in 2020, and the remaining 45% were in Medicare Advantage plans. For full-benefit dual-eligible individuals in traditional Medicare, Medicaid would provide the wraparound services included in this analysis. Dual-eligible individuals in traditional Medicare may have less access to these services if they live in states that do not offer these benefits or where Medicaid coverage of wraparound benefits is more limited than in other states with more generous benefits.
What are the implications of the availability of Medicaid wraparound services for dual-eligible individuals in Medicare Advantage plans? According to a separate KFF analysis, Medicare Advantage plans offer some of the wraparound services analyzed here, such as dental and vision, but typically not LTSS. Potential overlap between Medicare Advantage supplemental benefits and Medicaid wraparound services has prompted concerns among advocates and policymakers that enrollees in these plans may not be getting the full complement of wraparound benefits if benefits are not well coordinated between Medicare Advantage plans and Medicaid. Further, there is some concern that Medicare Advantage plans may be marketing these supplemental benefits to attract dual-eligible individuals, even though these beneficiaries may already have access to these benefits covered under their state Medicaid program. (Note that this analysis is not able to analyze how use of Medicaid wraparound services by dual-eligible individuals differs for people with traditional Medicare or Medicare Advantage.)
What does variation in Medicaid coverage across states suggest for ongoing policy proposals to create new Medicare dental, vision, or HCBS benefits? In recent years, policymakers have proposed adding new benefits to the Medicare benefit package including:
HCBS in the Choose Home Care Act of 2021 (R. 5514 and S.2562), and Expanding Care in the Home Act (H.R. 2853)
Dental and vision care in the Medicare and Medicaid, Dental, Vision and Hearing Benefit Act of 2023 (S.842 and H.R.33) and the Medicare Dental Benefit Act of 2023 (H.R. 4146).
New Medicare benefits could increase access to these services for Medicare beneficiaries overall, but the effects on dual-eligible individuals would depend on the generosity of coverage in their state’s Medicaid program and whether states reduced their coverage of wraparound services in response to Medicare benefit changes.
This work was supported in part by Arnold Ventures. KFF maintains full editorial control over all of its policy analysis, polling, and journalism activities.
Methods
Data: Monthly enrollment and eligibility information come from the 2019 T-MSIS Research Identifiable Demographic-Eligibility Files and service use come from the 2019 T-MSIS other services (OT) and long-term (LT) claims files. Data from the 50 states and DC are included in this analysis. The District of Columbia is considered a state for the purposes of this report, but the U.S. territories are excluded on account of differences in the way Medicaid operates in the territories.
Definition of Full-Benefit Dual-Eligible Individuals: Full-benefit dual-eligible individuals include anyone with one or more months of Medicare coverage defined as DUAL_ELGBL_CD_LTST values of 01, 02, 03, 04, 05, 06, 08; and 10 or more months of full Medicaid defined as RSTRCTD_BNFTS_CD_LTST values of 1,A,D,4,5,7.
Definition of Medicaid Enrollees Without Medicaid coverage: Full benefit Medicaid enrollees include anyone with 10 or more months of full Medicaid defined as RSTRCTD_BNFTS_CD values of 1,A,D,4,5,7; and eligibility for Medicaid based on age 65 or over, blindness, or disability , which includes ELGBLTY_GRP_CD_LTST values of 11, 12, 13, 15-26, 37-60 or if age is greater than 64.
Medicaid enrollees are categorized as follows:
Under age 65 or ages 65 and older using the Age variable in years;
Male or female using the SEX_CD variable; and
Into race and ethnicity groups using the RACE_ETHNCTY_CD from the 29 states that reported “low/medium concern” data quality levels with their race and ethnicity data in 2019. For more information, see DQ Atlas. Data for those 29 states represent 66% of all full-benefit dual-eligible individuals in the US. The 29 states include: AK, CA, DE, FL, GA, ID, IL, IN, KY, ME, MI, MN, MS, NC, ND, NE, NH, NJ, NM, NV, OH, OK, PA, SD, TX, VA, VT, WA, WI. Persons of Hispanic origin may be of any race but are categorized as Hispanic for this analysis; other groups are non-Hispanic. Data are not shown for people reporting “Unknown” or “Multiracial” racial/ethnic groups which amounted to 489k and 6k dual-eligible individuals, respectively.
Use of LTSS: Medicaid enrollees who use LTSS are identified using the methods described in the issue brief “How Many People Use Medicaid Long-Term Services and Supports and How Much Does Medicaid Spend on Those People?” Methods box.
Use of other wraparound services: Medicaid enrollees who use each service include anyone with one or more fee-for-service claim or managed care encounter for each service type. The specific codes used include the following.
NEMT services were identified as records with HCPC codes A0080, A0090, A0100, A0110, A0120, A0130, A0140, A0160, A0170, A0180, A0190, A0200, A0210, S0209, S0215, T2001, T2002, T2003, T2004, T2005, T2007, Z2713, W7274, W7275, W7276, M0372, M0419, M0373, M0374, M0418, M0420 as described in MACPAC Mandated Report on Non-emergency Medical Transportation.
Vision services include eye exams with CPT/HCPC codes 92002, 92004, 92012, 92014 provided by any provider type and evaluation and management codes 99201, 99202, 99203, 99204, 99205, 99212, 99213, 99214, 99215, 99241, 99242, 99243, 99244, 99245, 99341, 99342, 99343, 99344, 99345, 99347, 99348, 99349, 99350 if the procedure provided by an ophthalmologist, optometrist and optician using provider type codes 41, 18, 96 or related provider taxonomy codes; eye glasses with procedure codes V2020, V2025, V2100, V2101, V2102, V2103, V2104, V2105, V2106, V2107, V2108, V2109, V2110, V2111, V2112, V2113, V2114, V2115, V2118, V2121, V2199, V2200, V2201, V2202, V2203, V2204, V2205, V2206, V2207, V2208, V2209, V2210, V2211, V2212, V2213, V2214, V2215, V2218, V2219, V2220, V2221, V2299, V2300, V2301, V2302, V2303, V2304, V2305, V2306, V2307, V2410, V2430, V2499; contact lenses with CPT/procedure codes 92310, 92325, 92326, 92071, 92072, V2510, V2511, V2512, V2513, V2520, V2521, V2522, V2523, V2531, V2599; and low vision aids with procedure codes V2600, V2610, V2615, Z460.
This methodology uses the CDC’s Vision and Eye Health Surveillance System classifications for Eye exams and/or glasses/contacts. Any treatment, imaging, diagnostic, or screening services were excluded to avoid overlap with Medicare covered services.
Dental services include any claims with a dental-related procedure code (D0100-D9999) including diagnostic, preventive, restorative, endodontics, periodontics, implant services and prosthodontics, oral and maxillofacial surgery, orthodontics and adjustive general service as described by the American Dental Association.
The analysis presents data from 2019 data, which are expected to be more representative of non-pandemic utilization trends than data from 2020, the most recent year of data available when the analysis was conducted. Use of many health care and wraparound services declined during the pandemic as outpatient and elective services were cancelled, delayed, or avoided among all people. Deferrals and avoidance of care also affected the use of Medicaid wraparound services (Appendix Figure 3).
The most significant limitations of this analysis stem from the fact that the data do not account for the use of Medicare services or type of enrollment in Medicare. Specifically, the analysis does not distinguish between dual-eligible individuals based on whether they were enrolled in different types of Medicare Advantage (MA) plans, which usually cover supplemental benefits. The analysis is also unable to identify whether dual-eligible individuals are using Medicare-covered services, which in some cases may overlap with Medicaid supplemental benefits.
This analysis does not examine if rates of use for wraparound services are associated with different rates of need (medical condition or functional status) or different rates of access to services. This analysis includes the share of dual-eligible individuals who use a particular wraparound service among all dual-eligible individuals, but among those who do not use the services, it is unknown whether the lack of use reflects lack of need or lack of access.
Just as LGBTQ identity is increasing in the U.S. and national support for same-sex marriage is holding at an all-time high, states are enacting a range of new laws and policies aimed at limiting LGBTQ people’s access to social institutions in domains such as school and health care. Transgender people’s rights, in particular, have become a divisive partisan issue that is already playing a role in discourse and debate in the 2024 election.
Gender Affirming Care (GAC)
Gender affirming care is a model of care which includes a spectrum of “medical, surgical, mental health, and non-medical services for transgender and nonbinary people” aimed at affirming and supporting an individual’s gender identity. Gender affirmation is highly individualized. Not all trans people seek the same types of gender affirming care or services and some people choose not to use medical services as a part of their transition.
One area that has received considerable attention is young people’s access to gender affirming care. Gender affirming care services are widely considered medically necessary best practices for those that need them, including for youth. Virtually all major U.S. medical associations support youth access to gender affirming care, including the American Medical Association, American Academy of Pediatrics, and the American Psychological Association, among others. In particular, these groups point to the evidence demonstrating that medically necessary gender affirming care enhances mental health outcomes for transgender youth, including by reducing suicidal ideation. Professional guidance for gender affirming care, including for young people, is provided by the Endocrine Society and the World Professional Association for Transgender Health, bodies that also support access to this treatment model. Despite the evidence around the role gender affirming care can play in promoting well-being and support from the medical community, those seeking to enact state restrictions to this care contend that such policies are necessary to “protect children” and that the potential medical risks linked to gender-affirming care outweigh any benefits. Notably, not all trans people choose to incorporate the medical services these policies prohibit as part of their transition and instead focus on social transition. Further, while the number of young trans people using puberty blockers or hormone therapy has increased modestly in recent years, overall number of those using these prescriptions remains fairly low and multiplestudies have shown gender affirming surgery is rare among youth.
Over the past 18 months, there has been a rapid increase in the number of states that have enacted laws and other policies that prohibit or restrict minor access to gender affirming care. Our new tracker, provides a regularly updated overview of state policy developments aimed at restricting minor access to gender affirming care as well as the litigation challenging it. This policy watch summarizes findings as of January 30, 2024.
Current Status
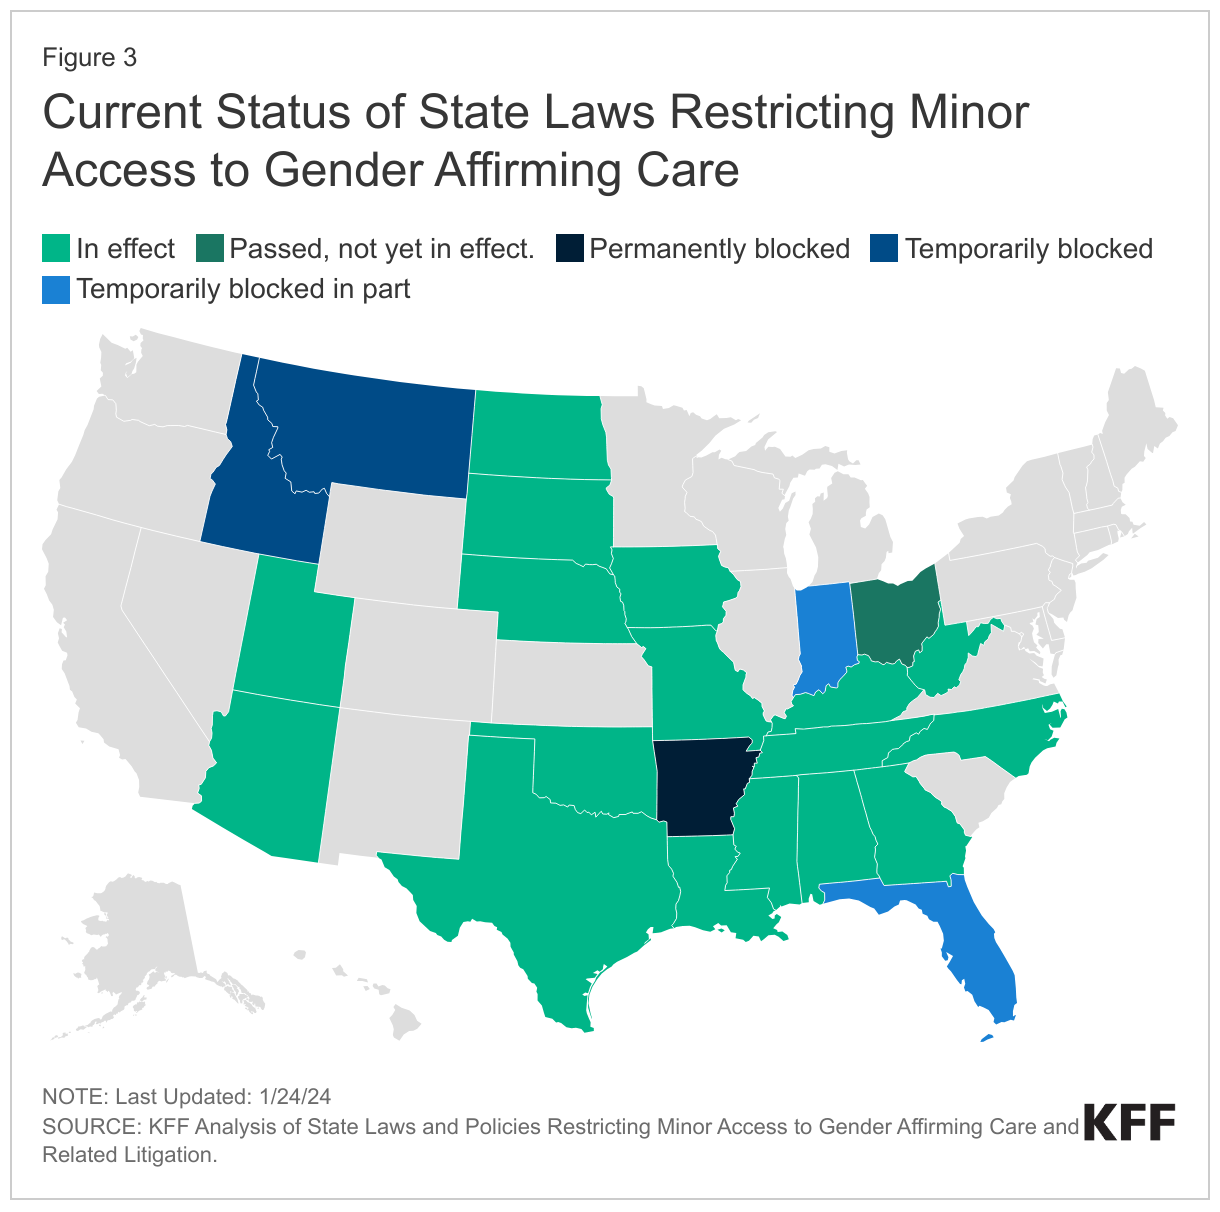
In less than two years, the number of states with laws or policies limiting minor access to gender affirming care has increased more than five-fold, climbing from just four states in June 2022 (AL, AR, TX, AZ) to 23 states by January 2024 (AL, AR, AZ, FL, GA, IA, ID, IN, KY, LA, MO, MS, MT, NC, ND, NE, OH, OK, SD, TN, TX, UT, WV).
Figure 1: A Growing Number of States Have Moved to Ban or Restrict Minor Access to Gender Affirming Care
As the number of states enacting such policies increases so do the number of trans youth potentially impacted. The 23 states with laws and/or policies limiting youth access to gender affirming care are home to an estimated 38% of young trans people between the ages of 13-17.
Of the 23 states with laws/policies restricting youth access to gender affirming care: 17 are currently in effect in full. Four are temporarily blocked in full or in part and one is permanently blocked in court, though an appeal is pending. The law in Ohio does not go into effect until April 2024. (See Litigation section for additional discussion of legal activity in this area.)
While all of the laws/policies examined seek to limit or prohibit access to key gender affirming care services for young people, they range in their complexity. Some are comparatively limited (e.g. banning only surgical care, which is rare among youth), while others are more far reaching in terms of their scope of prohibitions, penalties, and individuals impacted.
Other Groups Impacted By State Laws/Policies
Although these laws/policies primarily center on restricting minor access to gender-affirming care, many also include provisions impacting other groups that are found to provide or otherwise support such youth access, as follows:
Medical Providers
Nearly all states (21 of the 23) include specific provisions with penalties for providers (exceptions are AZ and WV).
20 states include either professional or civil penalties (AR, FL, GA, IA, ID, IN, KY, LA, MO, MS, MT, NC, ND, NE, OH, OK, SD, TN, TX, UT). Professional penalties may include a loss of a medical license or referral to medical licensing boards for further action.
5 states (AL, FL, ID, ND, OK) include felony penalties for providers.
8 states (AR, FL, IA, IN, MS, MT, OH, UT) include provisions prohibiting providers from offering minors referrals for or otherwise “aiding and abetting” access to gender affirming care.
Parents
4 states (FL, MS, OH, TX) include provisions directed at parents or guardians. For example, Florida’s law, which affects parents most directly, modifies state custody laws to permit the state to take physical custody (or modify another state’s custody determination) of the child, if a child present in the state is “at risk of or is being subject to” gender affirming care. A Texas directive defines certain gender affirming services as child abuse calling for investigation of and penalties for parents supporting access to care, which could include the removal of their children.
Teachers, counselors, and other officials
4 States (AL, MS, MT, TX) include laws/policies that impact school officials such as teachers and counselors, among others. The Alabama law prohibits nurses, counselors, teachers, principals, and other administrative school officials from “encouraging” or “coercing” minors from withholding that their gender identity is different from their sex assigned at birth from their parent/guardian. Because the Mississippi law prohibits “aiding and abetting” youth access to gender affirming care by any person, teachers and other school officials could be implicated. Montana prohibits any state official, such as a school counselor, from providing or “promoting” gender affirming care. As mentioned above, Texas’s definition of certain gender affirming services as child abuse implicates a range of professionals such as teachers who are mandated reporters.
Transgender Adults
In addition to prohibiting minor access to gender affirming care, 7 states (AL, AR, FL, MO, MS, NC, NE) limit adult access in some way. These include provisions that would, for example, allow private health plans, Medicaid, and/or correctional facilities to exclude all gender affirming care coverage and/or prohibit them from providing such services; prohibit the use of federal funds for gender affirming care; require informed consent practices beyond those typical required in medical practice; and render gender affirming services non-tax deductible under state income tax law or due to some states definition of minors, those who are 18 years old.
Exceptions
Six (6) states provide exceptions, allowing access to this care in certain circumstances (GA, FL, OH, NC, NE, ND), including some limiting access to minors who were receiving these services prior to the law’s enactment (e.g. NC, ND, OH). Nebraska has a broader process available but it includes strict requirements to qualify for exceptions for individuals, families, and providers. Another six states (LA, IN, KY, OK, SD, and TX) that allow for these exceptions do so with a requirement or expectation that the minor will taper their use and be “weaned” from treatment within a certain time frame.
Notably,despite the prohibitions around gender affirming care for trans youth, all 23 states allow the same services prohibited under the law/policy to be used in other medical circumstances (e.g. when they are prescribed to address “precocious puberty” or chromosomal sex differences, among other “conditions”).
Litigation
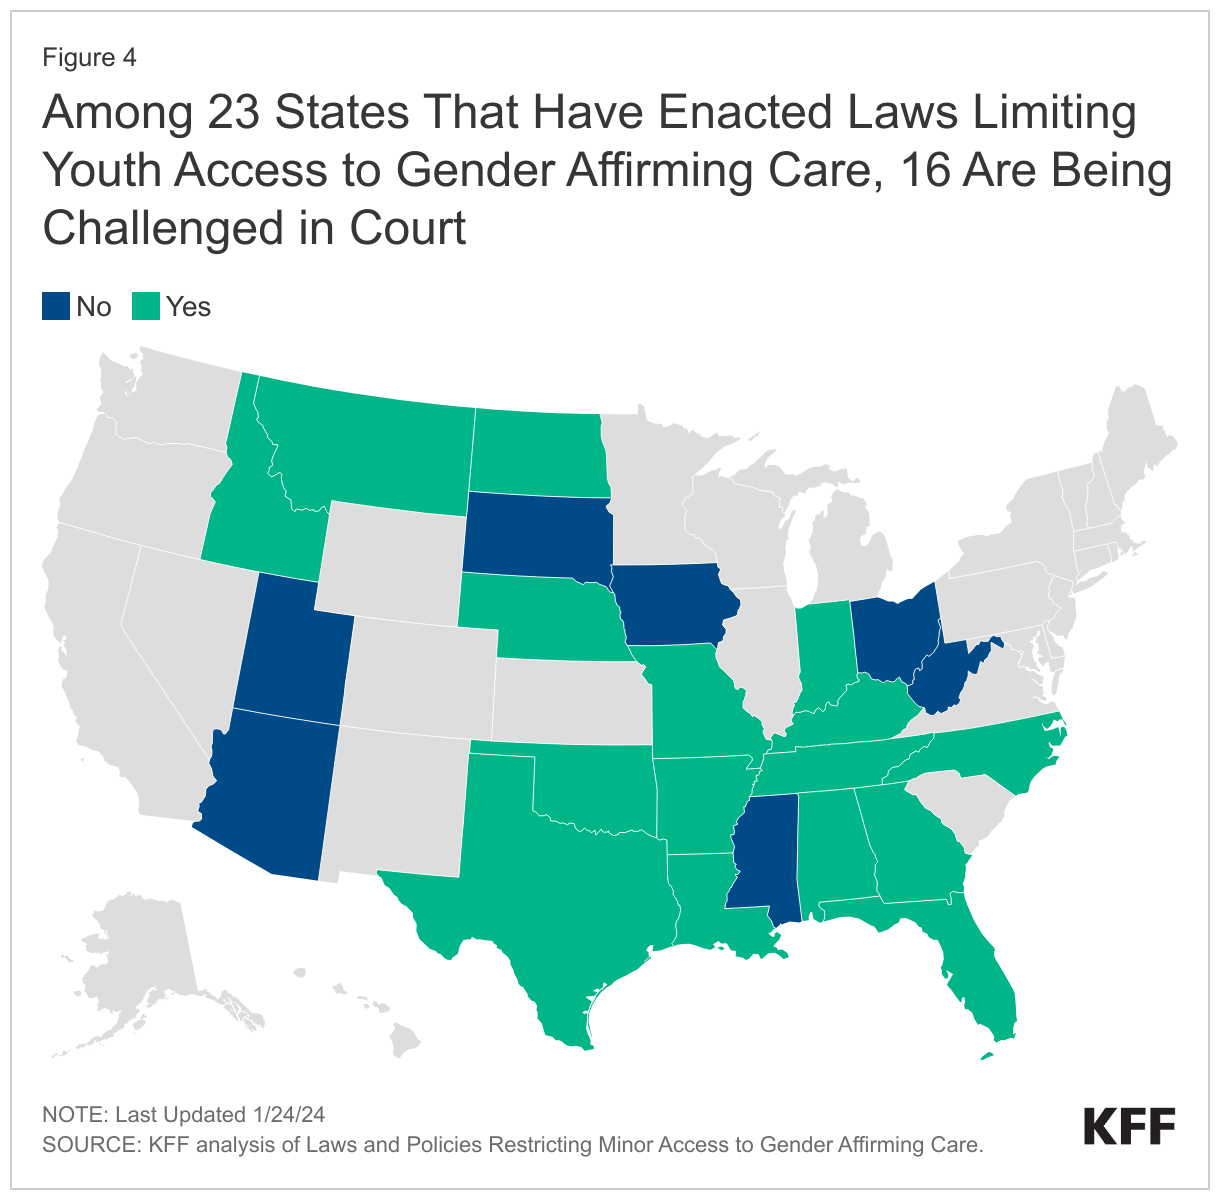
Just as the number of states enacting such policies has increased, so has the number of lawsuits challenging them. The majority of states with laws/policies in place (16 or 23) are facing legal challenges.
Several (6) have reached appeals courts, and the plaintiffs in the Tennessee and Kentucky cases have petitioned the U.S. Supreme Court to review their claims, with the U.S. Department of Justice filing a similar petition.
Looking Ahead
State policy making that limits youth access to gender affirming care can be viewed in a broader context of other actions states have taken to restrict young trans people’s access to social institutions. For example, states have enacted so called “bathroom bills,” “don’t say gay bills,” requirements that schools notify parents if minors use gender pronouns not reflective with their sex assigned at birth, and laws that limit transgender students’ access to sport. (The Movement Advancement Project tracks a range of these policy areas, including youth access to gender affirming care.) Conversely, other states have made efforts to secure trans people’s access to health care (including adults) by creating coverage requirements for private insurance and Medicaid and enacting shield laws to protect patients/providers seeking care when it is prohibited in their home state.
LGBTQ rights, especially those impacting young people, are shaping up to be a major issue in the 2024 election and are being debated heavily at the state and local level, as evidenced by the proliferation of laws and policies seeking to limit youth access to gender affirming care.
Looking ahead, it will be important to monitor whether states continue to enact these policies, how litigation takes shape, and whether the Supreme Court elects to take the cases that it has been petitioned to hear. These laws and policies have political implications, but importantly also have the potential to affect the wellbeing of young trans people and LGBTQ people more broadly, with implications as well for health care providers, parents, and teachers.
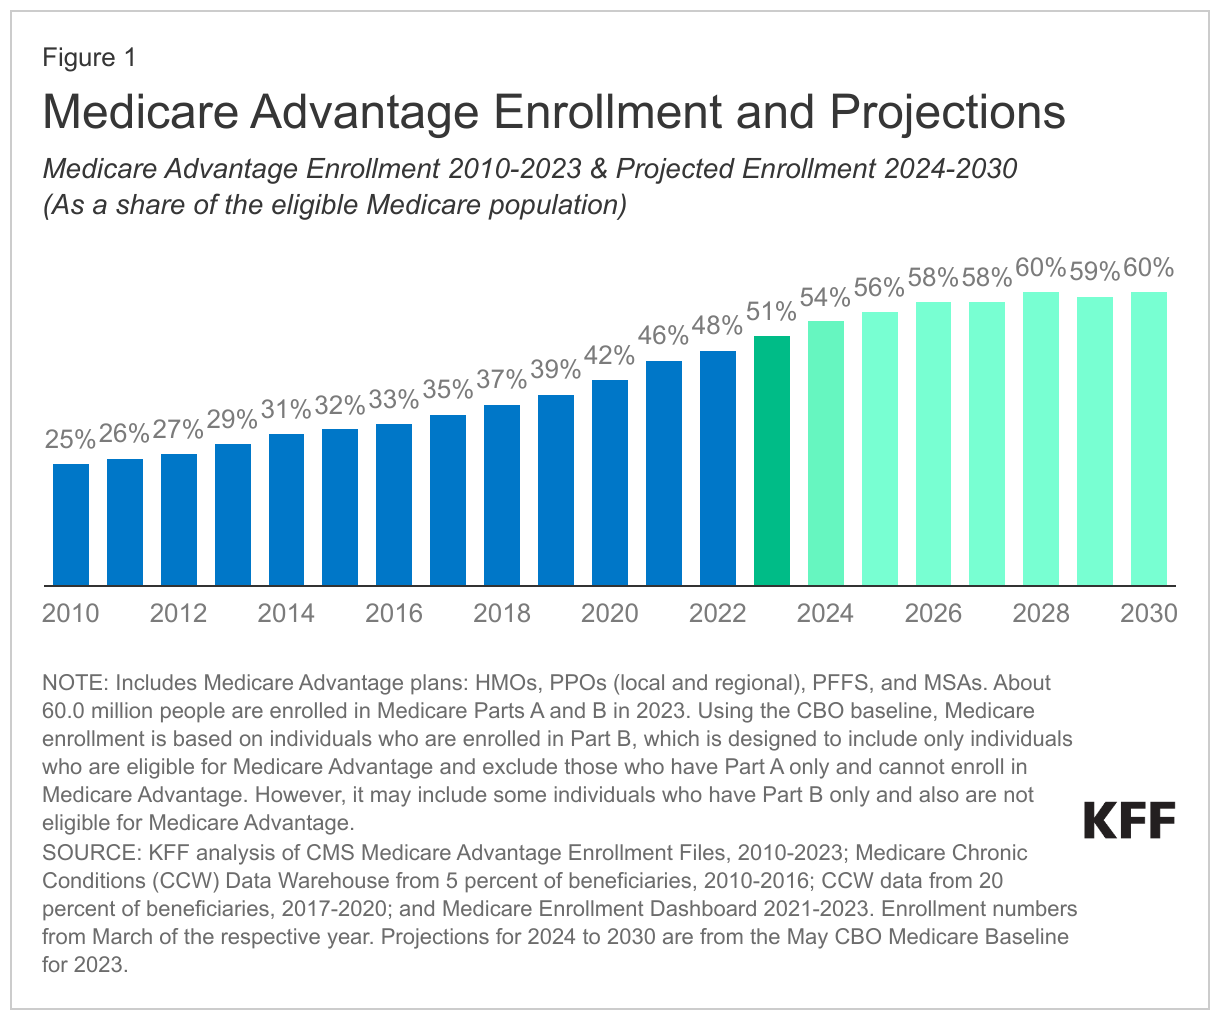
For the first time in Medicare’s history, more than half of all eligible people with Medicare, or 30.8 million people in 2023, are enrolled in private Medicare Advantage plans. Medicare Advantage plans are offered by private health insurance companies that receive payments from the federal government to provide Medicare-covered services. People with Medicare have a choice between traditional Medicare (sometimes called fee-for-service Medicare or Original Medicare) and Medicare Advantage plans. The growth in Medicare Advantage enrollment is driven by a number of factors, including the Medicare payment system, which has served to attract and retain insurers and beneficiaries, rather than reduce Medicare spending.
Medicare Advantage enrollment has more than doubled since 2010 and is projected to grow from 54% of the eligible population in 2024 to 60% by the end of this decade (Figure 1).
While some of the larger Medicare Advantage insurers are reporting lower profits due to a slowdown in enrollment growth and higher than expected utilization and costs among enrollees this year, there are many reasons to expect continued Medicare Advantage enrollment growth in the years ahead, given the financial incentives embedded in Medicare’s payment system.
The Medicare Payment Advisory Commission (MedPAC) recently reported that Medicare will pay Medicare Advantage plans an estimated 123% of the cost of similar beneficiaries in traditional Medicare, on average, in 2024, factoring in rebates, coding intensity (i.e., how plans record the health conditions of enrollees for payment purposes), and favorable selection. This year, MedPAC made a change in its estimation methodology to take into account the effects of favorable selection, building on the work of other researchers. Favorable selection occurs when plans are enrolling healthier and lower cost enrollees than predicted by the current payment system.
MedPAC now estimates that these higher payments to Medicare Advantage plans translate into $88 billion in additional Medicare spending in 2024 and $13 billion in higher Medicare Part B premiums paid by Medicare beneficiaries in 2024. While some may take issue with the methodology used to generate these estimates, the projected impact on Medicare spending is likely to raise concerns among some policymakers. Higher Medicare spending affects the solvency of the Medicare Hospital Insurance (HI) Trust Fund and increases Medicare premiums for beneficiaries in both Medicare Advantage and traditional Medicare.
In light of these spending projections, here we lay out 10 reasons why Medicare Advantage enrollment has been growing and why we can expect more growth in the years to come.
People with Medicare are drawn to Medicare Advantage for the extra benefits. Medicare Advantage plans offer extra benefits, like reduced cost-sharing, dental coverage, gym memberships and debit cards for over-the-counter medical supplies that are not covered by traditional Medicare. These extra benefits are funded by what are known as “rebates,” that is, the difference between the amount that plans bid (estimated spending per enrollee on Medicare-covered services) and the benchmark (the maximum amount Medicare will pay per enrollee in a given county). Plans are required to use rebate dollars to reduce cost sharing or premiums, or provide extra benefits, while also keeping a share of rebate dollars for profit and administrative overhead.
People with Medicare are drawn to Medicare Advantage plans that are marketed as “zero premium” products. Like traditional Medicare beneficiaries, Medicare Advantage enrollees are required to pay the Medicare Part B premium, but unlike beneficiaries in traditional Medicare, they typically do not pay a separate premium for additional coverage or for Part D prescription drug premium because Medicare Advantage rebate dollars cover these costs.
Premiums for Part D stand-alone prescription drug plans that supplement traditional Medicare are rising rapidly. On a related note, beneficiaries in traditional Medicare are seeing premiums for stand-alone prescription drug plans rising rapidly, which may lead some to switch to Medicare Advantage to lower monthly expenses. The estimated enrollment-weighted premium for Part D stand-alone drug plans is projected to increase by 21% between 2023 and 2024, from $40 to $48 per month, according to KFF analysis.
People with Medicare are attracted to the financial protection that comes with an annual out-of-pocket limit that Medicare Advantage plans are required to provide. In contrast, traditional Medicare, with about 30 million beneficiaries, does not have an out-of-pocket limit. The Affordable Care Act requires private employer and individually-purchased insurance plans to cap out-of-pocket costs.
Beyond financial benefits, people with Medicare are attracted to the simplicity and convenience of Medicare Advantage, which provides all coverage in one plan, obviating the need to obtain a Medicare Part D plan and a Medigap plan, as many traditional Medicare beneficiaries have.
Brokers have a financial incentive to encourage enrollment in Medicare Advantage plans because commissions are higher for Medicare Advantage than for Medigap and Part D plans that are purchased to complement traditional Medicare.
A growing share of large employers are shifting their Medicare-age retirees into Medicare Advantage plansfor both Medicare and supplemental benefits. KFF research has shown that employers are shifting their retirees to Medicare Advantage as a strategy to maintain benefits, simplify administration and lower their own costs. The shift to Medicare Advantage may reduce costs to employers and unions but also means that retirees may not have the option to choose traditional Medicare, unless they forfeit their retiree health benefits.
Medicare beneficiaries may be reluctant to switch from Medicare Advantage to traditional Medicare if they run the risk of being denied a Medigap policy due to a pre-existing condition. Medicare Advantage enrollees can switch to traditional Medicare during the annual open enrollment period but may not be able to purchase a Medigap policy. Federal law provides very limited protections for people with pre-existing conditions to enroll in a Medigap policy. Only four states have guaranteed issue protections for Medigap.
Beneficiaries may not be familiar with potential tradeoffs in choosing Medicare Advantage over traditional Medicare. For example, Medicare Advantage plans may have network restrictions that could prevent enrollees from being seen by certain doctors, hospitals and skilled nursing facilities, and often use prior authorization to manage utilization, which may make it difficult for some enrollees to get treatment or may delay treatment recommended by their doctors, and creates administrative hassles for their providers.
As Medicare Advantage enrollment continues to climb, traditional Medicare is on track to diminish as a source of Medicare coverage, leaving in its place a program that looks more like a marketplace of private health insurance plans, funded by the federal government. This doesn’t come as a surprise. Policy choices made over the years have resulted in higher payments to plans relative to spending for similar people in traditional Medicare, allowing plans to reduce cost sharing and offer extra benefits that appeal to beneficiaries and have boosted enrollment well beyond expectations.
At the same time, gaps in data make it difficult to assess the impact of Medicare Advantage coverage on people who enroll in these plans, particularly those with significant health needs. Given these trends, policymakers are likely to struggle in the years ahead with how to contain the cost to the federal government of Medicare Advantage, what that means for enrollees, and what the future holds for traditional Medicare.
This work was supported in part by Arnold Ventures. KFF maintains full editorial control over all of its policy analysis, polling, and journalism activities.
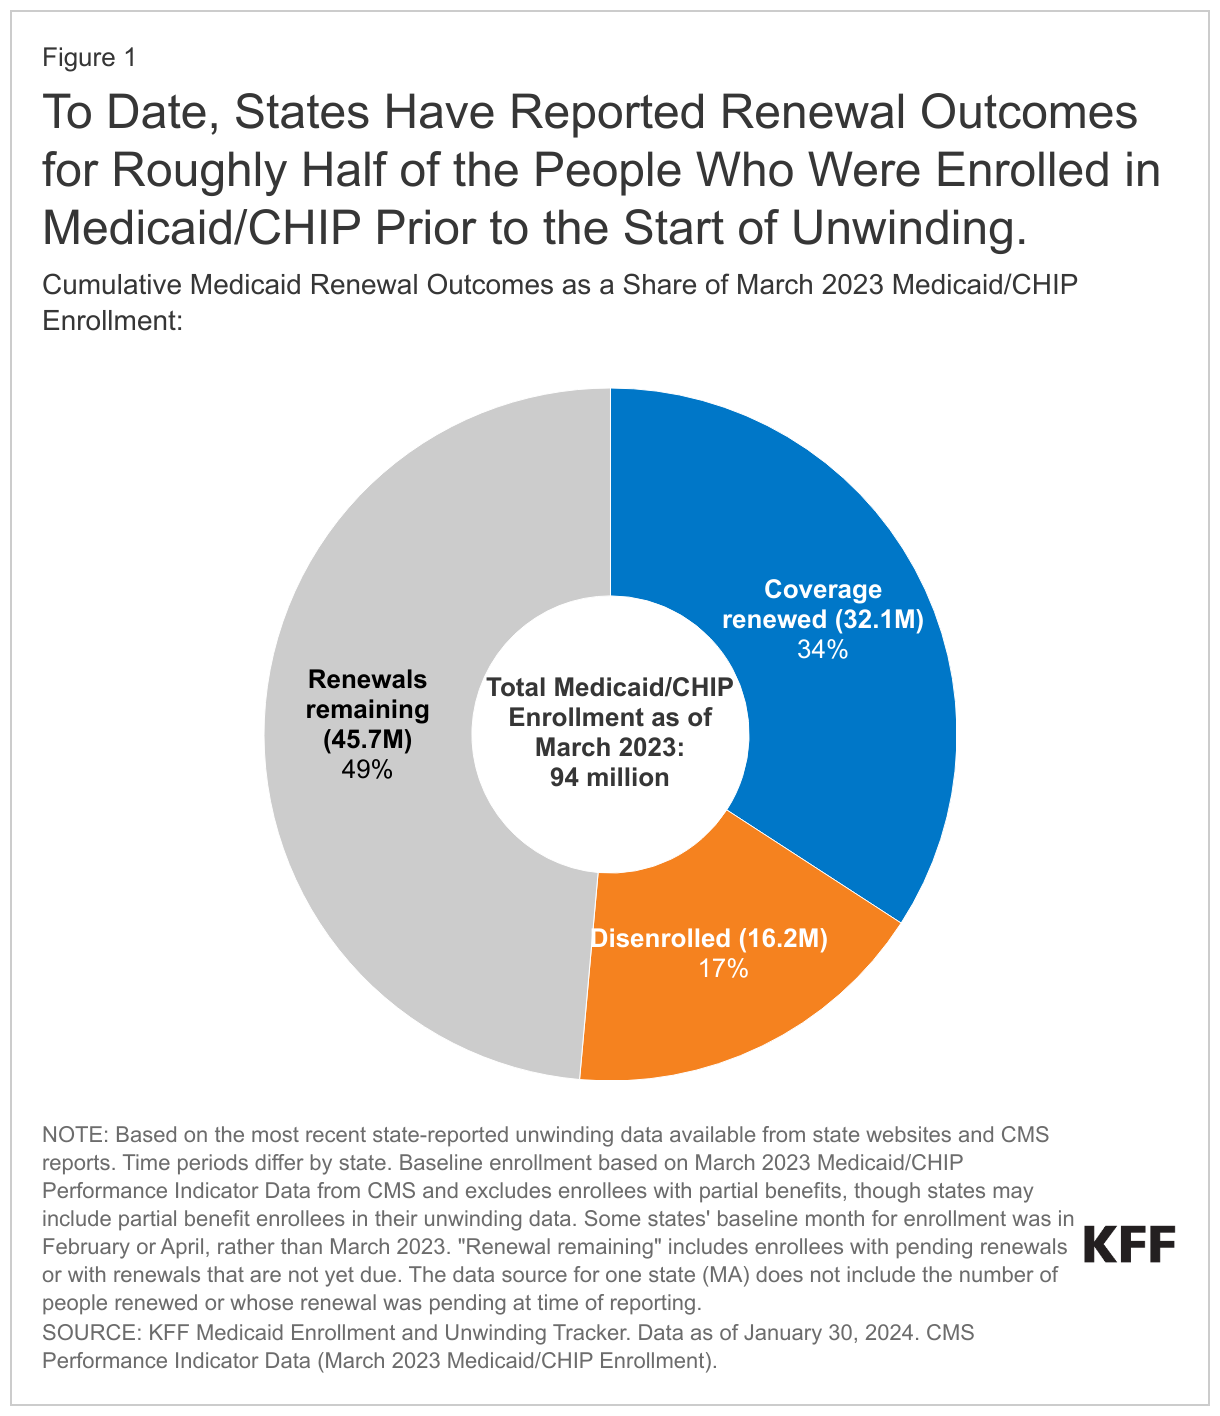
Ten months into the unwinding of the Medicaid continuous enrollment provision, states have reported renewal outcomes for half of all enrollees whose eligibility needs to be reviewed during the unwinding period, including 34% (32.1 million) who have had their coverage renewed, and 17% (16.2 million) who have been disenrolled, according to KFF’s latest analysis of state-level data.
There are reasons to expect disenrollment rates to moderate in the second half of the unwinding as states reduce procedural disenrollments and work through “likely ineligible” populations.
Since the start of the unwinding, Medicaid enrollment has declined by about 10% nationally based on the latest available data, with decreases in every state, ranging from 32% in Idaho to 1% in Maine. Two states—South Dakota and North Carolina—expanded Medicaid in 2023, which should limit enrollment declines in those states.
Other state and federal policies could also affect Medicaid enrollment and access to other coverage in the months ahead. Several states may consider proposals to adopt the Affordable Care Act (ACA) Medicaid expansion this year, though the outcomes of those debates are uncertain. In the 10 states that have not adopted Medicaid expansion, nearly 1.5 million uninsured individuals fall into the “coverage gap,” and are not eligible for Medicaid or ACA Marketplace subsidies.
Implementation of 12-month continuous coverage for children and postpartum individuals, as well as extended multi-year continuous eligibility for children in some states, could help to stabilize coverage after the unwinding.
Still, the Medicaid unwinding’s impact on broader coverage trends remains to be seen. While national data show record enrollment in ACA Marketplace coverage, a relatively small share of this growth appears to come from people who have transitioned from Medicaid to the Marketplace. Also, data on the number of people reenrolling in Medicaid after being dropped, transitioning to employer coverage, or becoming uninsured are currently limited.
As the start of 2024, many issues are at play that will affect Medicaid coverage, financing, and access. Medicaid is the primary program providing comprehensive health and long-term care coverage to one in five low-income Americans. The unwinding of the Medicaid continuous enrollment provision started on April 1, 2023, and will continue to be the dominant Medicaid policy issue in 2024. However, adoption of the Affordable Care Act (ACA) Medicaid expansion and other coverage and access expansions, efforts to address social determinants of health and facilitate re-entry for individuals transitioning from incarceration, long-term services and supports (LTSS) workforce, and Medicaid financing are also key areas to watch. Medicaid may not be a major issue in the presidential election, but debate about repeal and replace of the ACA, Medicaid work requirements, and federal financing for Medicaid could emerge as national election issues. In addition, as a major source of coverage for births, Black, Hispanic, American Indian or Alaska Native and Native Hawaiian or Other Pacific Islander populations, some lawfully present immigrants, low-income children, working-age people with disabilities, and people needing long-term services and supports, Medicaid may underpin larger 2024 election issues. At the same time, many states have seen revenues decline recently, which could increase pressure to reduce spending in Medicaid and other programs. This issue brief provides context for these Medicaid issues and highlights key issues to watch in the year ahead.
Unwinding of the Continuous Enrollment Provision
The unwinding of the continuous enrollment provision will be the dominant Medicaid policy issue in 2024. Policies put in place to pause Medicaid disenrollments during the pandemic ended on March 31, 2023. At the start of the unwinding period, in April 2023, Medicaid enrollment peaked at 94.5 million, an increase of 23 million or 32 percent from before the pandemic. As of the end of January 2024, states have reported renewal outcomes for half of all enrollees, including 34% (32.1 million) who have had their coverage renewed and 17% (16.2 million) who have been disenrolled. The share of disenrollments occurring for procedural or paperwork reasons remains high in many states, and amid growing concern over loss of Medicaid coverage for children, in December 2023, federal officials issued new data and additional guidance highlighting strategies to reduce procedural disenrollments for children. The Secretary of HHS also sent letters to nine states with large declines in Medicaid child enrollment, urging them to take up additional policy options to prevent procedural disenrollments. As unwinding continues in 2024, data and experiences on the ground can provide insights about effective strategies to promote continuity of coverage and minimize procedural disenrollments. Overall, the Medicaid enrollment has declined by nearly 10% across states since the start of unwinding in each state, with rates ranging from 32% in Idaho to 1% in Maine.
Medicaid Coverage and Access Expansions
At the start of state legislative sessions, several non-expansion states may consider proposals to adopt the ACA Medicaid expansion. South Dakota and North Carolina implemented the Medicaid expansion in 2023. In the 10 states that have not adopted the ACA Medicaid expansion, nearly 1.5 million uninsured individuals fall into the “coverage gap.” These individuals do not qualify for Medicaid but have incomes below poverty, making them ineligible for premium subsidies in the ACA Marketplace. The American Rescue Plan Act (ARPA) included a temporary fiscal incentive designed to encourage states to newly adopt the expansion that has helped to reignite expansion discussions. While legislative leaders in Florida remain opposed to expansion, Republicans in Georgia, Alabama, and Mississippi may be open to a non-traditional Medicaid expansion that would include provisions not otherwise allowed under current law (Arkansas, Indiana, Michigan and Utah are examples of states that operate Medicaid expansion through an approved Section 1115 waiver). In addition, the Kansas governor, a longtime proponent of expansion, once again included the proposal in her recently released budget, along with a proposed work requirement. While some states may be debating expansion, former President Trump announced he would renew efforts to replace the ACA if elected, which could result in reduced Medicaid coverage and financing.
Other state and federal policies may expand coverage for certain groups. Nearly all states (47) have adopted an option to extend postpartum coverage from 60 days to 12 months. The Consolidated Appropriations Act included a requirement for all states to implement 12 months of continuous eligibility for children as of January 2024, and Oregon, Washington, and New Mexico have gone further, receiving waiver approval to provide continuous eligibility for children from birth to age 6. Other states are pursuing similar proposals. KFF analysis shows that continuous eligibility policies help to provide coverage stability for children. At the federal level, the Biden Administration proposed broad regulations to make it easier for individuals to obtain and maintain coverage; and finalized the provisions to help low-income Medicare beneficiaries gain access to Medicaid coverage of Medicare premiums and often, cost sharing, through the Medicare Savings Programs.
In addition to policies to expand coverage, there is likely to be a continued effort to help ensure access to services in Medicaid. Compared to adults with private coverage or Medicare, Medicaid enrollees are more likely to face problems with provider availability and prior authorization; however, because of federal rules that limit out-of-pocket costs, Medicaid enrollees are less likely to report cost-related problems. Pending federal rules aim to help address availability of providers and access in Medicaid by strengthening Medical Care Advisory Committees (to allow for more meaningful engagement from Medicaid enrollees), increasing transparency for fee-for-service (FFS) and managed care payments, establishing national maximum appointment wait time standards for managed care enrollees, and requiring state monitoring related to access and network adequacy for managed care plans. In addition, the Biden administration recently finalized rules to streamline prior authorization processes for Medicaid and other payers. At the state level, efforts to expand the scope of covered services (particularly for behavioral health), implement initiatives to address health disparities and enhance payment rates are key strategies underway to help bolster access to care for Medicaid enrollees.
Social Determinants of Health and Re-Entry
States and the Administration are implementing strategies to leverage Medicaid to address social determinants of health (SDOH). To expand opportunities for states to use Medicaid to address health-related social needs (HRSN) such as housing instability and nutrition insecurity, CMS announced new flexibilities available to states through managed care and through Section 1115 demonstration waivers. New CMS guidance accompanies the Biden-Harris Administration’s release of the U.S. Playbook to Address Social Determinants of Health and HHS’s Call to Action to Address Health-Related Social Needs. As of January 2024, CMS has approved Section 1115 demonstrations in eight states (Arizona, Arkansas, California, Massachusetts, New Jersey, New York, Oregon, and Washington) under the new HRSN 1115 framework that authorize evidence-based HRSN services for specific high-need populations. Approvals include coverage of rent/temporary housing and utilities for up to 6 months and meal support up to three meals per day (up to 6 months). These initiatives also require states to meet minimum provider payment rate requirements for primary care, behavioral health, and obstetrics services to bolster access and to complement (rather than replace) other efforts.
California and Washington received approval and a number of other states have proposals pending for waivers to facilitate re-entry for individuals who are incarcerated. In April 2023, CMS released guidance encouraging states to apply for a new Section 1115 demonstration opportunity to test transition-related strategies to support community re-entry and care transitions for individuals who are incarcerated. This opportunity allows states to partially waive the statutory Medicaid inmate exclusion policy, which prohibits Medicaid from paying for services provided during incarceration (except for inpatient services). Congress is also considering several re-entry provisions in debate about reauthorization of the SUPPORT Act (major legislation passed in 2018 to address the opioid epidemic) including preventing Medicaid disenrollment due to incarceration, a policy that could help ensure continuity of Medicaid coverage after leaving incarceration.
Workforce Challenges in Long Term Services and Supports and Behavioral Health
Federal and state governments are responding to increased workforce shortages and unmet needs among people who use long-term services and supports (LTSS). The Administration proposed a rule creating new staffing requirements in nursing facilities, requiring state Medicaid agencies to report the percentage of Medicaid spending for institutional LTSS that goes to compensation for direct care workers and support staff, and providing funding for individuals to enter careers in nursing facilities. A proposed rule aimed at ensuring access to all Medicaid services addresses the LTSS that are provided in non-institutional settings, which are often referred to as home- and community based services (HCBS). The proposed rule would establish requirements regarding states’ payment rates for HCBS, among other provisions intended to address access to HCBS and Medicaid services more broadly.States have responded to workforce challenges by increasing Medicaid payment rates for nursing facilities and HCBS as reported to KFF in a 2023 survey; but employment levels remained 10% below pre-pandemic levels in October 2023. As the primary payer of LTSS, pressure to further increase staffing and raise reimbursement rates may fall disproportionately to Medicaid, where financing is shared between states and federal government.
Lack of adequate workforce to meet increasing demands for mental health and substance use disorder services is likely to persist in 2024. States are working to expand Medicaid access to behavioral health services through efforts to build out the behavioral health continuum of care, integrate physical health and behavioral health services, implement mobile crisis services, and expand behavioral health services in schools. However, access depends on the availability of a mix of services and the capacity of the behavioral healthworkforce. To help bolster the behavioral health workforce, states are implementing several strategies including increasing rates, reducing burden and adding incentives for providers to participate in Medicaid, and extending workforce.
Medicaid Financing
Slowing state revenue growth could have implications for Medicaid policy and spending. Medicaid financing is shared by the federal government and the states. Consequently, economic factors that affect state revenues including inflation, supply chain issues, labor force participation rates, and changes in the stock market have fiscal implications for states. As state legislatures develop FY 2025 budgets, they are facing declining revenues and the expiration of pandemic-era supports from the federal government, that could limit Medicaid investments or prompt proposals to cut Medicaid spending to help maintain balanced budgets. In 2024, declines in enrollment will contribute to lower Medicaid spending growth but the expiration of enhanced federal matching funds will increase state spending. Heading into FY 2025, considerable uncertainty remains about overall Medicaid enrollment and the health care needs of enrollees that retain coverage. Even though national economic indicators remain strong, pandemic-related supports for households have also expired and families are still struggling to cover costs from record inflation during the pandemic. Broader debates about Medicaid financing could arise during the Presidential election related to efforts to reduce the federal deficit and limit entitlement spending; these are areas of considerable policy differences between Republican candidates and President Biden.
What to Watch
The issues identified in this policy watch could have major implications for Medicaid coverage, financing, and access. As these issues play out, the following key questions will be at the forefront:
Who will win the presidency and control Congress, which will have major implications for Medicaid policy going forward?
How will the Medicaid unwinding affect Medicaid enrollment and changes in coverage, including increases in the number of people who are uninsured?
Will states adopt Medicaid coverage expansions in 2024, including Medicaid expansion or multi-year continuous eligibility for children?
How many states will advance new initiatives to use Medicaid to address health-related social needs or facilitate transitions from incarceration in 2024?
How will federal and state efforts to address workforce shortages for LTSS and behavioral health evolve in 2024?
How will state fiscal conditions and broader economic factors affect Medicaid spending as well as state and federal Medicaid policy?
Ten months into the unwinding of the Medicaid continuous enrollment provision, states are continuing to reverify the eligibility of the roughly 94 million enrollees in the program. KFF tracking shows that states have reported outcomes for roughly half of the people expected to undergo renewals during the unwinding period. This policy watch examines the latest data and key issues to watch during the next phase of the unwinding.
What Do the Data Show?
As of the end of January 2024, states have reported renewal outcomes for half of all enrollees, including 34% (32.1 million) who have had their coverage renewed and 17% (16.2 million) who have been disenrolled (Figure 1). Due to lags in data reporting, which vary from one to three months across states, the number of completed renewals is an undercount. Prior to the start of the unwinding, KFF projected that 17 million people would be disenrolled during the unwinding based on state estimates, but noted the range could be 8 to 24 million people disenrolled because of the uncertainty and expected variation across states. Given how many renewals are left to complete, disenrollments are highly likely to exceed 17 million.
There is significant variation in the share of completed renewals across states, ranging from 87% in Oregon to 22% in Wyoming (Figure 2). Some of this variation reflects when states resumed disenrolling people as well as differences in the pace of processing renewals. But actions some states have taken in response to inappropriate or high procedural disenrollment rates are also a factor. In August and September, 30 states were required to reinstate coverage and temporarily pause disenrollments for some enrollees to address non-compliance with federal rules. Some states also voluntarily extended renewal deadlines to delay procedural disenrollments while they conduct additional outreach to enrollees. Finally, the variation across states also reflects differences in how states report unwinding data and the frequency of updates.
Since the start of unwinding, Medicaid enrollment has declined in every state, ranging from 32% in Idaho to 1% in Maine (Figure 3). Overall, the Medicaid enrollment has declined by nearly 10% across states since the start of unwinding. The enrollment declines shown here are measured against each state’s baseline enrollment, which is enrollment in the month prior to when the state resumed disenrollments and which varies by state. Due to the lags in reporting, current enrollment declines are greater in some states. Changes in enrollment reflect the people who disenroll from Medicaid as well as those who newly enroll, and those who re-enroll within a short timeframe following disenrollment, also known as “churn.” Two states, South Dakota and North Carolina, implemented the Medicaid expansion since the start of unwinding (in July and December 2023, respectively), which should mitigate enrollment declines in these states.
Looking Ahead
Disenrollment rates could moderate in the second half of the unwinding as states continue efforts to reduce procedural disenrollments and because some states have worked through “likely ineligible” populations. Many states continue to adopt flexibilities during the unwinding to improve ex parte renewal processes, which reduce paperwork burden on enrollees and can reduce procedural termination rates. In addition, some states have worked through renewals for people the state flagged as likely ineligible, who the states prioritized for renewals early in the unwinding. The remaining population in these states is more likely to still be eligible and, therefore, less likely to be disenrolled. For example, Arkansas and Idaho recently announced that they completed renewals for “likely ineligible” enrollees after six months of unwinding, and the number and rate of disenrollments declined in subsequent months (the total number of renewals also declined steeply in both states).
The unwinding’s implications for broader coverage trends are not yet known. There is currently limited data on how many people losing Medicaid are reenrolling in Medicaid, transitioning to other sources of health coverage, including employer coverage and coverage through the Affordable Care Act (ACA) Marketplaces, or becoming uninsured. Data for 2022 showed the national uninsured rate had dropped to 7.9%, the lowest level on record. While the unwinding will likely contribute to increases in the number of people who are uninsured and in the uninsured rate, it is unclear what the magnitude of these increases will be. Federal survey data will not be available to understand these trends until well after the unwinding period ends, and surveys that rely on self-reported health insurance status significantly undercount Medicaid enrollment. In the meantime, state and national administrative data on ACA Marketplace enrollment and private insurance coverage can shed some light on the coverage picture. However, while national data show record enrollment in Marketplace coverage, Medicaid unwinding is only one factor contributing to that growth and a relatively small share of people disenrolled from Medicaid are transitioning to Marketplace or Basic Health Plan coverage. It will be some time before there is a more complete picture at the national level of how many people losing Medicaid find other coverage or become uninsured.
Ahead of the 2024 general election, a new KFF brief examines abortion ballot initiatives in progress in 13 states. These 13 states could follow six other states that have voted on constitutional amendments to protect or restrict abortion since the Supreme Court’s Dobbs decision overturning Roe v. Wade in 2022. In those six states, the side favoring access to abortion prevailed.
Citizen-led abortion ballot initiatives have captured nationwide attention and promise to be closely watched; advocacy groups on both sides of the issue have sought to use this powerful tool to address the legality of abortion in their state and drive voter turnout at the polls this November. However, in many states that currently ban or severely restrict abortion, there is no legal pathway for a citizen-initiated constitutional amendment to make it on the ballot.
“Addressing Abortion Access through State Ballot Initiatives” also outlines the processes states can use to place initiatives on the ballot and explains why advocates on both sides of the abortion issue, seeking more stable abortion laws, have turned to ballot initiatives.
Social determinants of health (SDOH) are the conditions in which people are born, grow, live, work and age. While there are limits, states can use Medicaid – which, by design, serves a primarily low-income population with greater social needs – to address social determinants of health. To expand opportunities for states to use Medicaid to address health-related social needs, The Centers for Medicare & Medicaid Services or CMS announced new flexibilities available to states through managed care and through Section 1115 demonstration waivers. New CMS guidance accompanies the Biden-Harris Administration’s release of the U.S. Playbook to Address Social Determinants of Health and HHS’s Call to Action to Address Health-Related Social Needs. While health programs like Medicaid can play a supporting role, CMS stresses the new HRSN initiatives are not designed to replace other federal, state, and local social service programs but rather to complement and coordinate with these efforts. The resources provided to date through Medicaid are relatively modest in comparison to the social needs that exist. This brief outlines the range of Medicaid authorities and flexibilities that can be used to add benefits and design programs to address the social determinants of health (Figure 1).
Figure 1: State Medicaid programs have some flexibility to address enrollee social determinants of health.
What Are Social Determinants of Health?
Social determinants of health are the conditions in which people are born, grow, live, work and age.1They include factors like economic stability, education, neighborhood and physical environment, employment, and social support networks, as well as access to health care (Figure 2).
Figure 2: Though health care is essential to health, research shows that health outcomes are driven by many factors.
Though health care – and, by extension, health coverage – is essential to health, research shows that health outcomes are driven by an array of factors, including underlying genetics, health behaviors, social, economic, and environmental factors. While there is currently no consensus in the research on the magnitude of the relative contributions of each of these factors to health, studies suggest that health behaviors and social and economic factors are primary drivers of health outcomes, and social, and economic factors can shape individuals’ health behaviors. There is extensive research that concludes that addressing social determinants of health is important for improving health outcomes and reducing health disparities.2
Both health and non-health sectors have been engaged in initiatives to address social determinants of health. Outside of the health care system, non-health sector initiatives seek to shape policies and practices in ways that promote health and health equity. Within the health care sector, a broad range of initiatives have been launched at the federal, state, and local levels and by plans and providers to address social determinants of health, including efforts within Medicaid.
How Can Medicaid be Used to Address Social Determinants of Health?
State Medicaid programs can add certain non-clinical services to home and community-based services (HCBS) programs to support seniors and people with disabilities. Generally, states have not been able to use federal Medicaid funds to pay the direct costs of non-medical services like housing and food.3 However, within Medicaid, states can use a range of state plan and waiver authorities (e.g., 1905(a), 1915(i), 1915(c), or Section 1115) to add certain non-clinical services to the Medicaid benefit package including case management, housing supports, employment supports, and peer support services. Historically, non-medical services have been included as part of Medicaid home and community-based services programs for people who need help with self-care or household activities as a result of disability or chronic illness.
Outside of Medicaid HCBS authorities, state Medicaid programs have historically had more limited flexibility to address social determinants of health. Certain options exist under Medicaid state plan authority as well as Section 1115 authority to add non-clinical benefits. Additionally, under federal Medicaid managed care rules, managed care plans have some flexibility to pay for non-medical services. Other Medicaid payment and delivery system reforms, like the formation of Accountable Care Organizations (ACOs), may provide flexibility or opportunities to cover non-medical services that support health as well.
To expand opportunities for states to use Medicaid to address health-related social needs, CMS announced new flexibilities available to states through Medicaid managed care authority and through Section 1115 demonstration waivers. CMS defines health-related social needs (or “HRSN”) as an individual’s unmet, adverse social conditions (e.g., housing instability, homelessness, nutrition insecurity) that contribute to poor health and are a result of underlying social determinants of health. New CMS guidance builds on guidance released in 2021. The remaining sections outline the primary Medicaid authorities and flexibilities that can be used to add benefits and design programs to address the social determinants of health beyond HCBS programs. Some efforts may address a single issue (e.g., housing, or food security) while other efforts and initiatives are designed to address a range of social determinants of health.
Medicaid Managed Care Plan Authority
Withover two-thirds of Medicaid beneficiaries enrolled in comprehensive, risk-based managed care plans nationally, health plans can be an important part of efforts to address enrollee social determinants of health. States pay Medicaid managed care organizations (MCOs) a set per member per month payment for the Medicaid services specified in their contracts. Capitation rates provide upfront fixed payments to plans for expected utilization of covered services, administration costs, and profit.
Under federal Medicaid managed care rules, Medicaid MCOs can be given flexibility to pay for non-medical services through “in-lieu-of” authority. States may allow Medicaid MCOs the option to offer (and provide beneficiaries the option to receive) services or settings that substitute for standard Medicaid benefits (referred to as “in lieu of” services (or “ILOS”)) if the substitute service is medically appropriate and cost-effective. For example, a state could authorize in-home prenatal visits for at-risk pregnant beneficiaries as an alternative to traditional office visits or services provided by peer supports, as an alternative to psychosocial rehabilitation services for members with behavioral health needs. The costs of the ILOS are built into managed care rates. In January 2023, CMS released guidance that paves the way for states to allow Medicaid MCOs to offer services, like housing and nutrition supports, as substitutes for standard Medicaid benefits.4 The new guidance establishes financial guardrails and new requirements for ILOS and clarifies these substitute services can be preventive in nature instead of an immediate substitute (e.g., providing a dehumidifier to an individual with asthma before emergency care is needed). This guidance follows the approval of a California proposal to use ILOS. In May 2023, the Biden administration issued a proposed rule related to managed care access, finance, and quality. In the proposed rule, CMS seeks to codify its January 2023 ILOS guidance.5KFF’s 2023 survey of state Medicaid directors found few states permitted MCOs to cover SDOH-related services (e.g., housing, food, or other) as ILOS as of July 2023.
Under federal rules, Medicaid MCOs can pay for non-medical services as “value-added” services. “Value-added” services are extra services MCOs voluntarily provide outside of covered contract services. These services cannot be built into managed care rates.6 Examples include safe sleeping spaces for infants, repairs and cleaning services to reduce asthma triggers, installation of a shower grab bar, and health play and exercise programs.
States may implement MCO procurement and contracting strategies, including quality requirements linked to SDOH.7In a 2023 KFF survey of Medicaid directors, most MCO states reported leveraging Medicaid MCO contracts to promote at least one strategy to address social determinants of health in FY 2023 (Figure 3). More than half of MCO states reported requiring MCOs to screen enrollees for social needs, screen enrollees for behavioral health needs, provide referrals to social services, and partner with community-based organizations (CBOs). Fewer states reported requiring MCO community reinvestment (i.e., directing plans to reinvest a portion of revenue or profits into the communities they serve) compared to other strategies. States can use incentive payments or quality withhold arrangements to reward plans for investments and/or improvements in SDOH. For example, states may provide incentive payments to plans that screen enrollees for social needs or make other strategic investments in addressing health-related social needs or incentive payments to improve or maintain quality while lowering costs. Additionally, many plans have developed initiatives and engaged in activities to address enrollees’ social needs beyond state requirements; however, it is difficult to compile national data to reflect this.
In the Institute for Medicaid Innovation’s 2023 Medicaid managed care survey, plans indicated state Medicaid agencies could support MCO efforts to address enrollee social needs by improving data sharing (e.g., between the state and MCOs and between government agencies), increasing financial resources (including to support the facilitation of partnerships and new payment models), and facilitating contracting with CBOs.
States can direct managed care plans to make payments to their network providers to further state goals and priorities, including those related to addressing social determinants of health. States can seek CMS approval to require MCOs to implement value-based purchasing models for provider reimbursement (e.g., pay for performance, bundled payments) or participate in multi-payer or Medicaid-specific delivery system reform or performance improvement initiatives. For example, a state may require managed care plans to implement alternative payment models (APMs) or incentive payments to encourage providers to screen for socioeconomic risk factors.
Section 1115 Waivers
Through Section 1115 authority, states can test approaches for addressing SDOH including requesting federal matching funds to test SDOH related services and supports in ways that promote Medicaid program objectives. Section 1115 waivers generally reflect priorities identified by states and CMS, as well as changing priorities from one presidential administration to another. While not required by statute, longstanding policy requires that Section 1115 waivers be budget neutral for the federal government. As outlined in CMS’s 2021 guidance, states can request federal matching funds through Section 1115 to test the effectiveness of providing SDOH-related services and supports. States can also test alternative payment methodologies designed to address SDOH under Section 1115 authority. Prior to the Biden administration announcement of new HRSN waiver flexibilities (discussed in more detail below), a number of states had approved Section 1115 waivers that aimed to address enrollee social determinants of health. These SDOH waivers were generally narrow in scope (services and target populations) or pilot programs targeting specific regions. For example, in October 2018, CMS approved North Carolina’s Healthy Opportunities Pilots that operate in three geographic regions of the state and provide services to address enrollee needs related to housing, food, transportation, and interpersonal safety. Some waivers allowed MCOs or ACOs flexibility to offer health-related services but stopped short of requiring them to do so.In December 2022, CMS announced a Section 1115 demonstration waiver opportunity to expand the tools available to states to address HRSN. In November 2023, CMS issued a detailed Medicaid and CHIP HRSN Framework accompanied by an Informational Bulletin (CIB). HRSN services that will be considered under the new framework include housing supports, nutrition supports, and HRSN case management (and other services on a case-by-case basis) (Figure 4). As of January 2024, CMS has approved Section 1115 demonstrations in eight states (Arizona, Arkansas, California, Massachusetts, New Jersey, New York, Oregon, and Washington) that authorize evidence-based HRSN services for specific high-need populations. Approvals include coverage of rent/temporary housing and utilities for up to 6 months and meal support up to three meals per day (up to 6 months). HRSN services must be medically appropriate (using state-defined clinical and social risk factors) and voluntary for enrollees. States can add HRSN services to the benefit package and may require managed care plans to offer the services to enrollees who meet state criteria. Federal expenditures are also available to build the capacity of community based HRSN providers that may require technical assistance and infrastructure support to become Medicaid providers. Additionally, the Biden administration has expressed support for “community care hubs” (or similar models) that focus on aligning health and social care and may facilitate care coordination as well as develop, manage, and support a network of CBOs.
CMS guidance specifies spending for HRSN cannot exceed 3% of total annual Medicaid spend. CMS indicates HRSN spending will not require offsetting savings (that may otherwise be required for services authorized/financed under Section 1115). State spending on related social services (before the waiver) must be maintained or increased. To strengthen access, states must also meet minimum provider payment rate requirements for primary care, behavioral health, and obstetrics services. HRSN services are subject to monitoring and evaluation requirements, including reporting on quality and health equity measures. In November 2023, HHS and HUD announced the launch of a new learning collaborative that will support states with the implementation of Section 1115 housing-related supports, including helping states improve collaboration and coordination between organizations and systems that provide housing services.
State Plan Authority & Delivery System Reform Models
States may elect to include optional benefits that address social determinants under Section 1905(a) State Plan authority. For example, states may include rehabilitative services, including peer supports and/or case management (or “targeted” case management8 ) services, under their Medicaid state plan. States that choose to offer these services frequently target services based on health or functional need criteria. Peer supports can help individuals coordinate care and social supports and services, facilitating linkages to housing, transportation, employment, nutrition services, and other community-based supports. Case management services can also assist individuals in gaining access to medical, social, educational, and other services. Case management services are frequently an important component of HCBS programs but can also be used to address a broader range of enrollee needs.
States can provide broader services to support health through the optional health home state plan benefit option established by the ACA. Under this option (Section 1945), states can establish health homes to coordinate care for people who have chronic conditions. Health home services include comprehensive care management, care coordination, health promotion, comprehensive transitional care, patient and family support, as well as referrals to community and social support services (such as housing, transportation, employment, or nutritional services). States receive a 90% federal match rate for qualified health home service expenditures for the first eight quarters under each health home.9,10 A federally funded evaluation of the Health Homes model found that most providers reported significant growth in their ability to connect patients to nonclinical social services and supports under the model, but that lack of stable housing and transportation were common problems for many enrollees that were difficult for providers to address with insufficient affordable housing and rent support resources.11
Integrated care models, including patient-centered medical home (PMCHs) and Accountable Care Organizations (ACOs), often emphasize person-centered, comprehensive care and typically involve partnerships with community-based organizations and social services agencies. 12Integrated care models might address social determinants of health through interdisciplinary care teams or care coordination services. Payment mechanisms tied to these models (e.g., per member per month payments (with or without quality or cost incentives) or shared savings/risk models with quality requirements) may provide incentives for providers to address the broad needs of Medicaid beneficiaries.
Looking Ahead
While health programs like Medicaid can play a supporting role, guidance from CMS stresses the new HRSN initiatives are not designed to replace other federal, state, and local social service programs but rather to complement and coordinate with these efforts. The resources provided through Medicaid to address social determinants of health are relatively modest in the face of the social needs that exist, and there is ongoing debate over how effectively the health care system can meet these needs.
Areas to watch include which health-related services states may gain approval to integrate under managed care authority and/or Section 1115, how states define target populations, and how CMS and states negotiate budget neutrality terms (an issue that Republican members of the US House Energy and Commerce have raised concerns about).
States that have not pursued but may be interested in new HRSN flexibilities can learn from the implementation experience of early adopters, including how states and plans work with community-based organizations and coordinate with federal, state, and local social service programs. While there is some evidence, 13,14,15,16,17 ILOS and Section 1115 monitoring and evaluation reports may yield new data involving how addressing certain enrollee social needs may impact health care utilization, spending, and health outcomes. Finally, whether states can sustain funding streams for HRSN longer term and how future changes in Administration may affect states’ ability to pursue these initiatives through waivers will be important to watch.
Federal financial participation is not available to state Medicaid programs for room and board except in certain medical institutions, as codified in multiple regulatory provisions. See, for example, 42 CFR § 441.310(a)(2) and 42 CFR §441.360(b). CMS defines board as three meals a day or any other full nutritional regimen, and room as hotel or shelter type expenses including all property related costs such as rental or purchase of real estate and furnishings, maintenance, utilities, and related administrative services. See section 4442.3 of the State Medicaid Manual at www.cms.gov/regulations-andguidance/guidance/manuals/paper-based-manuals-items/cms021927. ↩︎
An ILOS must not violate any applicable federal requirements, including general prohibitions on payment for room and board under title XIX of the Social Security Act. ↩︎
Medicaid Program; Medicaid and Children’s Health Insurance Program (CHIP) Managed Care Access, Finance, and Quality, 88 FR 28092 (May 3, 2023) (to be codified at 42 CFR 430, 42 CFR 438, 42 CFR 457) ↩︎
Costs associated with value-added services are included in the numerator of the MLR calculation (either as incurred claims or quality-related activities). ↩︎
If managed care plans implement SDOH activities that meet certain federal requirements (in 45 CFR § 158.150(b) and are not excluded under 45 CFR § 158.150(c)), managed care plans may include the costs associated with these activities in the numerator of the MLR as activities that improve health care quality (under 42 CFR § 438.8(e)(3)). ↩︎
When states provide case management services under the state plan without regard to “statewideness” and “comparability” requirements, the benefit is referred to as “targeted case management.” ↩︎
States can (and have) created more than one Health Home program to target different populations. ↩︎
For SUD health homes approved on or after October 1, 2018, states can receive ten quarters of enhanced federal match. ↩︎
Lauren M. Gottlieb, Holly Wing, and Nancy E. Adler, “A Systematic Review of Interventions on Patients’ Social and Economic Needs,” American Journal of Preventative Medicine 53 no. 5 (July 2017): 719-729, https://pubmed.ncbi.nlm.nih.gov/28688725/↩︎
La mayoría de los inmigrantes hispanos dicen que sus vidas son mejores en Estados Unidos, pero enfrentan desafíos financieros y de atención médica: Encuesta 2023 de KFF/LA Times sobre inmigrantes
Los inmigrantes hispanos conforman la mayor proporción de la población inmigrante en Estados Unidos, y alrededor de un tercio de los adultos hispanos o latinos en Estados Unidos son inmigrantes. Este informe ofrece una mirada en profundidad sobre las experiencias variadas de los inmigrantes hispanos que viven en Estados Unidos y destaca los desafíos únicos que enfrentan muchos de ellos, ya que los inmigrantes hispanos tienen más probabilidades que otros grupos de inmigrantes de tener un dominio limitado del inglés (LEP), no ser ciudadanos, tener ingresos familiares más bajos, no tener seguro médico y tener niveles de educación más bajos. Este informe detalla cómo estos factores afectan las experiencias de los inmigrantes hispanos, tanto en el trabajo como en sus comunidades, y en el acceso a la atención médica y a otros servicios.
A pesar de estos desafíos, este informe también destaca la resiliencia y optimismo de la población inmigrante hispana. Revela que, independientemente de su situación económica actual, la mayoría de los inmigrantes hispanos informan una mejor calidad de vida en Estados Unidos que en sus países de origen, y creen que las vidas de sus hijos serán mejores que las suyas.
La mayoría de los inmigrantes hispanos están trabajando, uno de cada cuatro informa ser autónomo o dueño de un pequeño negocio, y muchos apoyan financieramente a sus familias en sus países de origen incluso cuando sus propios ingresos son limitados.
Además, aunque muchos enfrentan desafíos, las circunstancias varían entre los inmigrantes hispanos: aquellos con mayores ingresos y con tarjeta de residencia (green card), visa válida o ciudadanía experimentan mejores resultados en muchos aspectos. Sin embargo, comparten algunas dificultades, independientemente de sus ingresos o estatus migratorio, como el trato injusto en el lugar de trabajo.
Una mejor comprensión de las experiencias de los inmigrantes hispanos no solo proporciona información sobre la diversidad de la población, también puede ayudar a enfocar iniciativas, políticas y recursos para abordar los desafíos que enfrentan.
Este informe se basa en la Encuesta de Inmigrantes, realizada por KFF en colaboración con Los Angeles Times durante la primavera de 2023, hasta la fecha la encuesta más grande y representativa de inmigrantes que viven en Estados Unidos. Con un tamaño de muestra de 3,358 adultos inmigrantes, incluidos 1,207 adultos inmigrantes hispanos, la encuesta proporciona una comprensión profunda de las experiencias de los inmigrantes, reflejando sus múltiples países de origen e historias, ciudadanía y estatus migratorio, identidades raciales y étnicas, y circunstancias sociales y económicas.
La mayoría de los inmigrantes hispanos en Estados Unidos son de México, han sido residentes en Estados Unidos por largo tiempo y están empleados; sin embargo, enfrentan importantes desafíos socioeconómicos. Los inmigrantes hispanos incluyen personas nacidas en México (53%), Centroamérica (17%), Sudamérica (16%) y proporciones más pequeñas de otras regiones y países. Tres de cada cuatro inmigrantes hispanos (77%) han estado en Estados Unidos durante 10 años o más y dos tercios (67%) están empleados, pero la mayoría vive en hogares de bajos ingresos (menos de $40,000 al año). Dos tercios de los inmigrantes hispanos tienen un dominio limitado del inglés (LEP, por sus siglas en inglés), y una proporción similar tiene educación secundaria o menor. La mayoría (56%) no son ciudadanos, incluido uno de cada cuatro que probablemente sean indocumentados.
Como los inmigrantes en general, la mayoría de los inmigrantes hispanos vinieron a Estados Unidos en busca de mejores oportunidades y la mayoría siente que están mejor como resultado de haber migrado, siendo especialmente los de Centroamérica los más propensos a citar la seguridad como un beneficio clave. Alrededor de ocho de cada 10 inmigrantes hispanos dicen que están mejor que sus propios padres, y dos tercios dicen que creen que las vidas de sus hijos serán aún mejores, con niveles particularmente altos de optimismo para el futuro de sus hijos entre los que no son ciudadanos y aquellos de Centroamérica.
La mayoría de los inmigrantes hispanos están empleados, pero muchos enfrentan un trato injusto en el lugar de trabajo, incluso aquellos que son ciudadanos, hablan inglés con fluidez y tienen al menos un título universitario. Dos tercios de los inmigrantes hispanos (67%) están trabajando, principalmente en trabajos por hora. A pesar de las altas tasas de empleo, la mayoría tiene ingresos anuales del hogar inferiores a $40,000, lo que lleva a enfrentar desafíos para cubrir necesidades básicas. Entre los inmigrantes hispanos que trabajan, al menos la mitad (55%) informa haber experimentado discriminación en el lugar de trabajo. Incluso entre aquellos que son ciudadanos (45%), hablan inglés con fluidez (41%) y tienen al menos un título universitario (52%), proporciones sustanciales indican que experimentan maltrato en el trabajo porque son inmigrantes.
Entre los dos tercios de inmigrantes hispanos que tienen dominio limitado del inglés (LEP), la mayoría informa enfrentar desafíos relacionados con el idioma. La mayoría (58%) de aquellos con LEP dice que la dificultad para hablar o entender inglés les ha dificultado el acceso a servicios clave o conseguir un trabajo. Los inmigrantes hispanos con LEP también informan tasas más altas de discriminación en el lugar de trabajo y dificultad para entender las leyes de inmigración de Estados Unidos en comparación con aquellos que hablan inglés con fluidez.
Proporciones sustanciales de inmigrantes hispanos, especialmente aquellos que probablemente sean indocumentados, dicen que no tienen suficiente información sobre las leyes y políticas de inmigración de Estados Unidos, se preocupan de que ellos o un familiar puedan ser detenidos o deportados, y tienen confusión sobre las reglas relacionadas con el uso de programas públicos que ayudan a pagar alimentos, vivienda o atención médica. Alrededor de ocho de cada 10 de los inmigrantes hispanos (79%), llegando a nueve de cada 10 entre aquellos que son indocumentados, no están seguros de si usar programas públicos que ayudan a pagar la atención médica, la vivienda o los alimentos puede disminuir las posibilidades de aprobación de la tarjeta de residencia, o creen incorrectamente que esto es así. Cuatro de cada 10 inmigrantes hispanos, incluidos tres cuartos de aquellos que probablemente sean indocumentados, se preocupan de que ellos o un familiar puedan ser detenidos o deportados.
Los inmigrantes hispanos, en especial aquellos que no tienen seguro médico, enfrentan muchos desafíos para acceder a atención médica. En general, uno de cada cuatro inmigrantes hispanos (26%) no tiene seguro médico, pero este porcentaje aumenta a más de la mitad (55%) entre aquellos que probablemente sean indocumentados, en comparación con el 26% de aquellos con una tarjeta de residencia o visa válida y con el 10% de los que son ciudadanos. Aunque la mayoría de los inmigrantes hispanos han buscado y recibido atención médica recientemente en Estados Unidos, aquellos que no tienen seguro son mucho menos propensos que los que tienen cobertura a buscar atención. Solo la mitad (50%) de los inmigrantes hispanos sin seguro han ido a una cita médica en el último año en comparación con más del 80% de aquellos con cobertura. Los inmigrantes hispanos sin seguro también son menos propensos que sus contrapartes con cobertura a tener una fuente habitual de atención y un proveedor de confianza, y son mucho más propensos a informar que han omitido o pospuesto la atención en el último año.
Los centros comunitarios de salud (CHC, por sus siglas en inglés) son el lugar predominante al que los inmigrantes hispanos suelen acudir cuando están enfermos o necesitan consejo médico. Los CHC facilitan el acceso a la atención para aquellos que no tienen seguro. En general, cuatro de cada 10 inmigrantes hispanos (41%) dicen que un CHC es su fuente habitual de atención, con proporciones sustanciales utilizando CHCs con diferentes tipos de seguros, estatus migratorio y dominio del inglés. Los CHCs son una red nacional de proveedores de atención primaria de seguridad social que atienden a comunidades de bajos ingresos y médicamente desatendidas.