Health Provisions in the 2025 Federal Budget Reconciliation Law

Published: Aug 22, 2025

Editorial Note: Originally published Aug. 4, 2025, this summary has been updated to include the CBO’s coverage estimates for the relevant provisions.

Overview

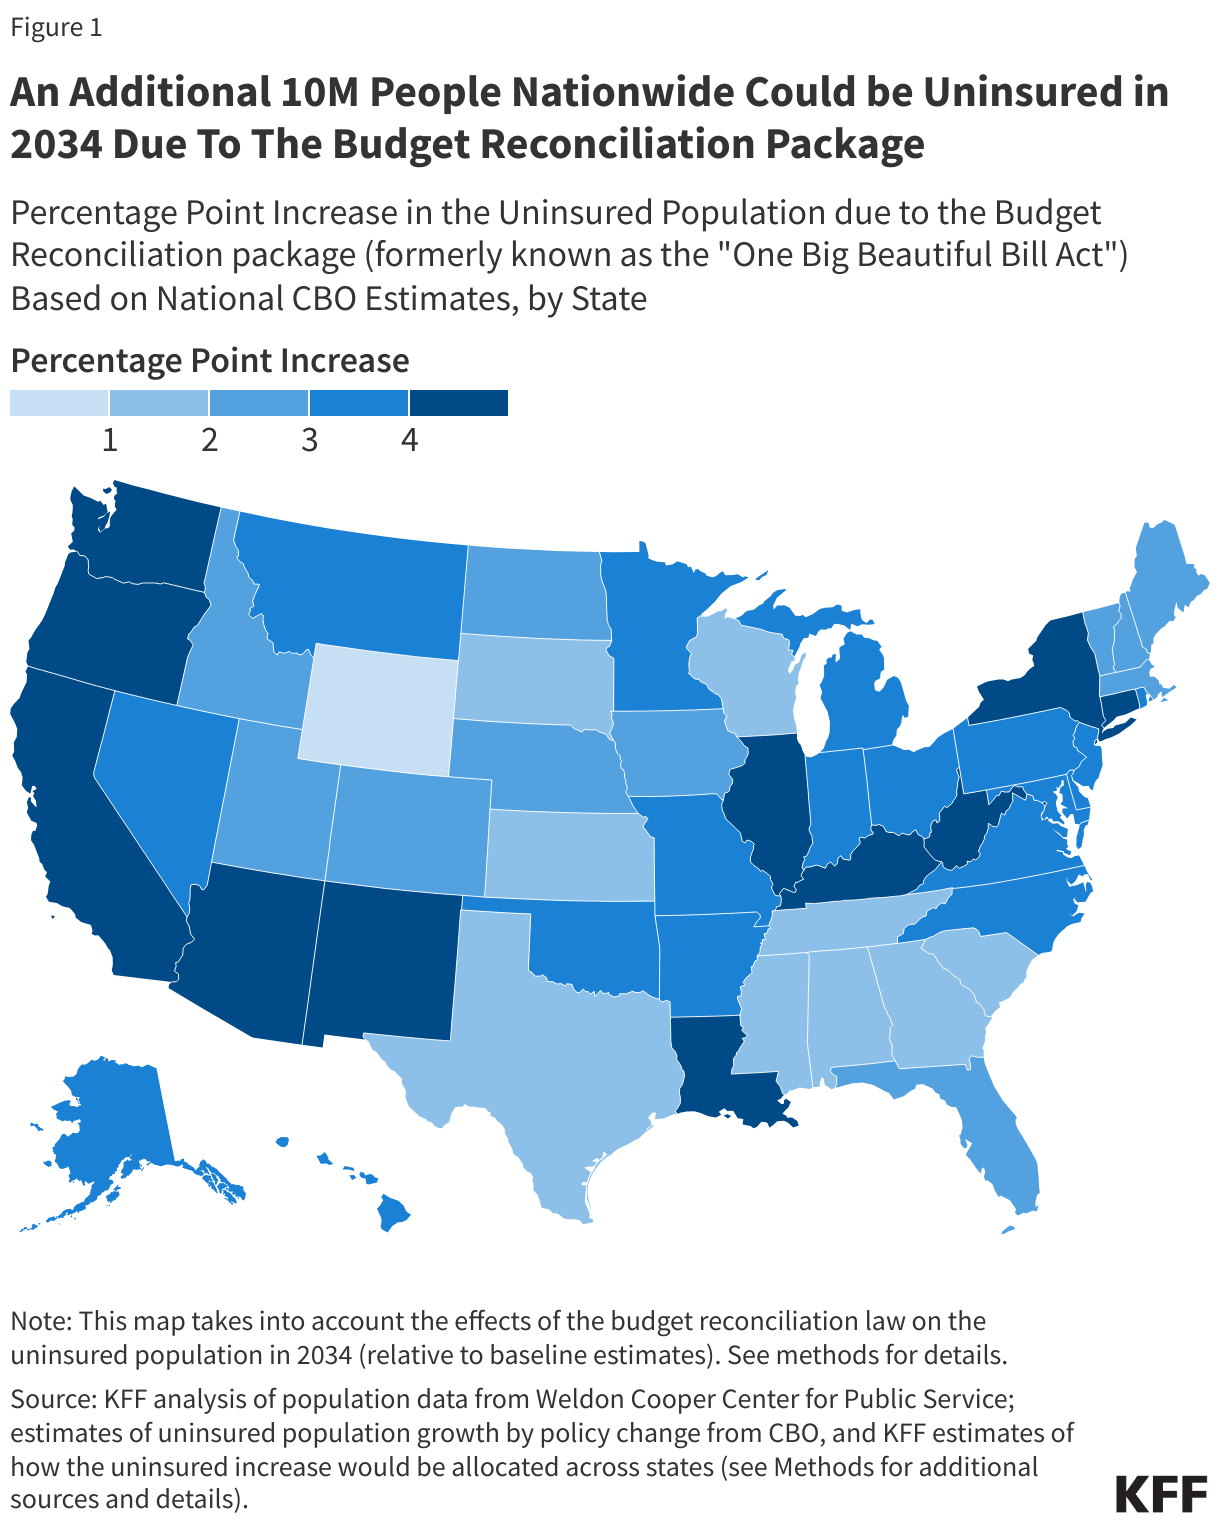
On July 3, the House passed the same version of the budget reconciliation bill that the Senate passed on July 1. On July 4, President Trump signed the bill, previously known as the “One Big Beautiful Bill Act,” into law. This summary describes the health care provisions in four categories: Medicaid, the Affordable Care Act, Medicare and Health Savings Accounts (HSAs). Included are the Congressional Budget Office (CBO) estimates for the impact of each provision (note coverage estimates for each provision will not sum to the law’s total coverage estimate). The CBO has stated the law will reduce federal spending on health care by over $1 trillion and lead to a 10 million increase in the country’s uninsured population.

An implementation timeline of the health provisions is available along with more background and a side-by-side comparison of the House and Senate passed bills.

Medicaid

Eligibility and Cost Sharing Policies

Section 71119: Work Requirements

Background

Prior to passage of the federal budget reconciliation law, Medicaid eligibility could not be conditioned on meeting a work or reporting requirement without obtaining a Medicaid Section 1115 waiver. During the first Trump administration, 13 states received approval to implement work requirements through Section 1115 waivers. Work requirement waiver approvals were either rescinded by the Biden administration or withdrawn by states, and Georgia is the only state with a Medicaid work requirement waiver currently in place. Since the beginning of Trump’s second term, some states have shown renewed interest in pursuing work requirement policies through 1115 waivers.

Description

  • Requires states to condition Medicaid eligibility for individuals ages 19-64 applying for coverage or enrolled through the ACA expansion group (or a waiver) on working or participating in qualifying activities for at least 80 hours per month or attending school at least half-time.
  • Mandates that states exempt certain adults, including parents with children ages 13 and under, those who are medically frail, and those who are participating in a substance use disorder treatment program, from the requirements.
  • Requires states to verify that individuals applying for coverage meet the requirements for 1 and up to a maximum of 3 consecutive months preceding the month of application and that individuals who are enrolled meet the requirements for 1 or more months between the most recent eligibility redeterminations (at least twice per year).
  • Requires states to use data matching “where possible” to verify whether an individual meets the requirement or qualifies for an exemption.
  • Specifies that if a person is denied or disenrolled due to work requirements, they are also ineligible for subsidized Marketplace coverage.
  • Prohibits these provisions from being waived, including under Section 1115 authority.
  • Allows the Secretary to exempt states from compliance with the new requirements until no later than December 31, 2028, if the state is demonstrating a good faith effort to comply and submits progress in compliance or other barriers to compliance.
  • Provides $200 million in funding to states for systems development for FY 2026 and an additional $200 million to HHS to support implementation (for FY 2026).

Effective Date: Not later than December 31, 2026, or earlier at state option.

Budgetary and Coverage Impact

CBO estimates this provision will reduce federal Medicaid spending by $326 billion over 10 years and will increase the number of people who are uninsured by 5.3 million in 2034.

KFF Resources

Section 71107: More Frequent Eligibility Determinations

Background

Under the Affordable Care Act (ACA), states are required to renew eligibility every 12 months for Medicaid enrollees whose eligibility is based on modified adjusted gross income (MAGI), including children, pregnant individuals, parents, and expansion adults. For enrollees whose eligibility is based on age 65+ or disability, states must renew eligibility at least every 12 months . States are required to review eligibility within the 12-month period if they receive information about a change in a beneficiary’s circumstances that may affect eligibility.

Description

  • Requires states to conduct eligibility redeterminations every 6 months for Medicaid expansion adults.
  • Provides $75 million in implementation funding for FY 2026.

Effective Date: For renewals scheduled on or after December 31, 2026.

Budgetary and Coverage Impact

CBO estimates this provision will reduce federal Medicaid spending by $63 billion over 10 years years and will increase the number of people who are uninsured by 700,000 in 2034.

KFF Resources

Section 71103: Verifying Enrollee Address and Other Information

Background

The Eligibility and Enrollment final rule issued in April 2024 requires states to leverage reliable data sources to update enrollee address information, effective June 2025.

Description

  • Requires states to update enrollee address information using reliable data sources, including the National Change of Address Database and managed care entities.
  • Requires the Secretary to establish a system to share information with states for purposes of preventing individuals from being simultaneously enrolled in two states and requires states to submit monthly enrollee SSNs and other information to the system.

Effective Date: January 1, 2027 for states to obtain contact information; October 1, 2029 to establish system to prevent enrollment in two states simultaneously.

Budgetary and Coverage Impact

CBO estimates this provision will reduce federal Medicaid spending by $17 billion over 10 years. This provision is not expected to impact the number of people who are uninsured.

KFF Resources

Section 71104: Ensuring Deceased Individuals Do Not Remain Enrolled

Description

  • Requires states to review the Master Death File at least quarterly to determine if any enrolled individuals are deceased.

Effective Date: January 1, 2027.

Budgetary and Coverage Impact

CBO estimates this provision will not affect federal Medicaid spending over 10 years. This provision is not expected to impact the number of people who are uninsured.

KFF Resources

Section 71102: Eligibility and Enrollment Final Rule

Background

In April 2024, CMS issued a final rule to streamline application and enrollment processes in Medicaid, align renewal policies for all Medicaid enrollees, facilitate transitions between Medicaid, CHIP, and subsidized Marketplace coverage, and eliminate certain barriers in CHIP. Implementation deadlines for states vary across provisions, but many provisions in the rule are already in effect, and for others, states are already in compliance.

Description

  • Prohibits the Secretary from implementing, administering, or enforcing certain provisions that have not yet taken effect in an April 2024 CMS final rule until October 1, 2034.

Effective Date: Upon enactment.

Budgetary and Coverage Impact

CBO estimates this provision will reduce federal Medicaid spending by $56 billion over 10 years and will increase the number of people who are uninsured by 400,000 in 2034.

KFF Resources

Section 71101: Medicare Savings Program Final Rule

Background

In September 2023, CMS issued a final rule to reduce barriers to enrollment in Medicare Savings Programs (MSPs), which provide Medicaid coverage of Medicare premiums and cost sharing for low-income Medicare beneficiaries. Implementation deadlines for states vary across provisions in the rule, but many provisions are already in effect, and for others, states are already in compliance.

Description

  • Prohibits the Secretary from implementing, administering, or enforcing certain provisions in a September 2023 final rule that have not yet taken effect until October 1, 2034.

Effective Date: Upon enactment.

Budgetary and Coverage Impact

CBO estimates this provision will reduce federal Medicaid spending by $66 billion over 10 years. This provision is not expected to impact the number of people who are uninsured.

KFF Resources

Section 71109: Restricting Immigrant Eligibility for Medicaid and CHIP

Background

In addition to meeting other eligibility requirements, lawfully present immigrants must have a “qualified” immigration status to be eligible for Medicaid or CHIP. Qualified immigrants include: lawful permanent residents (LPRs); refugees; individuals granted parole for at least one year; individuals granted asylum or related relief; certain abused spouses and children; certain victims of trafficking; Cuban and Haitian entrants; and citizens of the Freely Associated States (COFA migrants) residing in states and territories. Many lawfully present immigrants must wait five years after obtaining qualified status before they may enroll in Medicaid; states may waive the five-year wait for children and pregnant individuals (referred to as the ICHIA option). Some states have state-only funded coverage programs for undocumented immigrants.

Description

  • Restricts the definition of qualified immigrants for purposes of Medicaid or CHIP eligibility to Lawful Permanent Residents (“green card” holders), certain Cuban and Haitian immigrants, citizens of the Freely Associated States (COFA migrants) lawfully residing in the US, and lawfully residing children and pregnant adults in states that cover them under the ICHIA option.
  • Provides $15 million in implementation funding for FY 2026.

Effective Date: October 1, 2026.

Budgetary and Coverage Impact

CBO estimates this provision will reduce federal Medicaid spending by $6 billion over 10 years and will increase the number of people who are uninsured by 100,000 in 2034.

KFF Resources

Section 71112: Retroactive Coverage

Background

Under current law, states are required to provide Medicaid coverage for qualified medical expenses incurred up to 90 days prior to the date of application for coverage.

Description

  • Limits retroactive coverage to one month prior to application for coverage for individuals enrolled through the Medicaid expansion and two months prior to application for coverage for traditional enrollees.
  • Provides $15 million in implementation funding for FY 2026.

Effective Date: January 1, 2027.

Budgetary and Coverage Impact

CBO estimates this provision will reduce federal Medicaid spending by $4 billion over 10 years and will increase the number of people who are uninsured by 100,000 in 2034.

Section 71120: New Cost Sharing Requirements for Certain Expansion Individuals

Background

States have the option to charge premiums and cost-sharing for Medicaid enrollees within limits, and certain populations and services (emergency, family planning, pregnancy and preventive) are exempt from cost-sharing. Cost-sharing is generally limited to nominal amounts but may be higher for those with income above 100% of the federal poverty level (FPL). Out-of-pocket costs cannot exceed 5% of family income. States may allow providers to deny services to enrollees for nonpayment of copayments.

Description

  • Requires states to impose cost sharing of up to $35 per service on expansion adults with incomes 100-138% FPL; maintains existing exemptions of certain services from cost sharing and exempts primary care, mental health, and substance use disorder services and services provided by federally qualified health centers, behavioral health clinics, and rural health clinics from cost sharing; limits cost sharing for prescription drugs to nominal amounts.
  • Maintains the 5% of family income cap on out-of-pocket costs.
  • Permits states to allow providers to deny services for failure to pay cost sharing but does not prevent providers from reducing or waiving cost sharing.
  • Eliminates enrollment fees or premiums for expansion adults.

Effective Date: October 1, 2028.

Budgetary and Coverage Impact

CBO estimates this provision will reduce federal Medicaid spending by $7 billion over 10 years. This provision is not expected to impact coverage.

KFF Resources

Financing

Section 71115: Provider Taxes

Background

States are permitted to finance the non-federal share of Medicaid spending through multiple sources, including state general funds, health care related taxes (or “provider taxes”), and local government funds. Federal rules specify provider taxes must be broad-based and uniform (i.e., states can’t limit provider taxes to only Medicaid providers) and may not hold providers “harmless” (i.e., guarantee providers receive their money back). The hold harmless requirement does not apply when tax revenues comprise 6% or less of providers’ net patient revenues from treating patients (referred to as the “safe harbor” limit).

Description

  • Prohibits all states from establishing any new provider taxes or from increasing the rates of existing taxes.
  • Reduces the safe harbor limit for states that have adopted the ACA expansion by 0.5% annually starting in fiscal year 2028 until the safe harbor limit reaches 3.5% in FY 2032.
  • Applies the new safe harbor limit in expansion states to state and local government taxes on all providers except nursing facilities and intermediate care facilities.
  • Provides $20 million in implementation funding for FY 2026.

Effective Date: Upon enactment for prohibition of new or increased taxes; October 1, 2027 for reduction in safe harbor limit.

Budgetary and Coverage Impact

CBO estimates this provision will reduce federal Medicaid spending by $191 billion over 10 years and will increase the number of people who are uninsured by 1.1 million in 2034.

KFF Resources

Section 71117: Requirements for Provider Tax Uniformity Waivers

Background

States are permitted to finance the non-federal share of Medicaid spending through multiple sources, including state general funds, health care related taxes (or “provider taxes”), and local government funds. Federal rules specify provider taxes must be broad-based and uniform (i.e., states can’t limit provider taxes to only Medicaid providers) and may not hold providers “harmless” (i.e., guarantee providers receive their money back).

Description

  • Revises the conditions under which states may receive a waiver of the requirement that taxes be broad-based and uniform so that some currently permissible taxes, such as those on managed care plans, will no longer be permissible in future years.
  • Provision overlaps with a proposed rule released May 12, 2025.

Effective Date: Upon enactment; HHS Secretary may provide a transition period of up to three years.

Budgetary and Coverage Impact

CBO estimates this provision will reduce federal Medicaid spending by $35 billion over 10 years and will increase the number of people who are uninsured by 100,000 in 2034.

KFF Resources

Section 71116: State Directed Payments

Background

States are generally not permitted to direct how managed care organizations (MCOs) pay their providers. However, subject to CMS approval, states may use “state directed payments” (SDPs) to require MCOs to pay providers certain rates, make uniform rate increases (that are like fee-for-service supplemental payments), or to use certain payment methods.

A 2024 rule on access to care in Medicaid managed care codified that the upper limit for SDPs is the average commercial rate for hospitals and nursing facilities, which is generally higher than the Medicare payment ceiling used for other Medicaid fee-for-service supplemental payments.

Description

  • Directs HHS to revise Medicaid regulations for state directed payment to cap the total payment rate for inpatient hospital and nursing facility services at 100% of the total published Medicare payment rate for expansion states and at 110% of the total published Medicare payment rate for non-expansion states.
  • Prevents payments approved after May 1, 2025 in excess of the new limits from taking effect unless they are for rural hospitals.
  • Reduces existing payments that are above the allowable Medicare-related payment limit by 10 percentage points each year until they reach the new lower limit.
  • Specifies that in the absence of published Medicare payment rates, the limit is set at the Medicaid fee-for-service payment rate.

Effective Date: Upon enactment for lower limit on new state directed payments; January 1, 2028 for reduction in existing state directed payments above new allowable Medicare-related limit.

Budgetary and Coverage Impact

CBO estimates this provision will reduce federal Medicaid spending by $149 billion over 10 years. This provision is not expected to impact coverage.

KFF Resources

Section 71118: Section 1115 Demonstration Waiver Budget Neutrality

Background

Under long-standing policy and practice, Section 1115 demonstration waivers must be “budget neutral” to the federal government over the course of the waiver. Federal costs under an 1115 waiver may not exceed what they would have been for that state without the waiver. Typically, budget neutrality calculations are determined on a per enrollee basis—so, per enrollee spending over the course of the waiver (usually 5 years) cannot exceed the projected per enrollee spending calculated in the “without-waiver baseline.”

Budget neutrality calculations and the use of “savings” when expenditures decrease on account of the waiver are negotiated between states and CMS and the Office of Management and Budget.

Description

  • Specifies the Chief Actuary for CMS must certify 1115 waivers are not expected to result in an increase in federal expenditures compared to federal expenditures without the waiver.
  • Provides $5 million in implementation funding for each of FY 2026 and FY 2027.

Effective Date: January 1, 2027.

Budgetary and Coverage Impact

CBO estimates this provision will reduce federal Medicaid spending by $3 billion over 10 years. This provision is not expected to impact coverage.

KFF Resources

Section 71106: Payment Reduction for Certain Erroneous Medicaid Payments

Background

Federal law directs CMS to recoup federal funds for erroneous payments made for ineligible individuals and overpayments for eligible individuals if the state’s eligibility “error rate” exceeds 3%. CMS may waive the recoupment if the Medicaid agency has taken steps to demonstrate a “good faith” effort to get below the 3% allowable threshold.

Description

  • Requires HHS to reduce federal financial participation to states for identified improper payment errors related to payments made for ineligible individuals and overpayments made for eligible individuals.
  • Expands the definition of improper payments to include payments where insufficient information is available to confirm eligibility.

Effective Date: October 1, 2029.

Budgetary and Coverage Impact

CBO estimates this provision will reduce federal Medicaid spending by $8 billion over 10 years and will increase the number of people who are uninsured by 100,000 in 2034.

KFF Resources

Medicaid Expansion

Section 71114: Eliminating Temporary Financial Incentive for Medicaid Expansion

Background

The Affordable Care Act expands Medicaid eligibility to non-elderly adults with incomes up to 138% FPL based on modified adjusted gross income and provides 90% federal financing for the expansion population. The Supreme Court effectively made expansion an option for states. The American Rescue Plan Act (ARPA) added a temporary financial incentive for states that newly adopt expansion. Currently, 41 states, including DC, have implemented the Medicaid expansion.

Description

  • Eliminates the temporary incentive for states that newly adopt the Medicaid expansion.

Effective Date: January 1, 2026.

Budgetary and Coverage Impact

CBO estimates this provision will reduce federal Medicaid spending by $14 billion over 10 years and will increase the number of people who are uninsured by 100,000 in 2034.

KFF Resources

Section 71110: Federal Medical Assistance Percentage (FMAP) for Emergency Medicaid

Background

Emergency Medicaid reimburses hospitals for the costs of emergency care provided to immigrants who would qualify for Medicaid except for their immigration status, which hospitals are required to provide under federal law. States receive federal matching payments based on the federal medical assistance percentage (FMAP), which is computed using a formula that takes into account states’ per capita income, for traditional populations; they receive a 90% federal match rate for individuals enrolled in the Medicaid expansion.

Description

  • Limits federal matching payments for Emergency Medicaid for individuals who would otherwise be eligible for expansion coverage except for their immigration status to the state’s regular FMAP.
  • Provides $1 million in implementation funding for FY 2026.

Effective Date: October 1, 2026.

Budgetary and Coverage Impact

CBO estimates this provision will reduce federal Medicaid spending by $28 billion over 10 years. This provision is not expected to impact coverage.

KFF Resources

Long-term Care

Section 71111: Nursing Home Staffing Final Rule

Background

A 2024 Biden-administration final rule requires long-term care facilities (LTC) to meet minimum staffing levels (including a 24/7 RN on-site and a minimum of 3.48 total nurse staffing hours per resident day), requires state Medicaid agencies to report the share of Medicaid payments for institutional LTC that are spent on worker compensation, and provides funding for people to enter careers in nursing homes.

Description

  • Prohibits the Secretary of Health and Human Services from implementing, administering, or enforcing the minimum staffing levels required by the final rule until October 1, 2034.

Effective Date: Upon enactment.

Budgetary and Coverage Impact

CBO estimates this provision will reduce federal Medicaid spending by $23 billion over 10 years. This provision is not expected to impact coverage.

KFF Resources

Section 71108: Home Equity Limits

Background

Most Medicaid enrollees who qualify for Medicaid because they need long-term care (LTC) are subject to limits on their home equity. In 2025, federal rules specified that states’ limits on home equity must be between $730,000 and $1,097,000, and those amounts are updated each year for inflation.

Description

  • Reduces the maximum home equity limits to $1,000,000 regardless of inflation.
  • Allows states to apply different requirements for homes that are located on farms.

Effective Date: January 1, 2028.

Budgetary and Coverage Impact

CBO estimates this provision will reduce federal Medicaid spending by $195 million over 10 years. This provision is not expected to impact the number of people who are uninsured.

KFF Resources

Section 71121: New Home and Community Based Services (HCBS)

Background

States are required to cover nursing facility care under Medicaid, but nearly all home care (HCBS) is optional. Nearly all states provide home care through “1915(c) waivers,” which limit services to people who require an institutional level of care. Because those services are optional, states may limit the amount of care people receive and the number of people receiving services. Most states have waiting lists because the number of people seeking services exceeds the amount of care available.

Description

  • Allows states to establish 1915(c) HCBS waivers for people who do not need an institutional level of care.
  • Requires state waiver submissions to demonstrate that new waivers will not increase the average amount of time that people who need an institutional level of care will wait for services.
  • Includes $50 million in FY 2026 and $100 million in FY 2027 for implementation.

Effective Date: July 1, 2028 for new waiver approvals.

Budgetary and Coverage Impact

CBO estimates this provision will increase federal Medicaid spending by $7 billion over 10 years. This provision is not expected to impact the number of people who are uninsured.

KFF Resources

Access

Section 71401: Rural Health Transformation Program

Description

  • Establishes a rural health transformation program that will provide $50 billion in grants to states between fiscal years 2026 and 2030, to be used for payments to rural health care providers and for other purposes.
  • Distributes 50% of payments equally across states with approved applications; the remaining funds will be distributed by CMS based at least in part on states’ rural populations that live in metropolitan statistical areas, the percent of rural health facilities nationwide that are located in a state, and the situation of hospitals that serve a disproportionate number of low-income patients with special needs.
  • Uses of funds include promoting care interventions, paying for health care services, expanding the rural health workforce, and providing technical or operational assistance aimed at system transformation.
  • Provides CMS with $200 million in implementation funding for FY 2025.

Effective Date: Upon enactment but funding is first available in fiscal year 2026. CMS to determine state application deadline, which will be no later than December 31, 2025.

Budgetary and Coverage Impact

CBO estimates this provision will increase federal spending by $47 billion over 10 years. This provision is not expected to impact coverage.

KFF Resources

Section 71113: Prohibiting Federal Medicaid Payments to Certain Providers

Background

States must generally allow beneficiaries to obtain Medicaid services from any provider that is qualified and willing to furnish services. Managed care organizations (MCOs) may restrict enrollees to providers in the MCO’s network, except that such plans cannot restrict free choice of family planning providers.

Description

  • Prohibits federal Medicaid funds to be paid to providers that meet the following criteria on October 1, 2025: are nonprofit organizations, essential community providers primarily engaged in family planning services or reproductive services, provide for abortions outside of the Hyde exceptions and received $800,000 or more in payments from Medicaid in 2023; this would affect Planned Parenthood and other Medicaid essential community providers.
  • Provides $1 million in implementation funding for FY 2026.

Effective Date: Upon enactment for 1 year; implementation is currently blocked for some providers due to ongoing litigation.

Budgetary and Coverage Impact

CBO estimates this provision will increase federal spending by $53 million over 10 years. This provision is not expected to impact coverage.

KFF Resources

Section 71105: Medicaid Provider Screening Requirements

Background

Provider screening and enrollment is required for all providers in Medicaid fee-for-service or managed care networks. Additionally, the ACA requires states to terminate provider participation in Medicaid if the provider was terminated under Medicare or another state program. CMS has multiple tools to assist states with provider screening and enrollment compliance, including leveraging Medicare data.

Description

  • Requires states to conduct checks at provider enrollment or reenrollment and on a quarterly basis of the Social Security Administration’s Death Master File to determine whether providers enrolled in Medicaid are deceased.

Effective Date: January 1, 2028.

Budgetary and Coverage Impact

CBO estimates this provision will not affect federal Medicaid spending over 10 years. This provision is not expected to impact coverage.

KFF Resources

Affordable Care Act

Sec. 71303: Pre-Enrollment Verification of Eligibility for Premium Tax Credit

Background

Currently, new enrollees are granted conditional eligibility if there is a mismatch in the information they provided and that in federal databases. Enrollees can retain coverage and tax credits for up to 90 days while submitting verification documents. Returning enrollees who take no action during open enrollment are auto-renewed into the same or similar plan. Nearly half of Marketplace enrollees in 2025 auto-renewed.

Description

  • Requires verification of household income, health coverage status or eligibility for coverage, place of residence, family size, status as an eligible alien, and any other information that the Secretary of Health and Human Services deems necessary are verified before coverage.
  • Exchanges can use any third-party sources and any available data for verification.
  • Consumers can still enroll in a plan but cannot receive premium tax credits or cost-sharing reductions (CSRs) until after they verify their eligibility.
  • This provision effectively ends auto-renewals.
  • Restricts premium tax credit eligibility for enrollees who fail to file and reconcile their premium tax credits for one year.
  • Restricts premium tax credit eligibility for enrollees who fail to file and reconcile their premium tax credits for one year.

Effective date: Taxable years beginning after December 31, 2027.

Budgetary and Coverage Impact

Decreases budgetary spending by $36.9 billion and increases revenue by $4.4 billion through 2034 and will increase the number of people who are uninsured by 700,000 in 2034.

KFF Resources

Sec. 71305: Recapture of Excess Premium Tax Credits

Background

Currently, if an enrollee receives excess premium tax credits because their estimated income was lower than their actual income, they must repay the excess. However, for most enrollees, there is a repayment cap that varies based on household income. For enrollees with household incomes at least 400% of the federal poverty level (FPL), there is no limit. They must repay the entirety of their excess tax credit. Other repayment limits vary from $375 for a single person with an income that is 100% FPL up to 200% FPL to $3,250 for families with an income between 300%-400% FPL for tax year 2025.

Description

  • Requires that all premium tax credit recipients repay the full amount of any excess, no matter their income.

Effective date: taxable years beginning after December 31, 2025.

Budgetary and Coverage Impact

Decreases budgetary spending by $17.3 billion and increases revenue by $2.3 billion through 2034 and will increase the number of people who are uninsured by 100,000 in 2034.

KFF Resources

Sec. 71301: ACA Marketplace Coverage Eligibility for Lawfully Present Immigrants

Background

Currently, U.S. citizens and lawfully present immigrants are eligible to enroll in ACA Marketplace coverage and receive premium subsidies and cost-sharing reductions.

Description

  • Limit eligibility for subsidized ACA Marketplace coverage to lawfully present immigrants who are lawful permanent residents (LPRs or “green card” holders), Compact of Free Association (COFA) migrants residing in the U.S., or Cuban and Haitian entrants as defined in section 501(e) of the Refugee Education Assistance Act of 1980, eliminating eligibility for many lawfully present immigrants including refugees, asylees, and people with Temporary Protected Status.

Effective date: Taxable years beginning after December 31, 2026.

Budgetary and Coverage Impact

Decreases budgetary spending by $69.8 billion and increases revenue by $4.8 billion through 2034 and will increase the number of people who are uninsured by 900,000 in 2034.

KFF Resources

Sec. 71302: Premium Tax Credit Eligibility for Lawfully Present Immigrants Ineligible for Medicaid

Background

Currently, lawfully present immigrants with incomes under 100% of the federal poverty level (FPL) who do not qualify for Medicaid coverage due to their immigration status also are eligible for ACA Marketplace coverage.

Description

  • Prohibits lawfully present immigrants ineligible for Medicaid due to immigrant status from receiving tax credits if making below 100% of poverty.

Effective Date: taxable years beginning after December 31, 2025.

Budgetary and Coverage Impact

Decreases budgetary spending by $49.5 billion and increases revenue by $176 million through 2034 and will increase the number of people who are uninsured by 300,000 in 2034.

KFF Resources

Sec. 71304: Special Enrollment Periods (SEPs) and Tax Credit Eligibility

Background

In addition to qualifying life events (QLEs) that enable eligibility for an SEP, people in states that use Federally-Facilitated Marketplaces (FFM) and make no more than 150% of the federal poverty level can apply for a year-round SEP to sign up for coverage. Some state-based exchanges also offer SEPs that are based on the relationship of people’s income to the poverty line. Any person who enrolls in a plan via an SEP is eligible for both premium tax credits and cost-sharing reductions (CSRs). In 2025, enrollees with an income of less than 150% of the federal poverty line made up the largest share of all Marketplace enrollees (47%).

Description

  • Bars any consumer who enrolls in a plan via a non-qualifying life event (QLE) SEP from receiving either premium tax credits or CSRs.

Effective date: Plan years beginning after December 31, 2025.

Budgetary and Coverage Impact

Decreases budgetary spending by $39.5 billion and increases revenue by $1.3 billion through 2034 and will increase the number of people who are uninsured by 400,000 in 2034.

KFF Resources

Expiration of Enhanced Premium Tax Credits

Background

The enhanced premium tax credits were first made available as part of the American Rescue Plan Act in 2021 and later extended through the end of 2025 as part of the Inflation Reduction Act. The ARPA and IRA’s enhanced health insurance tax credits both increase the amount of financial help available to those already eligible for assistance under the ACA and also newly expand subsidies to middle-income people (with incomes over four times the poverty level), many of whom were previously priced out of coverage. These enhanced tax credits, combined with increased funding for outreach and marketing have led to record-high enrollment in the ACA Marketplaces.

Description

  • There was no extension of the enhanced tax credits in the law. The Republican-led Senate opted to use a “current law” baseline for Congressional Budget Office scoring of the budget impact. Therefore, the expiration of the enhanced tax credits was not scored as a new policy change and has no impact in the law’s official budget and coverage estimates.
  • The number of uninsured people will rise by 4.2 million through 2034, and gross benchmark premiums will increase by 7.9% through 2034 without an extension. Permanent extension would increase the budget deficit by $335 billion through 2034.

Effective date: January 1, 2026 (unless extended by Congress).

KFF Resources

Medicare

Eligibility Policies

Section 71201: Limiting Medicare Coverage of Certain Individuals

Background

Prior to passage of the law, residents of the United States, including citizens, permanent residents, and other immigrants that are lawfully present in the country, were eligible for premium-free Medicare Part A if they or their spouses have worked in a job for at least 40 quarters where they paid Medicare payroll taxes and are at least 65 years old. People under age 65 with a qualifying disability, end-stage renal disease (ESRD), and amyotrophic lateral sclerosis (ALS) are also generally eligible. Legal immigrants age 65 or older who do not have this work history could purchase Medicare Part A after residing legally in the U.S. for five years continuously.

Description

  • Restricts Medicare eligibility to U.S. citizens, green card holders, Cuban-Haitian entrants, and people residing under the Compacts of Free Association, eliminating Medicare eligibility for people not included in these groups, such as those with temporary protected status and refugees and asylees.
  • Terminates Medicare coverage no later than 18 months from enactment for anyone who is currently covered but no longer eligible under these changes.

Effective Date: Upon enactment.

Budgetary and Coverage Impact

CBO estimates this provision will reduce Medicare spending by $5.1 billion over 10 years and will increase the number of people who are uninsured by 100,000 in 2034.

KFF Resources

Section 71101: Moratorium on Implementation of Rule Relating to Eligibility and Enrollment in Medicare Savings Programs

Background

In September 2023, CMS issued a final rule to reduce barriers to enrollment in Medicare Savings Programs (MSPs), which provides Medicaid coverage of Medicare premiums and cost sharing for low-income Medicare beneficiaries. Implementation deadlines for states vary across provisions in the rule, but some provisions are already in effect, and for others, states are already in compliance.

Description

  • Prohibits the Secretary from implementing, administering, or enforcing certain provisions in a September 2023 CMS final rule that have not yet taken effect until October 1, 2034.

Effective Date: Upon enactment.

Budgetary and Coverage Impact

CBO estimates the moratorium on this rule will reduce federal Medicaid spending by $66 billion over 10 years due to lower enrollment in the Medicare Savings Programs than if all the provisions of the rule were implemented and enforced. CBO has not provided an updated estimate of how many fewer dual-eligible individuals will be enrolled in Medicaid.

KFF Resources

Physician Payment

Section 71202: Temporary Payment Increase Under the Medicare Physician Fee Schedule

Background

Medicare payment rates to physicians and other clinicians under the Physician Fee Schedule are determined in part by a scaling factor, known as the conversion factor, which is updated each year. Under current law, conversion factor updates are based on statutory factors and other budgetary requirements. Beginning in 2026, the Physician Fee Schedule conversion factor was scheduled to increase by 0.25% each year for most Medicare providers.

Description

  • Provides a temporary one-year increase of 2.5% to the Physician Fee Schedule conversion factor for all services furnished between January 1, 2026 and January 1, 2027.

Effective Date: January 1, 2026.

Budgetary and Coverage Impact

The CBO estimates that this change will increase Medicare spending by $1.9 billion in 2026 and 2027. This provision is not expected to impact coverage.

KFF Resources

Prescription Drugs

Section 71203: Expanding and clarifying the exclusion for orphan drugs under the Drug Price Negotiation Program

Background

Under the Medicare Drug Price Negotiation Program, drugs qualify for price negotiation if they are single source brand-name drugs or biological products without therapeutically equivalent generic or biosimilar alternatives, and are at least 7 years (for small-molecule drugs) or 11 years (for biologics) past the FDA approval or licensure date, as of the date that the list of drugs selected for negotiation is published. Under the Inflation Reduction Act of 2022, the law that established the drug price negotiation program, drugs designated for only one rare disease or condition and approved for an indication (or indications) only for that disease or condition were exempt from negotiation. This is known as the orphan drug exclusion.

Description

  • Modifies the orphan drug exclusion of the Medicare drug price negotiation program to exclude drugs from negotiation that are designated for one or more rare diseases or conditions and where the only approved indication or indications are for one or more rare diseases or conditions, rather than only one rare disease or condition.
  • Excludes the period of time that drugs are on the market with only one or more orphan indications from the 7-year or 11-year waiting period that determines a drug’s eligibility for selection for price negotiation.

Effective Date: applies for drug price selection beginning in February 2026 for negotiated prices available on or after January 1, 2028.

Budgetary and Coverage Impact

The CBO estimates that this change will increase Medicare spending by $4.9 billion over 10 years. This provision is not expected to impact coverage.

KFF Resources

Long-term Care

Section 71111: Moratorium on Implementation of Nursing Home Staffing Final Rule

Background

A 2024 Biden administration final rule requires long-term care facilities (LTC) to meet minimum staffing levels (including a 24/7 RN on-site and a minimum of 3.48 total nurse staffing hours per resident day), requires state Medicaid agencies to report the share of Medicaid payments for institutional LTC that are spent on worker compensation, and provides funding for people to enter careers in nursing homes.

On April 7, 2025, the US District Court for Northern Texas ruled to overturn the minimum staffing requirements, and it is expected that the Administration will not appeal that decision.

Description

  • Prohibits the Secretary of Health and Human Services from implementing, administering, or enforcing the minimum staffing levels required by the final rule until October 1, 2034.

Effective Date: Upon enactment.

Budgetary and Coverage Impact

The CBO estimates the moratorium of this rule will reduce federal spending by $23 billion over 10 years. This provision is not expected to impact coverage.

KFF Resources

Health Savings Accounts

Section 71306. Permanent Extension of Safe Harbor for Absence of Deductible for Telehealth Services

Background

Health savings accounts (HSAs) are tax-advantaged savings accounts that enrollees in certain high-deductible health plans (HDHPs) can use to pay for qualified medical expenses. Enrollees must pay all medical costs, except for certain preventive services and insulin products, out-of-pocket until they reach the deductible. Individuals cannot have other health coverage in order to be eligible for an HDHP with an HSA. In response to the COVID pandemic, federal law permitted HSA-eligible HDHPs to cover telehealth and other remote services before the deductible until the end of 2024.

Description

  • Permanently allows HDHPs with an HSA to cover telehealth and other remote services before the enrollee meets the deductible.
  • Individuals that have other coverage for telehealth and other remote care services will still be eligible for an HDHP with an HSA.

Effective date: Plan years beginning after December 31, 2024.

Budgetary and Coverage Impact

The CBO and JCT estimate a decrease in revenue of $4.3 billion through 2034. This provision is not expected to impact the number of people who are uninsured.

KFF Resources

Section 71307. Allowance of Bronze and Catastrophic Plans in Connection with Health Savings Accounts

Background

ACA-compliant health insurance plans are categorized into “metal levels” based on the amount of cost sharing they require. Some bronze plans meet the deductible requirements to be paired with an HSA (the out-of-pocket maximum or other design features might not meet IRS rules though). Catastrophic plans, which have the highest cost sharing and are only available to people under age 30 or those who cannot find other affordable ACA-compliant coverage, are ineligible to be paired with an HSA.

Description

  • Treats bronze and catastrophic plans sold on the ACA Marketplace as HDHPs that can be paired with an HSA.

Effective date: January 1, 2026.

Budgetary and Coverage Impact

The CBO and JCT estimate a decrease in revenue of over $3.5 billion through 2034. This provision is not expected to impact the number of people who are uninsured.

KFF Resources

Section 71308. Treatment of Direct Primary Care Arrangements

Background

Direct primary care (DPC) arrangements typically offer unlimited primary care services to patients in exchange for a periodic fee paid to the DPC practice. Current law may treat DPC arrangements as a health plan under certain circumstances, making an individual covered by a DPC arrangement ineligible to use an HSA.

Description

  • Certain DPC arrangements will not be considered health plans, allowing individuals covered by these arrangements to be eligible for an HSA. This will apply if the only compensation for the DPC is a fixed periodic fee that does not exceed $150 monthly, or $300 monthly where more than one individual is covered.
  • For the purposes of this provision, DPC arrangements not considered health plans are limited to those only offering primary care services, and do not include:
  • services that require general anesthesia;
  • prescription drugs, except for vaccines, and;
  • laboratory services not typically administered in an ambulatory primary care setting.
  • Treats fees paid for any DPC arrangement as a medical expense (not the payment of insurance) that can be paid for with HSA funds.

Effective date: January 1, 2026.

Budgetary and Coverage Impact

The CBO and JCT estimate a decrease in revenue of over $2.8 billion through 2034. This provision is not expected to impact the number of people who are uninsured.

KFF Resources

Health Costs Consume a Large Portion of Income for Millions of People with Medicare

Authors: Nancy Ochieng, Juliette Cubanski, Tricia Neuman, and Anthony Damico
Published: Aug 21, 2025

Medicare and Social Security play a central role in the lives of tens of millions of older adults and people with disabilities in the U.S., in the form of health insurance from Medicare and retirement or disability income from Social Security. Yet, even with Medicare coverage, beneficiaries can face substantial out-of-pocket health care costs, which can erode the financial support provided by Social Security. Medicare Part B and D premiums and cost sharing alone account for nearly one-fourth of average monthly Social Security benefits, not taking into account other health care expenses, such as dental services, home care, or care in a nursing home, or premiums for supplemental coverage. While most Medicare beneficiaries have other sources of income in addition to Social Security, more than one third of Social Security recipients age 65 and older rely on Social Security for half or more their income. Additionally, many Medicare beneficiaries live on relatively low incomes: one in four Medicare beneficiaries had income below $21,000 per person in 2023, while half had income below $36,000 per person.

Medicare beneficiaries with low incomes and limited financial resources can get help paying for out-of-pocket costs and services not covered by Medicare if they qualify for and receive full Medicaid benefits, which covers long-term care, vision, and dental care. They can also receive help if they are enrolled in the Medicare Savings Programs, which pay for Medicare’s premiums and, in most cases, cost-sharing requirements. However, the recently enacted tax and spending bill includes provisions that are projected to result in fewer low-income Medicare beneficiaries accessing these benefits, and reduce household resources for individuals in the bottom of the income distribution, including households with Medicare beneficiaries. And even today, not all low-income Medicare beneficiaries who are eligible for these benefits are receiving them, while others may have income or assets just above the qualifying thresholds.

To document the affordability challenges posed by out-of-pocket health care costs for people with Medicare, this brief analyzes out-of-pocket health care costs as a share of Social Security income and total income, including other sources of income in addition to Social Security. Due to differences in the underlying data sources, the analysis presents average out-of-pocket spending as a share of average Social Security income on a per person basis, and a broader range of measures – average, median, 75th and 90th percentile – for out-of-pocket spending as a share of total income. (See Methods for more details and data sources).

Out-of-pocket health care spending by Medicare beneficiaries accounted for 39% of Social Security income per person in 2022, on average

In 2022, Medicare beneficiaries spent a total of $6,330 out of pocket on health care costs, on average, including premiums for Medicare and costs for Medicare-covered services and services Medicare doesn’t cover, like dental, vision, and hearing services and long-term services and supports, while average per capita income from Social Security was $16,157 (Figure 1, Appendix Table 1).

Figure 1

Medicare beneficiaries spent 11% of their total per capita income on out-of-pocket health care costs, on average, but 1 in 4 beneficiaries spent at least 21% and 1 in 10 beneficiaries spent 39% or more

Taking into account other sources of income in addition to Social Security, out-of-pocket spending on health care amounted to 11% of total per capita income for Medicare beneficiaries in 2022, on average (Figure 2). Out-of-pocket health care costs represent a smaller share of total income than Social Security income because most beneficiaries have other sources of income, such as pensions, 401ks, or income from savings. In 2022, Social Security income accounted for 29% of total income per Medicare beneficiary, on average. Out-of-pocket spending consumed a larger share of income for some Medicare beneficiaries, with one in four (15 million beneficiaries) spending 21% or more and one in 10 (6 million) spending 39% or more.

Figure 2

The health care spending burden is higher for some Medicare beneficiaries, including those with lower incomes and those ages 85 and older

On average, out-of-pocket health care costs accounted for a substantially larger share of per capita total income among Medicare beneficiaries with lower incomes than higher incomes (34% among beneficiaries with incomes of $10,000 or less vs. 7% among beneficiaries with incomes greater than $50,000) (Figure 3). While Medicare beneficiaries with lower incomes have lower out-of-pocket health care costs than higher income beneficiaries, on average, their out-of-pocket costs account for a larger share of their lower incomes. Assistance from Medicaid and the Medicare Savings Program can help limit out-of-pocket spending for Medicare beneficiaries with the lowest incomes, but not all low-income beneficiaries qualify for or receive help from these programs. Without some form of financial assistance, lower-income beneficiaries may be more likely to forego needed care since they are less likely than higher-income beneficiaries to be able to afford services with high cost-sharing requirements or services not covered by Medicare, like dental services or long-term services and supports.

Medicare beneficiaries ages 85 and older spent a larger share of their income on out-of-pocket health care costs than younger beneficiaries (22% vs. 9% among beneficiaries ages 65-74), on average. Medicare beneficiaries ages 85 and older have much higher average out-of-pocket health care costs than those ages 65-74, largely due to higher out-of-pocket spending on long-term care, which accounts for more than half of total out-of-pocket spending on all services for those ages 85 and older. Beneficiaries in the oldest age cohort also have lower per capita total income than younger aged beneficiaries, on average, likely due in part to lower income from earnings after retirement. (For details on additional demographic groups, see Appendix Table 1 and Table 2).

Interactive DataWrapper Embed

Methods

Data on out-of-pocket health care spending is from the Centers for Medicare & Medicaid Services (CMS) Medicare Current Beneficiary Survey, 2022 Cost Supplement File (the most recent year of data available). The sample includes 59.9 million people with Medicare in 2022 (weighted), including beneficiaries in traditional Medicare and Medicare Advantage and those living in the community and in facilities, excluding beneficiaries who were enrolled in Part A only or Part B only for most of their Medicare enrollment in 2022 and beneficiaries who had Medicare as a secondary payer.

The Cost Supplement File links Medicare claims to survey information reported directly by beneficiaries. The file collects out-of-pocket information on inpatient and outpatient hospital care, physician and other medical provider services, home health services, durable medical equipment, long-term and skilled nursing facility services, hospice services, dental services, hearing services, vision services, and prescription drugs.

Survey-reported out-of-pocket payments are those payments made by the beneficiary or their family, including direct cash payments and Social Security or Supplemental Security Income (SSI) checks paid directly to nursing homes. Out-of-pocket spending on premiums is derived from administrative data on Medicare Part A, Part B, Part C (Medicare Advantage), and Part D premiums paid by each sample person along with survey-reported estimates of premium spending for other types of health insurance beneficiaries may have (including Medigap, employer-sponsored insurance, and other public and private sources).

Starting in 2019, the MCBS introduced an imputation method that uses Medicare Advantage encounter data to improve estimation of medical events and costs for Medicare Advantage enrollees and account for unreported Medicare Advantage utilization. Because data for Medicare Advantage enrollees is imputed, estimates of total average out-of-pocket spending in this analysis may be conservative.

Income data are based on both beneficiaries’ self-reported income in the MCBS and estimates from the Urban Institute’s Dynamic Simulation of Income Model (DYNASIM4). DYNASIM4 is a dynamic microsimulation model that projects the population and analyzes the long-term distributional consequences of retirement and aging issues. DYNASIM4 takes into account income from all sources, including Social Security, wages, pensions, and asset income including withdrawals from IRAs. The simulation is aligned to the 2024 Social Security Trustees’ intermediate cost economic and demographic projections.  DYNASIM4 generates average and percentiles of per capita Social Security and total income for specific demographic groups. It calculates average per capita Social Security and total income for married couples by dividing income for the couple by two. KFF adjusts beneficiaries’ self-reported income in the MCBS with estimates from DYNASIM to adjust for under-reporting of income from certain sources.

For average out-of-pocket spending as a share of average per capita Social Security and average per capita total income, this analysis uses average per capita out-of-pocket spending from the MCBS and average per capita Social Security and total income from DYNASIM. Percentile values of out-of-pocket spending as a share of total income (median, 75th, and 90th) are calculated from MCBS data on out-of-pocket spending and DYNASIM-adjusted income values in the MCBS.

This work was supported in part by AARP Public Policy Institute. KFF maintains full editorial control over all of its policy analysis, polling, and journalism activities.

Nancy Ochieng, Juliette Cubanski, and Tricia Neuman are with KFF. Anthony Damico is an independent consultant.

Appendix Tables

Interactive DataWrapper Embed

How Will the 2025 Reconciliation Law Affect the Uninsured Rate in Each State?

Allocating CBO’s Estimates of Additional Uninsured People Across the States

Published: Aug 20, 2025

Editorial Note

Originally published in June, this brief was updated on August 20 to reflect new CBO estimates of the reconciliation law’s impact.

President Trump signed into law on July 4, 2025 a budget reconciliation package (formerly called the “One Big Beautiful Bill Act”) that will make significant changes to Medicaid and the Affordable Care Act (ACA) Marketplaces. The Congressional Budget Office (CBO) estimates that, relative to its estimates of insurance coverage prior to the law being enacted, the law will increase the number of people without health insurance in 2034 by 10 million, because of changes to Medicaid (7.5 million), the ACA Marketplaces (2.1 million), and other policies and interactions among different provisions (0.4 million). These legislative changes come at a time when enhanced premium tax credits for ACA Marketplace enrollees are set to expire later this year. When combining the impact of the reconciliation law with that of the expected expiration of the ACA’s enhanced premium tax credits, CBO estimates show that the number of uninsured people will increase by more than 14 million in 2034. That estimate does not account for the effects of the Trump administration’s ACA Marketplace Integrity and Affordability rule finalized earlier this year, so the overall change in the number of uninsured people could be even larger.

This analysis apportions the increase in the number of uninsured across the 50 states and the District of Columbia and shows that number as a percentage of each state’s population. The number of additional uninsured people as a percent of the population is equivalent to the percentage point increase in the 2034 uninsured rate. Nationally, CBO projected an uninsured rate of under 10% in 2034 under current law, which assumed the enhanced ACA premium tax credits would expire. The analysis here includes two maps: one showing the effects of the reconciliation law, and another showing those effects combined with expiration of the ACA enhanced premium tax credits. (The ACA Marketplace Integrity and Affordability rule is expected to contribute to increases in the uninsured, though estimates of the finalized rule have not been released by CBO.)

Anticipating how states will respond to changes in Medicaid policy is a major source of uncertainty in CBO’s cost estimates. Instead of making state-by-state predictions about policy responses, CBO estimates the percentage of the affected population that lives in states with different types of policy responses. For example, in the reconciliation law, Medicaid work requirements account for more than half of CBO’s estimated 2034 increase in the number of people without insurance because of changes to Medicaid. However, different states might choose to implement a work requirement with reporting requirements that are easier or harder for enrollees to comply with. Reflecting the uncertainty, this analysis illustrates the potential variation by showing a range of enrollment effects in each state, varying by plus or minus 25% from a midpoint estimate.

The interactive table at the end is sortable by state and size of increase in the uninsured rate.

Interactive DataWrapper Embed

Relative to current law, the reconciliation law is estimated to increase the uninsured rate by 3 percentage points or more in 20 states (Alaska, Arizona, Arkansas, California, Connecticut, Delaware, Illinois, Indiana, Kentucky, Louisiana, Montana, New Jersey, New Mexico, New York, Oklahoma, Oregon, Rhode Island, Virginia, Washington, West Virginia) and the District of Columbia. These increases are attributable to the reconciliation law alone and do not include the effects of the expiration of the enhanced premium tax credits or the proposed Marketplace integrity rule.

In terms of increases in the number of uninsured people, California and New York are the top two states (1.6M and 860k, respectively). Florida, Texas, and Illinois would follow at 590k, 480k, and 470k, respectively.

Interactive DataWrapper Embed

The combined effects of the budget law and the expiration of the ACA enhanced tax credits, compared to a scenario where the enhanced subsidies are in place, results in the greatest increases in Louisiana, Florida and Arizona, where the uninsured rate is expected to increase by at least 5 percentage points. In 34 states and the District of Columbia, the uninsured rates could be 3 percentage points or more higher than would otherwise be the case.

About half (49%) of the 14.2 million more people who would be uninsured in this scenario live in California (1.7M), Florida (1.5M), Texas (1.4M), New York (860k), Illinois (520k), Georgia (500k) and Ohio (460k). The largest growth in ACA Marketplace enrollment since 2020, the year before the enhanced premium tax credits became available, occurred in 3 of these states: Texas (2.8M), Florida (2.8M), and Georgia (1.0M).

Additional increases in the number of uninsured people in 2034 can also be attributable to the implementation of the finalized ACA Marketplace Integrity and Affordability rule. CBO has not released estimates for the finalized rule, so those effects are excluded from this analysis. In prior estimates, CBO allocated half of the 1.8 million increase in the uninsured due to the proposed Marketplace Integrity and Affordability rule to its baseline while they allocated the remainder into the Energy and Commerce section of the budget reconciliation bill. CMS estimates that in 2026, the finalized rule will lead to an increase in the number of uninsured people of between 725 thousand and 1.8 million. Many of the key provisions that impact enrollment processes will sunset at the end of 2026, so decreases in coverage from the rule in subsequent years are anticipated to be lower.

Methods

Increases in the number of uninsured were sourced from Congressional Budget Office (CBO) estimates, separated into three groups: those newly uninsured because of changes in Medicaid, those newly uninsured because of changes in the Affordable Care Act exchanges, and others.

Changes in Medicaid: CBO estimates that changes in Medicaid from the budget law are expected to decrease the number of people with health insurance by 7.5 million in 2034, relative to estimated coverage prior to the bill’s enactment. The CBO estimates show the uninsured increases provision by provision and KFF allocates each provision’s increase across the states proportionally to that provision’s estimated reduction in federal Medicaid spending from a prior KFF analysis. Additional details are in the prior analysis but in general, changes that would affect the ACA expansion group only, including work requirements, are allocated across expansion states proportionally to federal spending among people eligible for the ACA expansion in FY 2024.  Provider tax provisions are allocated across the states using several steps that account for the different provider taxes states had in place prior to the bill’s enactment. Other provisions are allocated proportionally to states’ share of federal Medicaid spending in FY 2024. The sum of each provision’s increased in the number of uninsured people led to 8.0 million, which is more than the 7.5 million total, so each provision’s change was reduced by roughly 6% so that the provision-specific estimates would sum to 7.5 million. Data sources include:

Changes in the ACA Marketplaces:  Increases in the uninsured population are taken from Congressional Budget Office estimates. Impacts of individual provisions within the budget reconciliation law are separately apportioned to calculate state-level estimates.

ProvisionAllocation MethodSource
Tax credit restrictions for immigrantsShare of noncitizens with direct-purchase health insuranceKFF analysis of 2023 American Community Survey (ACS) data
Eligibility verification requirementsShare of 2025 Marketplace enrollmentOpen Enrollment Period Public Use Files
Prohibiting tax credit eligibility for non-qualifying life event SEP enrolleesShare of low-income enrollment (at or below 150% FPL) excluding the District of Columbia and states with Basic Health Programs or equivalent (MN, NY, OR)Open Enrollment Period Public Use Files
Eliminating limits on excess premium tax credit repaymentsShare of 2025 Marketplace enrollmentOpen Enrollment Period Public Use Files

Growth of the uninsured population due to the expiration of enhanced premium tax credits was allocated at the state level by share of growth in Marketplace enrollment between 2020 and 2025, based on the open enrollment period public use files. Due to rounding in the CBO estimates, increases in the uninsured due to individual provisions have been scaled to sum up to the totals provided by CBO.

Other Changes: The CBO estimates of changes in the number of uninsured people (relative to current law) include 0.1 million uninsured because of changes in Medicare and 0.3 million people uninsured because of interactions. Medicare-related changes are allocated proportionally to Medicare enrollment in 2024. Increases in the uninsured stemming from the interaction was split between Medicaid-related and ACA-related proportionally to each type’s chare of uninsured changes in CBO’s estimate (7.8 million for Medicaid and 2.1 million for ACA). Each change in the uninsured loss stemming from the interaction was allocated across states proportionally to each state’s share of the overall change.

Population Estimates: Decennial state-level population projections from the Weldon Cooper Center for Public Service are used to interpolate the population in 2034 assuming compound population growth. The percentage point increase of the uninsured population per state reflects the estimated increase in the uninsured as a share of the projected population. The total impact from all changes were aggregated then rounded to two significant figures, with the percentage point increase in the uninsured population rounded to the nearest whole number.

Interactive DataWrapper Embed
News Release

KFF/ESPN Survey of 1988 NFL Players Finds the Vast Majority Say Pro Football Left Them With a Range of Serious Health Problems, but Most Would Play Again and Encourage Their Kids To Play

Published: Aug 15, 2025

KFF and ESPN today jointly released a first-of-its-kind, in-depth polling and reporting project that sheds new light on the health issues and other challenges facing NFL players after they leave the game.

The KFF/ESPN Survey of 1988 NFL Players draws on a novel survey of 546 respondents who were among the 1,532 players from the 1988 season.

Now, at an average age of 62, large majorities of these former NFL players say pro football was bad for their health, but 90 percent say they would choose to play again. Most report that football had positive benefits to their life and relationships despite the negative health effects. The survey also uncovered stark racial disparities, with Black players much more likely than White players to report serious health problems after football.

The survey focused on players from the 1988 season after the widow of former New Orleans Saints offensive lineman Daren Gilbert reached out to ESPN about the struggles faced by her late husband and his teammates.

As part of the project, KFF’s polling experts and ESPN reporters jointly designed and analyzed the survey. ESPN today published a package of comprehensive stories and video on the data, along with a lengthy narrative on the fates of Daren Gilbert and his Saints teammates. KFF published a comprehensive report detailing the survey’s findings.

“For the first time, we are able to truly gauge whether playing one of the most physical sports at the highest level is worth it,” said Chris Buckle, ESPN Vice President, Investigative Journalism. “The survey responses are incredibly enlightening. Hearing such honest stories from players and their families about all the good and bad that comes alongside a pro football player’s life is especially moving, and how players view the next generation of would-be players from their families is fascinating.”

“I was at the game with my dad in 1978 when the late Darryl Stingley of the New England Patriots was paralyzed for life after a hit to the head over the middle,” KFF President and CEO Drew Altman said. “The times have changed and the game may be safer today in some ways, but players now in their 60s tell us that living the pro football dream was worth whatever health and suffering has followed for them.” 

Among the survey’s many findings, about three-quarters of players from the 1988 season say the game has negatively affected their physical health, and one-third say it has had a negative impact on their mental health. At the same time, about 9 in 10 say playing in the NFL has had a positive impact on their lives in general. Large majorities say it was a boon for their finances, later career opportunities, and relationships with family and friends. Ninety percent say they would make the choice to play again.

About the Survey:

Designed and analyzed by public opinion researchers at KFF in collaboration with reporters at ESPN, the KFF/ESPN Survey of 1988 NFL Players was conducted October 17 – November 30, 2024, online and by telephone, among a representative sample of 546 former NFL players who played at least one game in the 1988 season. The margin of sampling error is plus or minus 3 percentage points for the full sample. For results based on other subgroups of players, the margin of sampling error may be higher.

A Look at the New Executive Order and the Intersection of Homelessness and Mental Illness

Published: Aug 15, 2025

President Trump recently signed an executive order on homelessness, mental health, and substance use that leverages federal funding priorities and other administrative tools to encourage states to ban public drug use, remove unhoused people from public spaces, and broaden civil commitment laws to permit involuntary psychiatric civil commitments in more circumstances. It also instructs the Department of Housing and Urban Development (HUD) to end funding for programs that use the “Housing First” approach–which provides immediate housing without preconditions such as sobriety or mandatory mental health treatment—and instead to fund programs that require individuals to participate in treatment prior to receiving housing assistance. The executive order comes about one year after the 2024 Supreme Court decision (Grants Pass v. Johnson), which makes it easier for law enforcement to ticket, fine, or arrest people sleeping on public property. Approximately 220 local governments have since passed enforcement measures targeting homelessness.

Weeks after signing the executive order, President Trump announced plans to deploy the National Guard and assume control of D.C. police to clear homeless encampments in the city and address crime. While he did not specify where unhoused people would be relocated, he posted that they would be given “places to stay, but far from the capital.” These actions align with his campaign statements advocating for relocation of unhoused individuals to “tent cities” and expanding involuntary psychiatric commitments, including his campaign remarks that people with serious mental illnesses (SMI) should be brought “back to mental institutions, where they belong.”

Taken together, these policies represent a departure from decades of court-backed deinstitutionalization, which emphasized voluntary, community-based care in less restrictive settings. They also work together by pairing easier state expansion of law- enforcement authority related to homelessness with federal incentives to encourage states to broaden civil commitment laws and psychiatric institutional care.

This brief describes the new executive order, examines the intersection of homelessness and mental illness, reviews the history of the deinstitutionalization movement, and discusses specialized treatment services for people with SMI.

In 2024, about one-quarter (26%) of adults experiencing unsheltered homelessness had a serious mental illness and a similar share had a chronic substance use disorder—both higher than the general population. HUD’s annual point-in-time count defines SMI as a mental illness that substantially limits independent living and is expected to be of long-lasting or indefinite duration. Specifically, 26% (67,000 of 263,000) of adults experiencing unsheltered homelessness met HUD’s SMI definition (Figure 1), compared to about 5-6% of adults overall according to the National Survey of Drug Use and Health (NSDUH). A similar share—about 26%—were identified as having a chronic substance use disorder (SUD) according to HUD’s definition in the point-in-time count, compared to about 3% of adults in the general population who met NSDUH criteria for severe SUD. SMI and SUD often co-occur—about one-quarter of people with SMI also has an SUD—but HUD’s publicly available data do not report the overlap of these conditions. This analysis focuses on unsheltered adults to more closely align with the population described in the executive order; unsheltered adults account for about 40% of all adults experiencing homelessness, with the remainder in sheltered settings (emergency shelters and transitional housing). The shares with SMI or chronic SUD are higher among unsheltered adults than sheltered adults (SMI: 26% vs. 20%; SUD: 26% vs. 12%). Data are not shown for 2021 due to data reliability issues. SMI is a category encompassing more severe mental illnesses, not a single diagnosis, and conditions classified as SMI vary in presentation and severity within and across populations. Prevalence estimates also differ across studies because mental illness and homelessness can be defined and measured differently.

The number of adults experiencing unsheltered homelessness increased by more than 40% since 2018, while the share with serious mental illness has remained relatively stable and the share with chronic SUD trended upward. From 2018 to 2024, the number of adults experiencing unsheltered homelessness grew by 43%, while the share of those with SMI edged down from 28% to 26% and the share chronic SUD increased somewhat from 22% to 26%, potentially reflecting the ongoing opioid crisis. Because these shares changed little overall, most of the increase occurred among adults not identified as having SMI or chronic SUD (though the overlap is unknown). This pattern suggests that broader factors, such as housing affordability are also contributing to increases in unsheltered homelessness.

Though Overall Unsheltered Homelessness Increased 43% Since 2018, SMI Shares Stayed Steady as SUD Shares Trended Upward

President Trump’s executive order seeks to widen the use of involuntary civil commitments for adults experiencing homelessness and serious mental illness, shifting away from deinstitutionalization efforts. Civil commitment is a legal process in which a court orders an individual with a SMI into involuntary treatment–either in a hospital or through supervised outpatient care (“assisted outpatient treatment“)—for a defined period. Each state sets its own civil commitment rules, but these must comply with federal laws and constitutional rights. Typically, civil commitment is limited to cases where an individual’s mental illness creates a significant risk of harm to themselves or others. To expand civil commitments, the executive order directs the Attorney General and HHS Secretary to pursue reversals of court decisions that currently limit the use of civil commitments, and to provide guidance to states to make civil commitment standards more flexible, including for involuntary inpatient and outpatient treatments. It also instructs several federal officials—including the Attorney General and Secretaries of HHS and HUD—to review discretionary grant programs and prioritize funding for states that ban public drug use and urban camping and use civil commitment or other legal actions to move unhoused people into treatment. Additionally, the executive order directs agencies to collect data from homelessness assistance programs and allow sharing with other agencies, such as law enforcement.

Before deinstitutionalization, people with serious mental illnesses were often housed in long-term psychiatric institutions, but advances in treatment, growing public concern about poor institutional conditions, and civil rights litigation shifted care to community-based settings. Approval of the first antipsychotic drug in the 1950s and growing public awareness of the poor conditions in mental institutions sparked the deinstitutionalization movement—which shifted mental care away from long-term institutional care toward community-based treatment. The 1963 Community Mental Health Act introduced federal funding to transition care to community mental health centers (CMHCs), which were intended to provide five core services: inpatient, outpatient, emergency, partial hospitalization, and consultation/education. Medicaid was passed in 1965, which further reinforced the deinstitutionalization transition by reimbursing community-based mental health services while prohibiting payment for care in Institutions for Mental Diseases (IMDs). CMHC development fell short of the original vision, with fewer than half of planned centers built and many centers focused less than expected on people with severe mental illnesses that had previously been institutionalized in state facilities. President Carter sought to close some gaps through passage of the Mental Health Systems Act (MHSA), which planed to expand services for those with chronic SMI and to tighten accountability through performance-based contracts and monitoring. However, President Reagan reversed course by repealing the MHSA, converting federal funds into state block grants, cutting funding by 25%, and barring the use of grant funds for inpatient psychiatric care—a restriction that persists today. Philanthropic initiatives helped respond to gaps in health care through community-based health responses to homelessness. Meanwhile, federal civil rights laws and litigation from the 1990s and earlier affirmed the right of people with SMI to receive treatment in the least restrictive setting, reinforcing deinstitutionalization.

As mental health services shifted toward outpatient care, the availability of psychiatric inpatient beds declined from 237 residents in beds per 100,000 in 1970 to 37 per 100,000 in 2020. Over time, psychiatric inpatient care has shifted in both populations served and facility characteristics. Facilities once housed people with developmental and intellectual delays, as well as dementia, but after the 1970s, they primarily served individuals with mental illness. Long-term stays, once common, are now less common, and inpatient care has expanded to include psychiatric beds in general hospitals and non-state residential facilities, most of which focus on shorter-term stays. It isn’t clear to what extent this historical reduction in psychiatric beds directly explains current homelessness. In 2023, the demand for inpatient and residential psychiatric beds exceeded the bed supply by over 3,500 beds. This count does not include instances where those experiencing psychiatric emergencies left in the emergency department before being seen or gaining access to a bed. When psychiatric beds are unavailable, admitted patients may be “boarded” in emergency departments, a practice most common among patients with psychotic or bipolar disorders and those who are involuntarily committed.

As Mental Health Services Shifted Toward Outpatient Care During Deinstitutionalization, Psychiatric Inpatient Beds Declined Sharply

Over time, community-based treatment has expanded due to deinstitutionalization, but specialized outpatient services remain limited, and overall shortages persist. Evidence-based treatment designed specifically for people with the most mental health needs have shown effectiveness in reducing acute care use, shortening hospital stays, and supporting people with SMI experiencing homelessness. For example, Assertive Community Treatment (ACT) provides 24-hour support through small, multidisciplinary teams that individualize care, intensifying support services during symptom flare-up and reducing it when symptoms stabilize. ACT is sometimes used in conjunction with Assisted Outpatient Treatment, a form of civil commitment requiring adherence to medication or outpatient treatment. Other evidence based practices include Permanent Supportive Housing and First Episode Psychosis (FEP) programs; however, these programs are limited, vary by state and region, and many struggle with workforce shortages.

Decreases in federal spending may leave states with even fewer resources to put toward treatment options for those with serious mental illnesses, including those at risk of homelessness. Although the executive order promotes expanding civil commitment and institutional care for unhoused individuals with SMI, it does not provide new federal funding to support these efforts. Federal rules generally prohibit Medicaid and community mental health block grant dollars from financing care in psychiatric facilities with more than 16 beds (known as Institutions for Mental Disease, or IMDs), except under specific circumstances or through Medicaid IMD waivers. Additionally, the Trump administration proposed significant cuts to behavioral health and housing programs, including a reduction of over $1 billion to SAMHSA–which funds behavioral health initiatives such as block grants— and a proposed 50% cut to HUD, the federal agency that manages housing assistance funds. While the final scale of these cuts is uncertain as congressional committees currently deliberate, substantial reductions to Medicaid spending have already been enacted through the recent reconciliation package, potentially affecting both Medicaid coverage and access to behavioral health services. Reductions in federal funding and coverage are likely to exacerbate existing capacity constraints to inpatient and outpatient behavioral health services.

Poll Finding

KFF/ESPN Survey of 1988 NFL Players

Published: Aug 15, 2025

Overview

The Survey of 1988 NFL players, conducted by KFF in partnership with ESPN, looks at the overall health and well-being of former professional football players who played in the 1988 NFL season. The results of this survey provide insight into the lives of these former players as they approach traditional retirement age. While many are grappling with the immense toll the sport has taken on their physical and neurological health, most say they would do it all over again.

Explore ESPN’s Reporting on This Survey

Summary of Key Findings

The Survey of 1988 NFL players, conducted by KFF in partnership with ESPN, explores the overall health and well-being of former professional football players who played in the 1988 NFL season. The aim of the project is to examine the physical, emotional, and financial well-being of a cohort of professional football players as they approach typical U.S. retirement age. Overall, the survey finds that these former players face a variety of health issues, including chronic pain and mobility problems, cognitive impairment, and mental health challenges – often at higher rates than their peers in the general population.

The survey also finds that former Black players are consistently more likely than White players to face physical, neurological, and mental health issues alongside poorer financial outcomes. This survey’s results document how racial disparities in health, health care, and income that occur in the U.S. persist among these former NFL players despite the potential financial and career benefits of playing in the NFL. At the same time, former Black players face unique challenges, as some of the racial disparities in health outcomes found in this survey – such as disability and cognition issues — are not always similarly observed among men the same age in the general population. Such data may inform and direct efforts to address such disparities among former NFL players and advance equity.

Despite these struggles, players’ views on their careers are overwhelmingly positive, and the vast majority, including both Black players and White players, say they would make the choice to play professional football again, extolling the benefits of the game on their life and relationships and citing the importance of brotherhood and the bonds they formed while playing.

5 Key Takeaways From the KFF/ESPN Survey of 1988 NFL Players

1. Overall, majorities of these players say professional football has had a positive impact on their life, including their finances, career opportunities, and relationships with family and friends. At the same time, most say the game has negatively impacted their physical health and one-third say it has had a negative impact on their mental health. For more information, see: Career Reflections / Views on Youth Football

Majorities of Former 1988 NFL Players Say Playing Professional Football Had a Positive Impact on Their Life Overall But a Negative Impact on Their Health

2. Compared to men in their age range in the population overall, former NFL players from the 1988 season are more likely to rate their physical health negatively and to report living with certain types of disability, chronic pain that interferes with their daily lives, cognitive challenges, and mental health issues. The gaps between players and men their age on these health outcomes hold when controlling for race. Incidence of these reported adverse health outcomes does not differ consistently between different position groupings (such as linemen v. skill positions, offensive v. defensive positions, and others), however, defensive players are more likely than offensive players to report some cognitive issues, such as worsening confusion and memory loss in the past year. For this survey, analysis by individual position types was not possible due to insufficient sample sizes. For more information, see: Health Issues

Former 1988 NFL Players are Consistently More Likely Than Men Their Age Overall to Report Experiencing a Wide Array of Physical and Cognitive Health Issues

3. The survey also finds stark racial disparities between players across a wide array of health measures. Black players are consistently more likely than White players to report adverse health outcomes, including physical limitations, cognitive problems, mental health challenges, pain, and disability. In many of these instances, similar disparities are not present among men in a similar age range in the population overall. These racial disparities may reflect a range of demographic and other differences between Black and White players, including racial differences by positions played (See Appendix Fig. 4), income, and access to health care and insurance. Nonetheless, some of these racial differences in reported physical disabilities and cognitive problems remain even when controlling for other factors such as higher risk position groups, income, age, and years played, suggesting that other socioeconomic factors may impact health. For more information, see: Health Issues and Mental Health

Black Players are Consistently More Likely Than White Players to Report Worse Physical and Mental Health and Physical and Cognitive Disabilities

4. Given the range of health issues reported by former players, health care access plays a key role in players’ overall well-being. While these former players have higher average incomes than men their age in the population at large, many report having gone without health insurance and necessary care since they stopped playing football, with about one in five saying they went without needed health care in the past year because of the cost. In addition, struggles affording medical bills, health insurance and other day-to-day expenses are particularly pronounced among Black players and those living with a disability. For many players, these financial difficulties may be tied to injuries they incurred during their professional football careers, as about three in ten say they were unable to work at some point since they stopped playing due to a football-related injury. For more information, see: Health Care and Finances

Among Former Players, Problems Paying for Health Care, Housing, and Food are More Common Among Those Living With a Disability and Black Players

5. Despite the physical toll playing football has had on many of these players, the vast majority say they would choose to play in the NFL again if they could go back, citing a love of the game, camaraderie with teammates, and a strong sense of purpose. Most players who are parents say they encouraged their children to play football if they expressed an interest, and a majority oppose banning youth tackle football below the high school level – although they are more divided on the whether the benefits of youth football outweigh the overall risks. For more information, see: Career Reflections

90% of Players Say if They Could Go Back, They Would Make the Decision to Play Football Again

“The experience built a foundation for my life. Discipline, how to work for and be a part of a team. How to handle success, how to handle failure. How to face adversity and work through it. I fall back on those lessons often.”

“Nothing will ever replace the camaraderie or the adrenaline to play against the best in the world.”

“Because of the brotherhood, all the brothers that I had from the game of football…I have the best relationships with my brothers. When you play football, you go through things and, when you go through things together, you develop a bond.”

“I would still have played because of the people, the culture that accepts you above your identity.”

“There is zero downside outside of the hardware in the body. Yes I ache a bit more but so does my wife who never played.”

Career Reflections, Life Satisfaction, and Views on Youth Football

Key Takeaways

  • The vast majority of former players from the 1988 NFL season say playing professional football has had a positive impact on their life but a negative impact on their physical health. Overall, nine in ten former players say playing professional football has had a positive impact on their life in general (91%), with majorities reporting positive impacts on their social life (73%), financial situation (72%), employment situation (65%), and relationships with family (65%). At the same time, about three in four (77%) players say the game has had a negative impact on their physical health, and one-third say it had a negative impact on their mental health.
  • Despite these negative health impacts, the overwhelming majority (90%) of 1988 players say they would choose to play professional football again if they could go back, while just 4% say they would not play again. These shares are consistent across Black and White players despite disparities in reported health and financial outcomes and among players who report negative impacts on their physical or mental health. In open-ended responses, players cite a love of the game, the importance of brotherhood, the instillation of a strong sense of purpose, and valuable life skills as reasons why they would do it all over again.
  • Nearly all former 1988 NFL players are parents, and two-thirds (73%) say at least one of their children played organized tackle football at some level. However, when it comes to children playing tackle football, players from the 1988 season are somewhat divided on the risks: about half (47%) of ’88 players say that when it comes to youth playing tackle football before high school, “the benefits outweigh the risks,” while about four in ten (37%) say the “risks outweigh the benefits.” Nonetheless, most players who are parents (57%) say they encouraged their children to play football if they expressed an interest, and seven in ten (71%) oppose banning youth tackle football below the high school level. This may be a reflection of how much the sport has changed since their time in the NFL; about eight in ten (78%) former players say that professional football is safer now compared to when they were playing.

Views on the Overall Impact of an NFL Career

An overwhelming majority of 1988 players (91%) say that playing professional football has had a positive impact on their life in general. This positive impact is echoed in other facets of their lives, with a majority saying professional football had a positive impact on their social life and relationship with friends (73%), their financial situation (72%), relationships with family (65%), and their employment situation or career opportunities (65%) since they stopped playing football. Just about one in ten say their football career has had a negative impact in each of these areas.

Players paint a far more negative picture when it comes to the game’s impact on their physical health. About three in four players (77%) say playing professional football had a negative impact on their physical health, while just 14% say it had a positive impact. Players are more divided on how their careers impacted their mental health. About four in ten (43%) say the game had a positive impact on their mental health, while one-third say it had a negative impact (33%). Among Black players, similar shares say playing football had a negative (41%) and a positive (39%) impact on their mental health (see Appendix for details on player race and ethnicity).

Three Quarters of 1988 NFL Players Say the Sport Negatively Impacted Their Physical Health, But the Vast Majority Say Playing Had a Positive Impact on Their Life in General

Most players report being generally satisfied with their lives, including majorities of Black and White players who say they are “very” or “somewhat satisfied” with their life as whole, their relationships with their spouses, children, and former teammates, the number of meaningful connections they have with other people, and their personal financial situation.

Large majorities of both Black and White players express satisfaction with these aspects of their lives, but fewer Black players than White players report being satisfied with their life as a whole (74% vs. 89%) or their financial situation (62% vs. 86%).

Large Majorities of Former NFL Players Report Satisfaction With Different Aspects of Their Lives, But Life Satisfaction is Somewhat Lower Among Black Players

Despite reporting negative impacts on their mental and physical health, an overwhelming majority of players from the 1988 season (90%) say they would still make the decision to play professional football if they could go back—a share that is consistent across Black and White players despite disparities in reported health and financial outcomes. Even among players who say football negatively impacted their physical health, nine in ten (88%) say they would make the decision to play again. A somewhat smaller share, but still a large majority, of players who say the game had a negative impact on their mental health say they would play again (78%).

The Overwhelming Majority of Players Say They Would Still Play Football Again if They Could Go Back, Including Majorities of Those Who Report Negative Health Impacts
In Their Own Words: Why NFL Players From the 1988 Season Would or Would Not Do It All Again

Quotes have been edited to protect player confidentiality and for clarity.

Among those who said they would play again (90% of players):

“The experience built a foundation for my life. Discipline, how to work for and be a part of a team. How to handle success, how to handle failure. How to face adversity and work through it. I fall back on those lessons often.”

“Greatest game in the world. High risks/High reward. Nothing will ever replace the camaraderie or the adrenaline to play against the best in the world.”

“There is zero downside outside of the hardware in the body. Yes I ache a bit more but so does my wife who never played.”

“Playing football especially pro’s I encountered people from different ethnicities, religious beliefs, achievements and family units that gave me great perspectives on living…I would still have played because of the people, the culture that accepts you above your identity.”

“… because of the brotherhood, all the brothers that I had from the game of football…I have the best relationships with my brothers. When you play football, you go through things and, when you go through things together, you develop a bond. I have a plethora of brothers, not just from pro football, but from every level from youth to high school to college. It is part of who I am.”

Among those who said they would not play again (4% of players):

“The injuries last much longer than expected. In fact every injury I had, that I thought I had rehabbed successfully, have all come back in my retirement from the game. They were just laying dormant waiting for muscle atrophy. Everything seems to hurt and the temporary money and fame just wasn’t a fair exchange.”

“My life is severely impacted. Having both hips replaced once…5 shoulder replacements. One knee replacement already and planning the other soon. All these issues have me not able to do any of the activities I grew up loving. I can’t play catch with my grandson. I can’t play the guitar or piano anymore. Can’t go hiking or walk my dogs. Can’t do a f****** thing physically. Then there is the brain s***…I went back to school and could not remember a thing which was my 1st indication something was/is wrong. Blew up two great relationships and have had issues with my kids as my temper and loss of memory hamper my ability to have a coherent conversation. My quality of life sucks, just sitting here waiting to die.”

When it comes to supportive relationships, most players from the 1988 seasons say they think their teammates (79%) and their coaches (64%) cared “a lot” or “some” about their overall well-being during their professional football career. Far fewer (36%) say they think the owners of the teams they played for cared about their overall well-being. The shares who say their teammates, coaches, or team owners cared about their well-being is similar among Black players and White players.

Most Former Players Felt Their Teammates and Coaches Cared About Their Well-Being During Their Career, Fewer Than Half Say the Same About Team Owners

Views on Safety, Youth Football, and Today’s NFL

When it comes to youth playing tackle football, players from the 1988 season are somewhat divided on whether the benefits outweigh the risks. Nonetheless, most players who are parents say they encouraged their children to play football if they expressed an interest, and a majority oppose banning youth tackle football below the high school level. This may be partially explained by the fact that the vast majority of 1988 players say they think professional football is safer now compared to when they played.

Nearly all players from the 1988 season are parents (96%) and a majority of players (67%) say they have coached a high school or youth football team. Among players who are parents, most say their children played football at some level (73%). This includes four in ten who say at least one of their children played at the college (33%) or professional level (8%).

Most NFL Players from the 1988 Season Say Their Children Played Tackle Football at Some Level, But Relatively Few Have Played Professionally

Most former players say they encouraged their children to play football, with many citing the important life lessons instilled by playing, including the importance of teamwork, camaraderie, discipline and work ethic. Overall, about six in ten (57%) players from the 1988 season say they encouraged their children to play tackle football if they expressed an interest compared to just 7% who say they discouraged their children. One in five (19%) say it depends on the child, while 16% report that none of their children ever expressed an interest in playing.

Most 1988 NFL Players Encouraged Their Children To Play Tackle Football if They Expressed an Interest

Players are somewhat divided on the relative risks of children playing tackle football below the high school level, with about half (47%) saying the “benefits outweigh the risks” and about four in ten (37%) saying the “risks outweigh the benefits,” while 16% say they have no opinion. Perhaps reflecting the sport’s impact on their health, Black players and players living with a disability are each less likely than White players and those without a disability, respectively, to say the benefits of youth playing tackle football outweigh the risks. Past studies among former NFL players have linked playing youth tackle football with cognitive issues later in life.

Former Players are Divided on the Risks of Youth Football, While Black Players and Those With a Disability Less Likely to Say the Benefits Outweigh the Risks

In recent years, there has been much debate over banning youth tackle football across the U.S., with legislators in several states introducing bills to ban tackle football below the high school level. Attempts to ban tackle football for youth, including a recent bill in California, have been unsuccessful thus far. The majority (71%) of players from the 1988 season say they oppose banning youth tackle football under the high school level and a quarter (26%) saying they would support such a ban. While few players across demographics support banning youth tackle football, the shares who support a ban are slightly higher among Black players compared to White players (29% v. 22%) and players living with a disability compared to those who are not (29% v. 21%).

Majorities of 1988 NFL Players Oppose Banning Youth Tackle Football

Since many of these players have retired from professional football, the game has changed markedly when it comes to safety, with changes to personal equipment and updated rules aimed at making the game safer. Most players (78%) from the 1988 season agree that professional football is safer now compared to when they were playing football, while 15% say it’s about the same and just 6% say it is more dangerous now.

Eight in Ten Former NFL Players from the 1988 Season Say Professional Football is Safer Now Compared to When They Played

Physical, Cognitive, and Neurological Health Issues

Key Takeaways

  • Across a range of measures, former NFL players from the 1988 season report being in worse health and experiencing more frequent pain and higher levels of disability compared to men their age in the general population, even when controlling for race. Former players are about three times as likely as other men their age to report living with a disability (60% v. 21%) and about twice as likely to report experiencing pain all or most days in the past three months (69% v. 33%). In open-ended responses players describe the isolating effects of pain and the toll it has taken on their daily life and mental health.
  • Just over half (55%) of players say they have experienced confusion or memory loss in the past year that is happening more often or getting worse – more than three times the share of men their age who say the same (16%). A notable share of former players report having been diagnosed with a neurological disorder, including about three in ten (28%) who say a health provider has told them they have post-concussion syndrome (28%) and 15% who report being diagnosed with dementia, including Alzheimer’s disease. Nearly one in five (18%) say a doctor or other health care provider has told them they have chronic traumatic encephalopathy (CTE), although CTE cannot definitively be diagnosed until after death. Defensive players are more likely than those in offensive positions to report worsening confusion and memory loss in the past year (63% v. 50%) and being diagnosed with a neurological condition (52% v. 37%), including post-concussion syndrome (36% v. 23%). Incidence of these neurological health issues does not differ consistently by other position groupings, such as linemen v. skill positions. Analysis by individual positions is not possible due to insufficient sample sizes.
  • Among former ’88 NFL players, there are consistent, stark racial disparities when it comes to physical and neurological health outcomes. Black players are more likely than White players to report living with some kind of disability (69% v. 48%), particularly those related to difficulty concentrating, remembering, or making decisions (60% v. 30%), and difficulty walking or climbing stairs (45% v. 27%). Notably, these wide racial disparities are not present among men in the same age range in the general population. Black players are twice as likely as White players to say they’ve been told by a doctor that they have CTE (25% v. 10%) or dementia (21% v. 9%), and significantly more likely to say they’ve been diagnosed with post-concussion syndrome (36% v. 19%). Though Black players are more likely than White players to have played in positions that previous research has linked to increased risk for cognitive problems, Black players’ higher incidence of disability and worsening confusion and memory problems remain significant compared to White players even when controlling for other factors, including higher risk position groups , income, age, and years played, suggesting other socioeconomic factors or experiences may be a contributing factor.
  • While Black players are more likely to report disability and pain that limits their life activities, White players report having a higher number of football-related surgeries compared to Black players, with half of White players compared to a third of Black players saying they’ve had five or more. Higher incidence of surgeries among White players may reflect disparities in health care access and financial situation. Black players are more likely than White players to say they did not have health insurance coverage for a year or more after their NFL career.
Racial Disparities Between Black and White Players

This survey finds stark differences between Black and White former NFL players across a wide array of physical, neurological, and cognitive health measures. These disparities are consistent with previous research and likely reflect several different and often interrelated factors, including racial differences in positions played (See Appendix Fig. 4), post-NFL income, access to health care, and social determinants of health.

Among 1988 NFL players, Black players are more likely than White players to have played in positions that previous research has linked to increased risk for cognitive problems, including running back, linebacker, and defensive line. Nearly half (47%) of Black 1988 players played in one of these positions compared to 31% of White players. Previous research from the Football Players Health Study at Harvard University shows that Black players have historically been more likely to play in these higher-risk positions – a phenomenon called “racial stacking,” which has been observed across different professional sports.

Differences in positions played, however, do not account for all of the differences in outcomes between Black and White players. Previous research among former NFL players has found that Black players are more likely than White players to experience physical and cognitive health issues even when controlling for a variety of factors, including positions and years played and concussion incidence. Similarly, among players from the 1988 season, Black players were more likely than their White counterparts to report having a disability and to report having worsening confusion and memory problems even when controlling for age, current income, higher-risk position groups, and years played in the NFL1 , suggesting that other factors, including injury incidence, access to health care, and socioeconomic factors play a role in these disparities.

Black players from the 1988 season are also more likely than White players to report lower average incomes, financial difficulties, and being uninsured at some point since they stopped playing. These differences mirror inequities seen in the U.S. population more generally, with studies documenting the racial wealth gap that continues in the U.S. today, and research highlighting employment discrimination experienced by Black adults. Moreover, studies indicate that some of these wealth and economic differences between Black and White players are present before they even reach the professional football stage of their careers. For example, Black NFL players are more likely than White players to have attended high schools with higher share of low-income students and are more likely to come from more economically disadvantaged areas.

See Appendix for more details on player race and ethnicity

Overall Health and Disability

About six in ten (62%) players from the 1988 season describe their physical health as either “excellent,” “very good,” or “good,” while about four in ten (38%) describe their physical health as “fair” or “poor.” Compared to men in their age cohort in the population overall, these former NFL players are more likely to describe their health negatively (38% v. 24%). These differences hold among Black players and White players when compared to their respective peers in the general population. (See Methodology for additional details on general population data.)

Four in Ten 1988 NFL Players Describe Their Physical Health Negatively Compared to a Quarter of Men Their Age Overall

Players from the 1988 season are much more likely than men their age to report living with a disability, especially those related to cognition and mobility. Overall, six in ten players from the 1988 season report currently living with a disability — three times the share of men in their age range overall (21%). Players living with a disability include those who say they have difficulty concentrating, remembering, or making decisions (47%), serious difficulty walking or climbing stairs (36%), difficulty dressing or bathing (18%), are deaf or have serious difficulty hearing (14%), or are blind or have serious difficulty seeing even when wearing glasses (8%). Players are about eight times as likely as men their age to report serious difficulty concentrating, remembering or making decisions, and at least three times as likely to report serious difficulty walking or climbing stairs or difficulty dressing or bathing. The higher incidence of disability among 1988 players compared to men their age holds when controlling for race, with both Black players and White players more likely than their peers in the general population to report living with a disability. Players who played in defensive positions are somewhat more likely than offensive players to report difficulty concentrating, remembering, or making decisions (55% v. 42%). The share who reports living with a disability overall, however, does not significantly differ by defensive v. offensive positions or linemen v. skill positions. Incidence of reported disability by specific positions is not possible due to insufficient sample sizes.

Six in Ten Players From the 1988 Season Report Living With Some Type of Disability, About Three Times the Share of Men Their Age Overall

Larger shares of Black players compared to White players report having some type of disability (69% v. 48%), with Black players twice as likely to report serious difficulties concentrating or remembering (60% v. 30%). Larger shares of Black players than White players also report serious difficulty walking or climbing stairs, difficulty dressing or bathing, or being blind or having serious difficulty seeing. These large racial disparities are not similarly observed among men in this age range in the general population.

Black players’ higher incidence of disability compared to White players remains significant when controlling for other factors, including higher risk position groups, income, age, and years played. The higher incidence of disabilities – and other adverse health outcomes – among Black players could be attributed to a number of factors, including racial differences in positions played (See Appendix Fig. 4), injury incidence, and access to health care and other services. Notably, Black players are more likely than White players to say they did not have health insurance coverage for a year or more after their NFL career.

Black Players are Much More Likely Than White Players to Report Living With a Disability, Particularly Those Related to Cognition and Mobility

Chronic Pain

Seven in ten (69%) players say they experienced pain either “every day” or “most days” in the past three months, twice the share of men their age in the general population (33%) – a difference that holds among both Black players and White players compared to their peers in the general population. This includes about a third (35%) of players who say they experienced pain that limited their life or work activities every or most days in the past three months, compared to about half that share among men their age overall (13%). While similar shares of Black players and White players report experiencing pain all or most days (71% and 67%, respectively), Black players are more likely than White players to report experiencing pain that limited their life or work activities all or most days in the past three months (41% v. 28%). Similar racial disparities are not present among men in a similar age range in the general population. The share who reports living with chronic pain does not notably differ by different position groupings, such as linemen v. skill positions or offensive v. defensive. Incidence of chronic pain by specific positions is unreportable due to insufficient sample sizes.

Seven in Ten 1988 NFL Players Say They Experience Near-Daily Pain and One-Third Have Pain That Limits Their Life and Work Activities

In open-ended responses, many players describe the enormous toll pain has had on their daily life, inhibiting their ability to spend time with family and friends, partake in hobbies, and work. Alongside these isolating effects of chronic pain, many describe negative impacts on their mental health and emotional well-being.

In Their Own Words: How Chronic Pain Has Limited Former Players’ Life and Work Activities

Quotes have been edited to protect player confidentiality and for clarity.

“I used to love going out with friends and now I’m always in pain. Over the past several years I’ve not associated with any of my friends and family because I don’t want them to see me like this. Mentally it’s killing me. So what do I do? I have become a loner and not even realizing it…I’ve always been so happy and friendly with everyone that I’ve ever had the pleasure of interacting with and I am not who I used to be. I would love to go back to work at some point but my memory often fails me and being around other people may not end well. This is when anxiety and mental pain enters my life. I do believe that if I had a job I would feel emotionally, psychologically and physically so much better.”

“I have serious back and knee and shoulder problems. I don’t like masking it with pills because a lot of my friends have become addicted to them. The sport pays well, but it doesn’t pay as well now.”

“My pain these days is enormous…Arthritis, back, hip, brain fog … If I was not able to get relief, I would most likely end my life… there is no way I could live with this pain & function.”

“After…years of playing in the NFL, with 2 surgically repaired knees…back and neck injuries… concussions that I can’t even count… it has been very difficult to do normal activities now that I have become older, by the grace of God. Football has been a blessing to me, but it has also been a curse in the long run. Sometimes I wish that I never played this dear sport that I loved. The sport of football gave me so much…but it took even more from me. In ways you can’t explain, unless you played yourself.”

“In general, walking is painful, standing and exercising is painful. I have stressful thought processing issues. I lose my concentration, I get panicky and it makes it worse. It’s hard for me to go anywhere because constantly the slightest thought can throw me into a panic and causes anxiety. I like playing golf but I shy away from it and don’t go anywhere because of this situation.”

“The pain also known as the stinger feels like a hot iron, pain and needles white hot pain that has been unbearable for years. I’ve used alcohol and opioids for the pain to cool off. I’ve bought opioids not prescription that I had to get off the street because I was declined and denied. My lower back interferes to this day to put on my socks and shoes and put on my underwear, it is embarrassing, debilitating and depressing…”

In addition to dealing with chronic pain in higher shares than men their age, players from the 1988 season are also more likely than men in their age cohort to say they’ve been diagnosed with arthritis and related disorders. Two-thirds (66%) of players say they have been told by a doctor or other health professional that they have arthritis, gout, lupus, or fibromyalgia compared to about four in ten (38%) men in a similar age range in the general population who report a diagnosis. This difference holds across racial groups, with both Black players and White players more likely than their peers to report a diagnosis. When it comes to other common chronic health conditions like hypertension, high cholesterol, and diabetes, somewhat similar shares of players and men their age overall report having been diagnosed.

One-third of players say they have been told by a doctor that they have obesity or are overweight, including similar shares of Black players and White players. Prior KFF polling found a similar share of men in this age range (38%) saying they were diagnosed as overweight or obese in the past five years.

Players From the 1988 NFL Season Are More Likely Than Men Their Age To Have Arthritis and Similar Chronic Pain Disorders

The overwhelming majority (87%) of NFL players from the 1988 season say they have had at least one orthopedic surgery related to playing football, including three in ten (39%) who have had five or more surgeries. While Black players are more likely than White players to report adverse physical health issues including disabilities and chronic pain that limits their life and work, a somewhat larger share of White players compared to Black players say they have had at least one football-related surgery (91% v. 84%), with White players being more likely to say they’ve had five or more surgeries (50% v. 33%). These racial disparities may reflect differences between Black and White players in post-football income and access to health care, which in turn may contribute to the long-term effects of increased pain and disability among Black players.

Nine in Ten Players From the '88 Season Have Had a Football-Related Surgery, With White Players More Likely Than Black Players to Report Five or More

Neurological Health, Confusion and Memory Loss

Many players from the 1988 season report cognitive issues, including worsening confusion or memory loss and being diagnosed with neurological conditions including chronic traumatic encephalopathy (CTE)2  and dementia. There are stark racial disparities when it comes to neurological health among these players, with much larger shares of Black players reporting dementia and CTE diagnoses. Black players are also more likely than White players to report worsening confusion and memory issues, a disparity that is not similarly observed among men their age in the general population. Players, including both Black and White players, are much more likely to report worsening confusion and memory loss issues compared to their peers in the general population.

Notably, nearly all players from the 1988 season (95%) report experiencing a head injury while playing football, which could include anything from “seeing stars,” a mild concussion, or fully losing consciousness. Past research has linked head injuries sustained while playing contact sports like football to the development of neurological issues, including CTE – a link that has been acknowledged by the National Football League (NFL).

About four in ten (43%) players from the 1988 season say they have been told by a doctor or other health professional that they have some type of neurological disease or condition, with the largest shares reporting diagnoses for post-concussion syndrome (28%), CTE (18%), and dementia, including Alzheimer’s disease (15%). Fewer players report being diagnosed with other neurological issues, including having a stroke (5%), Parkinson’s disease (5%), chronic fatigue syndrome (4%), or a seizure disorder (2%). Defensive players are more likely than those in offensive positions to have been diagnosed with a neurological condition (52% v. 37%), including post-concussion syndrome (36% v. 23%).

Black players are about twice as likely as White players to report neurological diagnoses, including for post-concussion syndrome (36% v. 19%), CTE (25% v. 10%), and dementia (21% v. 9%). Previous studies have shown that Black adults are more likely to develop dementia compared to White adults but less likely to receive a diagnosis.

Four in Ten 1988 Players, Including Larger Shares of Black Players, Report Being Diagnosed With a Neurological Condition Such as CTE, Dementia, or Others

About half (55%) of players from the 1988 season say they have experienced confusion or memory loss in the past year that is happening more often or getting worse, including larger shares of Black players compared to White players (65% v. 43%) – a disparity that is not present among men their age overall. Players are much more likely than men their age overall (55% v. 16%) to report worsening confusion or memory loss in the past year, a difference that holds among both Black players and White players when compared to their peers in the general population.

Beyond experiencing worsening confusion and memory issues, many players report that these issues have adversely affected their ability to carry out daily tasks, from household chores to working and socializing. About one-third of players say they have experienced worsening confusion or memory loss in the past year that has either caused them to give up day-to-day household activities at least “sometimes” (34%) or interfered with their ability to work, volunteer, or engage in social activities outside their home at least “sometimes” (37%). Black players are twice as likely as White players to report these adverse effects of worsening confusion and memory loss. Players who played in defensive positions are more likely than those who played offensive positions to report worsening confusion and memory loss in the past year (63% v. 50%). Incidence of reported worsening confusion or memory loss by specific positions is not possible due to insufficient sample sizes.

At Least One-Third of 1988 Players and Nearly Half of Black Players Report Worsening Confusion or Memory Loss That Inhibits Their Ability To Work or Socialize

Mental Health and Access to Mental Health Care

Key Takeaways

  • Many former NFL players from the 1988 season report struggling with mental health issues, and often in higher shares than men their age in the general U.S. population. About one-third (34%) of former players describe their mental health and emotional well-being as “fair” or “poor,” compared to just one in ten men their age overall. Additionally, players are more likely than men their age to report feeling lonely (40% v. 25%), depressed (45% v. 24%), or anxious (53% v. 34%) at least “sometimes” in the past year.
  • Black players are particularly likely to report negative mental health outcomes and are much more likely than White players to report regular feelings of anxiety (62% v. 42%), depression (52% v. 36%), and loneliness (51% v. 25%). These racial differences among former NFL players are not similarly observed among the general population of men ages 55 to 75, and Black players are more likely than Black men their age to report feelings of loneliness, anxiety, and depression in the past year.
  • One-quarter of former ’88 players say there was a time in the past three years when they needed mental health services or medication but didn’t get them, about three times the share among other men their age. The share of players who report skipping needed mental health services rises to over half (55%) among those who describe their mental health negatively, and Black players are twice as likely as White players to say they skipped needed mental health services in the past three years (31% v. 16%).
  • While self-reported addiction issues are not particularly common among players from the ’88 season, those with chronic pain, disabilities, and those in fair or poor mental health are more likely to say they’ve ever been addicted to alcohol or prescription painkillers compared to their peers. For example, players with fair or poor mental health are more likely than those who describe their mental health as at least “good” to say they’ve been addicted to alcohol (24% v. 15%) or prescription pain killers (14% v. 5%). Similarly, players who experience pain at least “most days” are more likely than those who do not to report ever being addicted to alcohol (21% v. 12%) or prescription painkillers (10% v. 2%).

Self-Reported Mental Health and Wellbeing

About one-third (34%) of players from the 1988 NFL season describe their current mental health and emotional well-being as “fair” or “poor,” including a larger share of Black players (46%) compared to White players (21%) (see Appendix for more details on player race and ethnicity). Notably, Black players are nearly twice as likely as White players to say that playing professional football had a negative impact on their mental health (41% v. 23%). Players who report having a disability, worsening confusion and memory loss, and fair or poor physical health are all more likely than those who do not to negatively rate their current mental health status. Past research has found that Black players are more likely to report negative physical and mental health outcomes, even when controlling for position and years played. Other factors may contribute to such disparities, such as social determinants of health, income, and access to health care. Among players from the 1988 season, Black players are more likely than their White counterparts to report negative physical health status, disability, and cognitive problems – all of which may contribute to and exacerbate mental health challenges.

Former ‘88 players are about three times as likely as men their age overall, per prior KFF polling, to describe their mental health as fair or poor. While both Black players and White players are each more likely than their peers in the general population to describe their mental health negatively, the gap between Black players and Black men their age is much wider (46% v. 12%). In fact, self-reported mental health status does not differ notably by race among men ages 55-75 overall.

A Third of '88 NFL Players, Including Just Under Half of Black Players, Describe Their Mental Health Negatively, Three Times the Rate of Men Their Age Overall

Poorer mental health outcomes among former players may be tied to physical health issues, including chronic pain and disabilities. Players who report having pain at least “most days” in the past three months are far more likely than those who experienced pain less frequently to describe their mental health negatively (43% v. 13%). Similarly, players who report living with a disability are far more likely than those who do not to describe their mental health negatively (52% v. 6%).

Former '88 Players Who Are Living With a Disability or Chronic Pain Are More Likely Than Those Who Are Not To Describe Their Mental Health Negatively

Players from the 1988 NFL season are more likely than men their age overall to report regular feelings of loneliness, anxiety and depression, with Black players much more likely than both White players and Black men their age to say they experienced these feelings. About half of former players from the ’88 season say they have felt anxious (53%) or depressed (45%) at least “sometimes” in the past 12 months, while four in ten say they’ve felt lonely at least “sometimes.” Larger shares of Black players compared to White players report experiencing these feelings at least “sometimes” in the past year, including anxiety (62% v. 42%), depression (52% v. 36%), and loneliness (51% v. 25%).

In each instance, players are more likely than men their age to report these feelings per past KFF polling, with large gaps between Black players and Black men their age overall. While White players are more likely than White men their age in general to report regular feelings of depression and anxiety by about a 10-point margin, they report feelings of loneliness in similar shares to White men their age.

Former NFL Players are More Likely Than Men Their Age to Report  Loneliness, Depression, and Anxiety - a Difference Largely Driven by Black Players

As with their mental health overall, players who report living with disabilities or chronic pain are much more likely than those who do not to report regular feelings of loneliness, anxiety, and depression. For example, players who report living with a disability are at least twice as likely as players without a disability to say they at least sometimes felt anxious (71% v. 27%), depressed (60% v. 21%), or lonely (54% v. 19%) in the past year.

Players Living With a Disability or Chronic Pain Are at Least Twice as Likely Than Those Who Are Not To Report Regular Feelings of Loneliness, Anxiety and Depression

Having a strong, local support network of friends or family is associated with a lower incidence of feelings of anxiety, depression, and loneliness among players. Players who say they have at least “a fair amount” of friends or family living nearby whom they can ask for support are far less likely than those who say they have “just a few” or “none” to say they felt anxious (40% v. 70%), depressed (30% v. 61%), or lonely (25% v. 58%) at least sometimes in the past year. Prior KFF polling has found a strong relationship between local support networks and mental health.

Even among players living with a disability, strong support networks are linked with a lower incidence of regular feelings of loneliness, anxiety, and depression. Among players with a disability, those who have at least a fair amount of friends of family living nearby who they can ask for help or support are far less likely than those who do not to report feeling lonely (35% v. 71%), depressed (45% v. 73%), or anxious (56% v. 85%) at least sometimes in the past 12 months.

Among Players Living With a Disability, Those With a Strong Local Support Network Are Less Likely To Report Regular Feelings of Loneliness, Depression, or Anxiety

Notable shares of 1988 NFL players report sleep, appetite, and anger problems, with these issues far more common among players who also report cognitive issues. Most players (68%) say they have had trouble falling or staying asleep or sleeping too much at least “sometimes” in the past 30 days, while around four in ten say they have experienced poor appetite or overeating (44%) or difficulty controlling their temper (39%). The share reporting these issues, however, rises drastically among players with worsening cognitive issues. Players who say they have experienced worsening confusion or memory loss in the past year are much more likely than those who have not to report experiencing issues related to sleep (82% v. 51%), eating (60% v. 23%) or controlling their temper (57% v. 17%) at least sometimes in the past 30 days.

88 NFL Players With Worsening Confusion and Memory Loss are More Likely to Report Sleep, Appetite, and Anger Issues

Access to Mental Health Care

With many 1988 players reporting mental health issues, notable shares say they have forgone needed mental health services in the past three years, including even larger shares of those who describe their mental health negatively. Overall, 16% of players say they have received mental health counseling or therapy in the past 12 months. However, a quarter of players say there was a time in the past three years when they thought they needed mental health services or medication but did not get them — three times the share of men their age overall who said the same (8%) in prior KFF polling. The share of former players who say they’ve gone without needed mental health services in the past three years is even higher among those who are likely most in need of such services; just over half (55%) of players who describe their mental health as “fair” or “poor” say they’ve gone without needed mental health care in the past three years.

Disparities in accessing mental health care also occur across race, with Black players about twice as likely as White players to report forgoing needed mental health care (31% v. 16%). This disparity is not similarly observed among the general population; among men ages 55 to 75, similar shares of Black and White men report forgoing needed mental health services in the past three years.

Among Former Players Who Describe Their Mental Health Negatively, Over Half Say They Have Gone Without Needed Mental Health Services in the Past Three Years
In Their Own Words: Why Former NFL Players Went Without Needed Mental Health Services

Quotes have been edited to protect player confidentiality and for clarity

“Maybe pride or I think I can just muscle through it.”

“Went a few times and it made me uncomfortable facing my own thoughts on my situation. It’s hard to hear yourself say these things out loud to someone else.”

“I just felt that I really didn’t need it and I wanted to see if it subsides. I decided I could handle whatever pain or depression I felt myself. Also, sometimes I questioned if it was just in my head. I am a little too hard on myself so sometimes what I am imagining is not as real and I may be a little paranoid about it.”

“I didn’t think it would work. Football players are taught to work it out.”

“I didn’t want the embarrassment or be labeled as someone who needs help with their mental health.”

“Just not reaching out sometimes because you feel it’s confidential. Football players they keep things to themselves and internalize.”

“No health insurance and I haven’t seen a doctor in over 20 years.”

Substance Use and addiction

While self-reported addiction issues are not particularly common among players from the ’88 season, the shares are higher among those who report experiencing chronic pain, disability, or describe their mental health negatively. Overall, about one in five (18%) players say they have ever been addicted to alcohol and fewer say they have ever been addicted to prescription painkillers (8%) or any illegal drug such as heroin, fentanyl, methamphetamine, or cocaine (3%).

Players who say they experience pain at least “most days” are nearly twice as likely as those who do not to say they’ve been addicted to alcohol (21% v. 12%) and much more likely to say they’ve ever been addicted to prescription painkillers (10% v. 2%). Similarly, players who describe their mental health as “fair” or “poor” and players who are living with a disability are each more likely than their peers to say they’ve ever been addicted to alcohol or prescription painkillers. Few players (1%) – including similar shares across mental health status and experiences with pain or disability – say they have ever had a drug overdose that required hospitalization.

Among players who say they were ever addicted to alcohol, prescription painkillers, or any illegal drug, three-quarters (75%) say they have never gotten treatment for addiction or substance use disorder.

1988 NFL Players With Chronic Pain, Disabilities, or Fair/Poor Mental Health Are More Likely To Report Addictions to Alcohol and Prescription Painkillers

Health Care Access and Coverage and Financial Wellbeing

Key Takeaways

  • With many former players from the 1988 NFL season reporting an array of health issues, access to health care and insurance likely plays a key role in players’ overall well-being. While most players (95%) say they are currently covered by some type of health insurance, four in ten (41%) report being uninsured at some point since they stopped playing professional football, including about a quarter (27%) who say they were uninsured for a year or more. Black players – who are much more likely than White players to report physical and cognitive health issues – are more likely than White players to say they have been uninsured at some point since leaving the NFL (48% v. 33%), including for a year or more (33% v. 20%).
  • Some former ‘88 NFL players report facing cost barriers when accessing health care in the past year. About one in five (21%) say they skipped or postponed getting health care they needed because of the cost in the past 12 months, while 16% say they’ve had problems paying their medical bills and 14% have had problems affording health insurance. These problems are even more common among players living with a disability, including skipping needed health care because of the cost (28%), problems paying medical bills (24%), and problems affording health insurance (21%).
  • While most 1988 NFL players say their football career had a positive impact on their finances and report higher average incomes than men their age in the general population, there are stark disparities in income and financial challenges by race and disability status. One-third of former players say it has been at least “somewhat difficult” to maintain steady employment or have a stable career since they stopped playing professionally, rising to 44% among Black players and 46% among players living with a disability. For some of these players, difficulties maintaining employment are tied to health issues they incurred from playing professional football. Three in ten (29%) former players say since they stopped playing professional football they have been unable to work at some point due to a football-related injury, including a larger share of Black players compared to White players (37% v. 19%) and defensive players compared to offensive players (36% v. 25%).
Racial Disparities Between Black and White Players

The KFF/ESPN Survey of 1988 NFL Players finds stark differences between Black and White former players across a wide array of health and economic measures. Black players from the 1988 season are more likely than their White counterparts to report lower average incomes, financial difficulties, and problems accessing health care. These differences mirror inequities seen in the U.S. population more generally, with studies documenting the racial wealth gap and research highlighting employment discrimination experienced by Black adults. Moreover, studies indicate that some of these wealth and economic differences between Black and White players are present before they even reach the professional football stage of their careers. For example, Black NFL players are more likely than White players to have attended high schools with higher shares of low-income students, and are more likely to come from more economically disadvantaged areas. Additionally, racial inequities in wealth and income are present even among college-educated adults, highlighting that the educational opportunities that football players may have do not resolve pre-existing economic inequities.

See Appendix for more details on player race and ethnicity.

Health Insurance and Access to Care

While nearly all former players (95%) say they are currently covered by health insurance, about four in ten (41%) report not being covered by health insurance at some point since they stopped playing football, including about one in four (27%) who say they were uninsured for a year or more. The share who reports being uninsured at some point post-NFL rises to about half of players living with a disability (49%) and Black players (48%). Notably, past KFF analysis has found that nationally, Black adults have a higher uninsured rate than White adults.

Four in Ten Players, Including Half of Those With a Disability, Say They Were Uninsured at Some Point Since They Stopped Playing

About one in five (21%) players from the 1988 season – including similar shares of Black players and White players – report postponing or skipping health care they needed in the past 12 months because of the cost, compared to 12% of men in a similar age range who reported the same in past KFF polling. This difference may reflect an increased need for care among these players, who are more likely than other men their age to be living with disabilities and cognitive issues. Overall, one in eight players (12%) – including similar shares across race – say their health got worse because they skipped or postponed needed care because of the cost (compared to 4% of men their age nationally who reported worsening health after skipping needed care for any reason).

Players living with disabilities are more likely than non-disabled players to report skipping or postponing needed health care because of the cost in the past 12 months (28% v. 11%) and to say their health got worse as a result (17% v. 3%). Forgoing needed health care is also much more common among players with lower household incomes. One-third (35%) of players with annual incomes below $90,000 say they’ve skipped or delayed needed care because of the cost in the past year, with one in four (23%) of this group overall reporting worse health for this reason. Far fewer players with annual incomes of $200,000 or more report skipping or postponing care because of the cost (9%) or worse health as a result (6%). Notably, players living with a disability report average lower incomes than players without a disability.

One in Five ‘88 Players Say They Recently Skipped Needed Health Care Because of the Cost, Including Larger Shares of Those With a Disability

Financial Situation

While most 1988 NFL players say their football career had a positive impact on their finances and report higher average incomes than men their age overall, there are stark disparities in income and financial challenges among players by race and disability status. Black players are more likely than White players to report lower incomes, difficulties maintaining employment, affording health care and housing, having debt, and declaring bankruptcy. These issues are also reported in higher shares among players living with a disability, who are themselves made up of larger shares of Black players.

Players from the 1988 season – including Black players and White players – have higher self-reported household incomes than men their age overall. However, similar to disparities seen in the U.S. population, Black players are much more likely than White players to have lower household incomes. Four in ten Black players report incomes of less than $90,000 compared to just 16% of White players. Conversely, White players are twice as likely as Black players to report annual incomes of $200,000 or greater (42% v. 19%).

While Former Players Have Higher Incomes Than Men Their Age Overall, Black Players are Much More Likely Than White Players to Have Lower Incomes

Most 1988 players (66%) say it was either “very” or “somewhat easy” for them to maintain steady employment or have a stable career after they stopped playing professional football, while one-third say it was either ”very” or “somewhat difficult.” The share who reports these difficulties, however, is much higher among Black players, lower-income players, and those living with a disability. For example, Black players are more than twice as likely as White players to say it was difficult to maintain steady employment or have a stable career after they stopped playing (44% vs. 20%).

One-Third of '88 NFL Players Say it Was Difficult To Maintain Employment Post-NFL Career, Including Larger Shares of Black Players and Those With a Disability

About three in ten players (29%) say that since they stopped playing football they were at some point unable to work due to a disability that was the result of a football-related injury, including a larger share of Black players (37%) compared to White players (19%) and a larger share of defensive players (36%) compared to offensive players (25%). Among players who report being unable to work due to a football-related disability since they retired from the NFL, most (73%) say they were unable to work for a year or more, and half (48%) were unable to work for five years or longer.

Three in Ten Former Players, Including Larger Shares of Lower-Income and Black Players, Say They Have Been Unable to Work Due to a Football-Related Disability
In Their Own Words: How Disabilities Have Impacted 1988 Players’ Financial Situation:

Quotes have been edited to protect player confidentiality and for clarity.

“For a few years the pain in my back and neck and knees prevented me from working. It’s hard to get around with the pain I’m in. I can’t walk far, sit too long, stand long. I’ve been on disability for over 10 years.”

“Knees bad. Memory and recall are my main problems. I’ve lost jobs because I didn’t remember something that I didn’t write down.”

“I don’t make the money that you should make based off of your education and knowledge. But because your memory is affected and you have disabilities and aches and pains, you can’t sustain work in jobs that require use of your memory.”

“I have [had] so many health challenges over the past 30 + years, both body & brain … I am so frustrated with the way we pre-93 former players do not get the proper health care & financial care to keep ourselves from being homeless. I have had to beg, borrow, pawn my rings, & other memorabilia – I am in the middle of having to sell things just to pay rent this month… Very frustrating.”

“My discs in my back are destroyed, where I can’t touch my toes if you paid me 1 trillion dollars. Both my knees are surgically repaired by 1980s standards and my cartilage and stability is nonexistent. My neck is stiff as an oak tree and my memory makes me forget 5 minutes ago. I feel ashamed about my mind and body falling apart. My condition keeps me to myself, and my wife takes care of me. If it wasn’t for my wife, I don’t know where I would be. Financially, I let the money go. I can’t chase it. I’m happy with my wife and family, for as long as I have left.”

“I have not had a full-time job for over 3 years. It is putting tremendous stress on my wife.  She is NOT happy at all. All the stress is on her & I am failing as the primary bread winner. I have my NFL pension but it is not a lot…I am not sure if I would qualify for disability. I could use a job but my body is not getting any better & my mental health is very negative.”

“…it’s extremely difficult to walk, sit, or stand for long periods of time. I can’t work, but if I even chose to work I could only make a certain amount of money or risk losing the little disability money I receive. The system really works against you overall. My Medicare is 80/20. Twenty-percent of high cost medical treatment is a great deal of money. I need knee replacements but I can’t afford 20% of the cost for the operation.”

Despite high rates of insurance coverage, some 1988 players report problems affording health care-related expenses, while one in ten or fewer report problems affording other needs like food and housing.

Overall, about one in six players from the ’88 season say that, in the past 12 months, they have had problems paying their medical bills (16%), and a similar share report problems affording health insurance (14%). Despite their relatively high incomes, one in ten say they’ve fallen behind in paying their rent or mortgage in the past year (10%), and about one in twenty report problems paying for food (6%). These affordability issues are far more common among players living with a disability compared to those who are not, including problems paying their medical bills (24% v. 5%), affording their health insurance (21% v. 5%), falling behind on their rent or mortgage (14% v. 2%) or problems affording food (10% v. 1%) in the past 12 months.

Black players are at least twice as likely as White players to report these affordability issues, including problems paying medical bills (22% v. 10%), affording health insurance (18% v. 10%), falling behind on housing costs (14% v. 23%), and problems paying for food (8% v. 3%).

1988 Players Living With a Disability are Far More Likely Than Those Who are Not to Report Problems Paying for Health Care, Housing, and Food

Reflecting income differences, Black players are more likely to report experiencing certain financial hardships than White players, including having outstanding debt, declaring bankruptcy, and losing a home due to eviction or foreclosure. Overall, a quarter (24%) of 1988 players say they have debt that is past due or that they are unable to pay, while just under one in five say that, since they have stopped playing football, they declared personal bankruptcy (17%) or lost a home due to eviction or foreclosure (16%).

Black players are more than twice as likely as White players to say they have outstanding debt (34% v. 13%), three times as likely to say they’ve declared bankruptcy (24% v. 8%), and six times as likely to say they lost a home due to eviction or foreclosure (25% v. 4%) since they stopped playing football.

Black Players From the '88 Season are More Likely to Report Financial Hardships, Including Outstanding Debt, Declaring Bankruptcy, or Losing  a Home

Appendix

Details on Race and Ethnicity of 1988 Player Sample

For this survey, Black players include all players who identify as Black, including those who may also identify as another race and/or Hispanic. White players are those who identify White as their only racial identity and are non-Hispanic. While players who identified with other racial groups are included in the total, there are insufficient sample sizes to report findings among players who identify as Hispanic (n=9), Asian (n=1), American Indian (n=9), Native Hawaiian (n=1), or Pacific Islander (n=3).

Comparison of 1988 Player Sample to Full 1988 Player Population

The project team took careful consideration to ensure the sample accurately reflected the population under study. One step in order to accomplish this was to track the sample demographics to the population demographics across key variables such as race and ethnicity, position, teams, and years in the league. While the majority of this information was publicly available for the population, race and ethnicity were coded by researchers at Davis Research and KFF. The following tables compare the survey sample to the full 1988 player population who were alive at the time of fieldwork.

1988 Player Sample Compared to All Living 1988 NFL Players: Key Demographics
1988 Player Sample Compared to All Living 1988 NFL Players: Position Type
1988 Player Sample Compared to All Living 1988 NFL Players: Teams

Positions Played by Race

Positions Played in KFF/ESPN Survey of 1988 NFL Players

Methodology

This KFF/ESPN Survey of 1988 NFL Players was designed and analyzed by public opinion researchers at KFF in collaboration with reporters at ESPN. The survey was designed to reach a representative sample of former NFL players who participated in at least one game during the 1988 season. 1,532 individuals were identified as meeting this criteria. The survey was conducted from October 17 through November 30, 2024 online and by telephone. All fieldwork was managed by Davis Research.

Sample and Contact MethodsAll players included in the population were researched and contact information was verified using multiple sources including Lexis-Nexis and Marketing Systems Group (MSG). Of the 1,532 former NFL players who participated in at least one game during the 1988 season, 128 were identified as deceased either prior to fielding or learned about during fielding.  For those cases, interviews with proxy respondents were attempted. Population members were originally contacted using USPS business letter explaining the project and providing both a website to complete the survey as well as an inbound telephone number for the individual to complete the survey with a live trained interviewer. Nonresponse follow-up included email contacts, a reminder letter, as well as telephone calls and text messages. Each player record contained up to six telephone numbers, and attempts were made to contact each record up to eight times. Calls and text messages were made at various times, including evenings and weekends, to maximize response rates.

The final sample includes interviews with 546 former players. An additional 18 interviews with family members of deceased players, and 1 interview with a family member of a living player who was identified as having cognition issues helped to contribute to the reporting.

Participants, including proxy respondents, were offered a $100 gift card or the option to donate the amount to Gridiron Greats, a charity supporting former NFL players.

Representation Considerations The project team took careful consideration to ensure the sample accurately reflected the population under study. One step in order to accomplish this was to track the sample demographics to the population demographics across key variables such as race and ethnicity, position, teams, and years in the league. While the majority of this information was publicly available for the population, race and ethnicity were coded by researchers at Davis Research and KFF. Intercoder reliability was achieved with 10% of the population, Cohen’s kappa (κ) of .898.

In order to increase the likelihood of interviewing Black players, Davis Research in collaboration with KFF maximized efforts to increase participation for that population, including additional telephone calls to targeted records, mailing approximately 500 USPS Priority Mail envelopes to non-responsive records flagged as likely Black/African American, and conducted additional research to refine contact information for records flagged as likely Black/African American.

Response rates were closely monitored throughout fielding to ensure both quality and balanced representation. The net effective response rate (AAPOR Response Rate 5) for living players was 40% and 16% respectively for family members of deceased players.

The final sample quality was assessed by researchers and no weighting adjustments were needed. The margin of sampling error for the full sample is plus or minus 3 percentage points. Numbers of respondents and margins of sampling error for key subgroups are shown in the table below. For results based on other subgroups, the margin of sampling error may be higher. Sampling error is only one of many potential sources of error and there may be other unmeasured error in this or any other public opinion poll.

KFF public opinion and survey research is a charter member of the Transparency Initiative of the American Association for Public Opinion Research.

National comparison data throughout the accompanying reports is based on KFF analysis of Centers for Disease Control and Prevention (CDC) 2023 Behavioral Risk Factor Surveillance System (BRFSS); National Center for Health Statistics 2023 National Health Interview Survey (NHIS); the U.S. Census Bureau’s 2023 American Community Survey (ACS); and KFF’s Racism, Discrimination, and Health Survey (June 6 – August 14, 2023.) Data from BRFSS is among men ages 55-74; all other data is among men ages 55-75. All estimates are based on self-reported survey results and may differ from other clinical estimates.

Endnotes

  1. A series of logistic regression models were conducted to test whether the relationship between race and different health outcomes held after controlling for higher risk position groups, income, age, and years played. ↩︎
  2. While CTE cannot definitively be diagnosed before death, these self-reports likely reflect instances where a health professional indicated to a player that they were showing signs or symptoms consistent with CTE. Other surveys of former professional football players have found that many players believe they have CTE. ↩︎

Health Provisions in the 2025 Federal Budget Reconciliation Bill

Updated: July 8, 2025


Note: KFF now has a clean summary of the health care provisions in the 2025 federal budget reconciliation law as well as a separate implementation timeline highlighting key dates in the law.

This side-by-side comparison tool compares the health care provisions in the House-passed and Senate-passed 2025 budget reconciliation law to each other and prior law. The Senate-passed bill ultimately passed the House on July 3 and was signed into law by President Trump on July 4. The comparison is divided into four categories: Medicaid, the Affordable Care Act, Medicare and Health Savings Accounts (HSAs). It also compares the provisions to a earlier draft of the bill passed by the House on May 22.

Summary of House Reconciliation Bill

VOLUME 28

Few Trust Most Health Content on Social Media, Autism Claims Follow Thimerosal Policy Shift, and Misleading Narratives About SSRIs in Pregnancy


Summary

This volume analyzes findings from the latest KFF Tracking Poll on Health Information and Trust, which show that just over half of adults say they use social media to find health information and advice, but less than half trust the health content they see across an array of social media sites and apps. It also examines false claims linking a mercury-based vaccine preservative to autism, following a federal decision to withdraw recommendations for flu vaccines containing the compound. In addition, it explores misleading narratives about antidepressant use during pregnancy and unproven claims about the health benefits of nicotine.


Featured: KFF’s Latest Poll Finds That Over Half of Adults Use Social Media For Health Information, But Few Trust Most of the Content They See

With public trust in government health agencies as reliable messengers declining, the latest KFF Tracking Poll on Health Information and Trust finds that over half (55%) of adults, including larger shares of young adults and Black and Hispanic adults, say they use social media to find health information and advice at least occasionally. Large shares of adults report seeing information on social media in the past month on about weight loss, diet, or nutrition (72%) and mental health (58%), and about four in ten (38%) report seeing vaccine-related content. Smaller shares say they saw information on social media about abortion (30%) and birth control (22%) in the past 30 days.

Weight Loss, Diet, Nutrition and Mental Health Top List of Health-Related Topics People See on Social Media

The poll also finds that most adults are skeptical of the health information and advice they see across social media platforms. Fewer than half of different social media platform users say they find “most” or “some” of the health information they see on the platforms they use trustworthy. Less than one in ten say they think “most” of this content is trustworthy. On some of the most widely used social media apps or sites including TikTok and YouTube, larger shares of younger adults compared to older adults trust the health information and advice they see.

On Some Platforms, Large Shares of Young Adults Say Most or Some of the Health Information and Advice Is Trustworthy

The latest poll also asked about social media influencers and found that so far, their influence on health is relatively small. As KFF President and CEO Drew Altman wrote in a recent column, just 14% of the public say they regularly get health information and advice from influencers online, and an even smaller share of social media users (5%) can name a particular health influencer they trust.


Recent Developments

Thimerosal Vaccine Claims Spread Online After Federal Policy Shift

SERGII IAREMENKO/SCIENCE PHOTO LIBRARY / Getty Images

False claims that a mercury-based vaccine preservative, thimerosal, is harmful to children gained traction in late July, coinciding with a federal decision to no longer recommend flu vaccines containing the compound. The narrative, which incorrectly links thimerosal to autism and other developmental issues, appeared in online conversation after Health and Human Services (HHS) Secretary Robert F. Kennedy Jr. rescinded the CDC’s recommendations of flu vaccines that contain the ingredient. Kennedy later accepted recommendations by the CDC’s Advisory Committee on Immunization (ACIP) to endorse routine influenza vaccination this year and to only recommend thimerosal-free formulations. The decision followed a June meeting and vote of the CDC’s Advisory Committee on Immunization Practices (ACIP), where a former leader of a group known for its opposition to vaccines presented unsupported claims that thimerosal is toxic to children. On July 23, the day the decision was announced, some X users with large followings cited the policy shift in posts that made false claims about thimerosal. One account, with more than 500,000 followers, repeated the claim that it causes autism and wrote, “You wouldn’t catch me dead taking a flu vaccine… never.. but this is good for those who religiously get it.”

Thimerosal, a mercury-based compound used to prevent contamination in multi-dose vaccine vials, was removed from routine childhood vaccinations in 2001, not because of any evidence of harm but in response to public concern about mercury exposure. Thimerosal contains a form of mercury called ethylmercury, which is excreted by the body much more quickly than methylmercury, the form of mercury found in fish which can accumulate in the body and have hazardous health effects. Confusion between the two compounds contributed to public unease, and the FDA and medical groups recommended removing the compound as a precautionary measure and to preserve confidence in vaccines. Some virologists have argued that the 2001 removal, while intended to increase confidence in vaccines, may have inadvertently reinforced false claims linking them to autism. Dozens of studies since have found no evidence of harm, and rates of autism diagnoses have steadily increased since the compound was largely removed from vaccinations.

In the United States, thimerosal is still used in a small portion of multi-dose influenza vaccine vials to prevent fungal or bacterial contamination. Because these vials are generally less expensive per dose and require less storage space, they are primarily used in high-volume or resource-limited settings, such as mass vaccination clinics. They also remain an important option in many low- and middle-income countries where single-dose vials are harder to distribute and store. The decision to rescind recommendations for thimerosal-containing vaccines may have global effects, leading to reduced access and increased cost, as international health authorities have historically closely watched recommendations by ACIP. In the U.S., insurance coverage for these vaccines may be affected, as coverage requirements are linked to CDC and ACIP recommendations in almost every case. Medical organizations, including the American Academy of Pediatrics (AAP), have further cautioned that the change could further the spread of false claims about vaccines and contribute to rising vaccine hesitancy.

Polling Insights: KFF’s April 2025 Tracking Poll on Health Information and Trust found that  three in four (74%) adults say they are either “very confident” or “somewhat confident” that vaccines for the flu are safe. Confidence in flu vaccines, however, differs across partisans. While majorities across groups are at least “somewhat” confident these vaccines are safe, Democrats (57%) are much more likely than independents (36%) or Republicans (24%) to say they are “very” confident. Confidence is also lower among parents of children under age 18 compared to non-parents (24% vs. 44% are “very” confident these vaccines are safe).

Most Adults are Confident That Flu Vaccines are Safe, But Confidence is Lower Among Republicans and Parents

Online Narratives Misrepresent Antidepressant Safety in Pregnancy

Cd3sign / Getty Images

About one in 10 people experience depression during pregnancy, and around 6% of pregnant people in the U.S. are treated with SSRIs (selective serotonin reuptake inhibitors). Online conversation about these antidepressants in July reflected public confusion about the safety of their use during pregnancy. In late July, social media users repeated exaggerated claims of risk following a July 21 meeting of an FDA advisory panel that presented unbalanced information by emphasizing potential harms of SSRIs during pregnancy beyond what current scientific evidence supports, while giving little attention to documented benefits. Some of the panelists claimed that perinatal usage of the medications can lead to autism, miscarriage, and other harms, or that they offer no therapeutic value, despite strong evidence demonstrating the importance of these medications in addressing maternal mental health. Some social media users shared and amplified these claims, inaccurately describing SSRIs as especially harmful for pregnant and breastfeeding people. One X user, with more than 500,000 followers, wrote, “Evil… so evil. Doctors are actively prescribing SSRI’s to Pregnant Women that Cause Birth Defects in Babies.”  

Some studies cited by panelists suggested potential risks, but psychiatrists and obstetricians criticized these studies for poor design and inadequate control for confounding factors, including the presence or severity of maternal depression. When accounting for these factors, research has largely supported the safety of SSRI use during pregnancy. A large cohort study controlling for confounding factors, for example, found no evidence of association with autism or other neurodevelopmental disorders. Other members of the panel also claimed, without evidence, that SSRIs are wholly ineffective, conflicting with numerous studies, including meta-analyses of randomized controlled trials that have shown SSRIs to be more effective than placebo in treating major depressive disorder.  

Misleading claims that overemphasize the risks of antidepressants in pregnancy may prompt patients to discontinue or delay treatment, putting them at risk for poor outcomes. Untreated perinatal depression carries well-documented and significant consequences for both maternal and fetal health, including preterm birth, low birth weight, and developmental delays. It may also lead to reduced prenatal care, higher rates of substance use, and increased risk of suicidality. According to the CDC, mental health conditions are a leading cause of pregnancy-related deaths, accounting for 22.5% of such deaths in 2020.  

While most evidence supports the safety of SSRIs in pregnancy, some studies have found small increased risks for adverse outcomes, including bleeding complications at delivery. Because the potential harms of medication must be weighed against the risks of leaving depression untreated, guidelines adopted by the American College of Obstetricians and Gynecologists (ACOG) emphasize that treatment for depression, including the use of SSRIs or selective norepinephrine reuptake inhibitors (SNRIs), should be highly individualized. The Substance Abuse and Mental Health Services Administration (SAMHSA) has called for more education on the use of medications during pregnancy, noting that people who had experienced mental health conditions during pregnancy reported that having clearer information would have improved their experiences. Medical organizations, including ACOG, the American Psychiatric Association (APA), and the Society for Maternal-Fetal Medicine (SMFM) stress that the harms of untreated depression in pregnancy may, for many patients, outweigh the risks of medication and therefore recommend a collaborative, shared clinical decision-making process. Research has shown that this practice, in which patients and healthcare providers work together to make informed healthcare decisions, can help improve trust in the physician-patient relationship. 

Influencers Promote Unproven Health Benefits of Nicotine

Anastassiya Bezhekeneva / Getty Images

Mentions of the supposed health benefits of nicotine have appeared widely on social media, with some health influencers and accounts with large followings sharing posts that claim that it is not addictive and that it improves focus, boosts brain function, and may prevent or cure neurodegenerative diseases. Some X accounts, including one with more than 100,000 followers, posted a video clip of a podcast interview in which a chiropractor and influencer claimed nicotine was not addictive and was a cure for Parkinson’s disease, Alzheimer’s disease, multiple sclerosis, COVID-19, and glioblastoma brain tumors. Another account, with more than 800,000 followers, posted a podcast clip of a prominent political commentator attributing his health to his use of nicotine. KFF’s latest Tracking Poll on Health Information and Trust found that 15% of adults who use social media, including 23% of those ages 18-29, say they regularly get health information and advice from influeners on social media.

Claims of nicotine’s health benefits are largely made without evidence. Researchers are investigating therapeutic applications of nicotine, specifically for Parkinson’s disease and Alzheimer’s-related cognitive decline, but results from observational and animal studies have not yet been replicated in large-scale clinical trials. Curative properties have not been demonstrated, and nicotine is not approved by the FDA for any of these therapeutic uses. A 2008 correlational review of nicotine and Parkinson’s disease, for example, suggested that nicotine could help reduce symptoms and drug-induced side effects, but a later clinical trial found that nicotine did not slow progression of the disease. For Alzheimer’s-related cognitive decline, a small trial investigating nicotine and mild cognitive impairment found some improvement in attention and memory, but the authors cautioned that further studies were needed, which are still underway.

As these speculative claims about nicotine’s health benefits continue to circulate, they may obscure established health risks, encourage use by non-users, and deter quitting among current users. Despite claims by some social media users, nicotine is known to be highly addictive, and a 2015 review found that it increases risk of cardiovascular, respiratory, and gastrointestinal disorders and has adverse effects on the immune system and reproductive health. It is particularly harmful in some populations, including pregnant people and adolescents, where nicotine exposure can be toxic to a developing fetus and interfere with brain maturation.


AI & Emerging Technology

AI-Generated Public Health Campaigns Most Effective With Human Oversight

KFF / Getty Images

Findings from a series of studies published in PNAS Nexus suggest that artificial intelligence (AI) could streamline public health media campaigns by selecting real-time, community-generated messages from social media to create persuasive health messaging. Researchers from the University of Pennsylvania, University of Illinois, Emory University, and government and community agencies developed an AI system to automatically generate an HIV prevention and testing campaign for counties in the U.S. The system collected messages from social media posts and evaluated whether they were actionable, relevant, and appropriate for the target population, men who have sex with men (MSM).

Researchers recruited 260 participants to review 36 selected messages and rate them on actionability, appropriateness, accuracy, relevance, and effectiveness. 12 messages were selected by the AI and reviewed by a human researcher, 12 were AI-selected without human review, and 12 were control messages taken from a simple keyword search. Participants rated messages selected by the AI higher than messages from the control group, with those vetted by a human scoring highest. In a separate test, researchers provided access to the tool to public health agencies and community-based organizations, finding that the AI selection process made them more likely to post HIV prevention messages on social media.

Researchers noted, though, that using machine learning tools in this way may introduce algorithmic bias, unintentional errors caused by existing prejudices in the data used to train AI systems, particularly when automated processes are used without a structured human review. They emphasized the continued importance of human oversight to mitigate this bias, as well as the risk of amplifying false information from community-generated messages. Among study participants, messages reviewed by human researchers were consistently rated more persuasive and accurate.

About The Health Information and Trust Initiative: the Health Information and Trust Initiative is a KFF program aimed at tracking health misinformation in the U.S., analyzing its impact on the American people, and mobilizing media to address the problem. Our goal is to be of service to everyone working on health misinformation, strengthen efforts to counter misinformation, and build trust. 


View all KFF Monitors

The Monitor is a report from KFF’s Health Information and Trust initiative that focuses on recent developments in health information. It’s free and published twice a month.

Sign up to receive KFF Monitor
email updates


Support for the Health Information and Trust initiative is provided by the Robert Wood Johnson Foundation (RWJF). The views expressed do not necessarily reflect the views of RWJF and KFF maintains full editorial control over all of its policy analysis, polling, and journalism activities. The data shared in the Monitor is sourced through media monitoring research conducted by KFF.

Policy Tracker: Youth Access to Gender Affirming Care and State Policy Restrictions

Last updated on August 12, 2025

states have enacted laws/ policies limiting youth access to GAC

of trans youth (ages 13-17) live in a state that has enacted a law/policy limiting access to GAC

states are facing lawsuits challenging their laws/policies limiting youth access to GAC

states impose professional or legal penalties on health care practitioners providing minors with GAC

State laws and policies prohibiting or restricting minor access to gender affirming care have proliferated in recent years. The first state to pass such a law was Arkansas in 2021. By January 2024, that number increased more than five-fold, with states having passed such laws/policies. Most are being challenged in court.

On June 18, 2025, the U.S. Supreme Court ruled in, United States v. Skrmetti, a case challenging Tennessee law (SB1) banning gender affirming care. The court found that the law did not constitute sex-based discrimination and did not violate the U.S Constitution’s 14th Amendment Equal Protection clause. As a result, 25 bans remain in place. However, bans in Montana and Arkansas are currently permanently enjoined by court order. The challenge in Montana relates to the state constitution and is therefore not directly impacted by the decision and the law remains blocked. The federal court in Arkansas found the law violated both the Equal Protection and Due Process clauses. The injunction remains in place given its basis on Due Process claims.

This tracker provides an overview of these laws/policies and any associated litigation by state, identifying which groups of people are impacted in addition to minors (e.g. providers, parents, etc.), the types of penalties providers face (i.e. professional or felony), the status of legal challenges, and other key information.

Learn more in this short analysis assessing the policy landscape as of January 24, 2024: The Proliferation of State Actions Limiting Youth Access to Gender Affirming Care

What is Gender Affirming Care (GAC)?

Gender-affirming care is a model of care which includes a spectrum of “medical, surgical, mental health, and non-medical services for transgender and nonbinary people” aimed at affirming and supporting an individual’s gender identity. Gender-affirming care is a model of care which includes a spectrum of “medical, surgical, mental health, and non-medical services for transgender and nonbinary people” aimed at affirming and supporting an individual’s gender identity. Gender affirmation is highly individualized. Not all trans people seek the same types of gender affirming care or services and some people choose not to use medical services as a part of their transition.

Nearly Half of States Have Enacted Laws/Policies Limiting Youth Access to Gender Affirming Care
Table 1: Overview - State Law/Policy Making Limiting Youth Access to Gender Affirming Care 
Table 2: Policy Details - State Law/Policy Making Limiting Youth Access to Gender Affirming Care  
Table 3: Litigation Landscape - State Law/Policy Making Limiting Youth Access to Gender Affirming Care 

How Recent Manufacturer Savings Programs May Impact Individual Out-of-Pocket Spending on Asthma and COPD Inhalers

Authors: Delaney Tevis, Justin Lo, Nisha Kurani, and Cynthia Cox
Published: Aug 11, 2025

A new analysis shows that individuals with employer insurance could save 41% on their out-of-pocket spending for asthma and COPD inhalers through manufacturer savings. In response to a U.S. Senate investigation into inhaler costs, 3 drug makers voluntarily capped out-of-pocket costs on their brand-name asthma and COPD inhalers.

Among the asthma and COPD inhalers covered under the voluntary out-of-pocket spending caps, over half may have patient savings of $19 or less per 30-day supply.

The full analysis and other data on health costs are available on the Peterson-KFF Health System Tracker, an online information hub dedicated to monitoring and assessing the performance of the U.S. health system.