Introduction
Extreme heat continues to be a pressing issue as 2024 was recognized as the hottest year ever experienced, and 2025 is slated to be one of the five warmest years on record, with experts predicting more extreme heat records over the next five years. Warm seasons have lengthened, become more frequent, and increased in intensity due to climate change. In early July 2025, communities in Texas, New Mexico, and North Carolina experienced deadly flash floods, with over 100 people dying in the Texas floods. Flash floods are primarily a summertime weather event, the combination of high humidity levels, drought, and heat create favorable conditions for torrential downpours and flash flood events. More flash floods are expected to occur in the U.S. during summer 2025 and research finds that the risk of future flash flood events will increase as the climate warms.
In recent years, there have been rising incidents of extreme heat, poor air quality, drought, and wildfire events both globally and across the country. Exposure to extreme heat poses major health risks that disproportionately affect those with limited resources. Research shows that between 1999 and 2023, the number of heat-related deaths in the U.S. increased by 117%, from 1,069 heat-related deaths in 1999 to 2,325 in 2023. Moreover, KFF analysis of data from the Centers for Disease Control and Prevention shows that American Indian or Alaska Native and Black people are at higher risk of experiencing a heat-related death compared to their White counterparts. Estimates suggest that heat events in the U.S result in approximately $1 billion in excess health care costs each year. If left unaddressed, climate change could cost the U.S. economy approximately $14.5 trillion over the next fifty years.
Prior administrations and state and local governments increased efforts to address climate change, extreme heat, and their impacts on human health in recent decades. However, more recent efforts by the Trump administration have reversed some of these prior actions. Rollbacks in federal actions to address climate change-related inequities broadly and the impacts of extreme heat specifically, may contribute to worse health outcomes, disproportionately impacting many populations that already face disparities in health, including lower income populations, people of color, and immigrants. The elimination of key offices, programs, and data tools makes it more difficult to assess and mitigate the health risks associated with environmental hazards, including extreme heat. Beyond the federal administrative actions already taken, cuts to federal funding may further erode efforts to reduce heat exposure and its health-related impacts. Some states have taken steps to mitigate exposure to extreme heat and its health impacts. However, without broader federal actions and standards, protections will vary across states. As climate change accelerates and intensifies extreme heat, the impacts of the rollbacks of environmental protections and equity initiatives will likely widen existing health disparities, reduce community resilience, and weaken the federal government’s ability to respond to extreme climate events.
This brief provides an overview of the federal and state landscape of recent policies addressing extreme heat and health equity.
Prior administrations implemented efforts to address climate change, extreme heat, and their impacts on human health in recent decades. In 1990, President George H.W. Bush implemented the Global Change Research Act of 1990, which created the U.S. Global Change Research Program (USGCRP) and required the release of the National Climate Assessment (NCA) every four years. The USGCRP has advanced climate change research over the past 35 years, and the NCA continues to report scientific research on climate change and its impacts on the U.S., helping to inform community responses to climate-related challenges. The Clinton administration implemented an Executive Order on “Federal Actions to Address Environmental Justice in Minority Populations and Low-Income Populations”, which required federal agencies to make identifying and addressing environmental justice a key part of their missions. Federal agencies were tasked with determining whether their programs had disproportionate detrimental effects on underserved populations through exposure to environmental hazards, including heat. The Executive Order also directed the creation of an Interagency Working Group on Environmental Justice to identify the disproportionate effects of environmental hazards exposure on communities of color and low income groups, and developing an environmental justice strategy. President George W. Bush’s administration was characterized by a withdrawal from leadership in federal regulation of climate change, including the U.S.’ withdrawal from the Kyoto protocol, an international agreement to lower greenhouse emissions that contribute to global warming and climate change. The Obama administration implemented the Memorandum of Understanding on Environmental Justice, highlighting the disproportionate burden of pollution and environmental hazards on communities of color and low income groups. The Obama administration also created the National Integrated Heat and Health Information System (NIHHIS), which sought to increase community preparedness for extreme heat events. NIHHIS integrated heat and health information across the federal government to support on-the-ground efforts to reduce the impacts of extreme heat on human health.
The Biden administration took additional steps to address the impacts of climate change, extreme heat, and exposure to environmental hazards on human health. These actions included the Executive Order, “Revitalizing Our Nation’s Commitment to Environmental Justice for All”, which created the Office of Environmental Justice and External Civil Rights to identify gaps in data and the cumulative impacts of environmental justice on underserved groups. The Biden administration also implemented Executive Order, “Tackling the Climate Crisis at Home and Abroad”, to elevate climate change as a national security priority. Among other actions, it established the Office of Climate Change and Health Equity (OCCHE) within the Department of Health and Human Services, which aimed to address the impact of climate change on health and developed tools to help track heat-related illnesses. Additionally, the U.S. Department of Housing and Urban Development implemented measures, including increasing utility allowances to help mitigate the effects of extreme heat in public housing.
The Biden administration also implemented policies to specifically address the impacts of extreme heat on workers. In 2022, the Occupational Safety and Health Administration (OSHA) launched the National Emphasis Program for Outdoor and Indoor Heat-Related Hazards, an enforcement program that sought to identify and eliminate or reduce worker exposures to occupational heat-related illnesses and injuries. The program was an expansion of the agency’s heat-related illness prevention initiative. In 2021, OSHA began engaging with stakeholders to develop regulations to protect workers from heat-related hazards and established a Heat Injury and Illness Prevention Work Group, which made recommendations for heat injury and illness prevention standards. In 2024, OSHA issued a proposed rule on Heat Injury and Illness Prevention in Outdoor and Indoor Work Settings. The proposed rule would require employers to have written heat injury and illness prevention plans, heat injury precautions, trainings, and evaluations. Specifically, it would require employers to provide workers with cool drinking water, shade, and more rest breaks once the heat index reached 90 degrees. The public comment period on the rule has closed, but OSHA conducted public hearings through July 2, 2025. Beyond the proposed rule, the administration launched its heat.gov website as a source of information on heat and health. Moreover in 2024, the U.S. Department of Health and Human Services released its National Heat Strategy, a plan to coordinate federal action to address extreme heat and its impacts.
On the first day of its second term, the Trump administration began implementing policies and regulations that reverse efforts to mitigate the impacts of extreme heat on health. President Trump signed Executive Order “Initial Recissions of Harmful Executive Orders and Action” and Executive Order “Ending Illegal Discrimination and Restoring Merit-Based Opportunity”, which revoked key climate change and environmental justice policies implemented by prior administrations. As part of efforts to eliminate diversity and disparities-related initiatives, the Trump administration eliminated environmental justice programs. These actions included eliminating the Low Income Home Energy Assistance Program, which helps low income Americans, many of whom are people of color, pay their energy bills and stay cool during the summer, and terminating grants from the U.S. Department of Agriculture’s urban forestry program, which sought to increase tree canopy cover in low income communities around the country, addressing tree inequity and exposure to extreme heat. The Department of Health and Human Services also eliminated OCCHE, which had developed tools to track heat-related illnesses. The Trump administration also cut more than 90% of the National Institute for Occupational Safety and Health, including the entire heat team involved in efforts to address heat-related illnesses and deaths among workers in the farming and construction industries. In April, the Centers for Disease Control and Prevention (CDC) also fired staff from its Division of Environmental Health and Science Practice (DEHSP) who sought to protect communities from exposure to heat waves, wildfires, and other environmental hazards as well as provided grants to local and state officials to create heat wave plans and build community cooling centers. However, as of June 11th, 2025, at least 150 staff from the National Center for Environmental Health and nearly all workers from the DEHSP were reinstated.
The Trump administration has also taken actions that block or weaken state level climate measures, including heat protection rules. On April 8th, President Trump issued Executive Order “Protecting American Energy from State Overreach,” which directs the Attorney General to identify and block state and local laws that address climate change, environmental, social, and governance initiatives, and environmental justice. CDC’s Climate and Health Program’s Climate-Ready States and Cities Initiative, which helped state and local health departments prepare for and respond to climate-related health outcomes was among the programs cut from CDC’s DEHSP. Thirteen jurisdictions (AR, CA, CT, FL, ME, NY, NC, OR, PR, San Francisco, VT, WI, County of Santa Clara) were recipients of grants from the program. North Carolina’s Department of Health and Human Services reports that the state’s Heat Health Alert System and Heat-Related Illness Surveillance System may be at risk due to these cuts. The alert systems help monitor and identify unhealthy heat levels and heat-related illnesses.
In recent years, many states have enacted climate change legislation related to extreme heat and its impact on human health. Some states, including Maryland, Massachusetts, New York, Vermont, and California, have introduced Climate Superfund Bills that seek to hold fossil fuel producers and refiners responsible for their impacts on climate change, strengthen infrastructure, increase community environmental resilience, and mitigate the impacts of climate change. For example, New York’s Climate Superfund Bill, the “Polluter Pays Bill” is expected to collect $75 billion over 25 years to fund infrastructure and other projects, including the building of cooling centers to help residents stay cool during heat waves. Additionally, some states, including New Jersey, New York, North Carolina, and Arizona, have released Extreme Heat Action Plans that seek to build community resilience through coordinated government action, educating the public on extreme heat, and developing heat-ready infrastructure. The plans also direct and coordinate investments in historically disadvantaged communities that are disproportionately vulnerable to extreme heat. In North Carolina, the Heat Action Toolkit includes steps for health care providers and other leaders to care for disproportionately affected communities during heat waves. Some states are also engaging in programs to mitigate the impact of extreme heat on Medicaid enrollees. As of July 2024, 13 states have used Section 1115 Medicaid waivers to facilitate access to air conditioning. Oregon was the first state to implement this program to support vulnerable residents during extreme heat events.
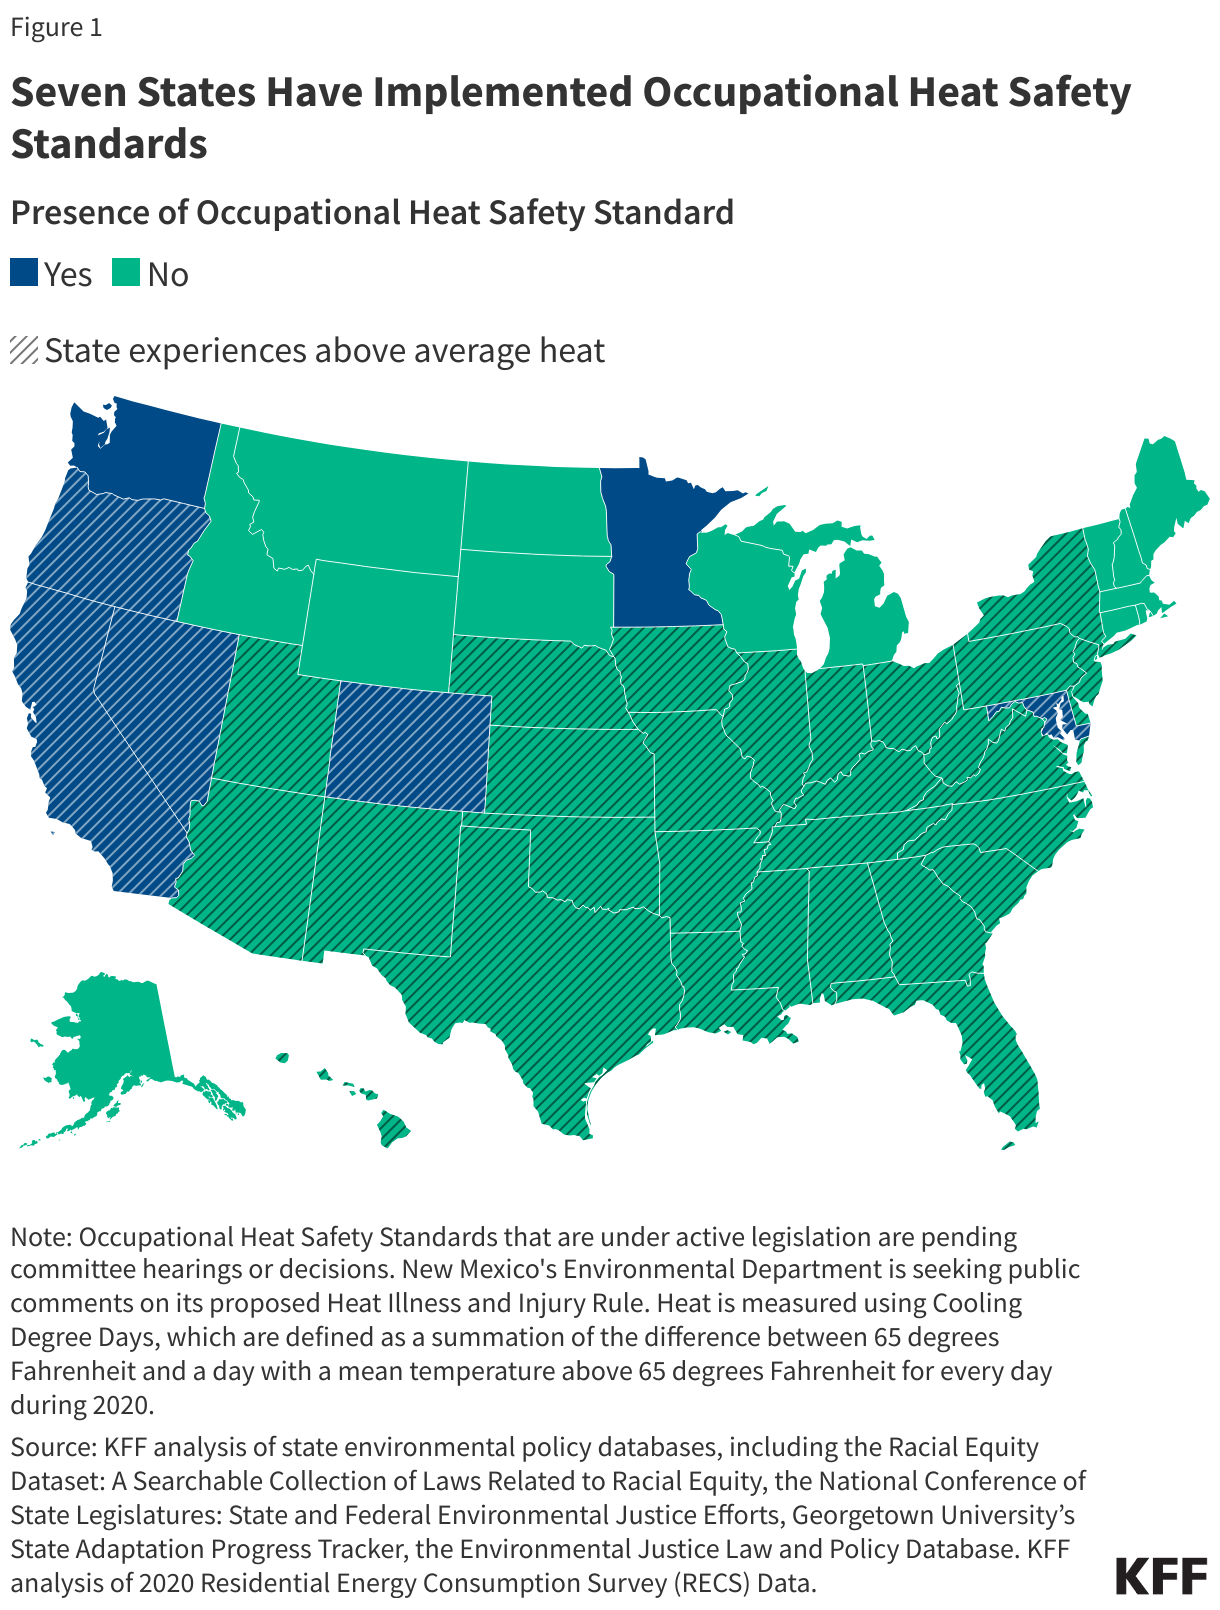
California, Colorado, Maryland, Minnesota, Nevada, Washington, and Oregon are addressing the health impacts of extreme heat on workers through comprehensive heat protection standards (Figure 1). These standards aim to protect workers who are at greater risk of heat-related illnesses. For example, California’s Heat Illness Prevention Standard mandates access to shade, cool water, and training for outdoor workers. Washington’s Outdoor Heat Exposure Rules implement specific temperature thresholds that trigger safety measures for workers. Thirteen additional states are in the process of developing their own occupational heat safety standards, including New Mexico, which has a Heat Illness and Injury Prevention Rule under public comment.
In contrast, Texas and Florida implemented legislation that limit their county- and municipal-level governments’ abilities to provide certain heat protections for outdoor workers. In 2023, Texas enacted House Bill 2127, also known as the “Death Star Bill,” which preempts local laws, including heat protection standards for outdoor workers. In 2024, Florida enacted House Bill 433, which prevents city and county governments from requiring that employers, including government contractors, provide heat protections for outdoor workers outside of those required under state or federal law. These protections include requiring water breaks and other cooling measures for outdoor workers.