5 Key Facts About Medicaid and Pregnancy

Published: May 29, 2025

Improving maternal and infant health is a national priority at the state and federal level. In the face of preventable maternal mortality, stark racial and ethnic disparities, and large gaps in the availability of maternity and reproductive health care in many communities, policymakers, clinicians, and other health care stakeholders have turned to the Medicaid program to improve the health of women and children.

As a primary payer for maternity care in the U.S., the Medicaid program is an integral component of maternal and infant health in the country. Many federal initiatives aiming to improve maternal and infant health include policies to strengthen the Medicaid program, and many state program leaders cite improving maternal and child health as a top priority. President Trump and other conservatives have called for increasing the birth rate. At the same time, Congress is considering changes to Medicaid that would reduce federal spending on the program and lead to an estimated 7.6 million people losing Medicaid coverage and becoming uninsured. This brief examines Medicaid’s pregnancy and postpartum coverage and its support for strengthening and improving maternal health outcomes.

1. Medicaid finances over four in ten births nationally and nearly half of births in rural communities.

Medicaid is the largest single payer of pregnancy-related services, financing 41% of births nationally in 2023 (Figure 1) and over half of births in four states (Louisiana, Mississippi, New Mexico, Oklahoma). The program plays a particularly large role in rural areas, paying for nearly half (47%) of all births in rural communities and helping to shore up financing for hospitals in rural areas suffering from provider shortages. Rural counties in states with more expansive Medicaid eligibility criteria for pregnancy coverage are more likely to have hospitals that provide obstetric services than rural counties in states with more restrictive program eligibility thresholds. Recognizing the importance of assuring that pregnant people have access to care, federal Medicaid law also explicitly prohibits out-of-pocket charges for any pregnancy-related care, an important protection for pregnant people covered by the program, as out-of-pocket health expenses for maternity care can reach thousands of dollars.

Nationally Medicaid Covers Four in Ten Births, but in Four States it Covers Over Half of Births

2. All states have chosen to extend Medicaid eligibility to pregnant people beyond the federal minimum requirements.

By federal law, the minimum Medicaid eligibility level for pregnant women is 138% of the federal poverty level (FPL), which is $36,770 for a family of three. Many states also use the federal Children’s Health Insurance Program (CHIP) program to extend eligibility to pregnant women at higher income levels. However, nearly all states, across partisan divides, have used their flexibility to set Medicaid income eligibility criteria for pregnancy above the minimum requirement so that more pregnant people can qualify for coverage. As a result, the median eligibility limit (Figure 2) for pregnancy coverage in Medicaid and CHIP is well above the minimum requirement in states that voted for President Trump (205% FPL) and states that voted for former Vice President Harris (217% FPL).

Many states chose to broaden eligibility for pregnant people during the 1980s, in part responding to high rates of infant mortality, particularly in southern states. Recognizing the importance of prenatal care for both maternal and infant health outcomes, states embraced the opportunity to cover pregnant people and get them into care as early as possible.

States Across the Political Spectrum Use the Medicaid Program to Prioritize Coverage for Pregnant People

3. States use Medicaid to strengthen and improve maternal health care quality and outcomes.

Amid a national crisis in maternal health, characterized by high rates of maternal mortality and morbidity, regional shortages in maternity clinicians, closures of maternity wards in rural and urban communities, and ongoing concerns about reproductive care access, several states are leveraging their Medicaid programs to improve the quality of maternity care and maternal health outcomes. These efforts include increased investment in outreach and education to enrollees and providers about maternal health issues; expanded coverage for benefits such as doula care, home visits, and substance use disorder and mental health treatment; and use of new payment, delivery, and performance measurement approaches. For example, South Dakota has created a pregnancy care management program that offers enhanced reimbursement to providers for care coordination and meeting prenatal and postpartum care program objectives.

KFF research has found that most states cover a broad range of maternity care services, including prenatal screenings, folic acid supplements, labor and delivery, and breastfeeding supports (Figure 3). In addition, a growing number of states have expanded benefits beyond traditional maternity services in recent years, such as for doula services and home visiting programs, to promote better maternal and infant health outcomes and reduce racial/ethnic health disparities. Some states are focusing on other support services. For example, Nebraska, Tennessee, and New Jersey are piloting programs that provide nutrition counseling and medically indicated meals for pregnant/postpartum individuals. In the face of federal funding cuts, these program enhancements may be difficult or impossible for states to continue to support.
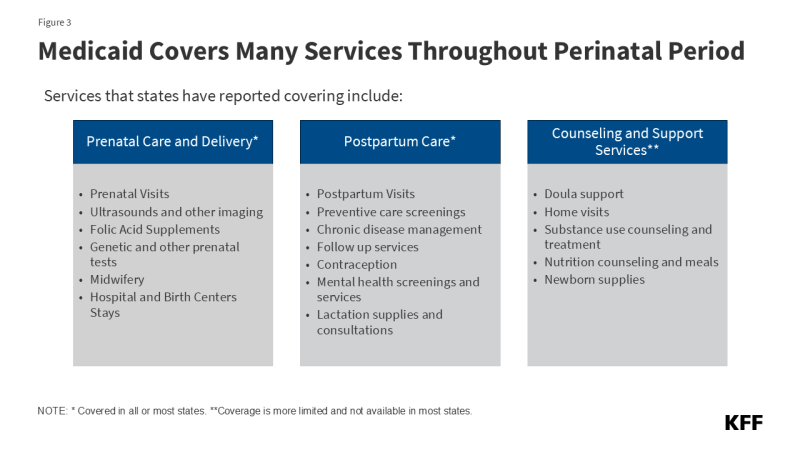
Figure 3 is titled, "Medicaid Covers Many Services Throughout Perinatal Period" Services that states have reported covering include these categories: Prenatal Care and Delivery, Postpartum Care, and Counseling and Support Services.

4. Medicaid expansion broadens access to Medicaid coverage before pregnancy, providing an important pathway to primary and preventive care that has been demonstrated to improve pregnancy outcomes.

Decades of research has found that pre-pregnancy health is a key determinant of both maternal and infant outcomes. Coverage prior to pregnancy provides access to important primary and preventive care as well as the opportunity to assess and manage chronic diseases that affect pregnancy, including hypertension, obesity, and diabetes. KFF research finds that Medicaid expansion covers 38% of women ages 19-49 enrolled in the program. Women in Medicaid expansion states are more than twice as likely (Figure 4) to be enrolled in the program prior to becoming pregnant compared to women in non-expansion states (59% vs. 26%). Conversely, most women in non-expansion states obtained Medicaid coverage only after becoming pregnant, with about one-third (34%) enrolling after the first trimester. As a result, Medicaid expansion is associated with increased use of prenatal services as well as lower rates of adverse birth outcomes such as low birthweight newborns. Federal law stipulates that children born to women covered by Medicaid are automatically eligible and enrolled in the program for the first year of their life.

Medicaid Expansion Helps Women Obtain Health Coverage Before Pregnancy

5. Individuals who qualify for Medicaid during pregnancy face an income eligibility cliff one year after giving birth, but the cliff is not as steep in expansion states.

Until recently, Medicaid pregnancy coverage ended at 60 days postpartum. This changed with a provision in the American Rescue Plan Act (ARPA) of 2021 that gave states a new option to extend postpartum coverage to 12 months. Today, all but two states (Arkansas and Wisconsin) have adopted this optional eligibility extension, which means that birthing parents can stay covered for a year.

Medicaid eligibility levels for parents are much more restrictive than those related to pregnancy, which means that in all states some new parents no longer qualify for Medicaid after the postpartum period, but there is a divide in access to coverage between expansion and non-expansion states. In states that have adopted the Medicaid expansion, new parents with income below 138% FPL can retain Medicaid eligibility and those with income above that level are generally eligible for subsidized coverage in the Marketplace. In contrast, in states that have not adopted Medicaid expansion, more low-income parents are at risk of becoming uninsured just as their children enter the toddler years because adults with incomes below the poverty level do not qualify for subsidies in the Marketplace and because of the extremely low Medicaid eligibility levels for parents (Figure 5). For example, in Texas, parents in a family of three only qualify for continued Medicaid coverage after the postpartum period if they make less than $3,900 a year (15% FPL). Across all non-expansion states, median eligibility for parents is 33% FPL, which is approximately $8,800 annually for a family of three.

Medicaid expansion offers continuous coverage following the postpartum period for many parents and promotes access to care for many parents’ ongoing health needs, including conditions that may have been identified during pregnancy but require ongoing care and treatment. This includes many chronic diseases that are leading causes of adverse maternal health outcomes, such as hypertension and other cardiovascular conditions as well as depression and other mental health conditions. KFF research shows that women in Medicaid expansion states are able to retain coverage for longer periods after a delivery. The program’s coverage of contraception and family planning can help people prevent, plan, and space subsequent pregnancies for optimal outcomes.

In Most States that Have Not Expanded Medicaid, Eligibility for Parents is Below the Federal Poverty Line

The Ryan White HIV/AIDS Program: The Basics

Published: May 29, 2025

Key Facts

  • The Ryan White HIV/AIDS Program, first enacted in 1990, is the largest federal programdesigned specifically for people with HIV, serving over half of all those diagnosed. It is a discretionary grant program dependent on annual appropriations from Congress.
  • It is the nation’s safety net program for people with HIV, providing outpatient HIV care, treatment, and support services to those without health insurance and filling in gaps in coverage and assisting with costs for those with insurance limitations.
  • Most Ryan White clients are low-income, male, people of color, and half are gay and bisexual men and other men who have sex with men.
  • The program is the third largest sourceof federal funding for HIV care in the U.S., following Medicare and Medicaid and is the largest source of HIV discretionary funding. Funding is distributed to states/territories, cities, and HIV organizations in the form of grants. In FY 2024, the Ryan White HIV/AIDS Program was funded at $2.6 billion, which includes continued funding for the federal “Ending the HIV Epidemic” (EHE) initiative, created by President Trump during his first term.
  • While the Ryan White Program has a long history of bipartisanship, the Trump administration has indicated that it will seek to eliminate the EHE, including its funding, end one part of the Ryan White program, and move the remainder of Ryan White into a new HHS agency as part of a larger departmental reorganization.

Overview

The Ryan White HIV/AIDS Program (Ryan White), the largest federal program designed specifically for people with HIV in the United States, serves over half of people in the U.S. diagnosed with HIV. First enacted in 1990, Ryan White has played an increasingly significant role as the number of people living with HIV has grown over time and people with HIV are living longer. It provides outpatient care and support services to individuals and families affected by HIV, functioning as the “payer of last resort,” by filling in the gaps for those who have no other source of coverage or face coverage limits or cost barriers. Multiple “parts” of the program (described below) can purchase health insurance on behalf of clients, which is often less expensive than paying for drugs alone and offers broader health coverage (which is different from when the program pays directly for medical costs as those must relate specifically to HIV).

The program has been reauthorized by Congress four times since it was first created (1996, 2000, 2006, and 2009) and each reauthorization has made adjustments to the program. The current authorization lapsed in FY 2013, but the program has continued to be funded through the annual appropriations process as there is no “sunset” provision or end date attached to the legislation. The program is currently administered by the HIV/AIDS Bureau (HAB) at the Health Resources and Services Administration (HRSA) of the Department for Health and Human Services (HHS), which provides funding to state, local, and community-based grantees to provide HIV services across the country.

The Ryan White Program has been a central component of the federal government’s Ending the HIV Epidemic (EHE) initiative, launched in 2019 under the first Trump Administration. New EHE funding has allowed the program to serve new people and brought others who had fallen out of care, back in. However, questions have been raised about whether the Trump administration will support the EHE going forward.

Clients

More than half a million Ryan White clients received at least one medical, health, or related support service through the program in 2022, with many receiving multiple types of services:

  • More than half (59%) had incomes at or below the federal poverty level (FPL) (which in 2022 was $13,590 for a single person or $27,750 for a family of four); 28% had incomes between 101% and 250% FPL.
  • Nearly one-fifth (18%) were uninsured, a decrease from 28% in 2013, prior to major coverage expansions under the Affordable Care Act (ACA). Most clients (82%) have some form of insurance coverage: Medicaid is the primary payer for Ryan White clients, covering 39%, including those dually eligible for Medicare. Other coverage includes: private insurance (20%), Medicare only (10%), and other or multiple sources of insurance (12%).
  • Clients are largely male (72%); 25% are female and 3% are transgender. Approximately half (46%) are between the ages 45 and 64, up from 22% in 2016. More than one-third (39%) are between 25-44. Smaller shares are under 25 (4%) or over 64 (12%). Differing from the U.S. population overall, most clients are people of color (72%), including 45% who are Black and 25% who are Hispanic. Just over one-quarter of clients (25%) are White. Half (52%) are gay and bisexual men, or men who have sex with men.
Ryan White Clients & U.S. Population, by Race/Ethnicity, 2022

Structure & Funding

The Ryan White Program is the third largest source of federal funding for HIV care in the U.S., after Medicare and Medicaid. In FY24 funding for the program totaled $2.6 billion in FY 2024. Federal funding for the program, which is appropriated by Congress annually, began in FY1991 and increased significantly in the mid-1990s, primarily after the introduction of highly active antiretroviral therapy (HAART). For many years thereafter, funding continued to increase, first slowing down and then, eventually, flattening out. This trend began to shift modestly when new funding as part of the EHE Initiative marked the first significant increase to the program in many years. Since then, funding for EHE has risen substantially, increasing to $165 million in FY 2024. (See Figures 2 and 3)

Ryan White HIV/AIDS Program Funding Increases Were Driven by EHE Funding, FY 2014 - FY 2024

However, funding for the Ryan White Program overall has not kept pace with inflation and does not necessarily meet the needs of a rising number of clients. (See Figure 3).

The Ryan White HIV/AIDS Program is composed of “Parts,” each with a different purpose and funded as a separate line item through annual Congressional appropriations. Funding is provided to states and territories (Part B) cities (Part A), and to providers, community-based organizations (CBOs), and other institutions (Parts C, D, and F), in the form of grants (described in detail in Table 1). In recognition of the varying nature of the HIV epidemic, grantees are given broad discretion to design key aspects of their programs, such as specifying client eligibility levels and service priorities. However, there are requirements, including that, unless granted a waiver, grantees must spend 75% or more of funds on “core medical services” under Parts A through C and that all state AIDS Drug Assistance Programs (ADAPs) must have a minimum formulary for medications

Description of the Ryan White Program, by Part, FY24

Ryan White HIV/AIDS Program & Care Outcomes

While many clients have gained coverage under the ACA, Ryan White continues to play a critical role as a safety net provider for those who remain uninsured or underinsured, helping to fill the gaps for clients with insurance, including assisting with insurance affordability and access to support services. Notably, Ryan White clients are significantly more likely to have sustained viral suppression compared to those without program support (68% v. 58%) and this pattern was observed across all coverage types. Viral suppression affords optimal health outcomes at the individual level and, because when an individual is virally suppressed they cannot transmit HIV, a significant public health benefit.

Key Issues

First enacted as an emergency measure, the Ryan White Program has grown to become a central component of HIV care in the U.S., playing a critical role in the lives of many low and moderate-income people with HIV. Looking ahead, there are several key issues facing the program that will be important to monitor, including:

  • Future funding. As a federal grant program, funding is dependent on annual appropriations by Congress, and funding levels do not necessarily correspond to actual need (i.e. the number of people seeking services or the costs of services) and, as noted above, the program’s funding has not kept pace with inflation. As a result, not all states and communities have been able to meet the needs of people in their jurisdictions. Additionally, the Trump administration has proposed eliminating Part F of the program in its preliminary budget released in May 2025, and, in an earlier leaked budget document, proposed to eliminate the EHE. It has yet to be seen whether Congress will continue to appropriate funding to Part F or EHE and at what level.
  • Structural changes and commitment to HIV. The Trump administration has also been actively scaling back the nation’s HIV response through staffing and funding cuts which have impacted HHS significantly, including HRSA/HAB. These changes could make program management, grant delivery, and data collection/analysis more challenging. This administration also plans to move HRSA to a new agency, the Administration for a Healthy America, but it is unclear how this will work and what impact it will have on the program.
  • Major changes to the health policy landscape. The Trump administration and Congress are implementing or exploring significant, broader health policy changes that could impact the Ryan White Program. These include efforts to restrict access to gender affirming care, including in the Ryan White Program, as well as proposals to substantially change the Medicaid program which could lead to large coverage losses for individuals and/or cost-shifting to states and the Ryan White.

5 Key Facts About Nursing Facilities and Medicaid

Published: May 28, 2025

The substantial Medicaid savings in the reconciliation bill that has been passed by the House could have major implications for nearly 15,000 federally certified nursing facilities and the 1.2 million people living in them. Nursing facilities provide medical and personal care services for older adults and people with disabilities, and Medicaid covered 44% of long-term institutional care costs in 2023. In response to cuts in federal Medicaid spending, states could opt to lower Medicaid reimbursement rates for nursing facilities, which could result in reductions in staffing that are tied to lower nursing facility quality and poorer outcomes. A separate Medicaid provision would tighten eligibility by reducing the home equity limit overtime, making it more difficult for people to qualify for nursing facility, home care and other long-term care services.

The proposed legislation would also put a moratorium on implementing a Biden-era rule intended to help address long-standing concerns about staffing shortages and the quality of care in nursing homes. The Congressional Budget Office (CBO) estimates that eliminating the rule would save $23.1 billion over 10 years. Even if the legislation does not pass, a recent court decision overturned the first-ever minimum staffing ratios for nursing facilities that were part of the rule. The Trump administration is considered unlikely to appeal the court’s decision. Amid debates to limit federal Medicaid support, this brief provides information on how Medicaid programs support nursing facilities and the people living in them.

1. Medicaid is the primary payer for over 6 in 10 residents in nursing facilities.

As of July 2024, there were 1.2 million people living in nursing facilities, over 60% of whom had Medicaid as a primary payer. The share of people living in nursing facilities with Medicaid as their primary payer has remained steady, but the total number of residents living in nursing facilities decreased by 10% over the last decade. The decline in the total number of nursing home residents over the past decade may in part reflect a preference for home-based care, including care in assisted and independent living facilities, rather than in nursing facilities.

Medicaid is the primary payer for nursing facility care, providing long-term care services not offered by Medicare. Medicare covers up to 100 days of skilled nursing facility care following a qualifying hospital stay and does not cover long-term nursing facility care, custodial nursing facility care, or nursing facility care that does not follow a qualifying hospital stay. Despite Medicaid’s primary role in funding nursing facility services, KFF polling shows that four in ten people identify Medicare as the main source of coverage for low-income people in nursing facilities.

Medicaid is the Primary Payer For Over 6 in 10 Residents in Nursing Facilities

2. Medicaid paid for 44% of the $147 billion that the US spent on institutional long-term care in 2023.

Medicaid is the primary payer for long-term care (LTC) in the US, paying for at least 44% of institutional LTC and 69% of home care. Unlike Figure 1, which reflects the number of people using any nursing facility care, including short-term skilled care paid for by Medicare and other post-acute care payers, Figure 2 reflects spending on long-term institutional care only and excludes short term skilled care paid for by Medicare and other payers. The institutional care services in Figure 2 include costs for long-term nursing facility stays, intermediate care facilities, and continuing care retirement communities. The costs attributable to each type of facility are unknown because the National Health Expenditures data do not break these costs out separately. There are fewer nursing facility residents and nursing facilities than there were a decade ago, and more people use home care now than nursing facility care, leading to the higher U.S. spending on home care.

Medicaid Paid for 44% of the $147 Billion That the US Spent on Institutional Long-Term Care in 2023

3. Medicaid enrollees who use institutional long-term care are more likely to be 65+, White, and enrolled in Medicare when compared to those using home care.

In 2021, there were 1.4 million people who used Medicaid institutional LTC throughout the year. This includes about 1.3 million people who used Medicaid nursing facility care and 0.1 million people who used care in an intermediate care facility. Figure 1 reports fewer people using nursing facility care since it captures the number of people in a nursing facility in a given month while Figure 3 reflects nursing facility use over the course of the year. Most Medicaid enrollees who use institutional LTC are ages 65 and older while most who use home care are under 65. Most Medicaid enrollees using institutional LTC are dually enrolled in Medicare, compared to just over half of those using home care. People who use institutional LTC are also more likely to be White than those using home care.

Medicaid Enrollees Who Use Institutional Long-Term Care Are More Likely to Be 65+, White, and Enrolled in Medicare When Compared to Those Using Home Care

4. Medicaid financing for nursing facilities is complex.

There are four main sources of Medicaid funding for nursing facilities including:

  • Payments from the state to nursing facilities that are tied to specific patient care (known as fee-for-service or FFS base payments),
  • Payments from a private health plan to nursing facilities that are tied to specific patient care in cases where the state is paying private health plans to provide Medicaid benefits (known as managed care payments),
  • Payments from nursing facility residents (which represent patient cost sharing), and
  • Supplemental payments from states to nursing facilities that are not tied to specific patients.

According to the Medicaid and CHIP Payment and Access Commission, fee-for-service payments are the largest source of Medicaid spending (57%) followed by managed care payments (29%). Residents paid 9% of the total, and the remaining 5% came from supplemental payments to providers.

Under current law, states are permitted to finance the non-federal share of Medicaid spending through multiple sources including healthcare-related taxes or “provider taxes”, though legislation that has been passed by the House would prohibit states from establishing any new provider taxes or increasing the rates of existing taxes. CBO estimates that the moratorium would save $89.3 billion over 10 years. Provider taxes are defined as state taxes where at least 85% of the tax burden falls on health care items or services or entities that provide or pay for health care. All but six states finance part of the state share of nursing facility spending with provider taxes on nursing facilities, and the moratorium or new or addition taxes could limit states’ options to fund their share of nursing facility costs in the future, potentially resulting in reduced Medicaid spending, coverage, and payment rates to nursing facilities. States may also finance the state share of payments with intergovernmental transfers or certified public expenditures for the 6% of nursing facilities that are publicly owned (although this varies across the states from less than 1% in the District of Columbia and Connecticut to 43% in Wyoming).

Most States Levy Provider Taxes on Nursing Facilities to Help Finance the State Share of Medicaid Spending

5. Substantial cuts to Medicaid could undermine efforts to increase nursing facility staffing levels.

Research finds that higher staffing levels in nursing facilities have been consistently tied to better outcomes for residents and are closely tied to overall quality of care. States are currently leveraging Medicaid to support nursing facility staffing efforts through higher payment rates, but those payment rates may be unsustainable if Medicaid spending is significantly cut. In a 2024 survey of state Medicaid programs, most states (45 of 49 reporting states) reported increasing nursing facility FFS base rates in both FY 2024 and FY 2025 in response to staffing shortages. Several states reported particularly significant nursing facility base rate increases, including Iowa with a 25.49% base rate increase and Ohio with a 17% increase.

Beyond increasing payment rates, states are making efforts to bolster nursing facility staffing by leveraging Medicaid to strengthen the nursing facility direct care workforce. These strategies include increases to minimum wage that would apply to workers in nursing facilities (eight states), strengthening direct care worker benefits (five states), and requiring nursing facilities to pass reimbursement increases through to the workforce (six states). Other strategies adopted by state Medicaid programs include efforts to promote and subsidize health care careers, increased payments to nursing facilities for maintaining higher levels of staffing, and incentive payments for demonstrating that a certain share of a nursing facility’s total revenue was spent on workforce compensation and benefits.

Substantial Cuts to Medicaid Could Undermine Efforts to Increase Nursing Facility Staffing Levels

This work was supported in part by The John A. Hartford Foundation. KFF maintains full editorial control over all of its policy analysis, polling, and journalism activities.

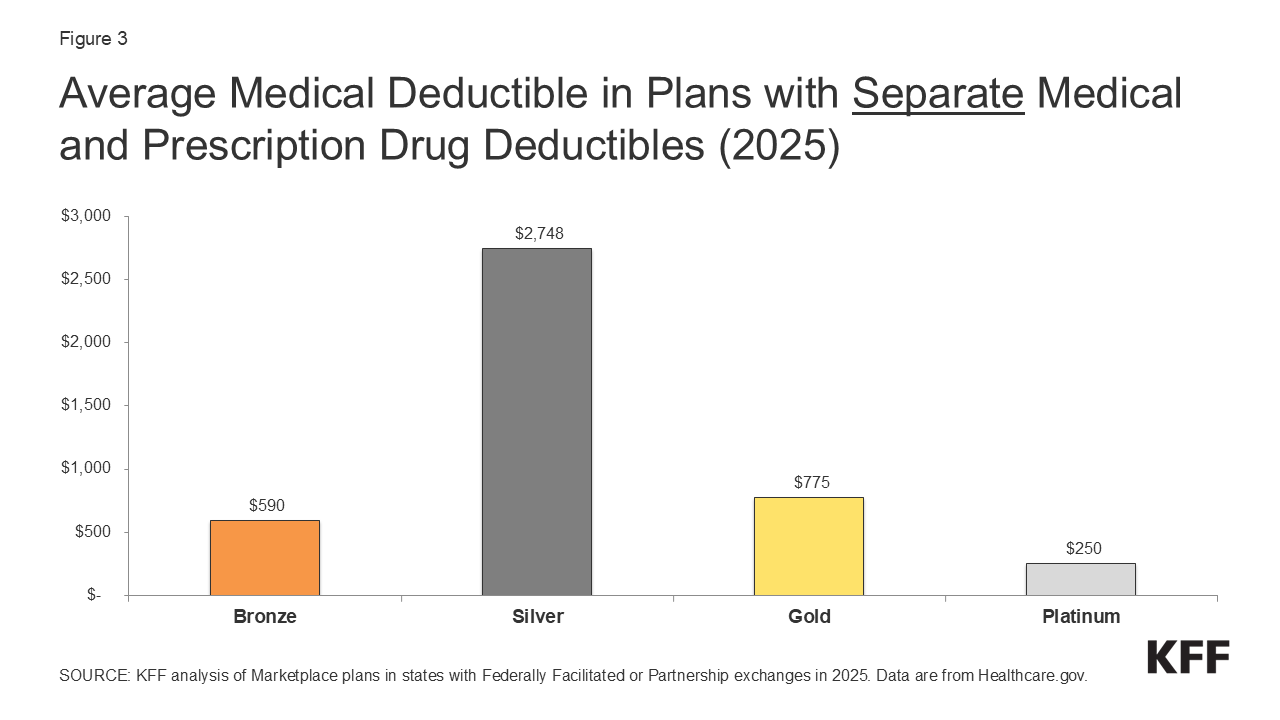
Deductibles in ACA Marketplace Plans, 2014-2025

Published: May 28, 2025

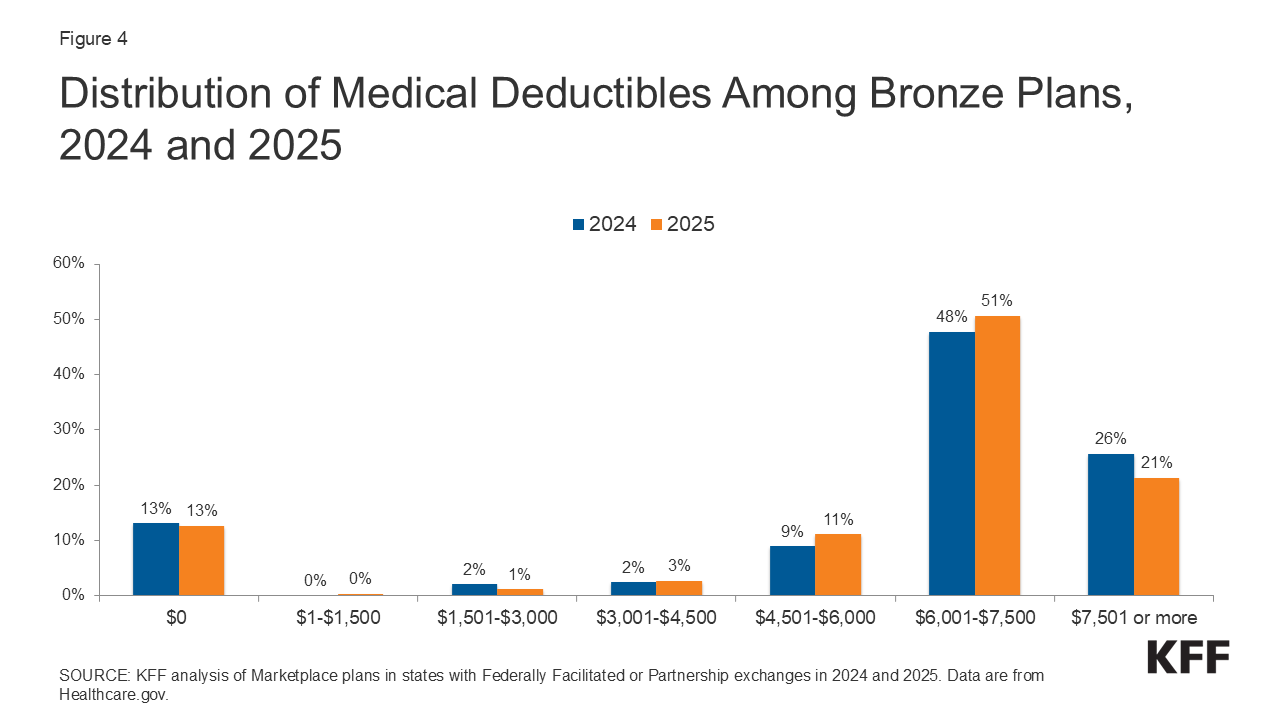
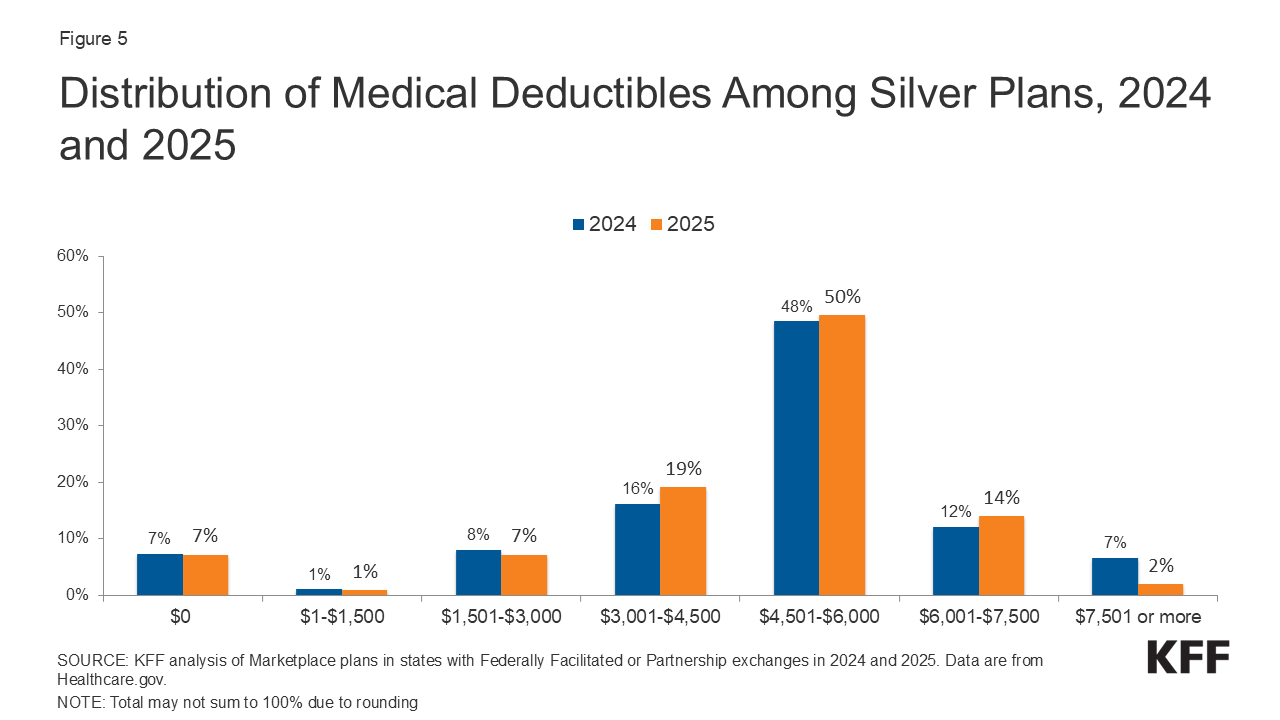
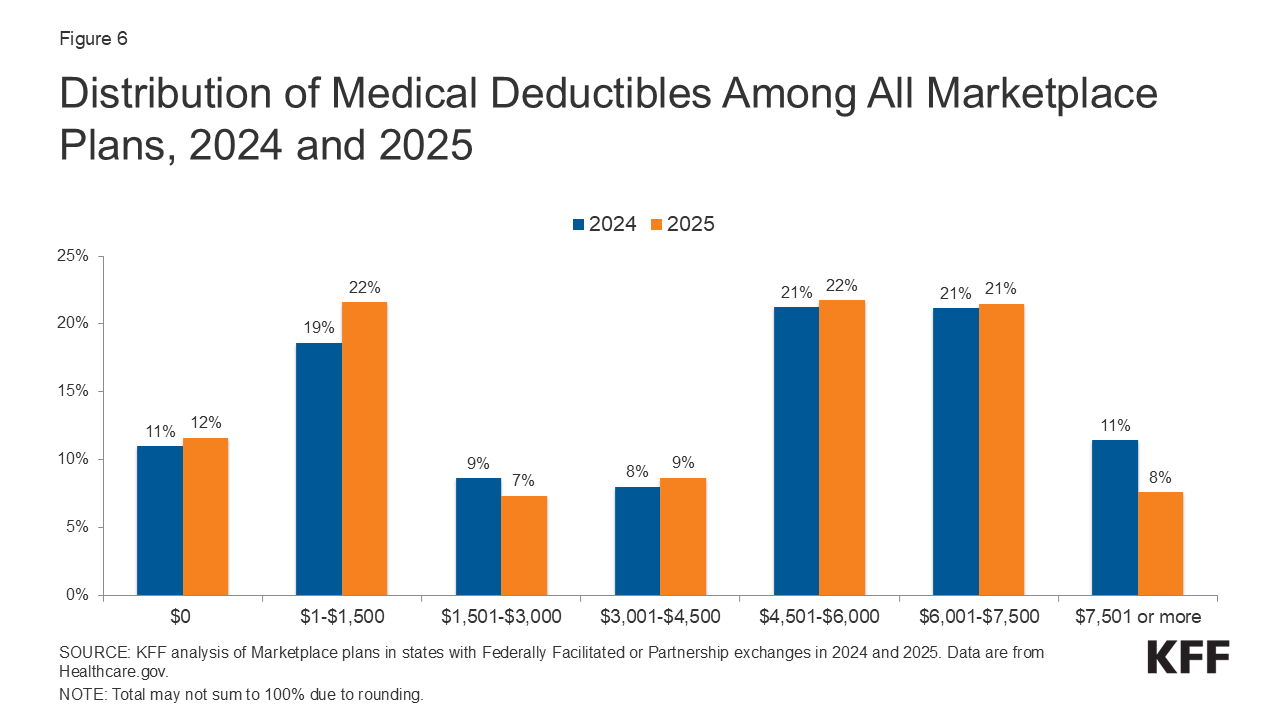
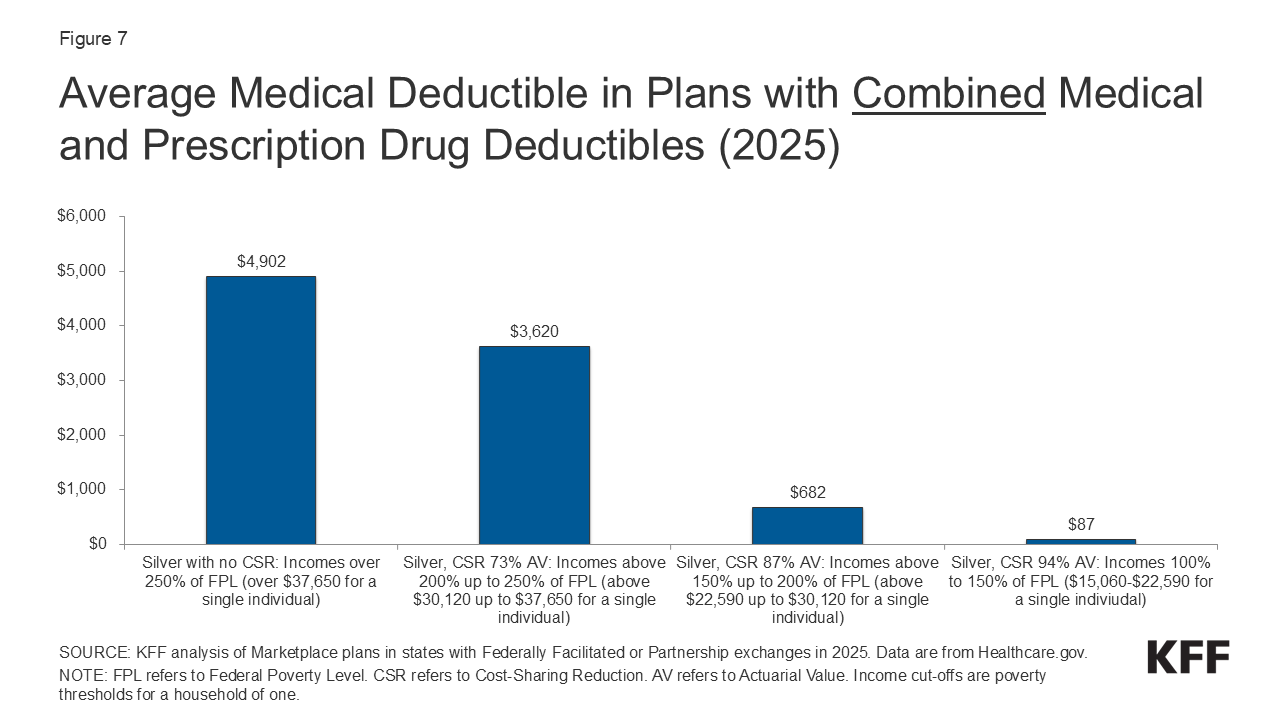
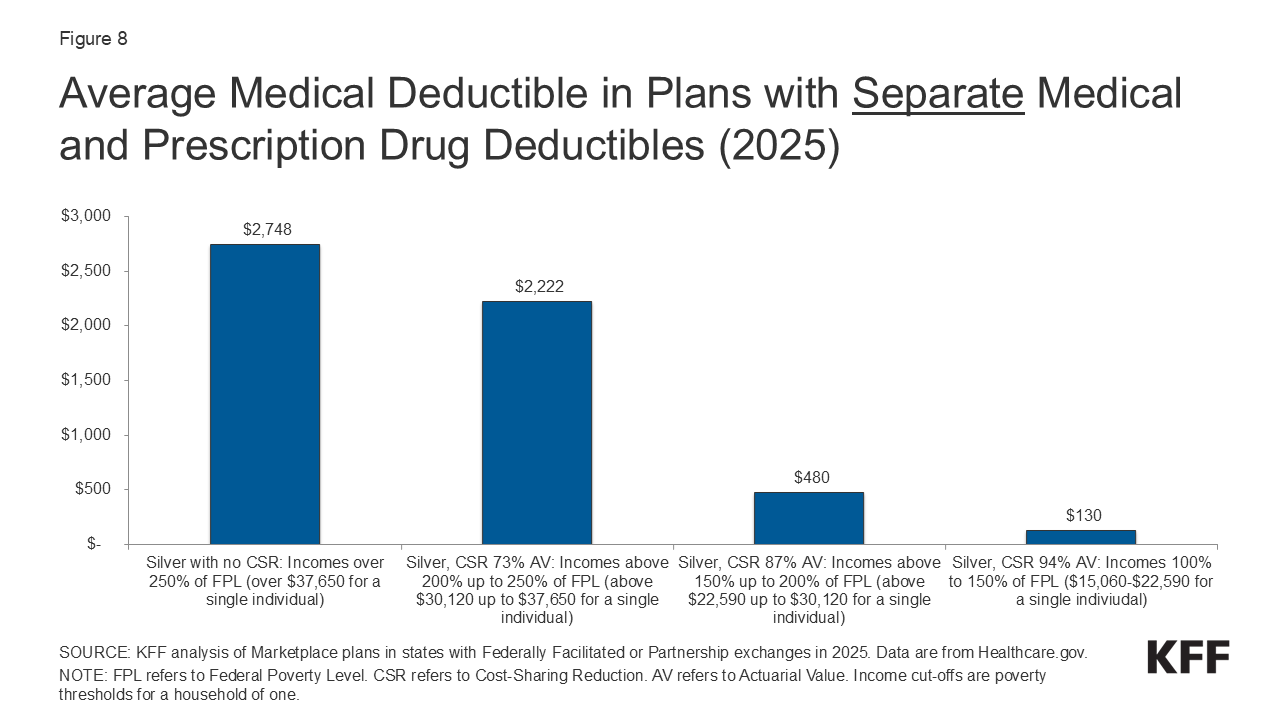
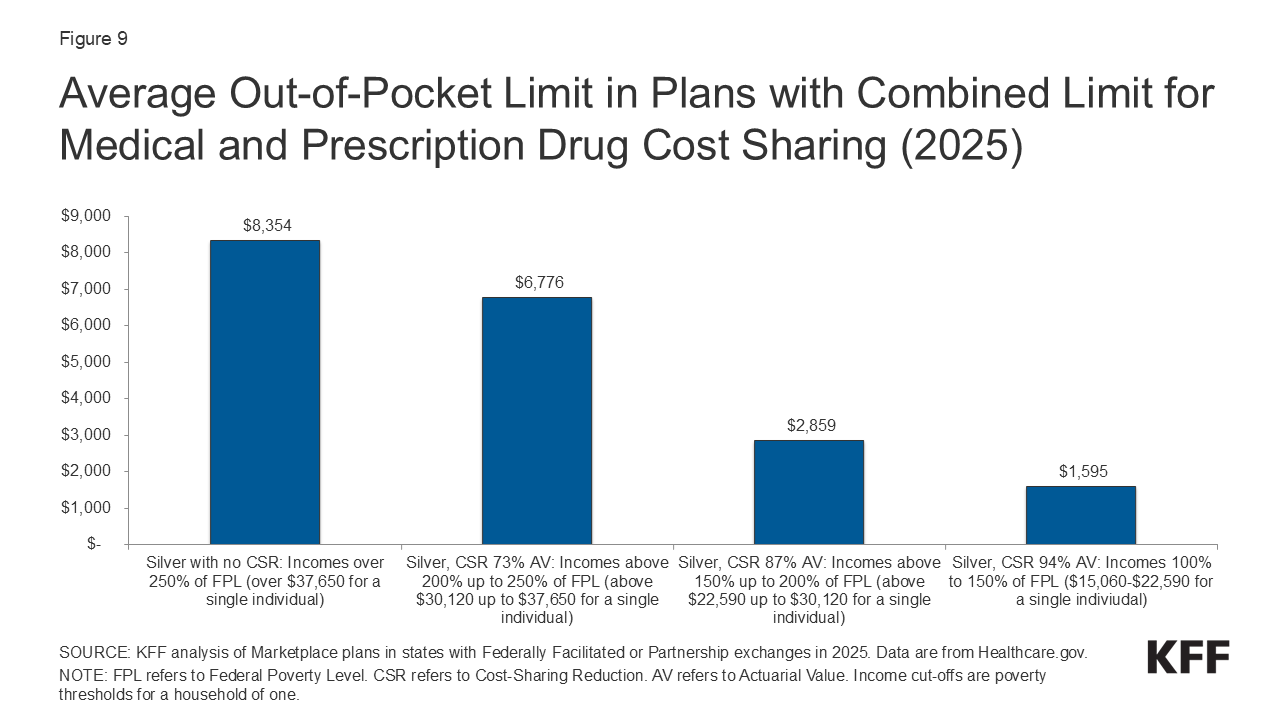
These chart collections provide key data about deductibles and other cost-sharing requirements included in plans sold through the Affordable Care Act (ACA) health insurance marketplaces. Marketplace plans, like most other private health coverage, require enrollees to pay a portion of the cost when they access health services. Cost-sharing can include deductibles, copayments, and coinsurance, though the deductible is a simple and visible measure of how much an enrollee may be expected to pay for major health services. The deductible is the amount an enrollee must pay toward the cost of in-network covered services before the plan will start paying for most types of care. Some plans have a separate deductible amount for medical care and prescription drugs. Under the Affordable Care Act, private plans are required to pay the full cost of certain in-network preventive services (even before the enrollee has met the deductible amount). Marketplace plans are categorized into “metal levels” based on deductible and other cost-sharing amounts.

Average Deductible in ACA Marketplace Plans, 2014-2025

Cost-Sharing for Plans Offered in the Federal Marketplace, 2025 (.ppt)

Download Prior Years’ Analyses

2024

2023

2022

2021

2020

2019

2018

2017

2016

2015

2014

Methods

Information on plan cost-sharing provisions for the plans offered in federally-facilitated and partnership exchanges was downloaded from HealthCare.gov. Simple averages and distributions of the available plans are shown, and neither are weighted by enrollment. Information for “expanded bronze” and “bronze” plans are reported together. Distinct plans from the landscape file were analyzed to calculate the average deductibles. A distinct plan is defined by having a unique state, issuer, metal level, and cost sharing design combination. In 2014 and 2015, a distinct plan took into consideration the plan marketing name.

The weighted average was calculated using plan selection data at the metal and CSR (or FPL) level from Marketplace Open Enrollment Period Public Use Files. 2024 plan selections were used to weigh 2025 average deductibles. 2015 plan selections were used to weigh 2014 average deductibles. 2017 plan selection data was used to estimate the number of plan selections for silver, no CSR and silver CSR variants in 2015 and 2016.

Utilization of Health Care Services by Medicaid Expansion Status

Published: May 28, 2025

Legislation passed by the House of Representatives on May 22nd includes a number of Medicaid provisions that would cut federal Medicaid spending by more than $700 billion over the next ten years and notably increase the number of people without health insurance. Provisions that would only apply to states that have adopted the ACA expansion account for more than half of all of the savings estimated by CBO. Some critics of Medicaid expansion have argued that expansion diverts resources away from other groups of Medicaid enrollees, including people with disabilities and children, and that expansion enrollees are “able-bodied” implying they have minimal health care needs. However, data show that expansion states spend more per enrollee overall and on each eligibility group than non-expansion states and that nearly half of expansion enrollees have a chronic condition. This data note builds on a previous analysis about Medicaid expansion enrollees to understand more about their health care utilization patterns compared to other enrollees. Specifically, this data note analyzes 2021 Medicaid claims data to compare utilization of health care services among Medicaid expansion enrollees with other Medicaid enrollees in expansion states and to compare utilization of health care services among adult Medicaid enrollees living in expansion and non-expansion states.

In expansion states, adults covered through the ACA expansion use more services than other adults who are eligible on the basis of having low-income (Figure 1). While some groups claim that expansion adults are primarily “able-bodied” adults with minimal health needs, analysis of 2021 Medicaid claims data finds that expansion adults were more likely to use prescription drugs (62% vs. 55%) and behavioral health treatment (30% vs 23%) compared to other adults. High utilization of these services by expansion adults likely reflects that one-third have a chronic physical health condition and a quarter have a chronic behavioral health condition. However, their utilization rates were lower than rates among adults who qualified on the basis of having a disability.

In Expansion States, Health Care Utilization Among Medicaid Expansion Adults Is Higher Than Other Adults, but Lower Than Utilization Among Adults Eligible on the Basis of Disability

Medicaid enrollees in expansion states are more likely to use health care services than similar enrollees in non-expansion states (Figure 2). Though some groups suggest that Medicaid expansion takes resources away from traditional Medicaid enrollees, analysis of 2021 Medicaid claims finds that rates of health care utilization among adults in expansion states is higher than utilization among adults in non-expansion states. About 90% of adults eligible for Medicaid on the basis of disability in expansion states used any health care services, compared with just 77% of adults eligible on the basis of disability in non-expansion states. Similarly, excluding adults who qualified through the expansion pathway, 75% of other adults in expansion states (those who qualified for Medicaid on the basis of low-income) used health care services, while just 66% of their counterparts in non-expansion states had any utilization. Notably, expansion adults had similar utilization rates as adults eligible on the basis of disability in non-expansion states.

A state’s expansion status is not the sole reason for the variation in utilization rates. Rather, there are a variety of factors that may contribute to this variation, including substantial differences in state adoption of optional long-term care and behavioral health care programs; provider participation in such programs; and variation in the duration and scope of covered benefits as well as cost sharing requirements.

CMedicaid Enrollees in Expansion States Are More Likely to Use Services Than Similar Enrollees in Non-Expansion States

These differences in utilization persist for specific services for low-income adults and people with disabilities (Figure 3). Adults eligible on the basis of low-income (excluding those eligible through the ACA expansion) in expansion states had notably higher utilization of certain services than those in non-expansion states, including outpatient care (64% vs 58%) and prescription drugs (55% vs 47%).

Similarly, among adults eligible on the basis of disability, utilization of certain services needed to manage their conditions is higher in expansion states than in non-expansion states. In expansion states, 81% of adults with disabilities had any claims for prescription drugs compared to just 63% of those in non-expansion states. These enrollees in expansion states were also over twice as likely to use long-term care (25% vs 12%) and had higher utilization of behavioral health treatment services (62% vs 44%) as those in non-expansion states.

When controlling for health status, enrollees in expansion states still had higher rates of utilization than those in non-expansion states (Figure 3). Enrollees who qualified on the basis of disability and who had three or more diagnosed chronic conditions had the highest utilization rates of prescription drugs, long-term care, and behavioral health treatment in both expansion and non-expansion states, compared to all other adult enrollees. However, within this group of adults with particularly high health care needs, those in expansion states had higher utilization than those in non-expansion states for prescription drugs (98% vs. 93%), long-term care (33% vs. 23%), and behavioral health treatment (84% vs. 78%). (The measure of overall utilization for those with chronic conditions is not reported since enrollees have to have at least one health care claim to have a chronic condition diagnosis.)

Medicaid Enrollees in Expansion States Are More Likely to Use Services Than Similar Enrollees in Non-Expansion States

Methods

Medicaid Claims Data: This analysis uses the 2021 T-MSIS Research Identifiable Demographic-Eligibility and Claims Files (T-MSIS data) to identify Medicaid expansion enrollees, utilization, and chronic conditions.

State Inclusion Criteria:

  • Expansion states: Though Idaho and Virginia expanded Medicaid prior to 2021, adult expansion enrollees primarily show up in the traditional adult eligibility group. Therefore, those expansion states are excluded.
  • Non-expansion states: Mississippi was also excluded from this analysis due to data quality concerns flagged by the DQ Atlas.

Enrollee Inclusion Criteria: Enrollees were included if they were ages 19-64, had full Medicaid coverage for at least one month, and were not dually enrolled in Medicare. Dually enrolled individuals were excluded from these calculations since they may not have had sufficient claims in T-MSIS to identify utilization.

Identifying Utilization: This analysis defines health care utilization in T-MSIS using the following methods:

  • Any utilization: Where CLM_TYPE_CD equals 1, 3, 4, A, C, D, U, W, or X
  • Inpatient hospital: Where TOS_CD equals 001, 060, 061, 090-093, and 132
  • Outpatient care: Where TOS_CD equals 002-008, 012, 028, 042, 134, 135
  • Drugs: Where TOS_CD equals 033, 034, and 131; or where TOS_CD equals 145 and the claim is in the RX file
  • Long-term care: See our brief on long-term care users for methods
  • Behavioral health treatment: SUD and mental health treatment are identified using the Behavioral Health Service Algorithm (BHSA) reference codes provided by The Urban Institute.

Defining Chronic Conditions (Figure 3): This table identifies Medicaid enrollees with three or more chronic conditions. This analysis used the CCW algorithm for identifying chronic conditions (updated in 2020). This analysis also included in its definition of chronic conditions substance use disorder, mental health, obesity, HIV, hepatitis C, and intellectual and developmental disabilities. In total, 35 chronic conditions were included.

The Impact of Gun Violence on Children and Adolescents

Authors: Nirmita Panchal and Sasha Zitter
Published: May 27, 2025

The United States experienced a sharp increase in firearm mortality among youth in recent years, with firearms becoming the leading cause of death for children and adolescents by 2020. Beyond firearm deaths, there are many more youth who survive gunshot wounds or are otherwise exposed to gun violence, which can lead to negative behavioral health outcomes. For example, increased youth suicide risk has been linked to communities exposed to school shootings. School shootings in the U.S. have increased in prevalence over time, as has exposure of school-aged children to these shootings, up from 19 per 100,000 school-aged children from 1999-2004 to 51 per 100,000 from 2020 to 2024.

The new Trump Administration has revoked multiple gun safety initiatives in the interest of preserving Second Amendment rights. These initiatives include dismantling the School Safety Committee, an Executive Order to review and revise firearm regulations by the Bureau of Alcohol, Tobacco, and Firearms that may infringe on Second Amendment rights, and the removal of the former Surgeon General’s advisory that identified gun violence as a public health crisis.

This brief explores the impacts of gun violence on children and adolescents (ages 17 and below) and current policies affecting gun accessibility and safety. Key findings include:

  • Firearm death rates among children and adolescents increased 46% from 2019 to 2021, primarily driven by gun assaults. From 2021 to 2023, the firearm death rate has held steady at 3.5 per 100,000 children and adolescents. The increase in gun deaths during the pandemic is most pronounced among Black and Latino youth, among which gun assaults also account for the majority of firearm deaths.
  • Nonfatal firearm injuries are two to four times more likely to occur than fatal ones, and Black youth are much more likely than their White peers to be injured by or exposed to a gun violence incident.
  • Exposure to gun violence can have severe adverse effects on the mental health and well-being of children and adolescents, including increased likelihood of depression, PTSD, anxiety, and poor academic performance.
  • The new Trump Administration has rolled back multiple Biden-era gun safety policies. Simultaneously, access to mental health and trauma support may be impacted by federal budget cuts and restructuring.

How have firearm deaths changed in recent years among children and adolescents?

Firearm-related deaths have increased among children and adolescents since the pandemic began, with seven children per day dying by firearm in 2023. From 2013 to 2023, nearly 21,000 children ages 17 and younger died by firearm.1  During this period, firearm death rates gradually rose until 2017, then slowed through 2019, before sharply rising with the onset of the pandemic and holding steady in 2023 (Figure 1). From 2019 to 2023, the firearm death rate among children and adolescents increased by 46% (from 2.4 to 3.5 per 100,000). This translates to seven children per day dying by firearm in 2023.

Firearm-Related Deaths Per 100,000 Children and Adolescents, 2013-2023

Recent increases in firearm deaths were driven by gun assaults, which accounted for nearly two out of three firearm deaths among children and adolescents in 2023. Gun assault deaths among children and adolescents have increased over the past decade, resulting in 1,622 deaths in 2023 (Figure 2). Leading up to the pandemic, gun assaults made up about half of all child and adolescent firearm deaths. However, from 2019 to 2023, the share of these firearm deaths attributed to gun assaults grew from 54% to 63%.

Firearm Deaths Among Children and Adolescents, by Type, 2013-2023

Among child and adolescent firearm deaths in 2023, 29% were suicides and 5% were accidental. Suicides by firearm have increased over the past decade among children and adolescents, peaking in 2021 with 827 deaths (Figure 3). Suicides by other means, however, have consistently declined since 2019. In 2023, firearms were involved in 47% of total suicide deaths among children and adolescents.

Number of Deaths Due to Suicide, by Firearm or Other Means, Among Children and Adolescents 2013 to 2023

How do youth firearm deaths vary by demographic characteristics?

Firearm death rates have sharply increased among Black and Hispanic children and adolescents since the pandemic began. In 2023, the rate of firearm deaths among Black youth was 11.7 per 100,000 – substantially higher than any other racial and ethnic group and over four times higher than White youth (Figure 4). Additionally, from 2018 to 2023, the rate of firearm deaths nearly doubled among Black youth and increased by 73% among Hispanic youth. While firearm death rates for American Indian and Alaska Native (AIAN) youth fluctuated over the same period, they remained higher than the rates of their White, Hispanic, and Asian peers throughout the period. White youth experienced relatively stable and lower firearm mortality rates from 2018 to 2023, while Asian youth had the lowest firearm mortality rates across the period (Figure 4).

Total Firearm Death Rates for Children and Adolescents by Race/Ethnicity, 2018-2023

The recent increases in firearm deaths among Black and Hispanic children and adolescents were primarily driven by gun assaults. Since the onset of the pandemic, the gap in gun assault death rates between Black and White children and adolescents has significantly widened. The gun assault death rate among Black youth grew from 4.9 to 10.3 per 100,000 between 2018 and 2022, dropping slightly to 9.7 in 2023. Among White youth, it remained steady and below 1.0 per 100,000 (Figure 4). The gun assault death rate among Hispanic youth doubled 0.9 to 2.0 per 100,000 between 2018 and 2022 before dropping slightly to 1.8 per 100,000 in 2023.

In 2023, Black youth accounted for 46% of all youth firearm deaths although they made up only 14% of the U.S. youth population (Figure 5). From 2018 to 2023, the share of firearm deaths attributed to Black children and adolescents grew from 35% to 46%; and the share attributed to Hispanic children and adolescents grew from 16% to 19%.

Child and Adolescent Firearm Death Distribution vs. Population Distribution, by Race and Ethnicity

Firearm death rates for male children and adolescents are over four times higher than their female peers. From 2018 to 2023, the rate of deaths due to firearms increased by 53% among male children and adolescents but remained lower and stable among females (Figure 6).

Firearm Death Rates for Children and Adolescents by Sex, 2018-2023

Among firearm deaths, suicides by firearm are more common among adolescents compared to younger children, while accidental gun deaths are more common among younger children than adolescents (Figure 7). Gun assaults accounted for roughly two-thirds of firearm deaths among both adolescents and younger children in 2023. The second most common type of firearm death among adolescents was firearm suicides (32%), and among younger children was accidental gun deaths (21%).

Distribution of Firearm Death Types Among Children and Adolescents, 2023

Firearm death rates among children and adolescents vary considerably by state; however, almost all states have seen growth in these death rates in pandemic years. From 2020 to 2023 the states with the highest firearm death rates among children and adolescents were the District of Columbia, Mississippi, and Louisiana (10.3, 9.0, and 8.8 per 100,000 respectively for combined years, 2020-2023. The District of Columbia was also among the states with the highest school shooting exposure rates among school-aged children and adolescents in the 2020-2024 period (356 per 100,000, respectively). The states with the lowest firearm death rates were Massachusetts, New Jersey, and New York (0.7, 0.9, and 1.1 per 100,000 respectively for combined years, 2020-2023). Almost all states experienced an increase in firearm death rates from pre-pandemic to pandemic years, with the largest changes seen in Nebraska, Connecticut, and North Carolina (125%, 100%, and 100% respectively) (Figure 8).

State-by-State Shifts in Firearm Death Rates Among Children and Adolescents During the Pandemic

What do we know about nonfatal firearm injury exposure among children and adolescents?

The number of nonfatal firearm injuries far exceeds the number of firearm fatalities among children and adolescents. However, estimates vary, with research suggesting nonfatal firearm injuries occur anywhere from two to four times more often than firearm fatalities. Recent data also indicate that since the pandemic began, nonfatal firearm injuries among children and adolescents have increased. The majority of youth nonfatal firearm injuries are a result of assaults.

Many children and adolescents are exposed to gun violence, even if they are not directly injured. Data on exposure to gun violence among youth is generally limited. However, a recent KFF analysis found that 51 per 100,000 U.S. school-age children were exposed to a school shooting from 2020-2024. Additionally, a CDC analysis found that in 34% of unintentional child and adolescent firearm deaths, at least one other child was present during the incident. Prior data from the National Survey of Children’s Exposure to Violence found that 8% of children and adolescents were exposed to a shooting in their lifetime, with a higher share (13%) reported among adolescents (ages 14-17). Further, in a recent KFF poll, 17% of adults in the U.S. reported witnessing someone being injured by a gun.

Black children and adolescents are more likely to experience firearm injuries and exposures than their White peers.Leading up to the pandemic, Black and male children and adolescents were more likely to experience nonfatal firearm injuries than their peers. This disparity among Black youth firearm injuries and exposures has been exacerbated since the pandemic began. In general, children of color are more often exposed to gun violence than their White peers. Children living in areas with a high concentration of poverty are more likely to experience firearm-related deaths, and poverty disproportionately affects children of color.

How does gun violence affect the mental health and well-being of children and adolescents?

Gun violence can adversely affect the mental health and well-being of children and adolescents. Exposure to gun violence is linked to post-traumatic stress disorder and anxiety, in addition to other mental health concerns among youth. Gun violence may also lead to challenges with school performance, including increased absenteeism and difficulty concentrating. In response to indirect gun violence, such as witnessing a shooting or hearing gunshots, many children and adolescents report feeling sad, anxious, or fearful. Children and adolescents are exposed to gun violence in multiple ways, outlined below.

  • Neighborhood and community violence. Many children and adolescents experience violence within their communities. Firearm homicides occurring within an adolescent’s community have been linked to anxiety and depression among adolescents, particularly for females. Other analyses have similarly found an association between incidents of neighborhood firearm homicides and poor mental health outcomes among youth.
  • Suicide. Suicides are the second leading cause of death among adolescents and many suicides involve a firearm. Research has found that access to firearms, particularly in the home, is a risk factor for suicide deaths among children and adolescents. Nearly half of suicide attempts occur within 10 minutes of the current suicide thought, further underscoring access to firearms as a risk factor for suicide.
  • Domestic or intimate partner violence. Women and children are often the victims of intimate partner violence, which may involve firearms. The presence of a firearm in the home is linked to the escalation of intimate partner violence to homicides. Even when firearms are not used, they may serve as a means of threatening and intimidating victims of domestic violence.
  • Mass shootings.Although mass shootings, including school shootings, account for a small portion of firearm-related deaths, they can negatively impact the mental health of children and communities at large. Research has found that youth antidepressant use and suicide risk increased in communities with exposures to school shootings. Additionally, a survey prior to the pandemic found that the majority of teenagers and their parents felt at least somewhat worried that a school shooting may occur at their school. School shootings are on the rise, with the U.S. average yearly rate of student exposure to a school shooting increasing threefold over time (from 19 per 100,000 students in 1999-2004 to 51 in 2020-2024). In response to school shootings, nearly all schools practice active shooter drills, which may have a negative psychological impact on participants. Although research is limited on how mass shootings affect individuals not directly exposed to them, current literature suggests that information and knowledge of mass shootings may be linked to increased levels of fear and anxiety.

Youth survivors of firearm injuries are at increased risk of mental health and substance use issues, in addition to chronic physical health conditions. An analysis of commercially insured children and adolescents found that, in the year following a firearm injury, survivors were significantly more likely to experience psychiatric and substance use disorders compared to their peers. Additionally, the increases in psychiatric disorders were more pronounced among youth with more severe firearm injuries compared to youth with less severe firearm injuries. Youth gunshot survivors are more likely to utilize mental health services following their injury compared to their uninjured peers. However, a study of youth survivors enrolled in Medicaid found that more than three out of five survivors had not received mental health services within the first six months following their injury.

Negative mental health impacts can extend to the family members of youth gun violence victims.Parents, particularly mothers, of youth firearm-injury survivors had an increase in psychiatric disorders and mental health visits in the year following the firearm incident, based on an analysis of commercially insured individuals. These increases in psychiatric disorders and mental health visits were more pronounced among families of youth firearm fatalities.

Gun violence disproportionately impacts Black children and adolescents, leaving them more vulnerable to negative mental health outcomes. In addition to increased assaults, firearm suicides, and exposure to community violence, Black communities are disproportionately exposed to police shootingsResearch found that Black people living near the scene of a police killing of an unarmed Black individual experienced worsened mental health in the months that followed. Separately, despite mental health concerns among Black youth injured by gun violence, research on mental health service utilization in the months following a firearm injury is mixed, with one study finding higher utilization among Black youth compared to their White peers, and another study finding the reverse. Historically, Black individuals are less likely to receive mental health treatment and face additional barriers to care, such as the lack of culturally competent care.

What policies address child and adolescent exposure to gun violence and poor mental health?

Gun control debates are deeply divided politically in the U.S.; but beyond gun control, other approaches seek to reduce the impact of firearms on health, for example, through safe storage practices.Safe storage and child access prevention provisions have been linked to a reduction in adolescent firearm homicides and non-fatal gun injuries. These provisions vary widely across states; some states have multiple provisions, while others have none. Some states have also enacted unique approaches to promote gun safety. For example, beginning with the 2023-2024 school year, local education agencies in California are required to notify parents annually on the safe storage of firearms; and some states provide tax rebates on safe storage devices. The Biden-Harris administration put forth additional steps to promote safe storage of firearms, including guidance from the U.S. Department of Justice, which was taken offline during the current Trump Administration. A KFF poll found that 44% of parents with children under the age of 18 have a gun in their household. Among parents with guns in their home, about one-third said a gun is stored loaded (32%) or stored in an unlocked location (32%) (Figure 9). More than half of parents (61%) said any gun in their home is stored in the same location as ammunition. The KFF poll also found that only 8% of parents said their child’s pediatrician talked to them about gun safety.

Gun Storage Practices Among Parents with Guns in Their Household

The Trump Administration is rolling back some Biden-era policies aimed at addressing gun reform and expanding youth mental health services for children and adolescents. During the Biden Administration, the Bipartisan Safer Communities Act (BSCA) was passed in response to increasing gun violence. The BSCA outlined provisions on gun reform and improving access to youth mental health services, including through schools. However, in May 2025, the Trump administration canceled $1 billion in BSCA grant funding for school-based mental health services. Gun safety groups fear that President Trump will attempt to further weaken or eliminate the BSCA. Additionally, other measures that may address youth mental health and gun violence trauma, including the rollout of 988, may also be in jeopardy. Under the Trump Administration, the Department of Government Efficiency (DOGE) laid off about a quarter of the 988 Hotline’s digital communications team. New federal funding freezes have also been put in place on prevention work by federal authorities to stop terrorism and mass shootings.

Gun violence disproportionately affects many children and adolescents of color, particularly Black children and adolescents, and this disparity has grown since the pandemicChildren and adolescents of color may also face added barriers to mental health care in light of long-standing cultural inequities and a lack of culturally informed care. In years prior, mental health initiatives aimed at Black and Latino people were introduced in Congress and SAMHSA announced funding opportunities to create a Behavioral Health Center of Excellence aimed at improving behavioral health equity for Hispanic and Latino communities. SAMHSA’s funding, however, has been cut by the Trump Administration by approximately $11.4 Billion, preventing the entity from using money that was previously earmarked for mental health and substance use disorder resources.

Gun violence can lead to increased mental health and substance use concerns. The recent increase in child and adolescent firearm injuries and deaths come at a time when concerns about youth mental health have grown but access to and utilization of mental health care may have worsened.

  1. KFF analysis of youth firearm mortality is based on data from Center for Disease Control and Prevention (CDC) Wonder injury and mortality database. In this analysis, firearm-related deaths are defined as gun assault deaths, suicide deaths by firearm, deaths due to accidental firearm discharge, legal intervention leading to firearm death, and firearm deaths from an undetermined cause. ↩︎

Proposed Medicaid Federal Match Penalty for States that Have Expanded Coverage for Immigrants: State-by-State Estimates

Published: May 22, 2025

Editorial Note: This piece was originally published on May 21, 2025 and was updated on May 22, 2025 to reflect revisions made in the version of the bill passed by the House.

Introduction

The House reconciliation bill will substantially reduce federal Medicaid spending and coverage and increase the number of uninsured according to estimates from the Congressional Budget Office (CBO). The bill includes a provision that would penalize states that expand coverage for immigrants by reducing the federal Medicaid matching rate for the Affordable Care Act (ACA) Medicaid expansion population from 90% to 80% for states that either provide health coverage or financial assistance to purchase health coverage to certain groups of immigrants. However, the groups of immigrants receiving coverage that would subject states to the penalty was revised several times before the bill was passed by the House:

  • The initial version of the bill passed by the House Energy and Commerce committee would reduce federal Medicaid funding for states that provide coverage to immigrants who were not a qualified alien or otherwise lawfully residing in the United States—affecting 14 states and DC that have expanded coverage to undocumented immigrants with their own funds.
  • A revision made to the bill before it was considered by the House Rules Committee removed “otherwise lawfully residing” immigrants from coverage that could be provided without the penalty, effectively broadening the penalty to an additional 19 states that have taken up a federal option available in Medicaid and the Children’s Health Insurance Program (CHIP) to expand coverage for lawfully residing children and pregnant people.
  • Per amendments made to the final version of the bill passed by the House, the penalty was limited to states providing coverage to immigrants who are not a “qualified alien” or a “child or pregnant woman who is lawfully residing in the United States” covered under the Medicaid option for these groups. This change appears to largely apply the penalty to the 14 states and DC that cover undocumented immigrants with state funds. However, because the exception is more limited than the prior language, which excluded states covering “otherwise lawfully residing” immigrants from the penalty, additional states that cover lawfully residing groups through other pathways could be affected.

KFF data show that 14 states plus DC cover children regardless of immigration status, including 7 states plus DC who cover at least some adults regardless of status, that would be affected by the current version of the provision. In Utah and Illinois, the provision could result in federal funding and coverage losses for the entire ACA Medicaid expansion population, since the states have “trigger” laws that require them to terminate the expansion if federal funding decreases. As noted, additional states that have expanded coverage for lawfully residing immigrants could be affected by the penalty.

This analysis examines the potential impacts of this policy change on state Medicaid spending, including state-by-state estimates of potential losses in federal financing (and increases in state spending) if the 14 states and DC that cover immigrants regardless of immigration status maintain their programs. It also presents enrollment data for these programs to estimate the number of people who may be at risk for coverage losses if states eliminate these programs based on KFF analysis of publicly available state enrollment data, budget documents, and media reports. Losses in federal financing and coverage may be larger if additional states are affected by the provision.

If states maintained their coverage programs, they would need to find ways to offset the loss of federal funding. This could include increasing state tax revenues, decreasing spending on non-Medicaid services such as education, or making other Medicaid cuts. If states eliminated their programs, there would likely be increased uninsured rates and barriers to care for immigrant families and negative impacts for the U.S. economy and workforce due to the role immigrants play.

Potential Impacts on State Spending if States Maintain Coverage and are Subject to the FMAP Penalty

The analysis assumes that, starting in fiscal year (FY) 2027, expenditures for people eligible in the ACA Medicaid expansion would be matched at 80% instead of 90% in the 14 states and DC that offer coverage for people regardless of immigration status. This analysis does not make assumptions about specific state behavior and instead illustrates the potential impact on state Medicaid spending if all states maintained their existing coverage programs in response to this policy change. CBO projected that the provision to penalize states the 14 states and DC that offer state funded coverage to undocumented immigrants would result in federal savings of $11 billion between 2025 and 2034 and a coverage loss of 1.4 million people. This estimate accounts for assumptions about state behavioral responses and other secondary effects.

A reduction in the expansion match rate or “FMAP” for the 14 states and DC with state-funded coverage for people regardless of immigration status could shift $92 billion in costs from the federal government to the states over the next ten years if the states maintained their programs (Figure 1). State Medicaid spending increases across the states range from $30 billion in California to $300 million in Vermont or from 8% in Oregon and Washington to 3% in Massachusetts, Vermont, New York, and Minnesota. The cost shift would be larger if additional states that cover lawfully residing immigrants are affected by the penalty.

Reducing the ACA Medicaid Expansion FMAP in States that Cover Undocumented Immigrants with their Own Funds Could Shift $92 Billion in Costs to the States Over the Next Ten Years

In addition, there would be large Medicaid spending and enrollment declines in Utah and Illinois if their ACA expansion coverage was eliminated per their current state “trigger” laws. Utah and Illinois have laws in place that automatically end expansion if the federal match rate were to drop, meaning the provision could result in funding and coverage losses for the entire ACA Medicaid expansion population in these states. Prior KFF analysis found that if states drop their ACA Medicaid expansion coverage altogether, 78,000 (or 23%) of Medicaid enrollees could lose coverage in Utah and 840,000 (or 28%) of Medicaid enrollees could lose coverage in Illinois by FY 2034. This would result in a decrease of about $11 billion in federal Medicaid spending in Utah and $96 billion in Illinois over a ten-year period. It’s likely many of these expansion enrollees would become uninsured and gains in financial security, access to care, and health outcomes associated with Medicaid expansion would be reversed.

If states maintained their current coverage, they would need to find ways to offset the loss of federal funding. This could include increasing state tax revenues, decreasing spending on non-Medicaid services such as education, which is the largest source of expenditures from state funds, or making other Medicaid cuts. Given the size of the federal Medicaid funding cuts in the reconciliation bill, states would likely face substantial challenges in efforts to replace the loss of federal funds and significant pressure to drop their current coverage programs.

Potential Impacts on Coverage if States Eliminate Coverage to Avoid the FMAP Penalty

More than 1.9 million people could lose health coverage if states eliminate their state-funded coverage for immigrants regardless of immigration status to avoid the penalty. About 1.9 million people are enrolled in state-funded coverage programs for immigrants based on enrollment data from 7 of the 14 states providing coverage to children and DC and 6 of the 7 states and DC providing coverage to at least some adults (Table 1). This includes roughly 1.6 million adults and about 300,000 children, although data are not available from six states that cover children (Illinois, Maine, Massachusetts, New York, Rhode Island, and Washington) and Minnesota does not report separate data for adults and children. As such, these data undercount the number of people enrolled in these programs and at risk for coverage losses. Moreover, the dates of the enrollment data vary across states. If additional states that cover lawfully residing immigrants eliminate coverage to avoid the penalty, coverage losses would also be larger. As noted, CBO estimates that 1.4 million people would become uninsured by 2034 due to original version of the penalty which applied to states covering undocumented immigrants; this estimate represents a different time period than these enrollment data and makes assumptions about state behaviors in response to the provision.

States could avoid the FMAP penalty by eliminating their programs, but there would likely be increases in the uninsured rate and barriers to accessing care among immigrant families. Although most immigrants are working, they are often employed in jobs that do not offer employer-sponsored health coverage and undocumented immigrants are prohibited from enrolling in federally funded coverage options. As such, without these programs most will not have access to an affordable coverage option and become uninsured. People who are uninsured often delay or go without needed care, which can contribute to health conditions becoming worse and more costly. Reduced coverage and access to care may also negatively impact the U.S. economy and workforce due to lost productivity since immigrants play an outsized role in many occupations including health care, construction, and agriculture.

Nearly Two Million People Are Enrolled in State-Funded Coverage Programs for Immigrants Based on Partial Enrollment Data from 10 of 14 States and DC

Methods

State spending estimates under the proposed policy change follow the methods outlined in a prior KFF analysis, with a few exceptions:

  • The FMAP is reduced from 90% to 80% in the 14 states and DC with state-funded coverage regardless of immigration status (for Figure 1 estimates).
  • The policy change is implemented in FY 2027.

To determine the cost shift to states, the analysis calculates the difference in state Medicaid spending under the proposed policy change and KFF’s baseline projections of state Medicaid spending over the next ten years.

VOLUME 23

New Vaccine Requirements, Anti-mRNA Narratives, and Disputed Gender-Affirming Care Report


Summary

This volume highlights how new vaccine requirements and the spread of anti-mRNA sentiments are fueling confusion and distrust. It also examines reactions to a federal report on gender-affirming care for minors and investigates how TikTok is being used to promote false health claims through deepfake personas targeting young women.


Recent Developments

HHS’ New Placebo Requirements for Vaccine Approval Prompt Confusion About Existing Procedures

jiang suying / Getty Images

The Department of Health and Human Services (HHS) announced that it will require all new vaccines to undergo placebo-controlled trials before approval, framing this as a shift from existing practices. A placebo-controlled trial is a study that compares participants who receive an experimental vaccine to a control group that receives a placebo—an inert substance—to help isolate the effects of the vaccine from other factors. While many vaccines, including COVID-19 vaccines, were tested this way, the American Medical Association (AMA) and the World Health Organization (WHO) do not consider placebos ethical when withholding a known effective vaccine could expose participants to unnecessary risk. In such cases, researchers use other rigorous methods, such as comparing a new vaccine to an approved one to evaluate differences in safety, immune response, and effectiveness. The HHS announcement has led to questions about the safety of existing vaccines among those unfamiliar with how clinical trials are designed and why placebo use is not always appropriate.

Online discussion about placebo-controlled trials spiked on May 1 and May 4, following news reports of HHS’ new policy. Some posts with large engagement argued that placebo-controlled trials should not be used when a vaccine is known to be protective, aligning with the AMA and WHO. Others misleadingly presented the policy change as evidence that past vaccine trials lacked proper oversight or were “corrupt.” A widely shared post from a medical doctor and lawyer with over 900,000 followers called the update long overdue and said it would finally hold vaccine makers to higher safety standards. Others expressed genuine confusion about study designs by expressing a lack of knowledge about how often placebo groups are used in clinical trials.

Polling Insights:

As regulatory guidelines surrounding vaccines change, KFF’s latest Tracking Poll on Health Information and Trust finds that fewer than half the public say they currently have at least “some” confidence in federal government health agencies to ensure the safety and effectiveness of vaccines approved for use in the U.S. While half or fewer across partisans express confidence, Democrats are somewhat more likely than independents and Republicans to say they have “a lot” or “some” confidence in federal health agencies to ensure vaccines are safe and effective.

Just Under Half of the Public Express Confidence in Federal Health Agencies To Ensure Vaccine Safety and Effectiveness, Including Half or Fewer Across Partisans

Changing COVID-19 Booster Testing Standards Add to Uncertainty Around Safety

Thanasis / Getty Images

Social media conversations have also reflected concern and skepticism about COVID-19 boosters after HHS officials stated that these boosters may be held to stricter evidence requirements that could treat them as entirely new products. This framing has led to confusion about what qualifies as a “new vaccine,” particularly in contrast to updated COVID-19 boosters. While a new vaccine may target either a novel or existing pathogen using new technology or formulations, COVID-19 boosters are updates to previously approved vaccines designed to target evolving strains of the same virus. Unlike brand-new vaccines, which undergo extensive clinical trials, updated COVID-19 boosters were previously approved using existing safety data from the original vaccine, along with lab and animal studies showing that the updated shot produces a strong immune response to new variants. Experts warn that the shift could delay access to boosters as new strains of viruses spread, while weakening trust in long-standing safety procedures.

Confusion about boosters began to grow after the FDA questioned data around boosters and delayed full approval of Novavax’s updated COVID-19 vaccine, calling it a new product and requesting additional trial data. Novavax, a protein-based alternative to mRNA vaccines, has been authorized for emergency use since 2022 after a large placebo-controlled trial showed high efficacy and few serious adverse effects. The updated version targets newer variants and functions as a booster for individuals who have previously been vaccinated. Prior to the FDA’s decision to apply new product standards for all COVID-19 boosters for people under 65, some high-profile social media accounts reacted to the Novavax delay with concern about boosters. One X account with approximately 3.7 million followers called for the COVID-19 vaccines to be banned, calling them “worthless” and “dangerous.” Another post, from a physician with one million followers, falsely claimed that new variants are invented to justify continued booster campaigns.

mRNA Vaccine Concerns Gain Political Traction Despite Scientific Consensus

Luis Alvarez / Getty Images

Misleading information about mRNA vaccines continues to circulate online, contributing to support for policy proposals that aim to ban the technology. Extensive research and real-world data show that mRNA vaccines have a strong safety profile and offer protection against severe illness, hospitalization, and death from infectious diseases, like COVID-19, and potentially cancer. But a group of legislators in Minnesota recently introduced a bill that would classify mRNA vaccines as “weapons of mass destruction,” with criminal penalties of up to 20 years in prison. Although unlikely to pass, the bill represents the growing reach of concern about mRNA technology. Similar measures have emerged in other states: Iowa, Montana and Idaho have considered proposals that would impose criminal penalties on providers. 

Social media conversations continue to reflect unsubstantiated concern about mRNA vaccines, sometimes showing support for legislation aiming to ban them. One Texas doctor with over 500,000 followers, previously suspended for sharing false information about vaccines, said that Minnesota legislators were “lead[ing] the way” with the proposal. Another widely shared post featured a video of a doctor with a revoked medical license recommending that viewers and their families “not get vaccinated, ever again, with an mRNA vaccine.” These conflict with the broad scientific consensus supporting mRNA vaccines and contribute to doubt about COVID-19 vaccines. According to the FDA, serious adverse effects from the COVID-19 vaccines—which are predominantly mRNA-based in the United States—occur in fewer than 1 in 200,000 vaccinated individuals, and research has shown that COVID-19 vaccines have saved tens of millions of lives globally.

Polling Insights:

New KFF polling shows that mRNA technology is obscure to much of the public. About twice as many adults think vaccines that use mRNA technology are “generally safe” (32%) as say they are “generally unsafe” (16%), but about half (52%) report not knowing enough about this technology to say. In addition, nearly half of the public (45%) report having heard the false claim that mRNA vaccines can alter a person’s DNA — a myth related to COVID-19 vaccines that began circulating early in the pandemic. While just 3% think this false claim is “definitely true” and one quarter say it is “definitely false” (24%), most fall in the malleable middle, saying it is either “probably true” (26%) or “probably false” (45%). However, there are important differences by party identification and ethnicity when it comes to believing or leaning toward believing the myth that mRNA vaccines alter DNA, with at least one-third of Republicans (37%), independents (33%), and Hispanic adults (38%) saying the claim is either “definitely true” or “probably true.”

Large Majorities of the Public and Partisans Are Uncertain if the Myth That mRNA Vaccines Can Change Your DNA Is True

Reactions to HHS Report Amplifies Misleading Narratives About Health Care for Transgender Youth

Besiki Kavtaradze / Getty Images

Misleading narratives about gender-affirming care for transgender and nonbinary people are circulating following the May 1 release of a new HHS report about gender dysphoria. The 400-page report, commissioned by an executive order aimed at limiting youth access to gender-affirming care, states that it surveys existing literature on gender-affirming interventions for children and adolescents, concluding that “the evidence for benefit of pediatric medical transition is uncertain, while the evidence for harm is less uncertain.” Major medical groups, including the American Academy of Pediatrics and the American Psychological Association, criticized the report and continue to support access to transition-related care based on other reviews and studies that have found a positive impact of gender-affirming care on health. On the day the report was released, mentions of gender-affirming care spiked on social media. Some high-profile accounts, including a podcast host with almost five million followers, circulated quotes from the report’s foreword that highlighted potential risks associated with gender-affirming care while emphasizing uncertainty about the benefits.

The report spurred other incorrect claims, including the false notion that surgical interventions are common among minors, but such procedures are exceedingly rare. One study that looked at data from more than 22 million minors found that less than .01% of transgender and gender diverse minors ages 13 to 17 underwent gender-affirming surgery, and none under 12 received such care. The HHS report’s framing of “exploratory therapy,” a practice that can include gender identity conversion efforts, drew attention online, but a recent KFF brief explains that major health associations have condemned this therapy as harmful and unsupported by evidence. Social media posts also amplified claims that many youth regret care, but research shows regret is uncommon. While not all transgender people seek medical care, a 2021 meta-analysis found that among those who do, the prevalence of regret is 1%. The report further claimed that many transgender or nonbinary people seek to “detransition” (return to their sex assigned at birth). But studies show that most transgender and nonbinary people do not return to their sex assigned at birth, and the KFF/Washington Post Trans Survey found that about eight in ten trans adults (78%) report being more satisfied with their lives after transitioning.


AI & Emerging Technology

Deepfake Health Scams Target Young Women on TikTok

About Four in Ten TikTok Users Say They Trust Health Information They See on the App, Including Larger Shares of Younger Users

A March investigation by Media Matters, also reported by Rolling Stone, uncovered a network of TikTok accounts using deepfake personas to push health and wellness products, often targeting women with fertility or cosmetic concerns. The accounts created backstories and personal testimonies to enhance credibility and drive sales through TikTok Shop links. One account, for example, featured videos of an influencer claiming various identities, such as a doctor and former model, to endorse hair growth supplements. A reverse image search, though, showed that the woman was likely generated by deepfake technology. Following publication of the investigation, the accounts identified in the article were removed from TikTok. This tactic reflects a broader trend identified in a 2024 study published in Journal of Medical Internet Research, which concluded that the alternative health community on TikTok is more likely to use emotional storytelling to build trust than conventional health videos, a strategy that these deepfake personas are designed to mimic.

A 2024 KFF poll found that most TikTok users report seeing health-related content on the app, and among these users women are more likely than men to say they’ve seen information or advice about mental health (71% v. 61%) or birth control (41% v. 25%) on the app. In addition, about half of women of reproductive age – those ages 18 to 49 – report seeing information or advice on TikTok about prescription birth control (54%) or abortion (48%). While fewer than half (40%) of TikTok users say they trust information about health issues that they see on the app at least “somewhat,” this rises to half among women ages 18-49. Notably, younger adults and women are more likely than older adults and men, respectively, to say they use TikTok every day.

About The Health Information and Trust Initiative: the Health Information and Trust Initiative is a KFF program aimed at tracking health misinformation in the U.S., analyzing its impact on the American people, and mobilizing media to address the problem. Our goal is to be of service to everyone working on health misinformation, strengthen efforts to counter misinformation, and build trust. 


View all KFF Monitors

The Monitor is a report from KFF’s Health Information and Trust initiative that focuses on recent developments in health information. It’s free and published twice a month.

Sign up to receive KFF Monitor
email updates


Support for the Health Information and Trust initiative is provided by the Robert Wood Johnson Foundation (RWJF). The views expressed do not necessarily reflect the views of RWJF and KFF maintains full editorial control over all of its policy analysis, polling, and journalism activities. The Public Good Projects (PGP) provides media monitoring data KFF uses in producing the Monitor.

Mapping Hospital Employment By State

Published: May 21, 2025

Congress is considering substantial reductions in Medicaid spending as part of a budget reconciliation bill—the One Big Beautiful Bill Act—with the goal of offsetting part of the cost of tax cuts and other expenditures. While there are a number of Medicaid policy changes in the bill, three changes account for the vast majority of the savings according to estimates from the Congressional Budget Office: requiring states to implement work requirements for the expansion group, increasing barriers to enrolling in and renewing Medicaid coverage, and limiting states’ ability to raise the state share of Medicaid revenues through provider taxes. Any large cuts in Medicaid spending would likely have implications for hospitals, given that the program accounted for about one fifth (19%) of all spending on hospital care in 2023. Medicaid spending cuts, along with other policy changes under consideration, could lead to decreases in payments to hospitals and increases in the number of uninsured Americans, both of which would likely affect hospital finances, access to hospital services, and the quality of patient care. These changes could also impact local economies, given that hospitals are often major employers in their communities.

The interactive 50-state maps below show the number of hospital employees by state and how hospital employment ranks among industry subsectors based on 2023 data from the Quarterly Census of Employment and Wages (QCEW), which includes more than 95% of U.S. jobs. Most hospitals are part of a broader health system, but system employees working in other settings (such as in separate physician practices) are not included. (See Methods for additional information about the data). Key takeaways include the following:

  • Hospitals employed 6.7 million individuals in 2023.
  • Hospitals employed about 131,000 individuals on average across the 50 states and DC, with hospital employment ranging from about 13,000 in Wyoming to about 610,000 in California.
  • Hospitals employed more than 100,000 individuals in 23 states and more than 400,000 individuals in four states: California, Florida, New York, and Texas.
  • Hospitals are the sixth largest employer in the country, and among the top five largest employers in 22 states, when comparing industry subsectors. Nationwide, the hospital subsector follows educational services; food services and drinking places; professional, scientific, and technical services; administrative and support services; and ambulatory health care services in employment rankings. Some physicians and other employees in the ambulatory health care services subsector may in fact be part of the same health system as hospitals but are not included in hospital employment if they work in other settings.
  • Hospitals ranked among the top eight employers in every state and were the ninth largest employer in DC.
  • Hospitals were the second largest employer in West Virginia and the third largest employer in North Dakota, South Dakota, and Wyoming.
Hospitals Employed 6.7 Million People in 2023, and More Than 100,000 People in 23 States
Hospitals Are the Sixth Largest Employer in the Country Across Industry Subsectors and Rank Among the Top Five Employers in 22 States

This work was supported in part by Arnold Ventures. KFF maintains full editorial control over all of its policy analysis, polling, and journalism activities.

Methods

This analysis uses data from the Quarterly Census of Employment and Wages (QCEW), which is administered by the Bureau of Labor Statistics (BLS). As BLS notes, the QCEW data provide a “quarterly count of employment and wages reported by employers covering more than 95 percent of U.S. jobs.” The QCEW includes workers covered by state unemployment insurance laws as well as federal workers covered by the Unemployment Compensation for Federal Employees (UCFE) program. Employment counts are referred to in this analysis as the number of individuals employed, though QCEW counts each job separately for individuals with multiple jobs.

Analyses of hospital and other employment relied on the 2023 average annual employment numbers reported by BLS. Industry subsector rankings were based on 3-digit NAICS codes. Employment for a given industry subsector and employer type were not included in totals or considered for purposes of ranking when not disclosed by BLS. In most states (46), this excluded 1% of employment reported in the QCEW or less. In the four remaining states (Delaware, Hawaii, Rhode Island, and Wyoming) and DC, this excluded 2% to 6% of employment. Among hospitals, BLS did not disclose state government hospital employment in DC, Iowa, Kentucky, Michigan, Rhode Island, South Dakota, Vermont, and Wyoming and local government hospital employment in Massachusetts and South Dakota.

U.S. Global Health Country-Level Funding Tracker

Published: May 21, 2025

This tracker provides U.S. global health funding data by program area and country. It includes Congressionally appropriated (planned) funding amounts from FY 2006 to FY 2023, as well as obligations and disbursements from FY 2006 to FY 2025 (FY 2024 and 2025 data are partially reported). It is important to note that these data do not reflect recent changes made by the Trump administration, starting on January 20, 2025, that have resulted in a freeze in funding, significant funding reductions, and cancellation of the majority of global health projects (see the KFF fact sheet on the proposed reorganization of U.S. global health programs for more information). Data were obtained from ForeignAssistance.gov (see About This Tracker below for more details). For examples of analyses that can be done using the tracker, please expand the section below.

Sample Analyses

This interactive can be used to understand how much funding the U.S. provides to global health programs in other countries. For example, in FY 2023, the most recent year with complete data, the U.S. appropriated $6.9 billion, obligated $6.1 billion, and disbursed $6.2 billion to country-specific global health programs (additional funding was also channeled to global activities and regional programs). Of the $6.1 billion in obligations:

  • 87 countries received U.S. funding for global health programs overall, including 61 countries that received funding for HIV, 57 for global health security (GHS), 47 for maternal and child health (MCH), 38 for family planning and reproductive health (FP/RH), 29 for malaria, 27 for nutrition efforts, 26 for tuberculosis (TB), and 19 for other public health threats.
  • The top 10 countries, accounting for 61% of funding, were: Nigeria ($574 million), Tanzania ($487 million), Uganda ($427 million), Mozambique ($423 million), Zambia ($412 million), Kenya ($381 million), South Africa ($364 million), Malawi ($259 million), Democratic Republic of the Congo ($219 million), and Ethiopia ($198 million).
  • Regionally, countries in Sub-Saharan Africa received the largest share of U.S. global health funding (85% or $5.2 billion), followed by East Asia and Oceana, South and Central Asia, and Western Hemisphere (each at 4% or ranging from $226-264 million), Middle East and North Africa (2% or $106 million), and Europe and Eurasia (1% or $83 million).
  • Low-income countries received the largest share of funding (46% or $2.9 billion), followed by lower-middle-income countries (43% or $2.6 billion), and upper-middle-income countries (11% or $651 million); high-income countries received 0.2% ($10 million).

About This Tracker

The U.S. is the largest donor to global health in the world, providing bilateral (direct country-to-country) support for U.S. global health programs in almost 90 countries in FY 2023, with additional countries reached through U.S. regional efforts and U.S. contributions to multilateral organizations. This tracker provides historical data on bilateral U.S. government funding for global health by country, region, and income-level. It presents data on country-specific global health funding channeled through the Department of State (State) and U.S. Agency for International Development (USAID), which account for approximately 85% of all U.S. funding for global health. Funding channeled through other agencies – the National Institutes of Health (NIH), Centers for Disease Control and Prevention (CDC), and Department of Defense (DoD) – is not included, as these data are not available at the country-level. Funding directed to “regional” or “worldwide” programs, which may reach additional countries, is also not included. See our companion resource, KFF U.S. Global Health Budget Tracker, to view data on U.S. funding for global health overall, including funding channeled through these other agencies. Data in this tracker present three transaction types:

  1. Appropriated: funding amounts based on Congressional appropriations for a given fiscal year which may be obligated and disbursed over a multi-year period;
  2. Obligations: binding agreements that will result in disbursements (or outlays), immediately or in the future, and
  3. Disbursements: actual paid amounts (an outlay of funds) to a recipient in a given year.

These amounts will be updated as new data become available. Queried data can be downloaded using the button within the interactive, and the full data can be downloaded here. For questions related to this resource, or for inquiries on further analyses on U.S. global health funding, please contact globalhealthbudget@kff.org.

Sources

KFF analysis of data from the U.S. Foreign Assistance Dashboard, U.S. State Department regional classifications, and World Bank income classifications.