Trends in State Medicaid Programs: Looking Back and Looking Ahead
Executive Summary
Medicaid is the nation’s primary public health insurance program covering over 70 million Americans with low incomes. Each year, states make a range of policy changes to Medicaid to comply with new federal rules and to address an array of policy goals. Medicaid programs also operate within state budgets, requiring a constant focus on cost control that is heightened during economic downturns. For 15 years, the Kaiser Commission on Medicaid and the Uninsured (KCMU) and Health Management Associates (HMA) have conducted annual surveys of Medicaid programs across the country. The National Association of Medicaid Directors (NAMD) has formally collaborated on this project since 2014. A look back at this work shows three key findings:
Economic changes have significant effects on Medicaid programs. During economic downturns, program spending and enrollment rise as demand for Medicaid coverage increases and declines in state revenue growth slows result in additional pressure to control costs. States often turn to provider rate cuts and benefit restrictions to control Medicaid spending. Federal fiscal support during the last recession helped states mitigate some program cuts; maintenance of eligibility provisions helped protect eligibility as demand peaked.
States have generally moved to expand Medicaid eligibility and streamline enrollment processes over time. Even before the Affordable Care Act (ACA), several states implemented coverage expansions through demonstration waivers as well as enrollment simplifications, which helped states reduce the uninsured and later became the foundation for coverage expansions under the ACA. Over time, states have also adopted more targeted expansions, some as a result to changes in federal law. Federal fiscal relief during the last recession was tied to Maintenance of Eligibility requirements that were extended under the ACA. The ACA expanded Medicaid to nearly all non-elderly adults with income at or below 138% of the federal poverty level (FPL) with 100% federal funding through 2016 phasing down to 90% in 2020 and beyond. The Supreme Court ruling on the ACA in June 2012 effectively made the Medicaid expansion optional for states; to date 32 states including the District of Columbia have adopted the expansion. In addition, the ACA required all states to simplify, modernize and coordinate their enrollment processes.
Medicaid is a dynamic program, with states constantly implementing initiatives to transform how care is delivered and to increase value. Over time, there has been a dramatic shift in how care is delivered from primarily fee-for-service systems to predominantly managed care. States continue to expand the use of managed care as well as implement a range of emerging payment and delivery system reforms. The ACA also provided new options to better coordinate care for high need populations, to better integrate physical and behavioral health and to help states rebalance their long-term care programs in favor of community-based services and supports. In addition, states have focused on efforts to control pharmacy costs.
This brief provides a look back at the enrollment and spending trends as well as the multitude of policy actions taken by states across key areas: eligibility and application processes; provider rates and taxes; benefits, pharmacy and long-term care since as well as highlighting more recent data on managed care and delivery system reforms collected as part of this annual survey. Looking ahead, the survey will continue to capture the evolution of the Medicaid program with a focus program changes during economic cycles as well as innovations in payment and delivery system reform.
Introduction
Medicaid is the nation’s primary public health insurance program for people with low incomes covering over 70 million Americans. The Medicaid program is jointly-funded by states and the federal government; the federal government guarantees matching funds to states for qualifying Medicaid expenditures. States are guaranteed at least $1 in federal matching funds for every $1 they spend of their own funds on the program with poorer states receiving more. (For more on Medicaid financing and its role in state budgets, see this resource.) Participation in Medicaid in voluntary, but states that participate must design and administer their own Medicaid programs within federal requirements. Within these parameters, states can choose to cover optional groups and benefits and have substantial discretion to determine how care is delivered as well as how and how much providers are paid. Medicaid programs have also continued to evolve over time, responding to new options made available through federal law, new technology and changes in the health care marketplace.
States have responded to program options in different ways, reflecting wide variation across states in their health care marketplace, culture, traditions, priorities and fiscal capacity, and as a result program variation across the states is significant. To help capture these changes, the Kaiser Commission on Medicaid and the Uninsured and Health Management Associates have conducted annual in-depth surveys for the past 15 years of changes taking place in Medicaid programs across the country. While the survey has changed over time to capture emerging policy issues, the reports have consistently captured information about Medicaid in five key areas:
- Spending and enrollment;
- Eligibility and application/renewal processes;
- Benefits including pharmacy and long-term care;
- Provider rates and taxes/fees; and more recently
- Managed care and other payment and delivery system reform efforts.
This brief reviews trends across different policy areas and highlights where federal changes imposed new requirements. Because all states have to comply with new requirements (like the ACA enrollment simplifications) these changes are not counted as state policy actions.
Additional detail is included in the Appendix; state level data can be accessed in the following data collection.
Background
State Medicaid programs are affected by a changes in economic conditions and federal policy among other factors. During the period of this survey, two factors in particular have had widespread effects – the Great Recession and the Affordable Care Act.
During the Great Recession, states faced historic declines in state tax revenue. (Exhibit 1) In response, Congress has twice passed temporary increases to the FMAP rates to help support states during economic downturns, most recently in 2009 as part of the American Recovery and Reinvestment Act (ARRA.) The ARRA-enhanced match rates was the largest source of federal fiscal relief to states, providing over $100 billion in additional federal funds over 11 quarters, ending in June 2011.1 Event with this fiscal relief, the effects of the recession on state budgets and Medicaid programs lingered long after the recession was officially over.

The Affordable Care Act (ACA) made several changes to the Medicaid program. Some of the most significant changes related to eligibility and application/renewal policy. Specifically, the ACA expanded Medicaid eligibility to nearly all non-elderly adults with income at or below 138% of the federal poverty level (FPL) – about $16,245 for an individual in 2015. This expansion established a new coverage pathway for millions of uninsured adults who were previously excluded from Medicaid, beginning January 1, 2014. The law also provided for 100% federal funding of the expansion through 2016, with the federal match rate declining gradually from 95% in 2017, 94% in 2018, 93% in 2019 and 90% in 2020 and all future years. However, the Supreme Court ruling on the ACA in June 2012 effectively made the Medicaid expansion optional for states. The ACA required all states to make changes to streamline and simplify the enrollment process, providing no wrong door to coverage between Medicaid, CHIP and the Marketplace that represent historic change for the program. The ACA also provided new options and resources to support state efforts in delivery system and payment reform as well as serve more people in the community-based settings rather than in institutions.
Medicaid Spending and Enrollment Trends
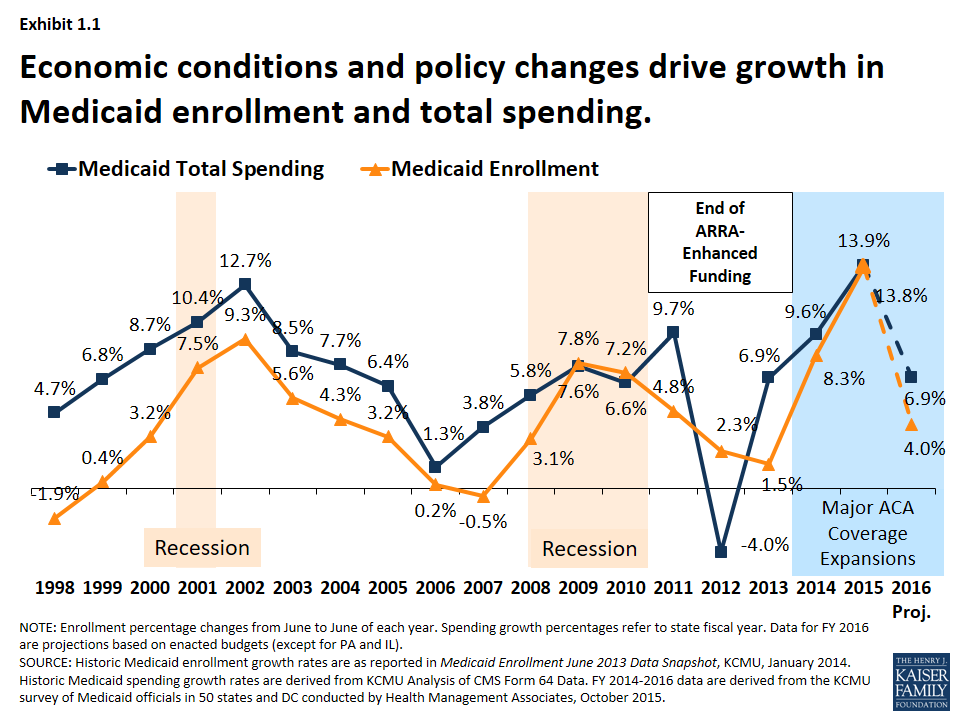
Medicaid is a countercyclical program; Medicaid spending and enrollment growth patterns generally follow the economic cycles. Over the past 15 years, Medicaid enrollment increased substantially during two major recessions, reflecting the countercyclical nature of the program. During economic downturns, when individuals lose their jobs and incomes decline, more people qualify and enroll in Medicaid, which in turn drives increases in total Medicaid spending. As economic conditions improve, Medicaid enrollment growth slows in the absence of other policy changes. This held true in recent years for Medicaid spending and enrollment growth – spending and enrollment growth peaked in SFY 2002 (during an economic downturn), slowed in SFYs 2006 and 2007, and then peaked again in SFY 2009 during the Great Recession. As economic conditions improved, Medicaid enrollment and spending slowed in SFY 2011 through SFY 2013.2 (Exhibit 1.1)
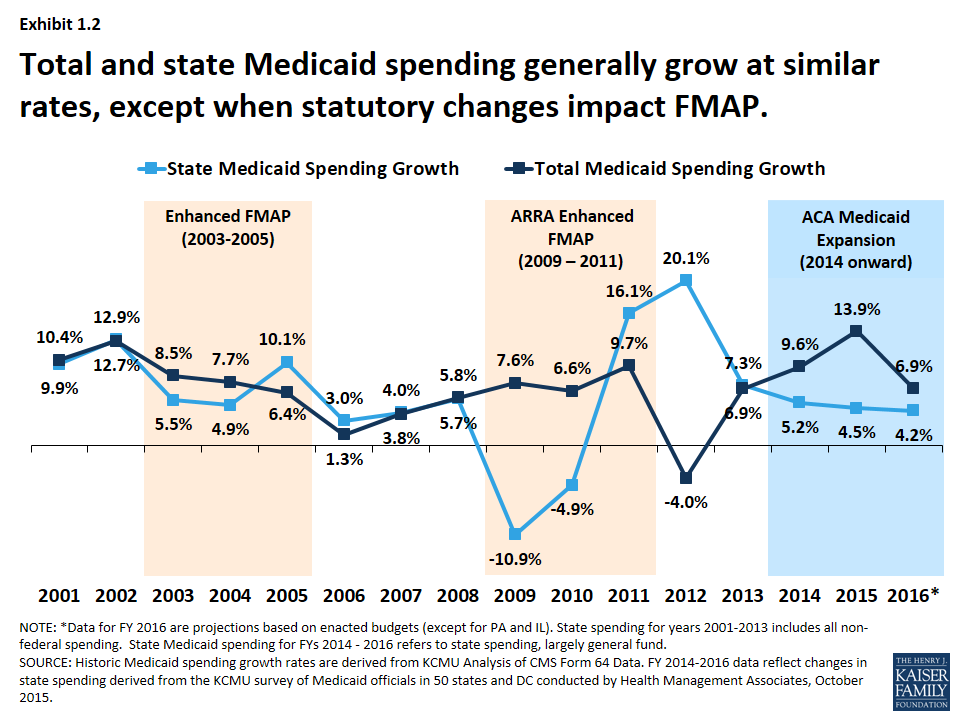
State spending generally follows the same pattern as total spending, except when there are federal changes to the match rate. (Exhibit 1.2) The Medicaid program is jointly funded by states and the federal government; the federal government guarantees matching funds to states for qualifying Medicaid expenditures. In 2016, the federal match rate ranged from a floor of 50% to 74% with poorer states receiving a higher match rate. Because of this structure, total spending growth and state spending on Medicaid tends to grow at similar rates. Exceptions occur when there are changes in federal law that affect matching rates. For example, the magnitude of the federal fiscal relief in ARRA resulted in historic declines in state spending for Medicaid in 2009 and 2010. However, the expiration of this relief resulted in higher state Medicaid spending growth in SFY 2012 compared to growth in federal Medicaid spending. More recently, the change in the Medicaid match rate tied to the ACA Medicaid expansion has resulted in a divergence in growth rates for total and state Medicaid spending.
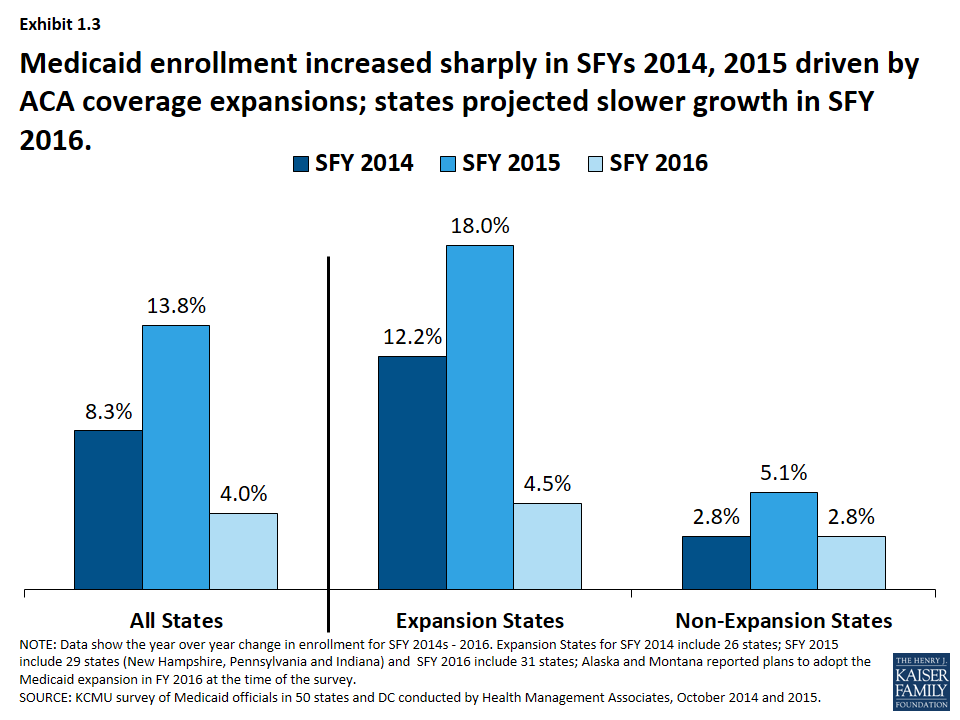
Implementation of the major ACA coverage expansions resulted in sharp increases in Medicaid enrollment in SFY 2014 and 2015. A second driver of Medicaid spending and enrollment trends is policy changes. Medicaid enrollment increased substantially in SFY 2014 and SFY 2015 as the major ACA coverage expansion went into effect. While virtually all states saw enrollment growth, differential effects occurred across states that adopted the Medicaid expansion and those that did not. Medicaid enrollment growth in expansion states far exceeded growth in non-expansion states. Across the 29 states that had expanded3 in SFY 2015, enrollment increased on average by 18 percent, driven by enrollment among adults qualifying under expansion which were fully federally funded. For SFY 2016, enrollment growth was projected to slow across all states, driven by projected slower growth in expansion states. (Exhibit 1.3)
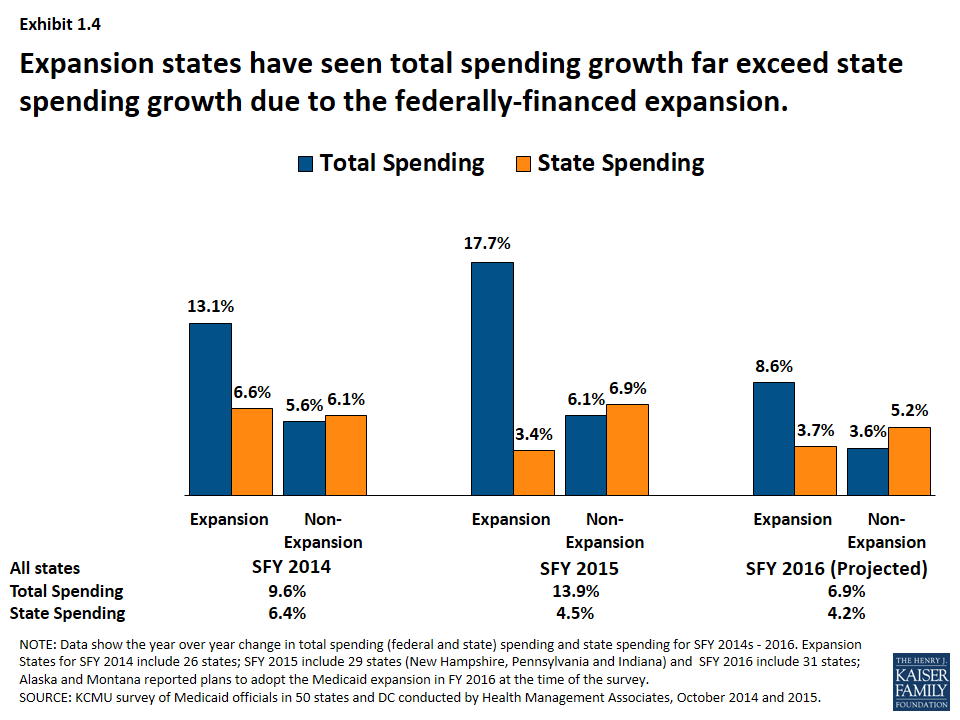
State spending on Medicaid grew at a much slower rate than total Medicaid spending driven by the influx of federal dollars for the ACA Medicaid expansion. (Exhibit 1.4) Total Medicaid spending grew in tandem with enrollment growth, increasing substantially in expansion states. However, state spending grew at a much slower rate than total spending in expansion states due to the higher match rate for the expansion population. For states that expand Medicaid, the federal government pays 100 percent of Medicaid costs of those newly eligible under the Medicaid expansion for calendar years 2014-2016. The federal share gradually phases down to 90 percent in 2020 and thereafter, well above traditional FMAP rates. In contrast, non-expansion states saw total spending and state spending grow in tandem.
Eligibility and Application/Renewals
While required to cover core groups of enrollees, states have the flexibility to cover additional groups. The federal core minimum eligibility standards have expanded incrementally over time, mostly for children and pregnant women, as the Medicaid program separated from welfare. Moreover, many states have utilized the flexibility to extend eligibility to additional groups including children and individuals in need of nursing home care. Given this flexibility there is variation in eligibility levels across states. Federal policy changes have also had a significant effect on state activity in terms of eligibility standards and application and renewal processes – such as the Maintenance of Eligibility, options made available under CHIPRA as well as the ACA.
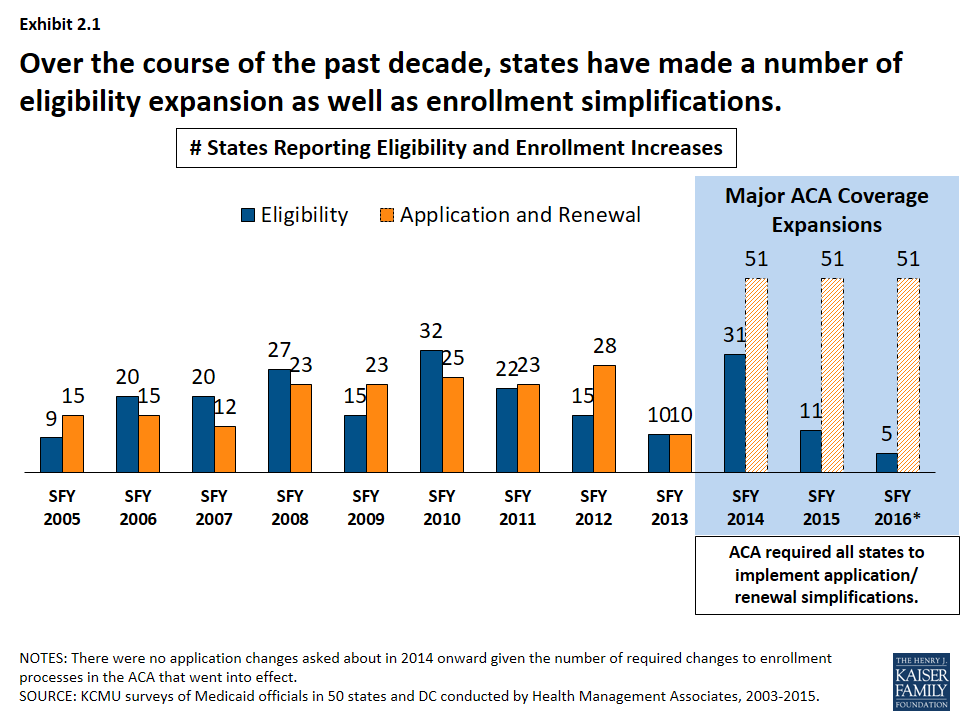
Over the course of the past decade, states have made a number of eligibility expansions. (Exhibit 2.1) Some states implemented broad coverage expansions prior to the data tracking in this survey like Arizona, Hawaii, Massachusetts, New York, Oregon and Vermont. A number of states implemented more limited coverage expansions during our survey tracking through demonstration waivers including Illinois, Iowa, Indiana, Oklahoma, Maine Maryland, Utah and Wisconsin. These coverage initiatives helped to address state priorities to reduce the uninsured and later became the foundation for coverage expansions under the ACA. In addition, some states implemented more targeted eligibility expansions such as reductions or eliminations of asset tests, adoption of options for the working disabled (such as TWIIAA), as well as expanding coverage those aging out of foster care. Other expansions stemmed from new options under the Children’s Health Insurance Program Reauthorization Act (CHIPRA) and the ACA, such as those listed below.
- Following CHIPRA, a number of states adopted federal options to expand coverage to pregnant women and children subject to the five-year bar.
- ACA allowed seven states (Connecticut, District of Columbia, California, Colorado, Minnesota, New Jersey and Washington) to implement early expansions either through state plan amendments or through Section 1115 waivers ahead of the ACA Medicaid expansion in SFY 2014.
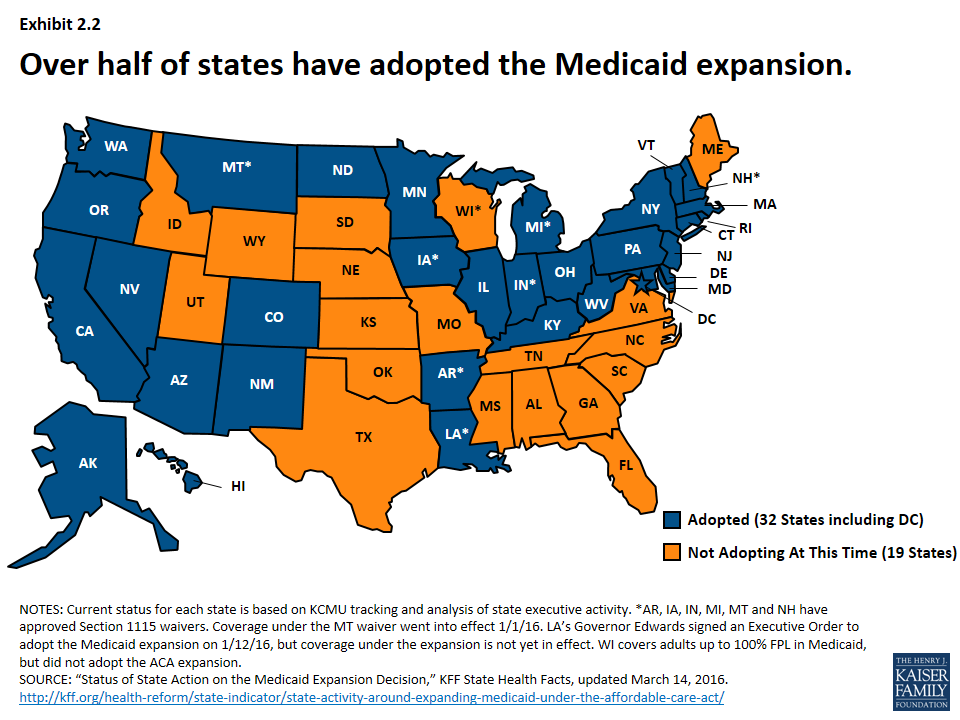
- The number of states reporting eligibility standard expansions spiked in SFY 2014 as 26 states adopted the Medicaid expansion, increasing income eligibility for adults up to 138% FPL. New Hampshire, Pennsylvania and Indiana adopted the expansion in SFY 2015 and Alaska and Montana adopted in SFY 2016.4 As of 2016, 32 states (including DC) have adopted the expansion.5 (Exhibit 2.2)
States have also implemented an array of simplifications to the application and renewal process. These efforts have included implementing or expanding the use of online applications, allowing individuals to self-declare their income, increasing the amount of time between redeterminations from 6 months to 12 months, removing face-to-face requirements and working with other agencies to share data. New options and requirements related to enrollment processes were included in CHIPRA and the ACA.
- Enrollment options made available under CHIPRA included electronic data matching with the SSA to verify citizenship (instead of asking for paper documentation) and express lane eligibility (allowing states to enroll or renew children’s coverage by relying on information from other public programs like TANF or SNAP.)6
- All states were required to streamline and simplify the enrollment process beginning in 2014. These changes include: a transition to the use of Modified Adjusted Gross Income (MAGI) to determine financial eligibility for children, pregnant women, parents and low-income adults; elimination of the asset limits for these same groups, and development of streamlined application, enrollment, and renewal processes coordinated across Medicaid and other health programs.7
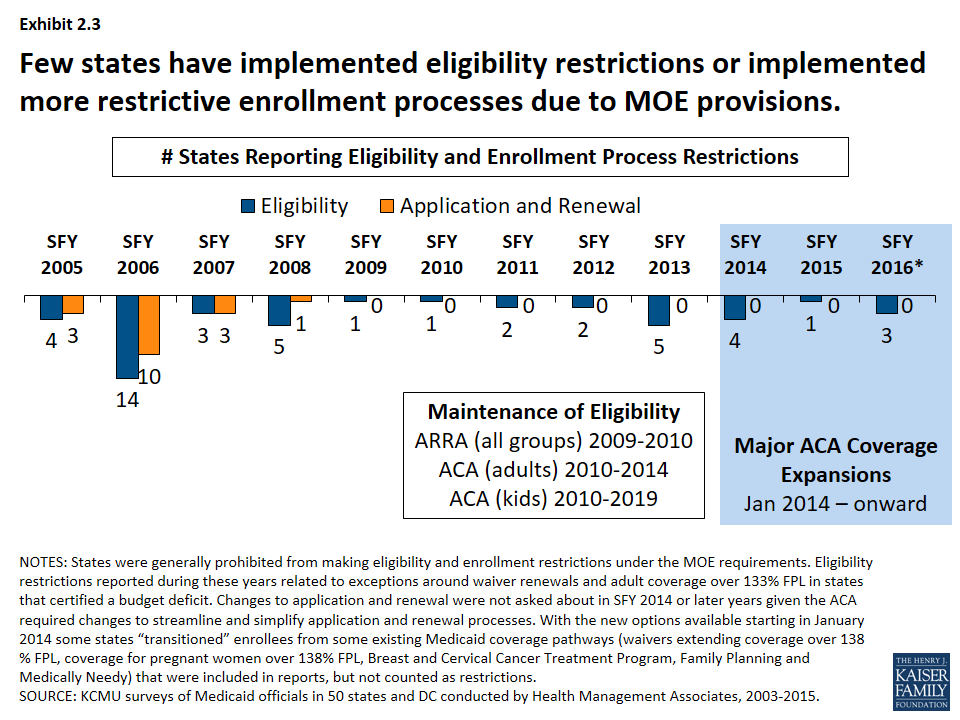
Protections put in place during the recession and continued with the ACA prevented states from making restrictions eligibility and enrollment processes. (Exhibit 2.3) Prior to ARRA, eligibility and enrollment procedures have also been used by states as cost control measures. In the years leading up to the Great Recession, a few states made notable restrictions to eligibility standards, such as:
- Tennessee restricted eligibility in its waiver in SFY 2006 resulting in the elimination of coverage for 171,000 adults following other eligibility reductions and freezes implemented in SFYs 2003 and 2005.
- Missouri reduced eligibility standards across groups (adults, aged and disabled) in SFY 2006. Most notable restriction was reducing the income eligibility level for low-income parents from 75% FPL to AFDC income level (about 23% FPL) affecting 46,000 adults.
- Florida eliminated full-benefit Medicaid coverage for 70,000 Medicare beneficiaries in the optional Medicaid for Aged or Disabled program in SFY 2006. A waiver program was created to cover individuals in the MEDS-AD program who were not eligible for Medicare.
- Washington eliminated 12-month continuous eligibility affecting 350,000 children in SFY 2004. (Reinstated in SFY 2006)
Some states also reported changes to the application and renewal processes that made it more difficult for beneficiaries to enroll and renew coverage (e.g. instituting face-to-face requirements, increasing documentation requirements, requiring more frequent redeterminations, etc.)
However, Maintenance of Eligibility (MOE) provisions were established under ARRA that prohibited states from making cuts to eligibility standards or imposing more restrictive enrollment and renewal processes than those in effect July 1, 2008. The MOE provisions were extended under the ACA. States generally could not make restrictive changes to eligibility standards or enrollment procedures for adults until January 1, 2014 and MOE provisions are in effect for children through 2019. Therefore, only a few states (largely those with waiver renewals) reported eligibility or enrollment restrictions during this period.
Maintenance of Eligibility Requirements
As a condition of accepting additional federal fiscal relief through the ARRA, states were required to ensure that the eligibility standards, methodologies, or procedures under its Medicaid State Plan as well as under any waivers or demonstration programs were not more restrictive than those in effect on July 1, 2008. The ARRA enhanced funding and MOE requirements expired on June 30, 2011, but the ACA extended the ARRA MOE provisions. For adults, these provisions were extended through 2014 (when Marketplaces became operational) and for children through October 2019. Because of the link between eligibility for Medicaid LTC services and Medicaid eligibility generally, states were prevented from making some long-term care changes such as reducing occupied HCBS waiver capacity.8 Exceptions to the MOE requirements included: States were not required to renew waiver coverage that was expiring (Arizona in SFY 2011); and states could restrict eligibility for non-pregnant, non-disabled adults with incomes that exceed 133 percent of the federal poverty level if the state certified that they projected a budget shortfall (Hawaii, Illinois, Maine, Minnesota and Wisconsin in SFY 2013).
Benefits, Pharmacy and Long Term Care
As a condition of participation in the Medicaid program, states are required to provide a core set of “mandatory” benefits, but states have a great deal of flexibility in determining what optional benefits to cover as well as the amount, duration and scope of benefits covered under the program. Children generally have access to a broader benefit package due to EPSDT (early periodic screening diagnostic and treatment) requirements, but Medicaid benefits can vary widely for adults covered under the program. One optional benefit for adults that all states have elected to cover is pharmacy. States have developed extensive programs to manage this benefit and continue to further refine their policies over time. Another area of focus for state Medicaid programs is long-term care. Medicaid is the nation’s primary payer for long-term services and supports (LTSS) covering a continuum of services ranging from home and community-based services (HCBS) to institutional care provided in nursing facilities. LTSS represents about one-third of Medicaid spending and balancing institutional and community-based care is an important focus for state policymakers.9
Benefits
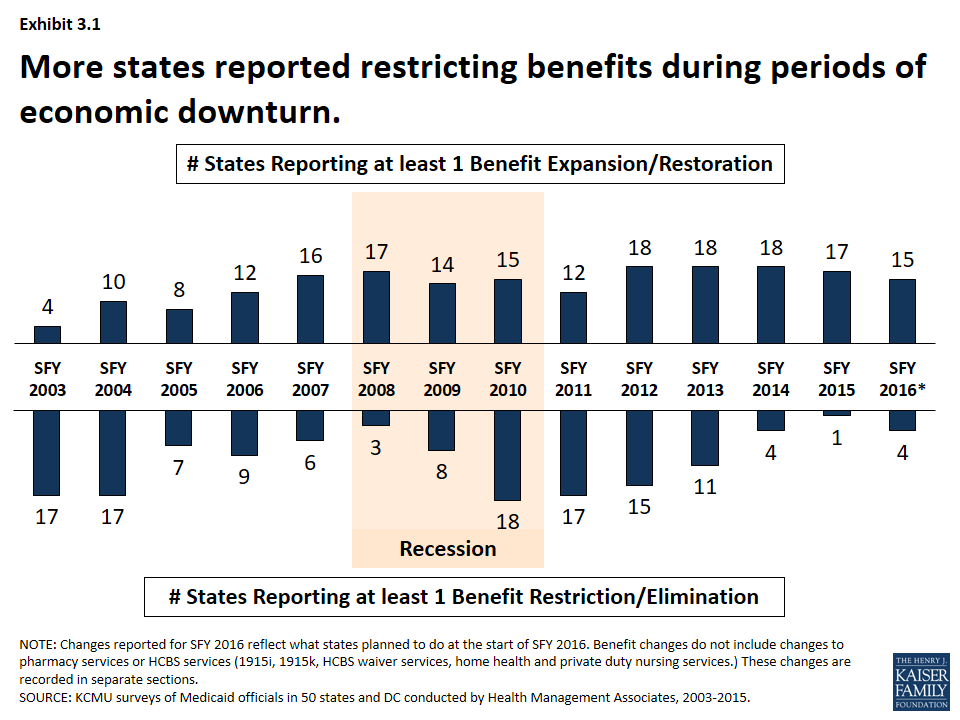
Benefit actions are influenced by economic trends; more states adopt restrictions during downturns and expand or restore benefits as conditions improve. During the Great Recession and its aftermath, the number of states reporting at least one benefit restriction increased, particularly in SFYs 2010 and 2011. (Exhibit 3.1) However, as economic conditions improved, more states reported benefit restorations and expansions than restrictions.
Changes to dental coverage as well as other optional benefits are particularly affected by economic conditions. For example, 16 states restricted or eliminated adult dental coverage in SFY 2003 and SFY 2004; nine of those states restored at least partial dental coverage the following years. During the Great Recession, 19 states reported dental restrictions in SFY 2010 through SFY 2012; eight of these states then reported some restorations in SFY 2013 – SFY 2016.
A number of states have added or expanded behavioral health benefits in recent years.10 Since 2012, half of states (25) have added or expanded behavioral health services. This includes actions to expand mental health services and or substance abuse services.
Pharmacy
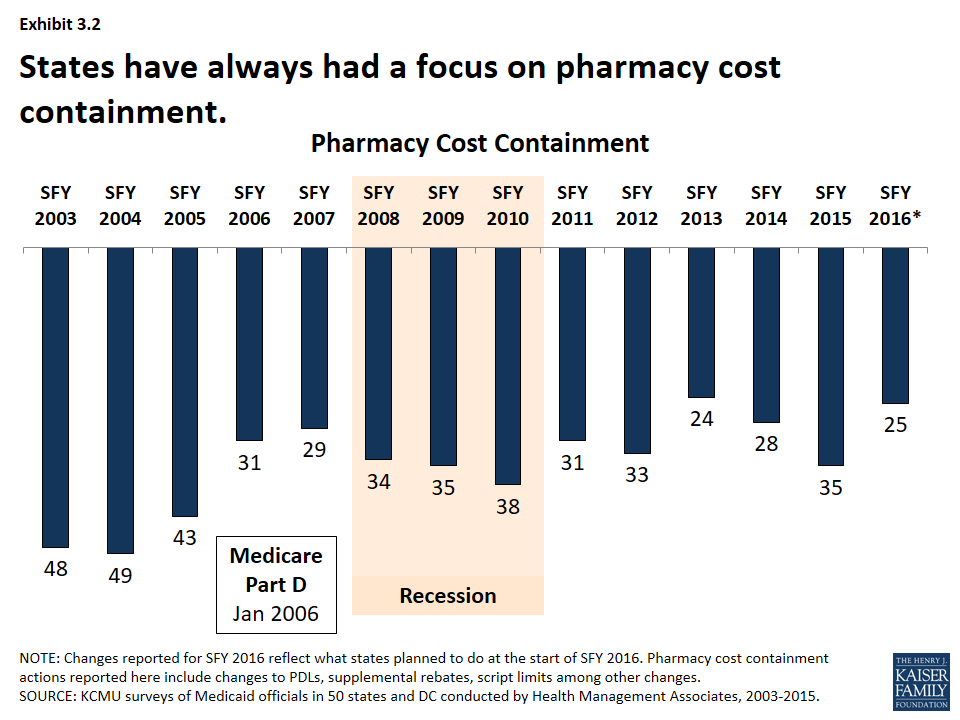
Pharmacy cost-containment has always been a focus of state Medicaid programs, but intensified in response to changes in federal law and industry trends. From 2003-2005, nearly every state implemented policies designed to slow the growth in Medicaid spending for prescription drugs. In January 2006, the implementation of the Medicare prescription drug benefit reduced total state Medicaid drug expenditures by almost half. At the same time, the rate of growth in the cost of prescription drugs abated and the intense Medicaid focus on pharmacy cost containment began to diminish. Since 2015, however, a combination of rising drug prices, particularly for specialty drugs, and increasing enrollments (as a result of ACA coverage expansions) have refocused state attention on pharmacy reimbursement and coverage policies. (Exhibit 3.2)
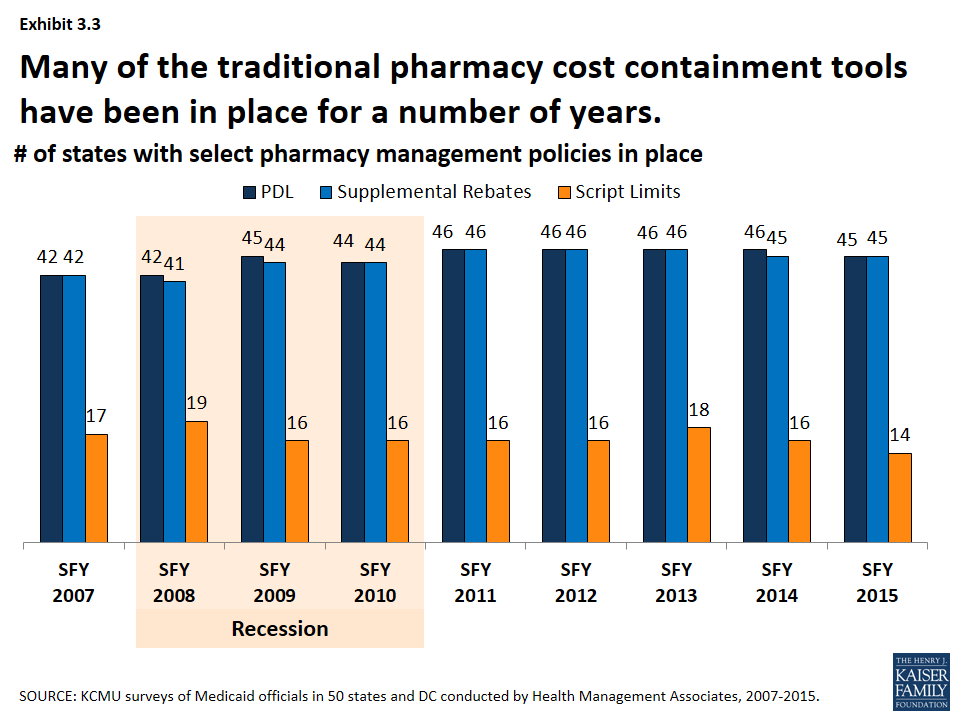
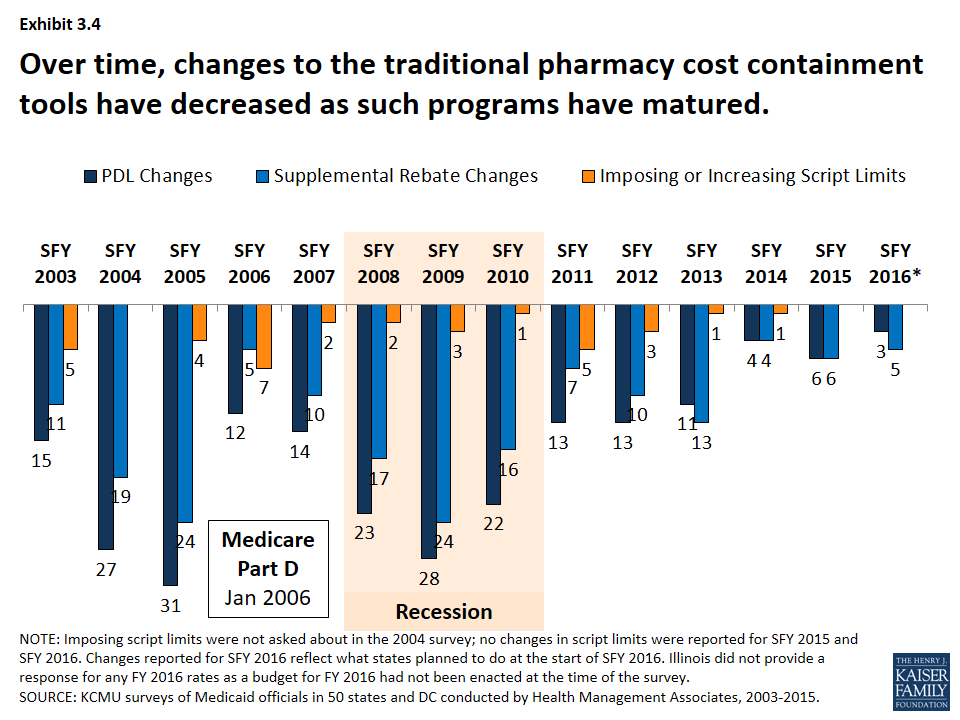
Many of the traditional pharmacy cost containment tools have been in place for a number of years. (Exhibit 3.3) The majority of states have had preferred drug lists and supplemental rebates in place since SFY 2007. Fewer states have implemented limits on the number of prescriptions. Changes to these traditional tools increased in the years leading up to the Medicare prescription drug benefit (Part D) and during the Great Recession. As Medicaid pharmacy programs have matured and the economy has improved, fewer states have made changes to these traditional tools. (Exhibit 3.4)
Long Term Care
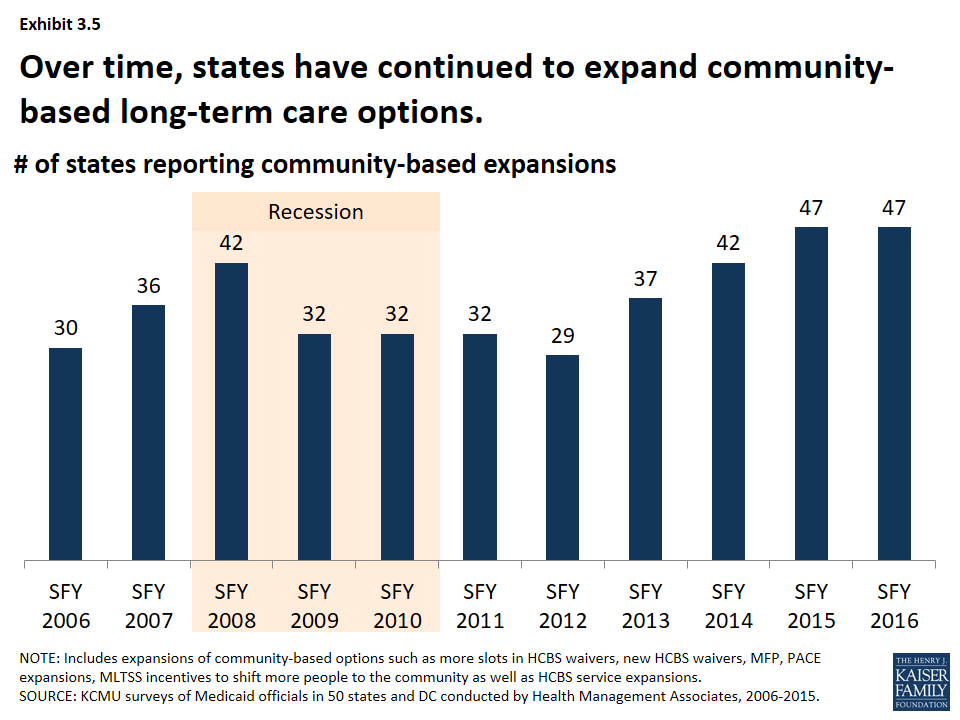
States have steadily expanded community-based long-term care options over time. Each year over the past decade, more than half of states have reported HCBS expansions to serve more people in the community. The number of states reporting HCBS expansions increased leading up to the Great Recession and declined slightly during the Great Recession and immediately afterward. As economic conditions improved, the number of states reporting community-based expansions has increased; nearly all states reported expansions in SFY 2015 and planned such action for SFY 2016. (Exhibit 3.5)
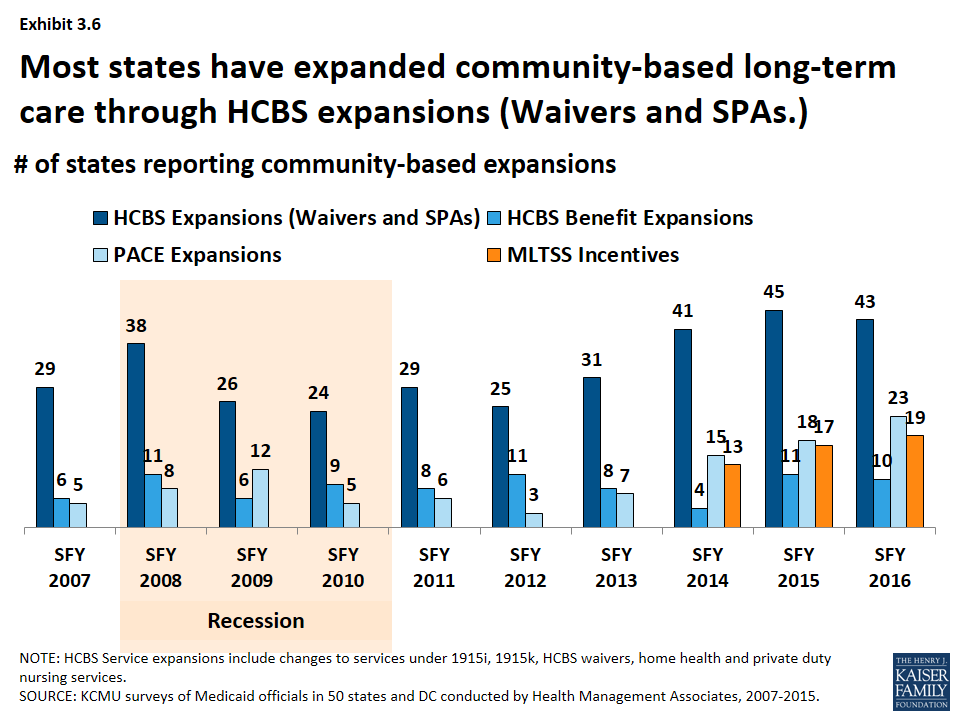
- The most common policy action to expand the number of people served in the community was through HCBS waivers and state plan amendments (SPA). (Exhibit 3.6) Examples include expanding the number of slots available in existing 1915(c) waivers, establishing new waivers, reducing waiting lists. In recent years, states have also expanded the number of people served through 1915(i) SPAs. States have also used PACE11 expansions as a tool to expand the number served in the community; state PACE activity has picked up in recent years.
- More states are building balancing incentives into managed care contracts as states increasingly adopt MLTSS. (Exhibit 3.6) The number of states with managed long-term services and supports (MLTSS) programs has increased in recent years. By 2012, nearly a third of states operated an MLTSS program.12 As part of MLTSS contracts, states have increasingly built into their MLTSS programs with an expectation of increasing beneficiary access to HCBS in lieu of institutional care.
- A few states each year have also expanded the services available under HCBS waivers and through HCBS-related state plan benefits. (Exhibit 3.6) In addition to serving more people in the community, states can expand the services offered under HCBS waivers or enhance or add state plan services such as personal care, home health and private duty nursing. While not an area of intense activity, a few states each year have added or expanded these services.13
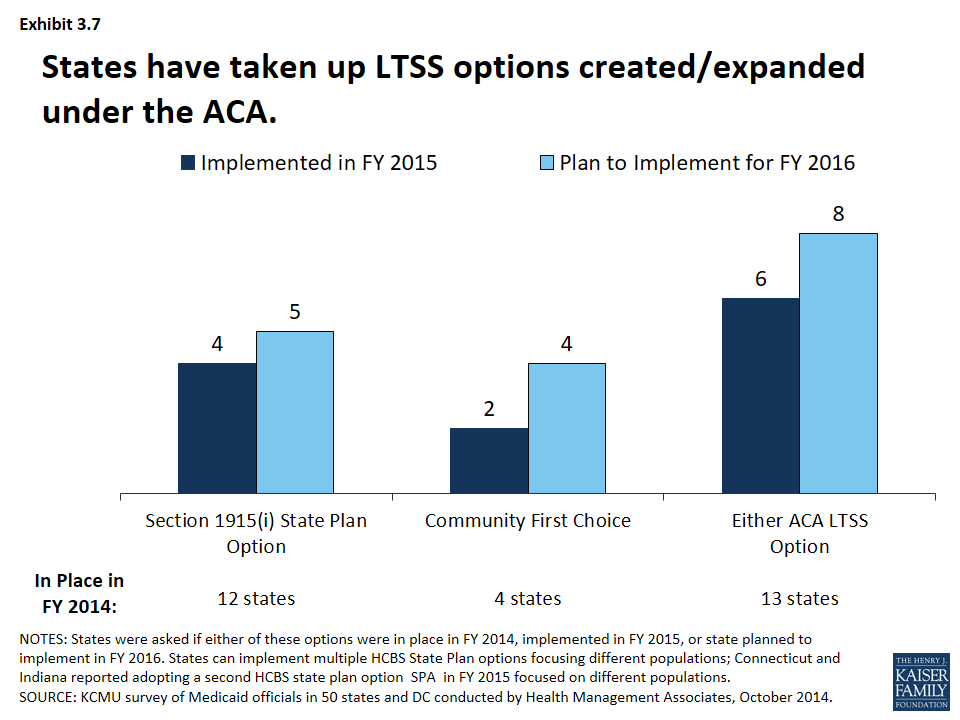
States have also been taking advantage of options created or expanded by the ACA. (Exhibit 3.7) In addition to the major coverage expansions, the ACA created and expanded states with additional options to expand the number of beneficiaries served in the community. These include the 1915(i) SPA, as described earlier, was expanded and altered by the ACA as well as the Balancing Incentives Program (BIP) and the Community First Choice (CFC) option.
- HCBS State Plan. Twelve states had at least 1 1915(i) SPA in place in SFY 2014 while 4 states (including 2 states that already had implemented a 1915(i) SPA) reported adopting a 1915(i) SPA in SFY 2015. An additional 5 states reported plans to add a 1915(i) SPA in SFY 2016.14
- Balancing Incentives Program (BIP). As of October 2015, 21 states had applications approved under the program.15 The program expired in September 2015.
- Community First Choices (CFC). Four states had adopted the CFC option in SFY 2014; 2 states adopted the option in SFY 2015. Four states reported plans to adopt the option in SFY 2016.16
ACA LTSS Options
HCBS State Plan (1915(i)). This option allows states to offer HCBS through a Medicaid SPA rather than through a Section 1915(c) waiver. As a result of changes made in the ACA, income eligibility for this option was extended up to 300 percent of the maximum SSI federal benefit rate and states were permitted to target benefits to specific populations and offer the same range of HCBS under Section 1915(i) as are available under Section 1915(c) waivers. Unlike Section 1915(c) waivers, however, states are not permitted to cap enrollment or maintain a waiting list and, if offered, the benefit must be available statewide. If enrollment exceeds the state’s projections, the state may tighten their Section 1915(i) needs-based eligibility criteria, subject to advance notice and grandfathering of existing beneficiaries.
Balancing Incentives Program. Beginning in October 2011, BIP made enhanced Medicaid matching funds available to certain states that meet requirements for expanding the share of LTSS spending for HCBS (and reducing the share of LTSS spending for institutional services). Funding was available through September 2015. To qualify, states must have devoted less than 50 percent of their LTSS spending to HCBS in FFY 2009, develop a “no wrong door/single entry point” system for all LTSS, create conflict-free case management services, and develop core standardized assessment instruments to determine eligibility for non-institutionally based LTSS.
Community First Choices (1915(k)). Beginning in October 2011, states electing this state plan option to provide Medicaid-funded home and community-based attendant services and supports will receive an FMAP increase of six percentage points for CFC services. However, the final federal rule implementing this option was not released by CMS until May 2012, inhibiting state take-up of this option prior to FY 2013.
Provider Rates and Taxes
Provider Rates
States have a great deal of flexibility to determine the methodology and amount to reimburse providers. According to federal rules, “provider payment rates must be consistent with efficiency, economy, and quality of care and sufficient to enlist enough providers so that care and services are available under the plan at least to the extent they are available to the general population in the geographic area.” Over the 15 years, Medicaid programs have made a number of changes to provider rates; some trends have emerged.
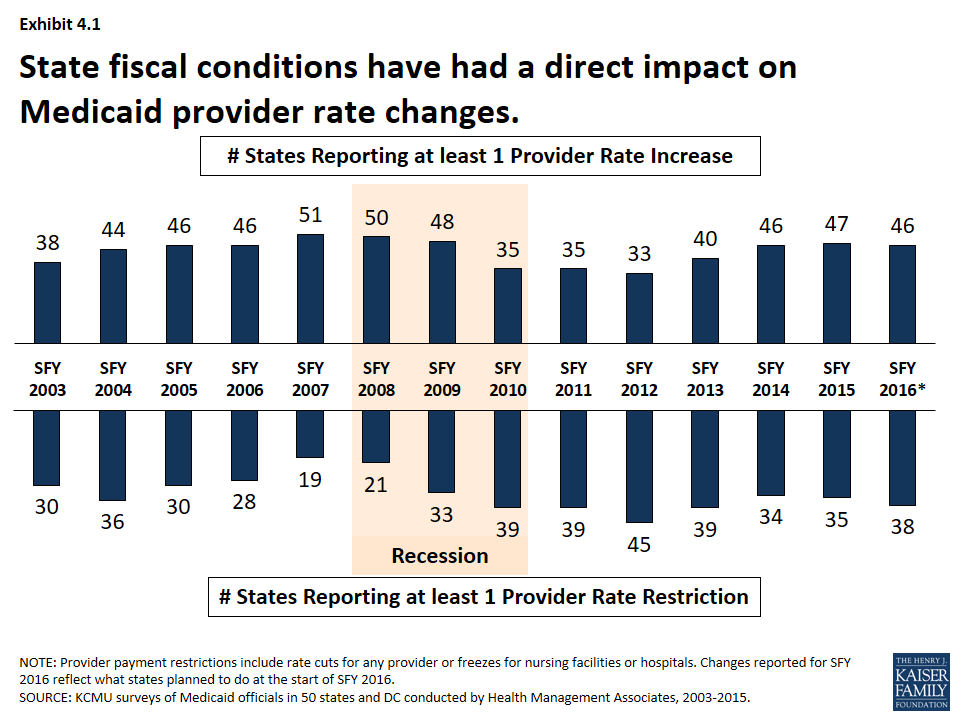
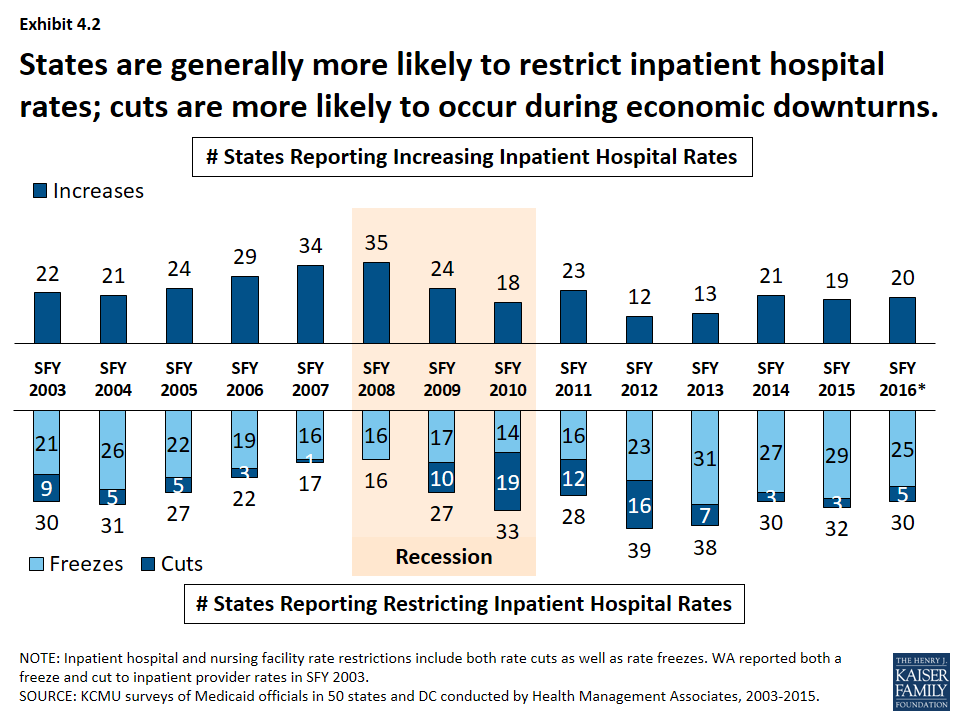
State fiscal conditions have a direct impact on Medicaid provider rates. During economic downturns, states often turn to provider rate cuts to control costs, and when the economy improves, states may restore cuts or work to improve rates. During the Great Recession and its aftermath, the number of states reporting at least one provider rate restriction increased while the number of states reporting at least one provider rate increase declined. More states reported rate restrictions compared to increases for at least one provider rate between SFY 2010 and SFY 2012. (Exhibit 4.1) Economic downturns may have different impacts across provider types.
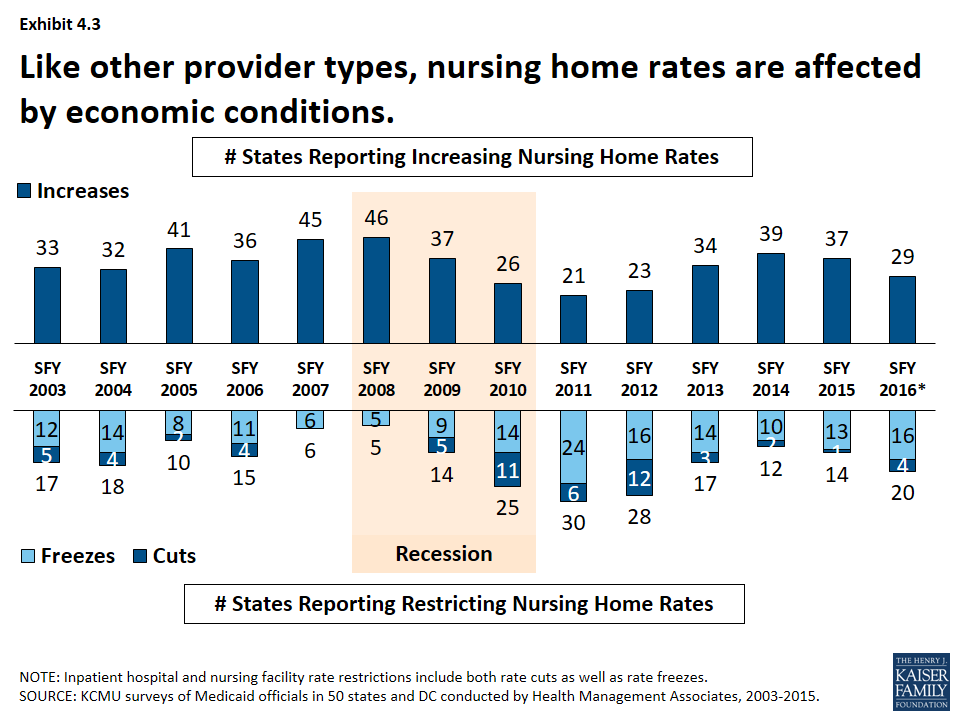
- Institutional providers like hospitals and nursing facilities were more likely to experience rate freezes and not cuts during economic downturns. For this survey, rate freezes for these provider types are counted as rate restrictions. In most years, a small number of states imposed actual rate cuts for these providers rather than freezes. (Exhibit 4.2, 4.3) Climbing out of the recession, many states have maintained freezes for these providers. The number of states with inpatient hospital restrictions (including freezes) has outpaced the number of states increasing rates even after the downturn. (Exhibit 4.2)
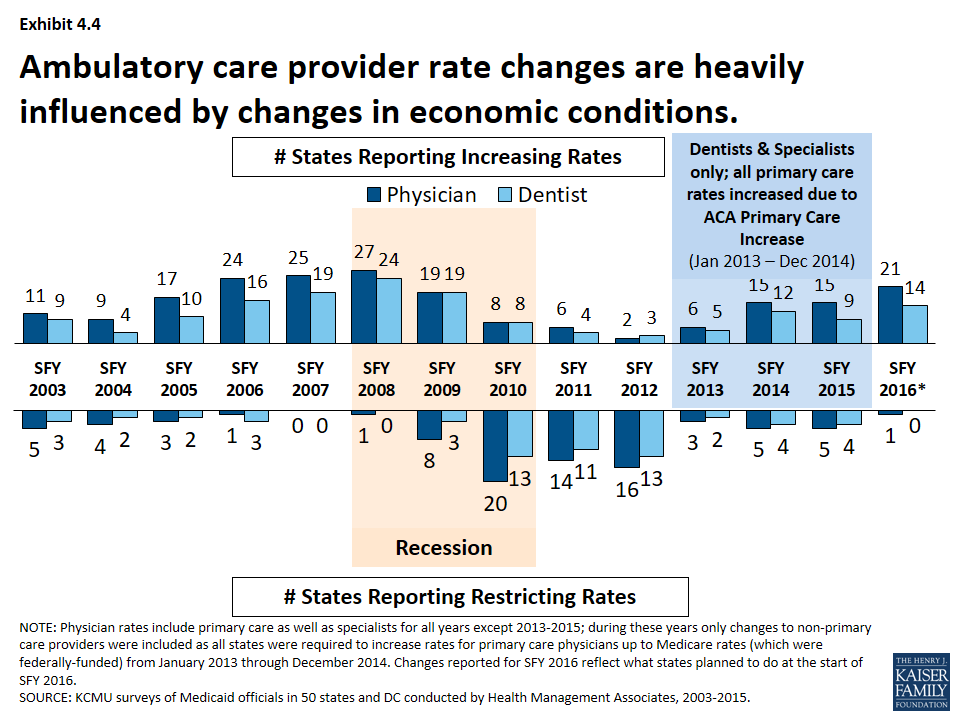
- The number of states reporting rate increases for physicians or dentists increased during the recession and has increased after the recession. (Exhibit 4.4) However, federal policy also influenced some ambulatory care provider rates that are not reflected in this data (See box).17
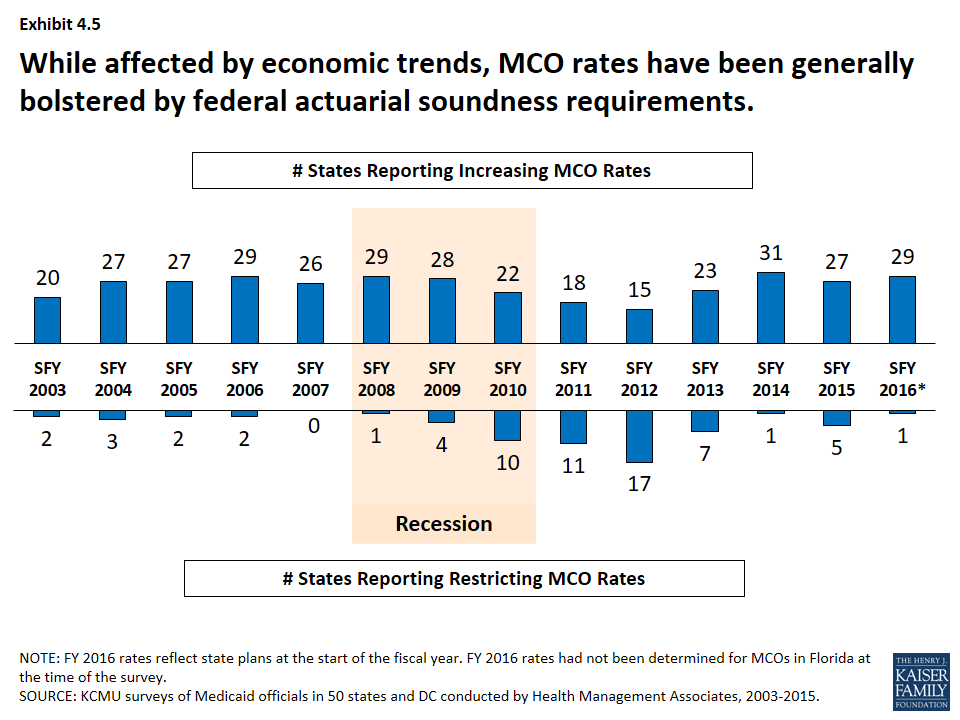
- Managed care rates are generally bolstered by the federal requirement that state capitation rates for MCOs must be “actuarially sound.” MCO rate changes have been affected by economic trends like other Medicaid payment rates, though the number of states reporting MCO rate increases has remained more consistently positive than for other provider types. (Exhibit 4.5)
ACA Primary Care Increase
The ACA required increased Medicaid payment rates for primary care services to Medicare rates from January 2013 through December 2014. The federal government funded 100 percent of the difference between Medicaid rates that were in effect as of July 1, 2009 and the full Medicare rates for these two years. The significance of this rate differential varied greatly across states; a 2012 survey of Medicaid physician fees showed that in a small number of states, Medicaid rates for physician services were already at Medicare rates while other states paid sixty percent or less of Medicare rates. After December 2014, states could elect to continue the increased rate at their regular match rate. About one-third of states reported continuing the rate increase either fully or partially in FY 2015 and FY 2016 while other states reported rate increases unrelated to the ACA primary care rate increase.
Provider Taxes
Provider taxes are imposed by states on health care services where the burden of the tax falls mostly on providers, such as a tax on inpatient hospital services or nursing facility beds. Provider taxes or fees can be imposed on a number of providers or classes of services. In the past, states were able to use provider taxes and other state financing arrangements increase the effective federal matching. However, legislation enacted in 1991 restricted the use of provider taxes to curb such practices. Under current regulations, states may use provider tax revenues to help finance the state share of Medicaid spending only when the tax meets three requirements: it must be broad-based, uniformly imposed, and cannot hold providers harmless from the burden of the tax.18
Provider taxes have become an integral source of financing for Medicaid. States have used provider taxes to support eligibility, benefit and provider rate increases or to help mitigate provider rate cuts. More recently, at least seven states reported plans to use increased provider taxes to fund all or part of the state cost of the ACA Medicaid expansion that will start in CY 2017 when the 100 percent federal match for the expansion starts to decline.19 States have been more likely to impose or increase provider taxes to help fund the state share of Medicaid during economic downturns.
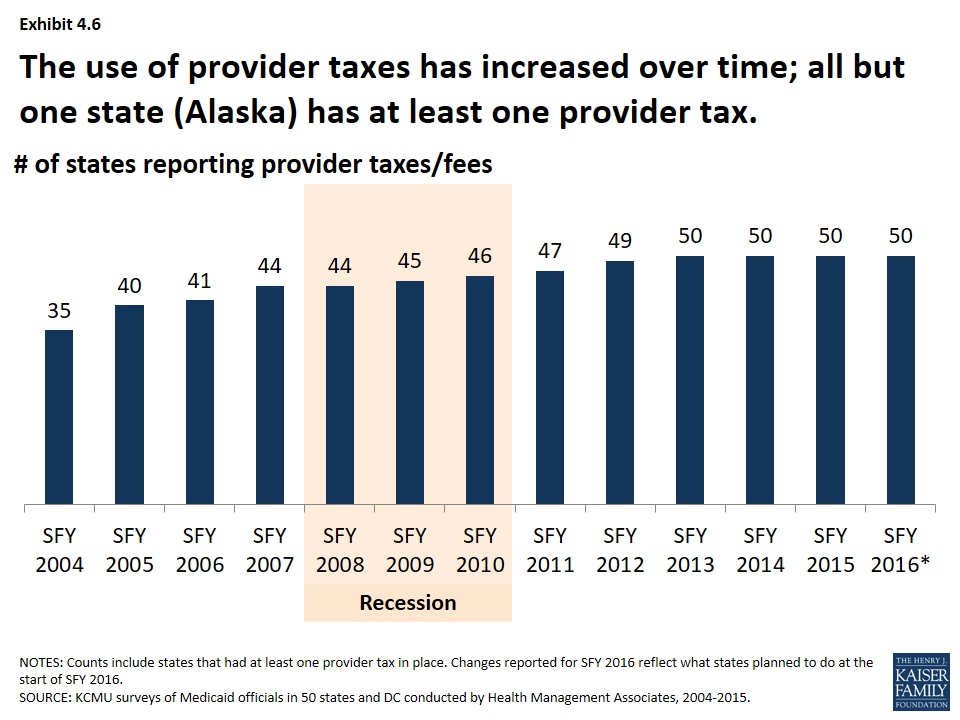
States have increased the number of provider taxes over time. At the beginning of SFY 2004, a total of 35 states had at least one provider tax in place. Over the next decade, a majority of states imposed new taxes or fees and/or increased existing tax rates and fees to raise revenue to support Medicaid. Since SFY 2013, all but one state (Alaska) has had at least one provider tax in place. (Exhibit 4.6)
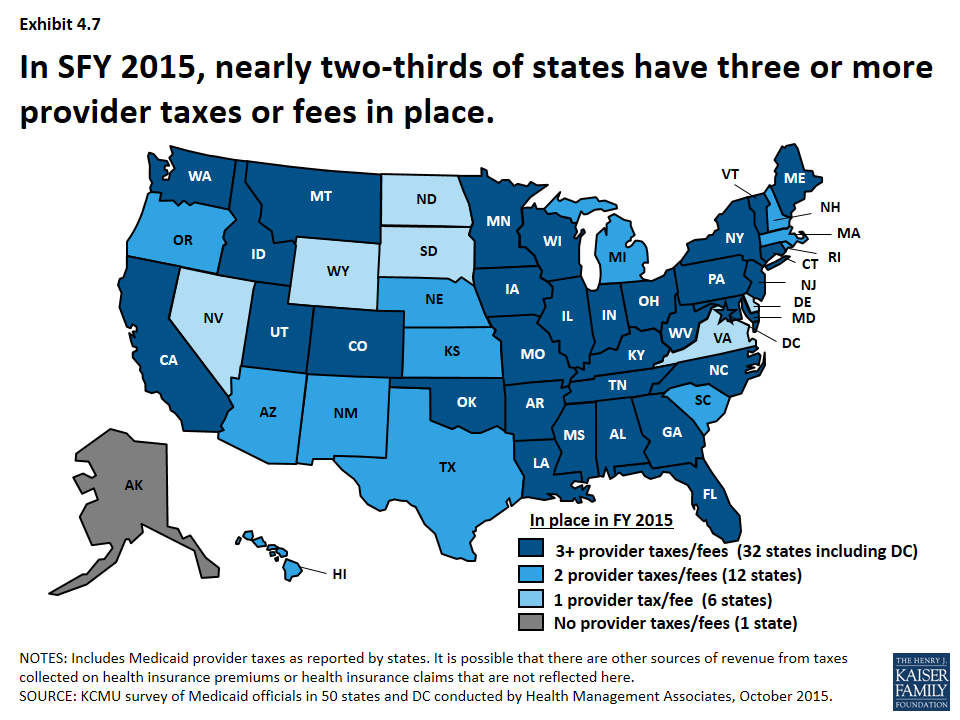
- In SFY 2015, nearly two-thirds of states have 3 or more provider taxes in place. (Exhibit 4.7)
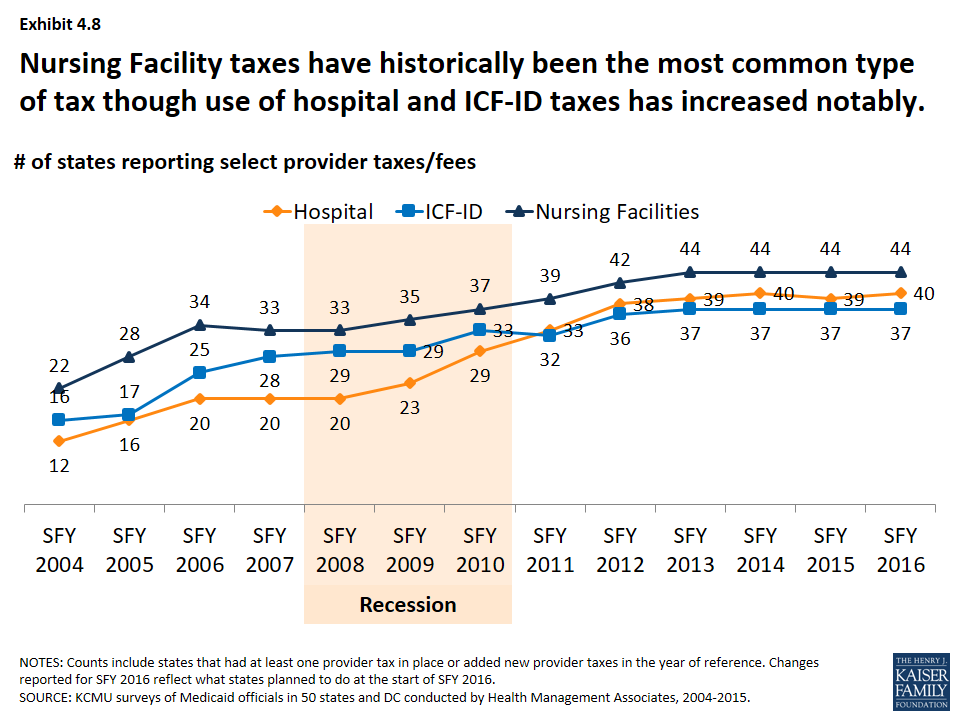
- Nursing facility taxes have historically been the most common type of tax though the use of hospital and ICF-ID taxes has increased notably over time. (Exhibit 4.8)
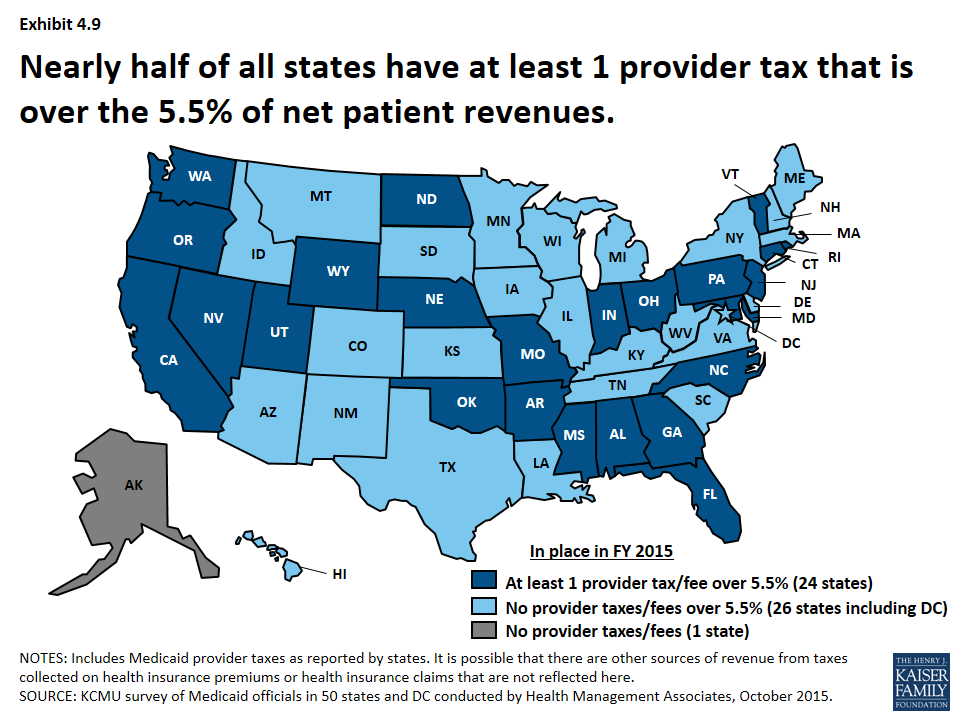
Legislation has been proposed to curtail the use of provider taxes. Under current regulations, states may not use provider tax revenues for the state share of Medicaid spending unless the tax meets certain requirements including that providers cannot be held harmless from the burden of the tax.20 Federal regulations create a safe harbor from the hold-harmless test for taxes where collections are 6.0 percent or less of net patient revenues.21 Recent legislative proposals have suggested lowering the safe harbor threshold from 6.0 percent to 5.5 percent. In 2015, a total of 24 states estimated that at least one provider tax above this 5.5 percent threshold.22 (Exhibit 4.9)
Managed Care and Delivery System Reform
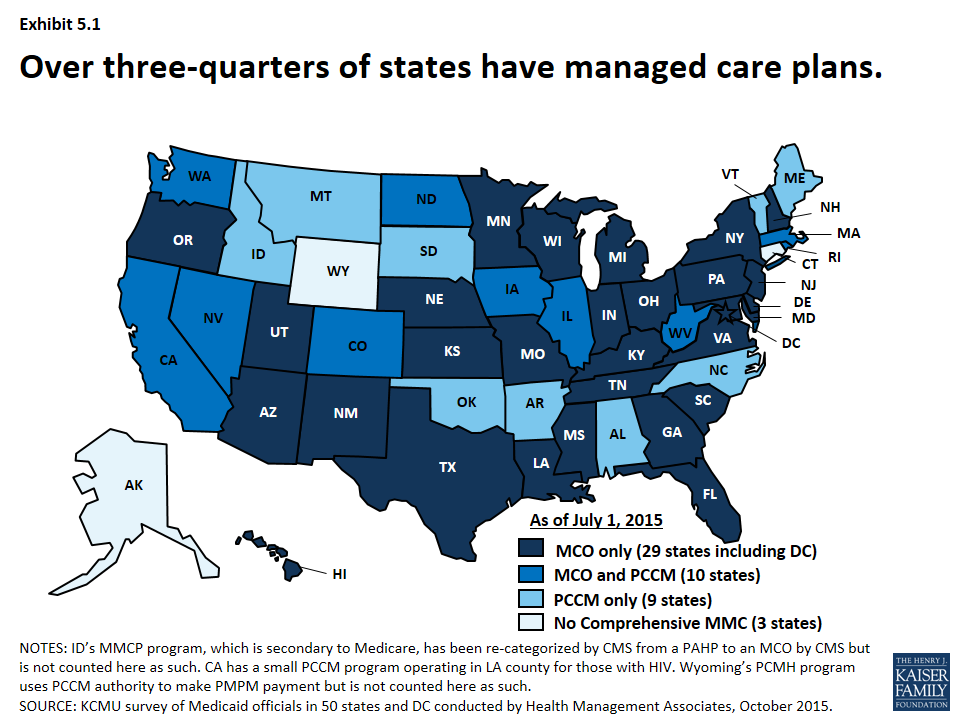
Managed care has become the predominant delivery system for Medicaid in most states, as Medicaid programs have increasingly turned to managed care as a means to help ensure access, improve quality and achieve budget certainty. As of July 2015, a total of 48 states used some form of managed care to serve the Medicaid population, including 39 states (including DC) that contracted with risk-based managed care organizations (MCOs) to serve their Medicaid enrollees. (Exhibit 5.1) States have also increased their focus on new and emerging models of delivery system and payment reform efforts, such as patient-centered medical homes, health homes accountable care organizations among others.
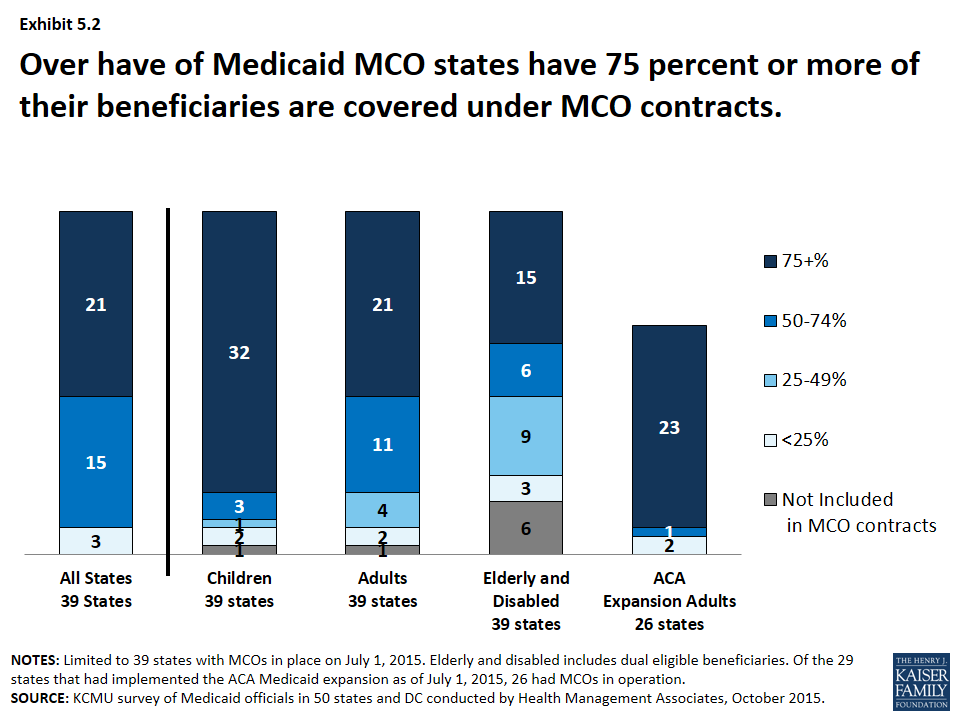
Over the last 15 years, Medicaid delivery systems have significantly shifted to managed care. States have continued to expand their use of managed care by expanding geographically to new regions, adding new populations, making managed care enrollment mandatory for new populations among other changes. States have also been shifting from primary care case management programs (PCCMs) to MCOs. As of July 2015, 21 states with Medicaid MCOs reported at least 75 percent of all Medicaid beneficiaries were enrolled in MCOs. (Exhibit 5.2)
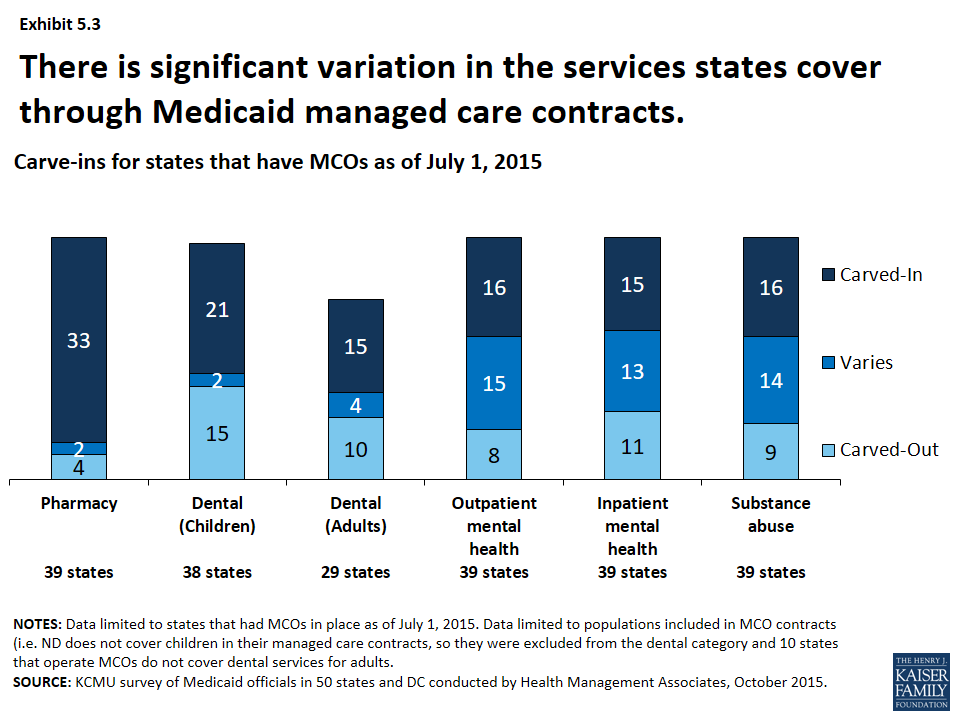
A growing number of states are focusing on integration of physical health, behavioral health and long-term services and supports (LTSS) under the umbrella of managed care. In SFY 2015, most states with MCOs had pharmacy services carved-in for the populations covered by their MCOs23 as well as dental services (for both children and adults in those states that cover this benefit for adults). There was more variation in managed care’s role in the delivery of behavioral health, though more states are looking at carving such services into MCO contracts. (Exhibit 5.3) Additionally, more states are exploring capitated arrangements for long term services and supports though this varies significantly.
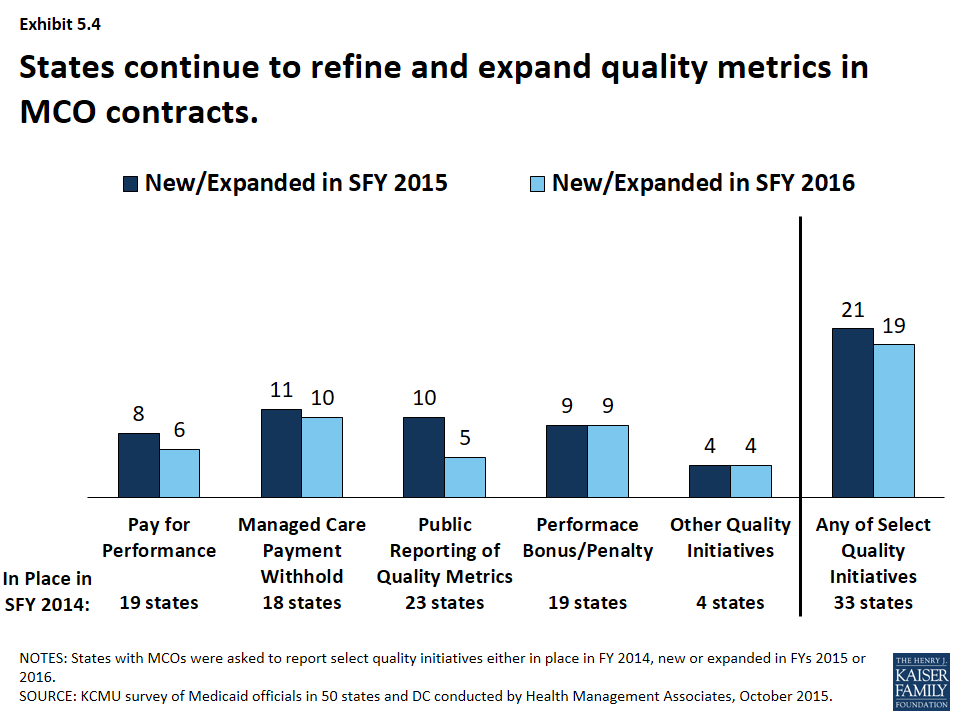
With greater utilization of MCOs has come greater focus on quality performance. All states with MCO programs track one or more quality measures and require other health plan quality activities to improve health care outcomes and plan performance. A majority (23 states) publicly reported or required MCOs to publicly report quality metrics (e.g., a “report card”), and over one-third had pay-for-performance provisions, capitation withholds, and performance bonuses or penalties in place in SFY 2014 as well. (Exhibit 5.4) In SFY 2015, a total of 21 states implemented new or expanded quality initiatives and 19 states planned to do so in FY 2016. The most common new or expanded initiative in SFYs 2015 and 2016 was managed care payment withholds tied to quality performance.
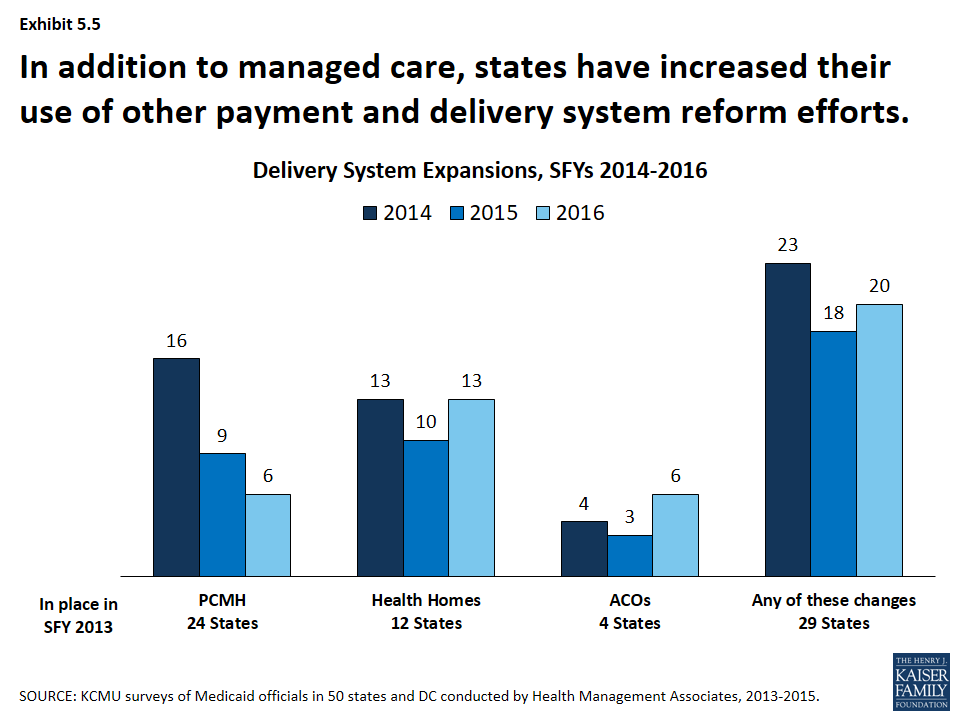
States are also adopting other payment and delivery reforms including patient-centered medical homes, health homes accountable care organizations among others. Nearly half of states had PCMHs in place in SFY 2013. Additionally, twelve states had at least 1 health home, an option made available under the ACA, in place in SFY 2013 and 4 states had Accountable Care Organizations in place in SFY 2013. Interest in all of these options has been growing; one-third to almost half of states have reported actions to expand or newly implement these reforms either in conjunction with or independently of managed care contracts. (Exhibit 5.5) A few states have also implemented episodes of care payment structures as well as other payment reforms under DSRIP waivers. States also continue to explore these and other innovations in payment and delivery system reform with a heightened focus on integration of physical and behavioral health services, social determinants of health and population health.
Conclusion
Medicaid is the nation’s primary public health insurance program for people with low incomes covering over 70 million Americans. Each year, states make a range of policy changes to Medicaid to comply with new federal rules and to address an array of policy goals. Reviewing the annual survey findings over the last 15 years shows just how dynamic and ever-changing Medicaid programs are, as they continue to evolve and respond to changes in the economy, state budgets and priorities, new opportunities and the needs of the beneficiaries they serve. The ACA brought historic changes to Medicaid eligibility and enrollment that built upon earlier actions taken in some states to expand coverage as well as simplify and streamline enrollment processes. Looking ahead, states will likely continue to pursue innovations in delivery system and payment reform, taking advantage of new federal support and innovations in technology. Future surveys will continue to track changes in enrollment and spending as well continued changes related to delivery and payment reforms as well as other key state policy changes in Medicaid.
Appendix
For fifteen years, the Kaiser Commission on Medicaid and the Uninsured and Health Management Associates (in collaboration with the National Association of Medicaid Directors in recent years) have conducted annual in-depth surveys of changes taking place in Medicaid programs across the country. Each year, the survey is conducted from June through August; Medicaid directors and staff provided data for this report in response to a written survey and a follow-up telephone interview. They are asked about policy actions that have been taken in the past state fiscal year (SFY) and actions planned for the coming fiscal year. For most states, the fiscal year runs from July 1 through June 30. For example, SFY 2006 for most states ran from July 1, 2005 through June 30, 2006. Exceptions include AL, DC, and MI (October 1 through September 30), NY (April 1 through March 31) and TX (September 1 through August 31). All 50 states and DC completed surveys and participated in telephone interview discussions each year. Copies of these reports can be found on the KFF Medicaid Budget Survey Archives.
Data included in this issue brief and its related data collection reflect information collected for the each fiscal year. Adopted policies are sometimes delayed or not implemented due to complex administrative or computer system changes, advance notice requirements, lack of approval from CMS or other legal, fiscal, or political considerations. Therefore, adopted actions should not be taken as final until they are implemented.
These surveys seek to capture policy changes states elect to make; changes required under federal law are not counted (though may be noted in some tables as (nc) or “not counted”.)
Over time the survey has evolved, reflecting the ever-changing nature of Medicaid. For example, the first few years of this survey work coincided with an economic downturn, and therefore the report focused on cost containment. As economic conditions improved and states shifted their focus, the survey did so as well, dedicating more effort to capturing innovations and expansions. Questions are refined and reworked; some questions eliminated while others added. Certain questions have been asked consistently to allow for trending. For this report, data from prior surveys have been pulled together in one place. Because of changes in policy and refinement of questions, counts included here may not match the original report. Below are some further notes for each of the policy sections.
Spending and Enrollment
Total Medicaid spending includes all payments to Medicaid providers for Medicaid covered services provided to enrolled Medicaid beneficiaries. In addition, total Medicaid spending includes special payments to “disproportionate share hospitals” (“DSH payments”) that subsidize uncompensated care for persons who are uninsured and unreimbursed costs related to care for persons on Medicaid. Not included in total Medicaid spending are Medicaid administrative costs and federally mandated state “Clawback” payments to Medicare (Pursuant to federal law, state have paid Clawback payments since 2006 to help finance the Medicare Part D prescription drug benefit for beneficiaries who are dually enrolled in both Medicare and Medicaid.) States are asked to exclude costs for the Children’s Health Insurance Program (CHIP.) Total Medicaid spending includes payments financed from all sources, including state funds, local contributions and federal matching funds. Historical state Medicaid spending refers to all non-federal spending, which may include local funds and provider taxes and fees as well as state general fund dollars. State spending for FYs 2014-2016 collected as part of this survey reflect state spending, largely state general fund dollars.
Spending and enrollment data reported here are annual rates of growth for Medicaid enrollment. The growth rates were calculated as weighted averages across all states, and for states based on state decisions to implement the ACA Medicaid expansion in 2014, 2015 or 2016. For FYs 2014, 2015 and 2016, average annual Medicaid spending growth was calculated using weights derived from the most recent state Medicaid expenditure data for fiscal year 2014, based on estimates prepared for KCMU by the Urban Institute using CMS Form 64 reports, adjusted for state fiscal years. These data were also used for historic Medicaid spending. Medicaid enrollment average annual growth rates for SFYs 2015 and 2016 were calculated using weights based on Medicaid and CHIP monthly enrollment data for June 2014 published by CMS. Historical enrollment trend data reflects the annual change from June to June of monthly enrollment data for Medicaid beneficiaries collected from states.24 Medicaid enrollment average annual growth rates for SFY 2014 were calculated using the June 2013 enrollment data that is used for the historical trend.
Eligibility Standards and Application and Renewal
Eligibility Standards – For the purposes of this survey, eligibility standards refer to changes to income standards, asset tests, retroactive eligibility, treatment of asset transfers or income, enrollment caps or buy-in options (including Ticket to Work and Work Incentive Improvement Act or the DRA Family Opportunity Act.) Policy changes are classified as expansions or restrictions based upon the beneficiary’s perspective. While the ACA Medicaid expansion was a mandatory change, it was made effectively optional by the June 2012 Supreme Court ruling; therefore adoption of the ACA Medicaid expansion was counted as an eligibility expansion. With the new options available starting in January 2014 (Medicaid expansion and Marketplace subsidies) states made changes to some existing Medicaid coverage pathways (waivers extending coverage over 138 % FPL, coverage for pregnant women over 138% FPL, Breast and Cervical Cancer Treatment Program, Family Planning and Medically Needy) that were included in reports, but not counted as restrictions.
Application and Renewal – For the purposes of this survey, application and renewal refer to changes in forms, verification or face to face interview requirements, frequency of redeterminations or renewals, new online enrollment systems among other changes. Policy changes are counted as simplifications or restrictions based upon the beneficiary’s perspective. All states were required to implement a number of enrollment simplifications in January 2014 under the ACA. Given the number and scope of these changes, surveys conducted in 2014 onward no longer asked states to report changes in application and renewal policy.
Provider Rates
States are only asked to report the direction of provider rate changes for select provider types; they do not reflect the magnitude of the changes nor levels. Restrictions refer to provider rates that are reduced compared to the previous year for all providers except inpatient hospitals and nursing facilities. These two provider types are more likely than other provider types asked about in the survey to have inflationary adjustment built into their rates. Therefore, for these two provider types, freezes as well as cuts are counted as restrictions. Increases refer to rates being higher than the year before. Because all states were required to increase payment rates for primary care physicians in calendar year 2013 and 2014 (the difference being funded with federal dollars) this survey did not capture primary care rate changes for affected periods; rates for specialists were still captured during this period.
Provider Taxes/Fees
Each year, states are asked to report provider taxes that are in place, new or being eliminated. The way this question has been asked ask changed over time; states were originally asked to list provider taxes in their state. In later years, states were asked about common provider tax types (Nursing Facilities, Inpatient Hospitals and Intermediate Care Facilities for those with Intellectual Disabilites (ICF-IDs). Because of this, there may appear to be breaks in trend data in the early years that may not reflect changes in policy but incomplete data.
In July 2009, CMS changed policy regarding the use of provider taxes on MCOs that restricted their use. A number of states either eliminated such taxes, sometimes replacing them with premium taxes that were not Medicaid provider taxes. This survey relies on state reporting to differentiate between Medicaid provider taxes on MCOs and other taxes; however, it is possible that some states misreported such taxes. In this survey, MCO taxes reported by states for all periods were moved into “other” counts.
Benefits
Policy changes are counted as expansions/enhancements or restrictions/eliminations based upon the beneficiary’s perspective. Changes that were required under federal policy (e.g. covering tobacco cessation services for pregnant women, free-standing birth centers, coverage of the essential health benefits for the ACA Medicaid expansion population) were not counted as changes but may have been reported in tables as (nc).
Two types of benefits – pharmacy and HCBS services – are not included in benefit counts in this report as they are counted in other sections. Pharmacy has long been treated this way in final reports. However, this is a change for HCBS services. Up through SFY 2012, changes to LTSS benefits were often counted as long-term care actions. Starting in 2013, such actions were counted as benefit changes. For this report and in future reports, HCBS benefit changes (which include 1915i, 1915k, HCBS waiver services, state plan home health, personal care and private duty nursing) are counted as long term care actions. Additionally, changes to pharmacy benefits are not included in the benefit counts, but reported as pharmacy actions.
Guidance issued in 2013 clarified that autism-related benefits were required coverage under EPSDT. Such actions reported in that year and years earlier were not counted as benefit changes in this report or its related data collection.
Pharmacy – Pharmacy cost containment actions can include any cost-containment action; only certain ones (changes to the state Preferred Drug List, Changes to Supplemental Rebates and Script Limits) were asked consistently over time. Starting in SFY 2007, states were asked about these same select pharmacy tools being in place; this was not asked in previous years.
Long Term Care – The surveys have asked about expansions and restrictions on both community and institutional benefits. However, in recent years, the survey has moved away from counting restrictions on institutional benefits as these were often completed as part of actions to shift more people into the community. Therefore, expansions on the number of people served in the community can be trended but not restrictions. Up through SFY 2012, changes to LTSS benefits were often counted as long-term care actions. Starting in 2013, such actions were counted as benefit changes. For this report and in future reports, HCBS benefit changes (which include 1915i, 1915k, HCBS waiver services, state plan home health, personal care and private duty nursing) are counted as long term care actions.
Managed Care and Delivery System Reform
This section of the survey has undergone considerable refinement. In the early years of the survey, changes to managed care (such as adding new groups, expanding to new regions, etc.) included changes to both PCCM and MCOs; such changes were not differentiated between the two systems. Therefore, these changes cannot be trended over all surveys. Medicaid managed care trend data is available in the Medicaid and CHIP section of State Health Facts.
Endnotes
- To be eligible for ARRA funds, states could not restrict eligibility or tighten enrollment procedures in Medicaid or CHIP. Vic Miller, Impact of the Medicaid Fiscal Relief Provisions in the American Recovery and Reinvestment Act (ARRA) (Washington, DC: Kaiser Commission on Medicaid and the Uninsured, October 2011), https://modern.kff.org/medicaid/issue-brief/impact-of-the-medicaid-fiscal-relief-provisions/. ↩︎
- Spending growth rates during SFYs 2011 through 2013 were affected by the end of the ARRA-enhanced matching rate. States shifted spending from SFY 2012 to SFY 2011 in order to take advantage of the higher match rate (which ended June 30, 2011.) In addition to this, states increased their cost containment efforts in response to the expiration of the enhanced match rates (which resulted in increased state costs.) ↩︎
- A total of 29 states were implementing the ACA Medicaid expansion in FY 2015, up from 26 states in the previous year (FY 2015 additions include: New Hampshire, Pennsylvania and Indiana). Alaska and Montana expanded in SFY 2016. ↩︎
- Since the survey, Louisianau2019s governor enacted an executive order to adopt the Medicaid expansion. Plans are to implement the Medicaid expansion in Louisiana beginning July 2016. ↩︎
- With new coverage available through the Marketplace, seven states (California, Iowa, Massachusetts, New Mexico, New York, Rhode Island and Vermont) eliminated Medicaid coverage in their waivers for adults with incomes over 138 percent FPL in SFY 2014. The following year, Connecticut reduce parent eligibility from 200 percent FPL to 155 percent FPL; Minnesota and New York shifted some populations to new Basic Health Plan programs as well. Additionally, some non-expansion states (Indiana, Oklahoma, Wisconsin and Maine) that had limited benefit coverage waivers also reduced eligibility down to 100 percent FPL. ↩︎
- CHIPRA also provided an opportunity for states to earn performance bonuses for enrolling children already eligible but not enrolled; in order to qualify, states had to meet specific enrollment targets and adopt certain enrollment/renewal simplifications. ↩︎
- Simplifications to the application and renewal process were further spurred by the availability of enhanced match for states made available under the ACA. Specifically, matching rates for new eligibility and enrollment systems was increased from 50 percent to 90 percent; the matching rate for maintenance and operations was increased from 50 percent to 75 percent. This rule was originally in effect through December 2015 but was recently made permanent. ↩︎
- Under the ARRA MOE, CMS determined that the following actions would be considered violations of the MOE requirements:nnIncreasing stringency in institutional level of care (LOC) determination processes that results in individuals losing actual or potential eligibility for Medicaid pursuant to institutional eligibility rules or in the special eligibility group for HCBS waiver participants under 42 CFR 435.217;nAdjusting cost neutrality calculations for section 1915(c) waivers from the aggregate to the individual, resulting in individuals being dropped from waiver coverage or hindered from moving out of an institutional setting;nReducing occupied waiver capacity for section 1915(c) HCBS waivers, or reducing or eliminating section 1915(c) waiver slots that were funded by the legislature but unoccupied as of July 1, 2008.nnThese standards were maintained under the ACA MOE, but CMS also notified states that it would be possible to increase institutional LOC criteria without violating the MOE if an alternative eligibility pathway to Medicaid HCBS services was created for all individuals that would have previously been able to gain eligibility under the original LOC. CMS offered the following examples of how this could be done: utilize the Section 1915(i) HCBS State Plan Option to extend HCBS benefits to individuals who would have been eligible under former LOC levels; or, use Section 1115 demonstration waiver authority to offer different levels of care for receipt of HCBS and institutional services, ensuring that the available capacity for Medicaid eligibility remains unchanged. CMS also noted that HCBS waivers are time limited and that the ACA MOE requirement does not require a state to renew a waiver that is expiring. Thus, a state may discontinue an HCBS waiver when it expires or may request a renewal at the end of the approved waiver period, with modifications, without creating an MOE issue. ↩︎
- Steve Eiken, Kate Sredl, Brian Burwell and Paul Saucier, Medicaid Expenditures for Long-Term Services and Supports (LTSS) in FY 2013 (Truven Health Analytics, June 30, 2015), http://www.medicaid.gov/medicaid-chip-program-information/by-topics/long-termservices-and-supports/downloads/ltss-expenditures-fy2013.pdf. ↩︎
- In some earlier years, benefit expansions for autism-related services were counted as expansions (PA -2009, MI-2013, MO-2013 and WA-2013.) However, CMS released guidance in X date that clarified that states are required to cover these services under EPSDT. For this analysis and in recent years, such changes are not counted as expansions, but included in appendix tables as (nc.) ↩︎
- PACE is a capitated managed care benefit for the frail elderly provided by a not-for-profit or public entity that features a comprehensive medical and social service delivery system. It uses a multidisciplinary team approach in an adult day health center supplemented by in-home and referral services in accordance with participant’s needs. In recent years, the number of states reporting increasing the number served in the community through this option has increased. ↩︎
- MaryBeth Musumeci, Key Themes in Capitated Medicaid Managed Long-Term Services and Supports Waivers (Washington, DC: Kaiser Commission on Medicaid and the Uninsured, November 2014), https://modern.kff.org/report-section/key-themes-in-capitated-medicaid-mltss-introduction/. ↩︎
- Between SFYs 2010 and 2012, 20 states enacted restrictions on home and community-based services such as personal care services and home health often by imposing utilization controls (increasing prior authorization, reducing service hours, etc.) ↩︎
- Since the most recent survey, Florida has terminated their 1915(i) as of December 2015. https://www.medicaid.gov/State-resource-center/Medicaid-State-Plan-Amendments/Downloads/FL/FL-15-012.pdf Original report did not include MI, which had a 1915(i) approved in 2013 for autism-related services. https://www.medicaid.gov/State-resource-center/Medicaid-State-Plan-Amendments/Downloads/MI/MI-12-015-Ltr.pdf ↩︎
- The Kaiser Family Foundation State Health Facts. Data Source: M. O’Malley Watts, E.L. Reaves, and M. Musumeci, Medicaid Balancing Incentive Program: A Survey of Participating States, Kaiser Commission on Medicaid and the Uninsured, June 2015; Medicaid.gov, Balancing Incentive Program. https://modern.kff.org/medicaid/state-indicator/balancing-incentive-program/ Accessed June 6, 2016. ↩︎
- As of March 2016, 2 of the 4 states planning to adopt CFC (Connecticut and Washington) had SPAs approved. The Kaiser Family Foundation State Health Facts. Data Source: Sylvia M. Burwell, Report to Congress Community First Choice: Final Report to Congress As Required by the Patient Protection and Affordable Care Act of 2010 (P.L. 111–148), U.S. Department of Health and Human Services, December 2015; Data from the Centers for Medicare and Medicaid Services and state websites compiled by KFF staff. https://modern.kff.org/medicaid/state-indicator/section-1915k-community-first-choice-state-plan-option/ Accessed June 6, 2016. ↩︎
- The ACA primary increase changes are not reflected in this data as they were required changes; physician rate increases reflected here only include changes to rates other than those required under this part of the ACA. ↩︎
- Medicaid Financing Issues: Provider Taxes (Washington, DC: Kaiser Commission on Medicaid and the Uninsured, May 2011), https://modern.kff.org/medicaid/fact-sheet/medicaid-financing-issues-provider-taxes/. ↩︎
- The seven states that reported plans at the time of the survey to use provider taxes or fees to fund all or part of the state costs for the ACA Medicaid expansion were Arizona, California, Colorado, Indiana, Kentucky, Nevada and Ohio. Plans are subject to change. ↩︎
- Medicaid Financing Issues: Provider Taxes (Washington, DC: Kaiser Commission on Medicaid and the Uninsured, May 2011), https://modern.kff.org/medicaid/fact-sheet/medicaid-financing-issues-provider-taxes/. ↩︎
- Medicaid Financing Issues: Provider Taxes (Washington, DC: Kaiser Commission on Medicaid and the Uninsured, May 2011), https://modern.kff.org/medicaid/fact-sheet/medicaid-financing-issues-provider-taxes/. ↩︎
- States and Medicaid Provider Taxes or Fees (Washington, DC: Kaiser Commission on Medicaid and the Uninsured, March 2016), https://modern.kff.org/medicaid/fact-sheet/states-and-medicaid-provider-taxes-or-fees/. ↩︎
- Some of these states have small carve-outs for certain drugs or drug classes (e.g., HIV/AIDS drugs, medications for hepatitis C, mental health drugs, etc.) ↩︎
- Laura Snyder, Robin Rudowitz, Eileen Ellis and Dennis Roberts, Medicaid Enrollment: June 2013 Data Snapshot (Washington, DC: Kaiser Commission on Medicaid and the Uninsured, January 29, 2014), https://modern.kff.org/medicaid/issue-brief/medicaid-enrollment-june-2013-data-snapshot/. ↩︎