
Medicaid Enrollment: June 2013 Data Snapshot
Aged and Disabled
Enrollment among Medicaid enrollees who are aged or living with disabilities, including disabled children and those dually-eligible for Medicare and Medicaid, has risen to nearly 14.8 million in June 2013. Less sensitive to changes in economic conditions, enrollment among the aged and disabled has risen fairly consistently over the past ten years. Nationally, enrollment for this group rose at a slower rate (1.5 percent) over the period from June 2012 to June 2013 than the prior annual period (3.1 percent.) (Figure 14)
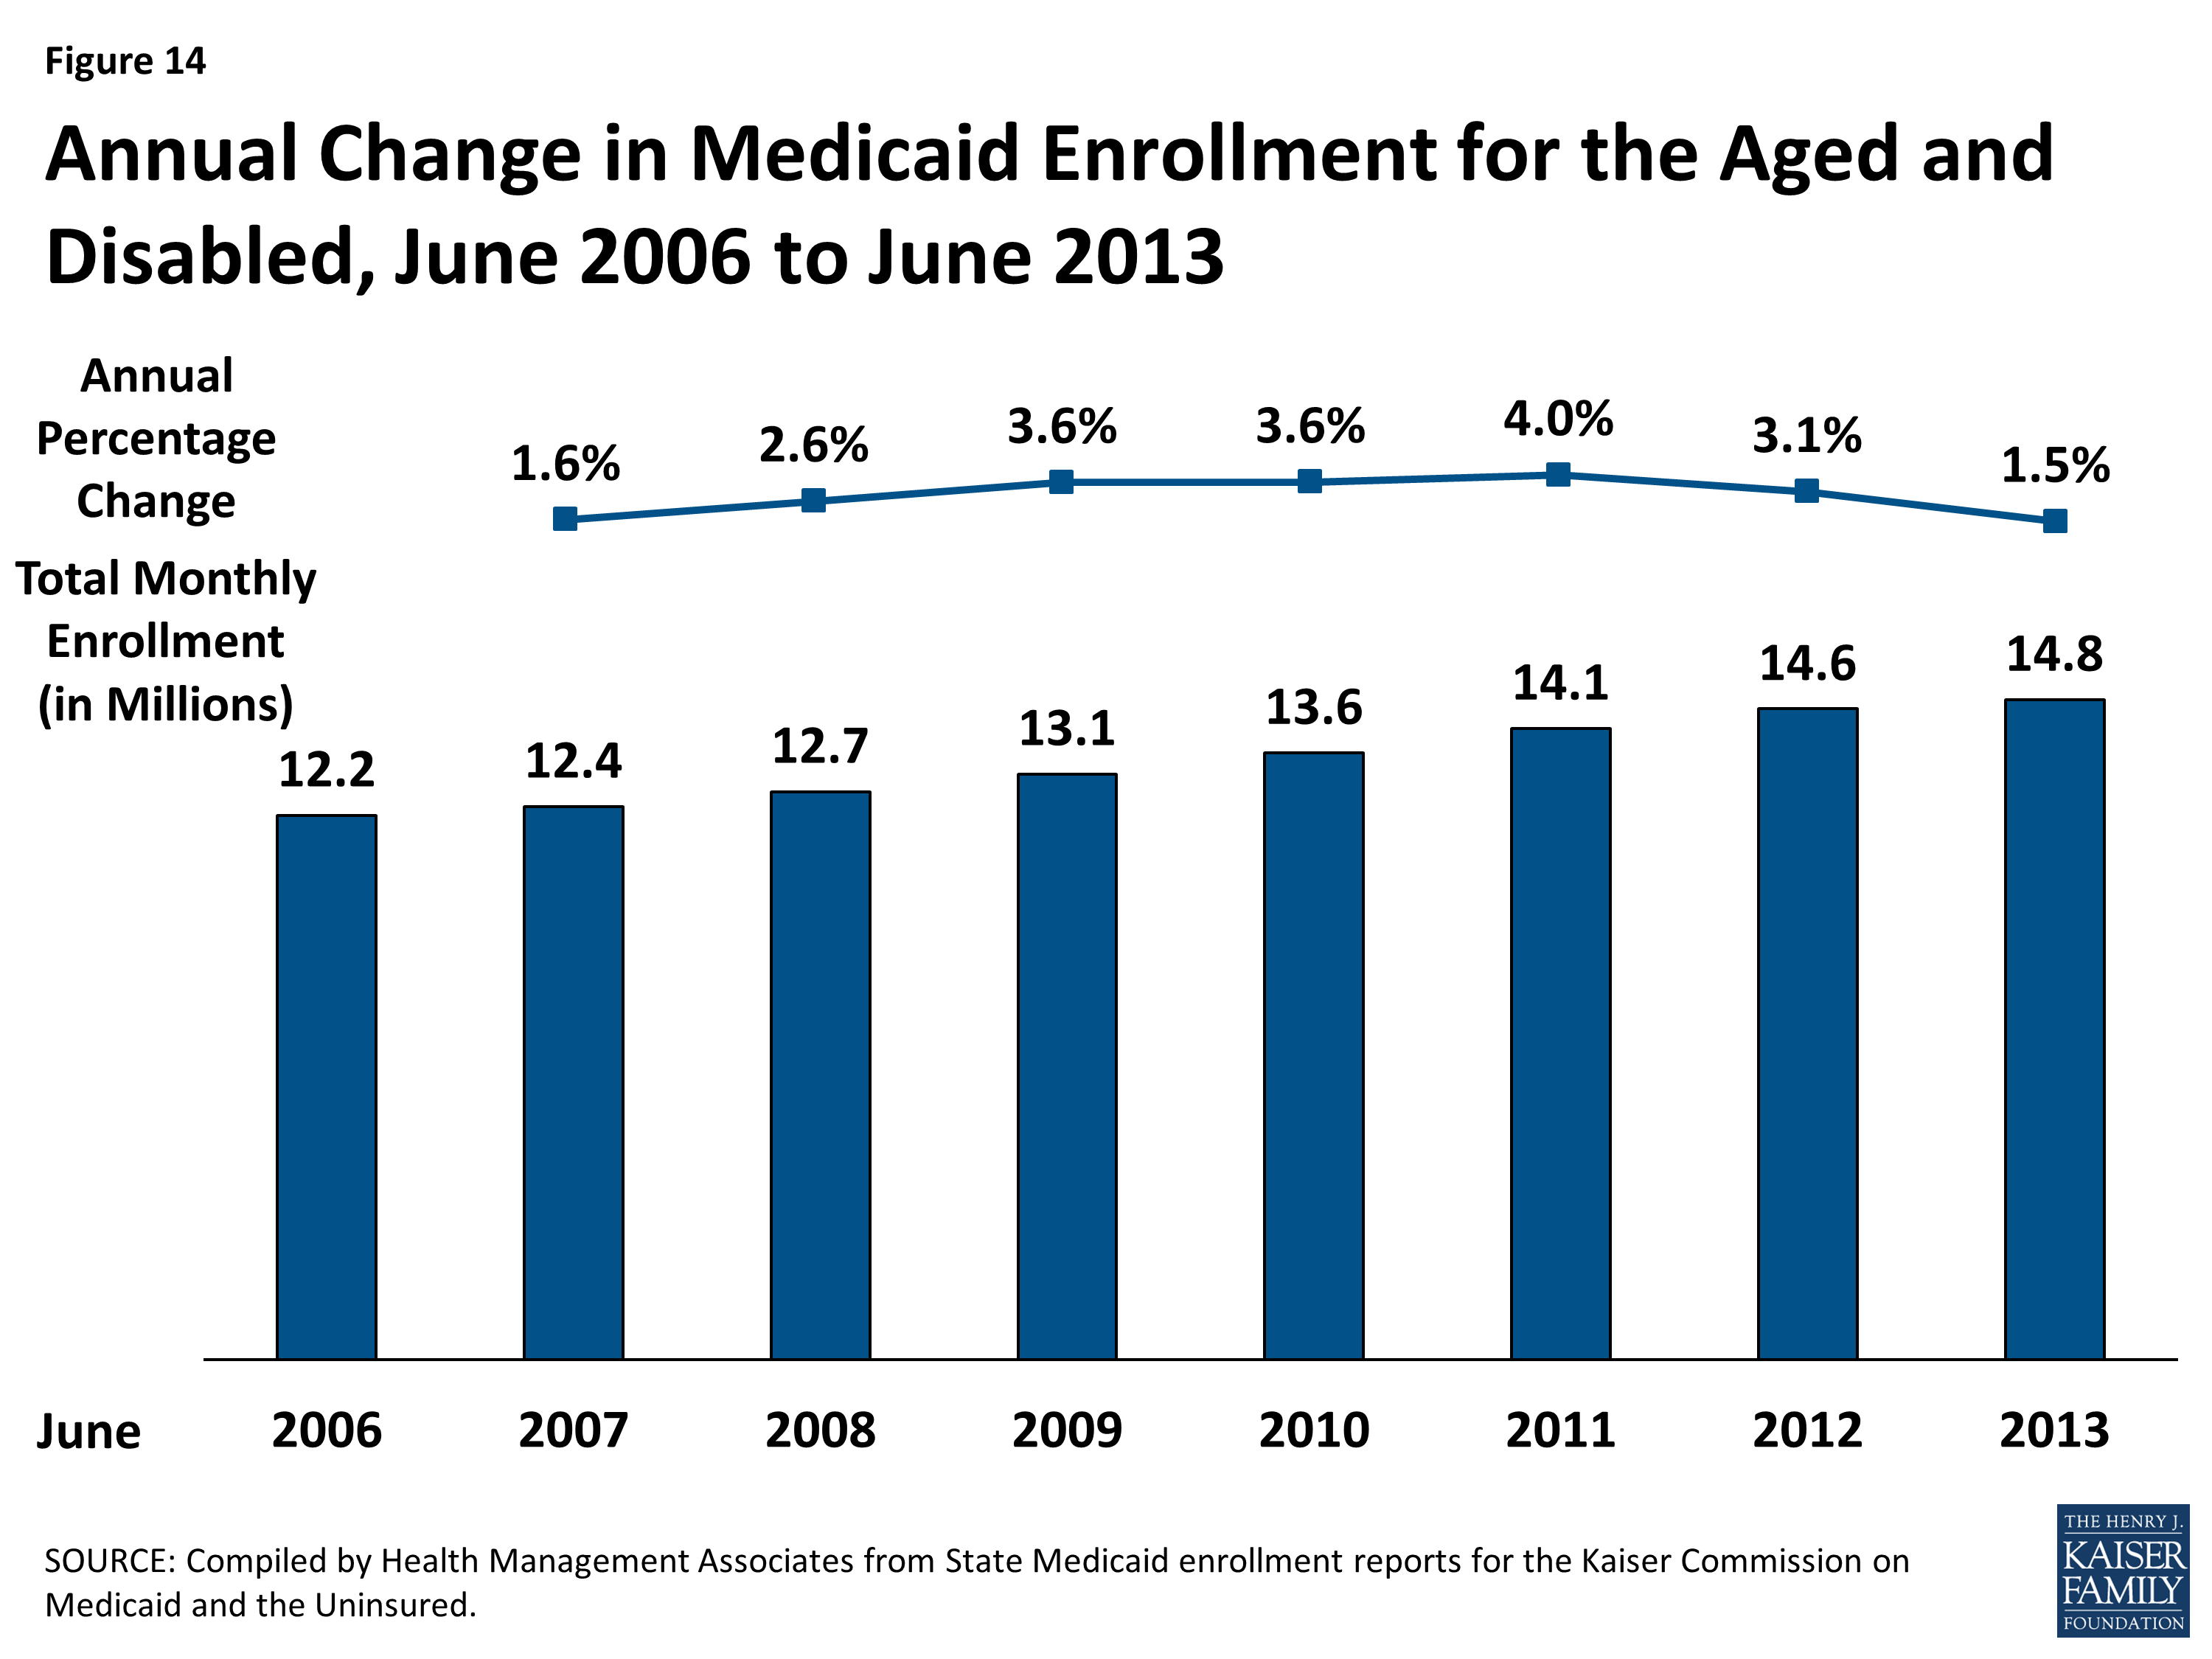
Figure 14: Annual Change in Medicaid Enrollment for the Aged and Disabled, June 2006 to June 2013
Cross State Trends. Four states (Florida, New York, Massachusetts and Texas) accounted for nearly 40 percent of the annual enrollment growth for this group. (Figure 15) Each of these states has implemented some limited changes to eligibility and enrollment policy in recent years that may partly explain these increases.
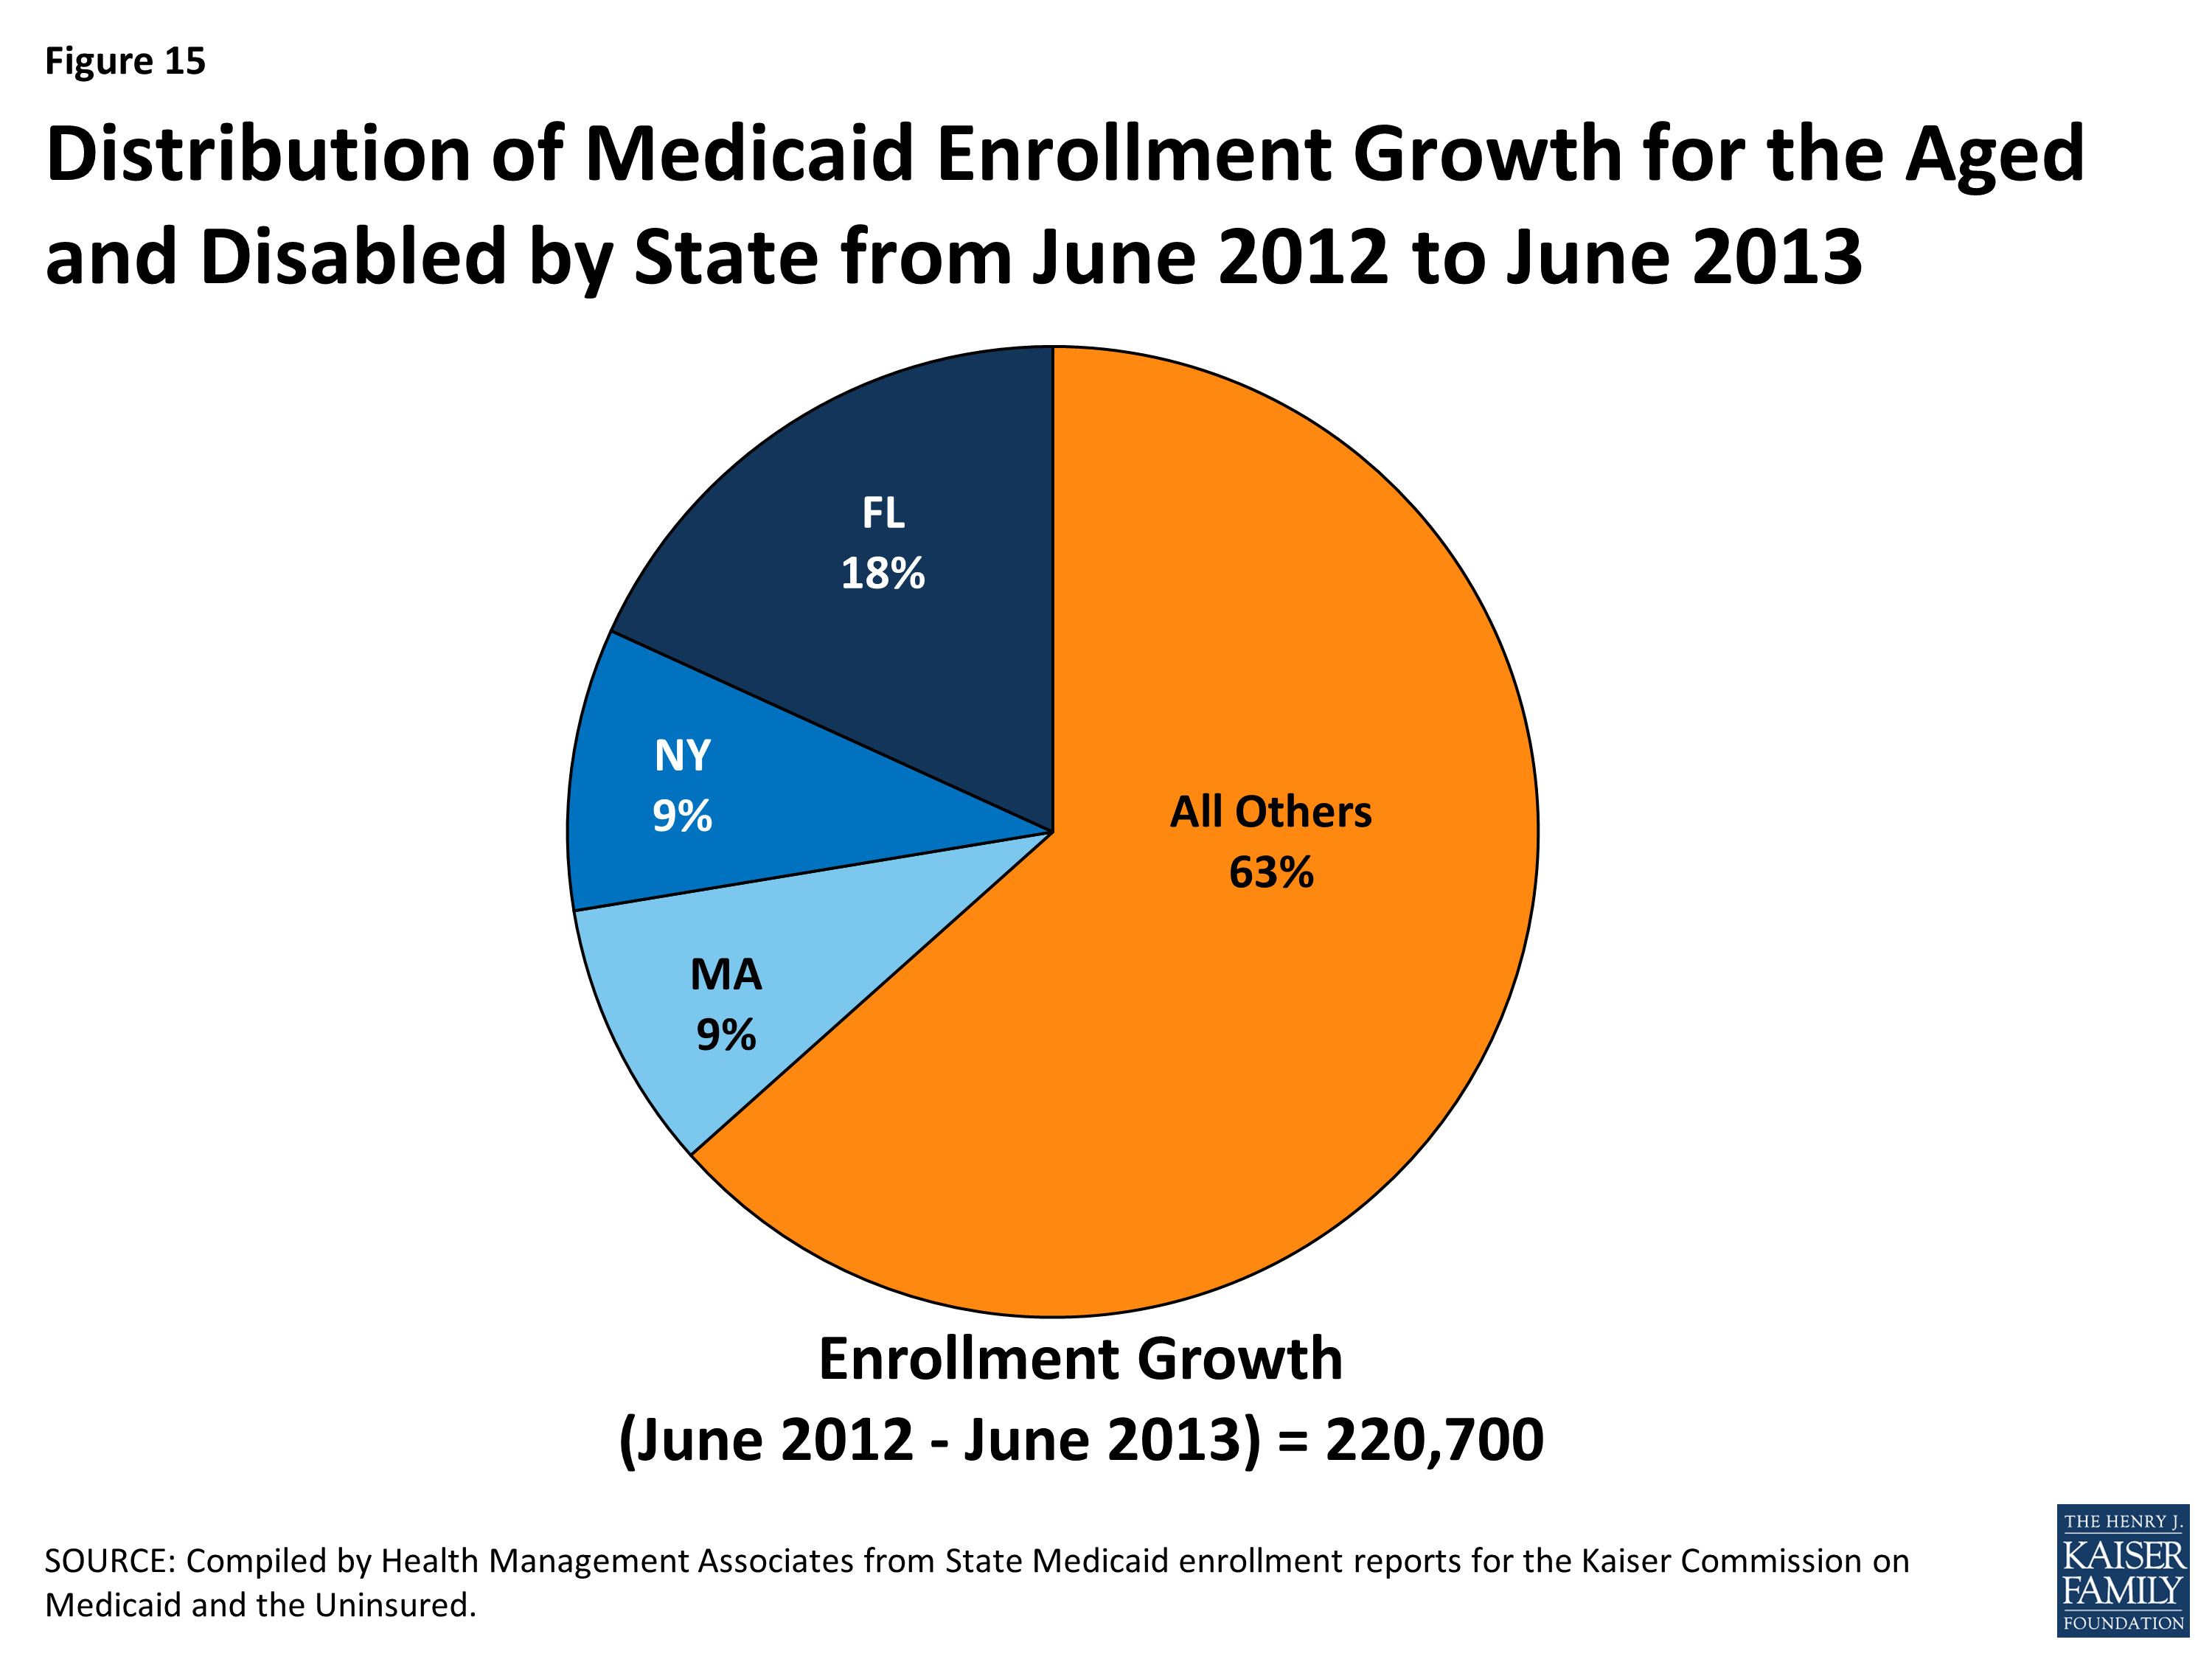
Figure 15: Distribution of Medicaid Enrollment Growth for the Aged and Disabled by State from June 2012 to June 2013
- In FY 2012, Florida instituted a policy that would waive disability interviews when sufficient information is provided on paper disability forms.1 The state also lowered the age requirement for the Assisted Living HCBS waiver in October 2012.2
- Massachusetts expanded their use of administrative renewal to include additional populations in December 2011; this included community residents whose sole source of income is Social Security.3
- New York reported automating administrative renewals for Medicare Savings Program participants with fixed incomes in FY 2012 and expanding this to other aged, blind and disabled beneficiaries receiving pensions in FY 2013.4 The state also expanded their use of self-attestation of income, resources, and residency at renewal for those receiving community-based long term care services in FY 2011.5
Enrollment for this group grew in all but six states; 41 states saw a slower rate of growth between June 2012 and June 2013 than the previous annual period. The largest decline occurred in Pennsylvania, which saw a decline of over 38,600 among this group during this period (-4.1%.) The decline appears to be concentrated among those individuals enrolled through the General Assistance group.6 In terms of percentage change, Idaho was the only state to experience double-digit enrollment growth for this group during this period (12.7%). (Figure 16) This increase was concentrated among disabled children and adults served by the state’s Total Enhanced Plan.
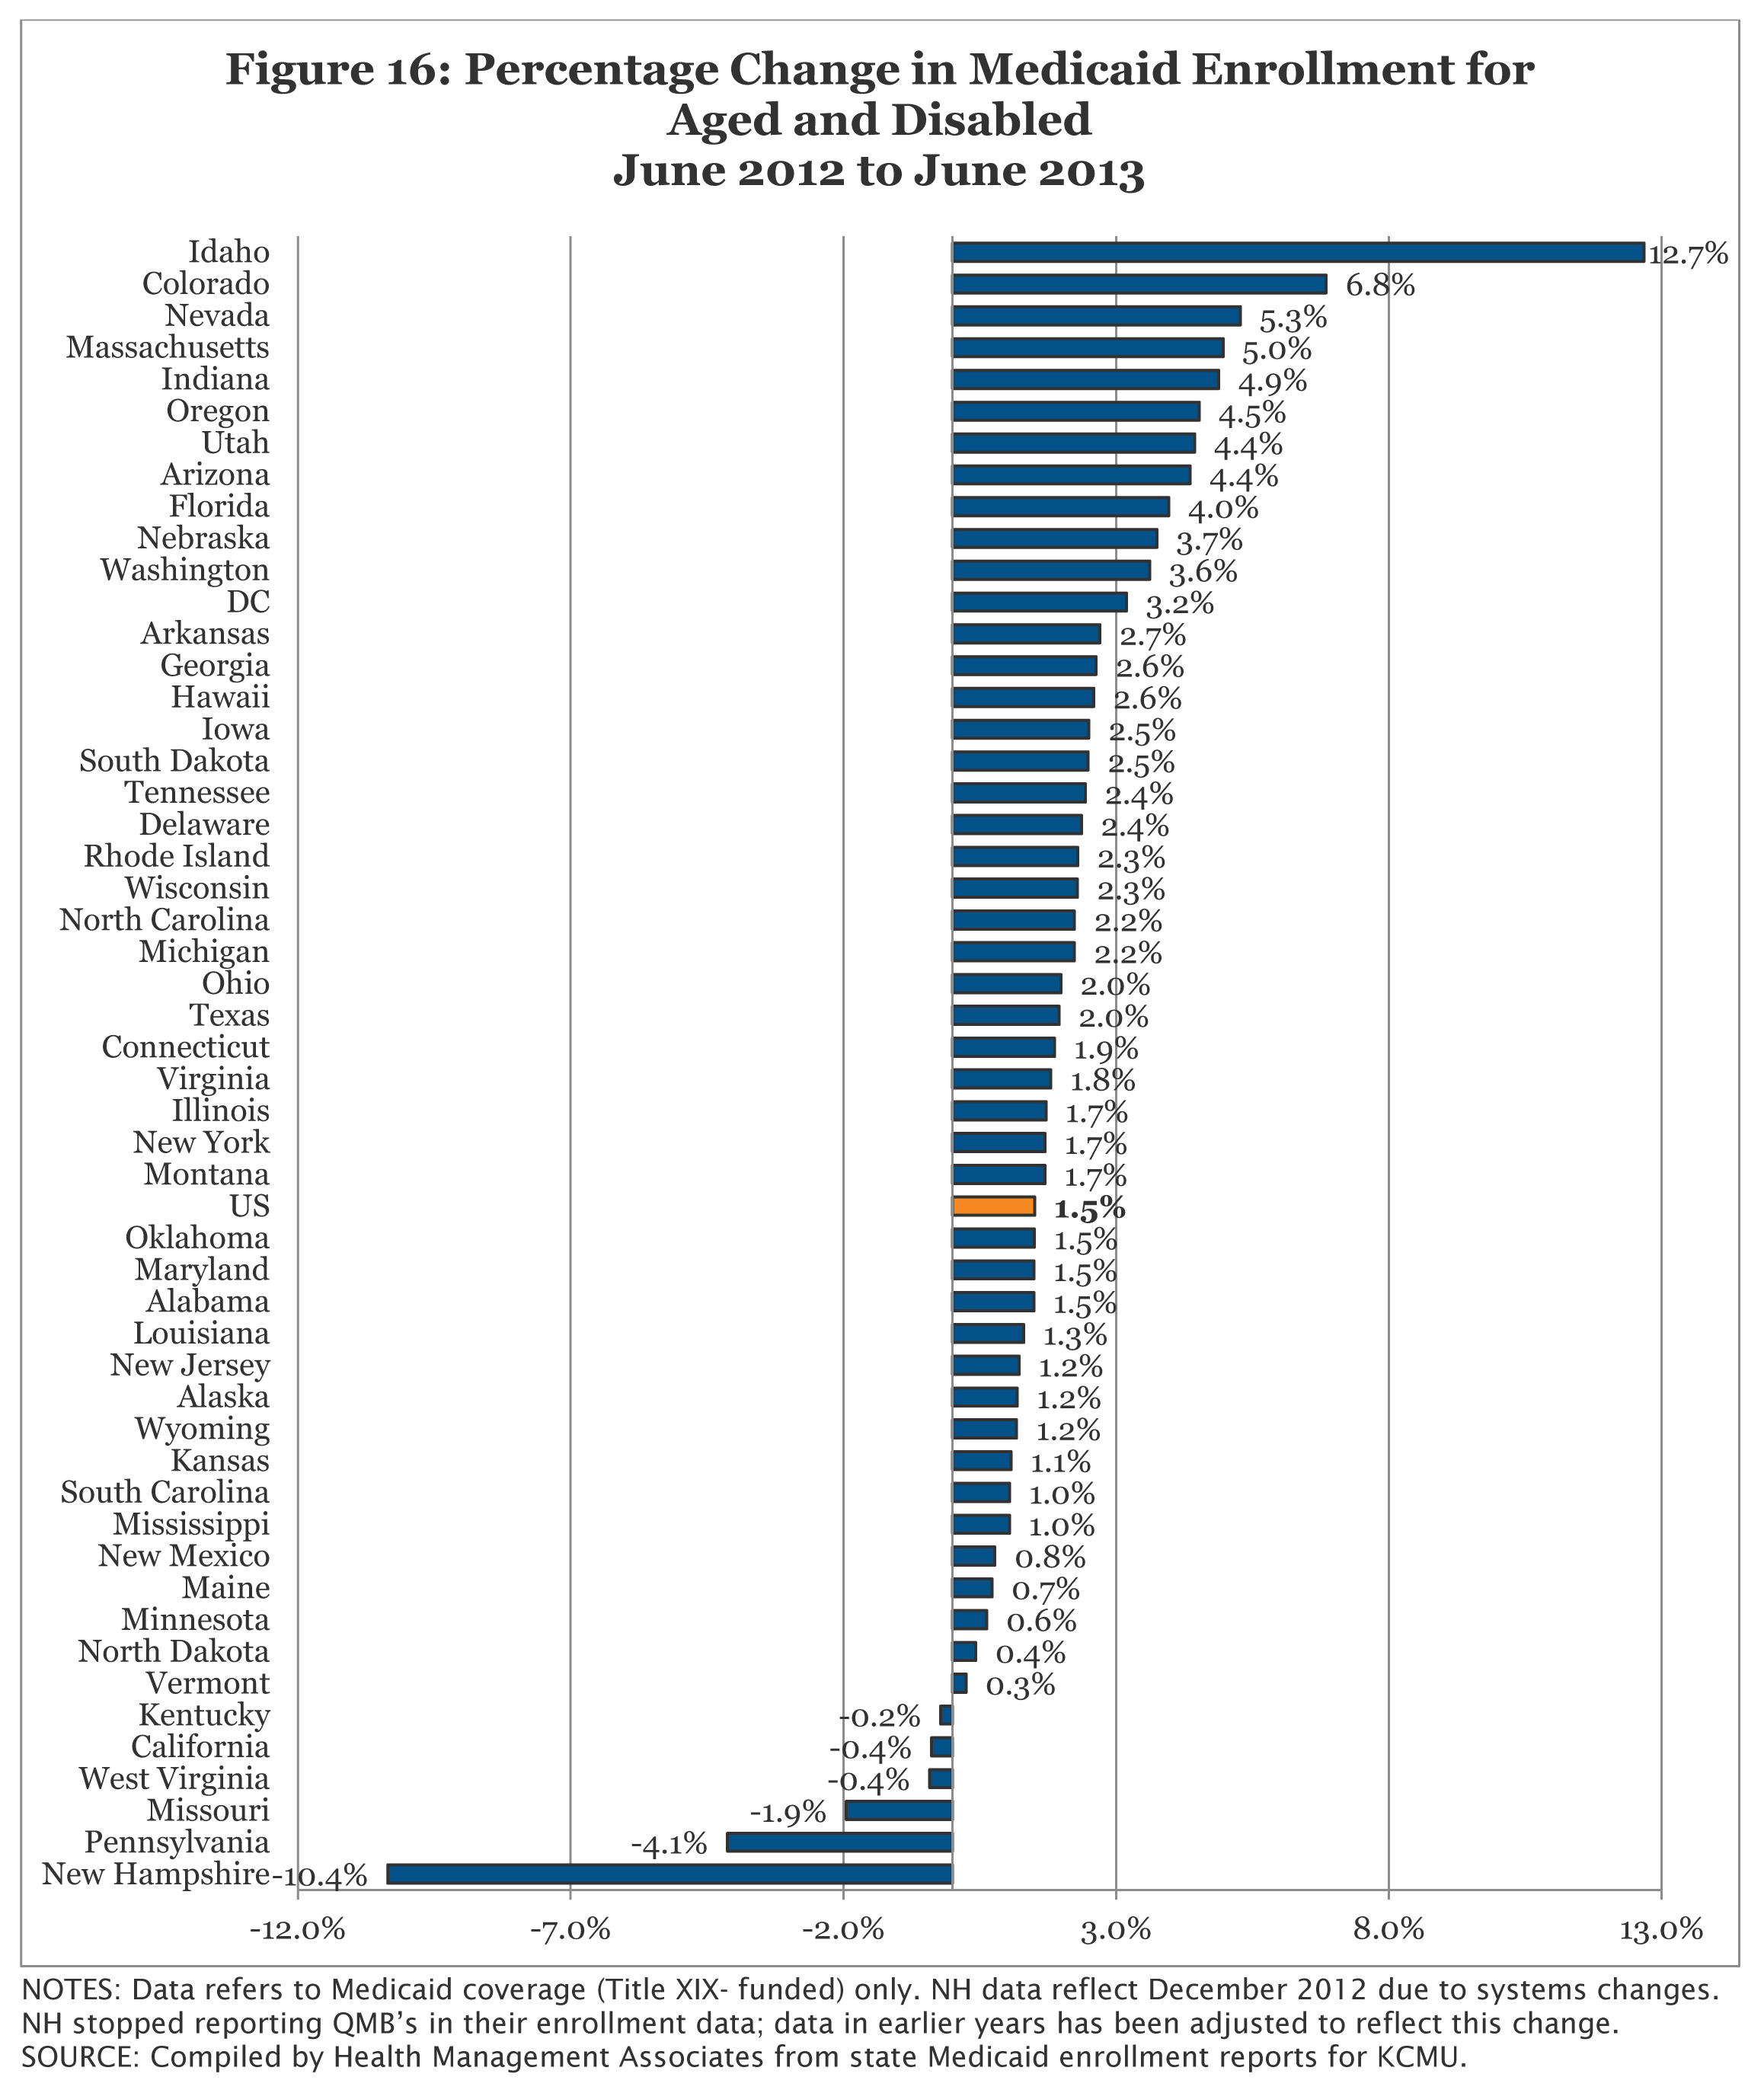
Figure 16: Percentage Change in Medicaid Enrollment for Aged and Disabled June 2012 to June 2013
Topics
Tags
