
Medicaid Enrollment: June 2013 Data Snapshot
Non-Disabled, Non-Elderly Enrollees
In June 2013, nearly 40.2 million non-disabled, non-elderly individuals were enrolled in Medicaid programs across the country. This 40.2 million, which includes over 28 million children as well as nearly 12.2 million non-elderly, non-disabled adults (i.e. parents, pregnant women and childless adults), represents over 70 percent of all Medicaid enrollment.
Enrollment growth for this group is sensitive to changes in economic conditions. As shown in Figure 7, enrollment growth slowed and even declined as the economy improved in the years leading up to the Great Recession, and then peaked again between June 2008 and June 2009 at the height of the Great Recession. Since June 2007, just before the start of the Great Recession, an additional 12.6 million people enrolled in Medicaid programs across the country, nearly 10.2 million of whom were non-disabled, non-elderly individuals. As mentioned earlier, Medicaid programs, as well as CHIP programs, aided by maintenance of eligibility (MOE) provisions maintained under the ACA have played a critical role in staving off increases in the number of non-elderly uninsured, particularly children. Between 2007 and 2012, the uninsured rate for children dropped from 10.9 percent to 9.2 percent, despite a decrease in the share of children with employer-sponsored coverage. Additionally, the uninsured rate for non-elderly individuals declined in 2011 and 2012 for the first time since the start of the Great Recession; this decline was primarily driven by increases in Medicaid coverage among adults.1

Figure 7: Annual Change in Medicaid Enrollment for Non-Disabled, Non-Elderly Enrollees , June 2006 to June 2013
In June 2013, an additional 593,500 non-disabled, non-elderly individuals were enrolled in Medicaid compared to the same month one year earlier. Enrollment growth has slowed for this group, falling to the lowest growth rate since the start of the Great Recession (1.5 percent), reflecting improvements in the economy. Enrollment growth for this population was driven by increased enrollment among adults as well as children. Nearly 60 percent of the most recent annual enrollment growth for this group was due to increased adult enrollment. (Figure 8)

Figure 8: Distribution of Annual Enrollment Growth among Non-Disabled, Non-Elderly Enrollees by Group, June 2013
Cross state trends in enrollment for non-disabled, non-elderly adults and non-disabled children are discussed separately below. Enrollment trends for adult expansions are discussed in a separate appendix (Appendix B) at the end of this report.
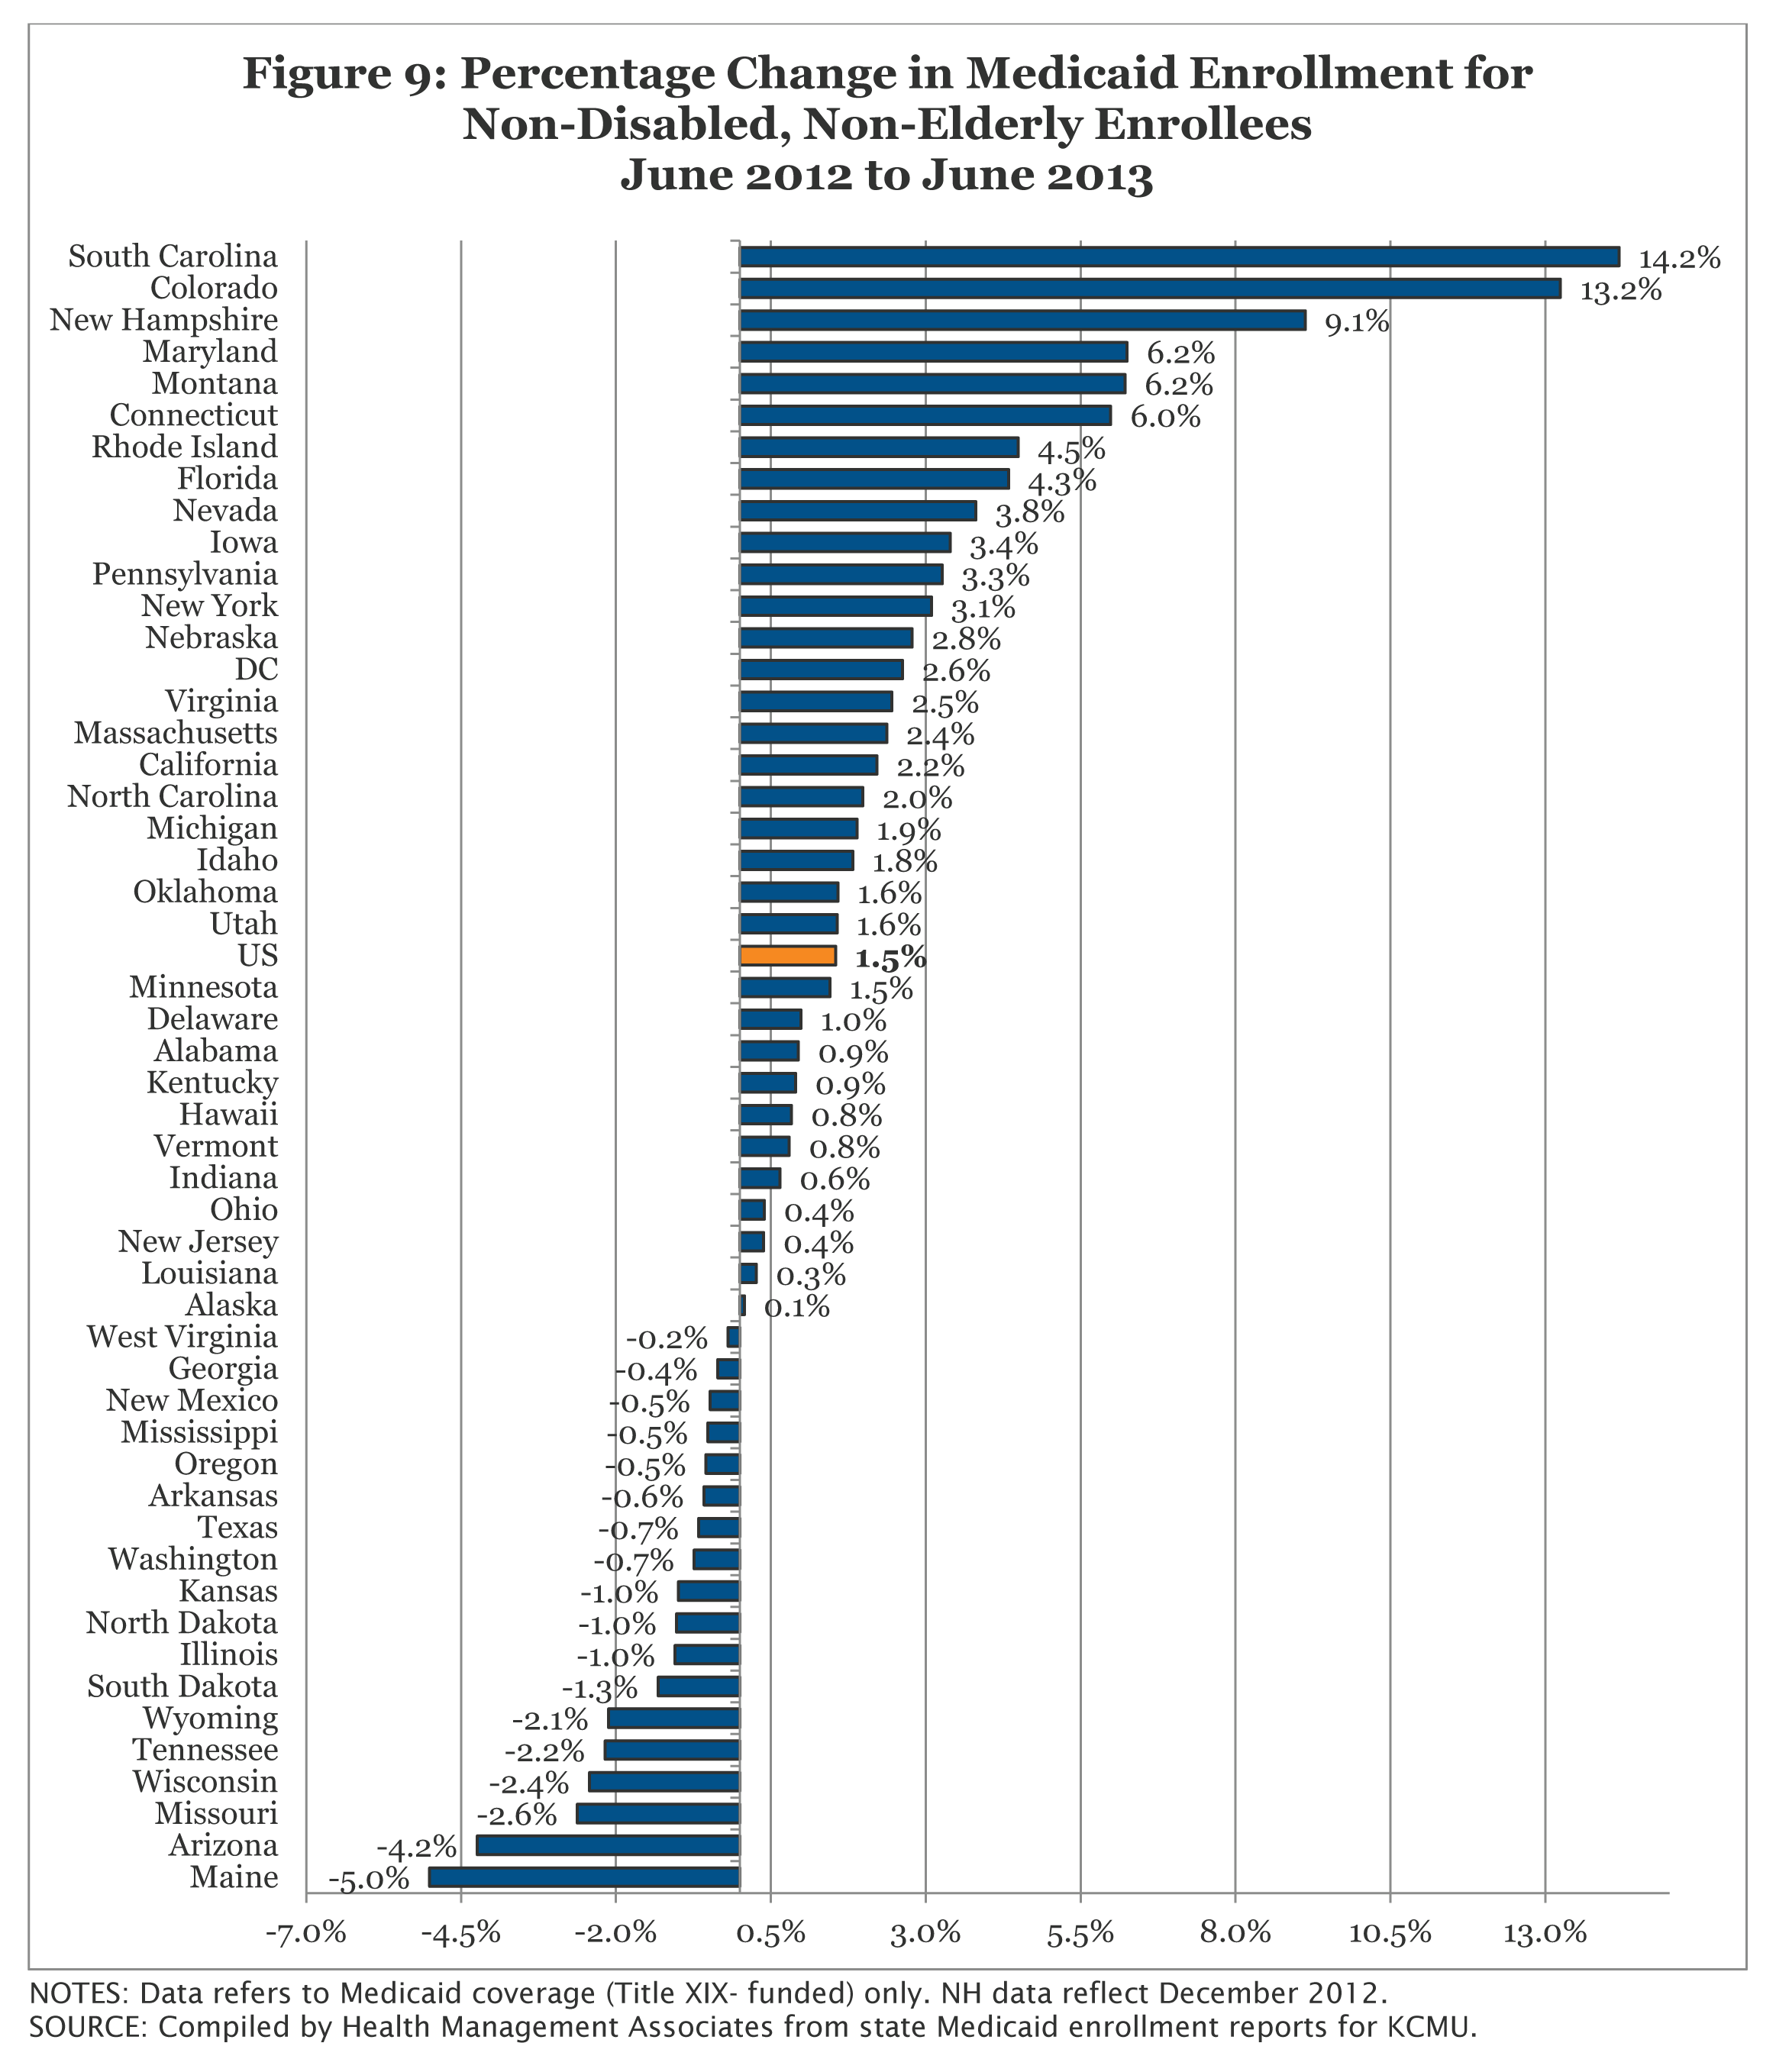
Figure 9: Percentage Change in Medicaid Enrollment for Non-Disabled, Non-Elderly Enrollees June 2012 to June 2013
Topics
Tags
