Medicaid Enrollment: June 2013 Data Snapshot
Total Enrollment
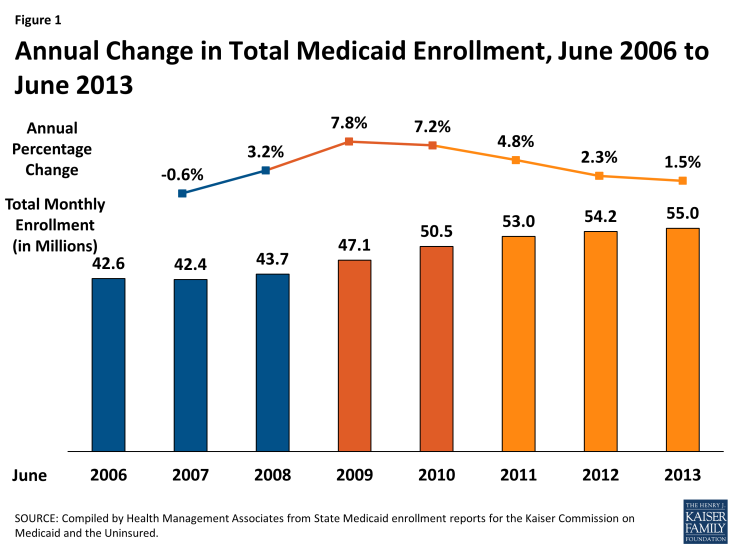
In June 2013, six months ahead of the implementation of major coverage expansions and new enrollment standards as part of the Affordable Care Act (ACA), 55 million individuals were enrolled in Medicaid. Nearly three-quarters were non-disabled, non-elderly individuals. Compared to one year earlier, enrollment grew by 814,200 or 1.5 percent – the slowest rate since the start of the Great Recession. At the height of the recessionary period1, enrollment growth rates peaked at 7.8 and 7.2 percent in 2008-2009 and 2009-2010, adding 3.4 million in each period. (Figure 1)
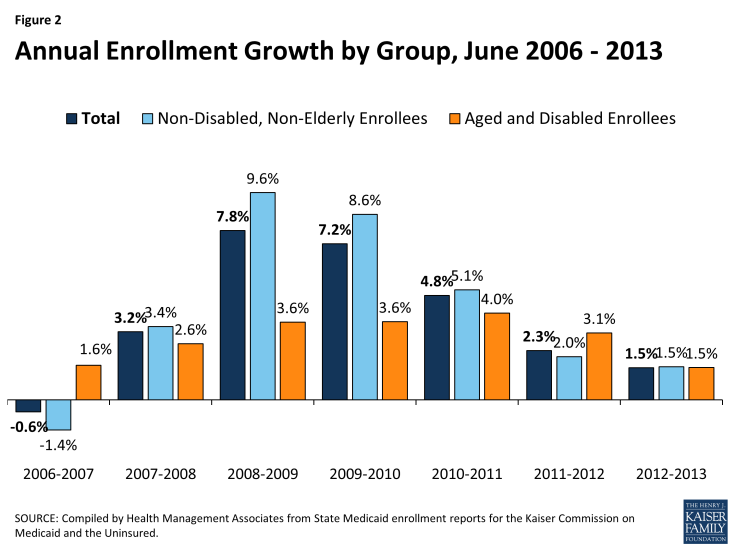
Changes in enrollment are driven by both economic conditions as well as policy. During the economic downturn, as unemployment rates climbed and incomes fell, more people became eligible for and enrolled in Medicaid. This increased demand, combined with the maintenance of eligibility (MOE) provisions that helped preserve coverage (which were first enacted as part of the American Recovery and Reinvestment Act and then maintained under the ACA) led to substantial annual growth, particularly among non-disabled, non-elderly groups which include children. Increased Medicaid coverage played a critical role in staving off increases in the number of nonelderly uninsured, particularly children.2
As the economy started to improve, Medicaid enrollment growth started to slow, particularly for non-disabled, non-elderly enrollees. (Figure 2)
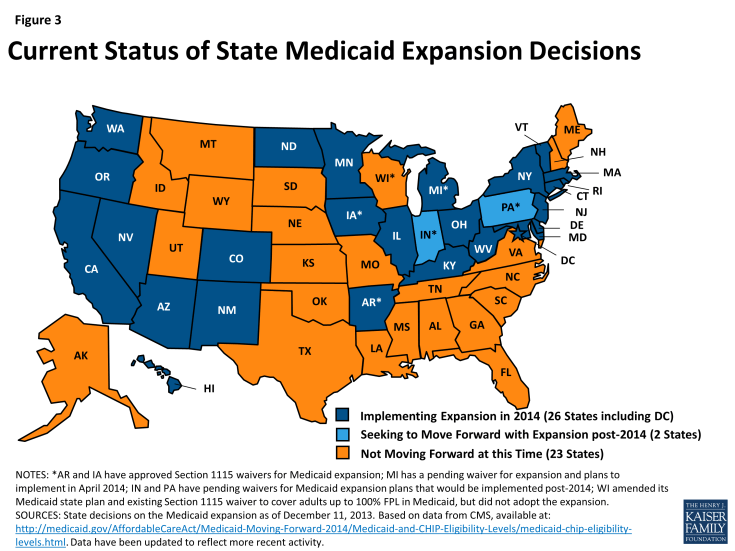
While enrollment growth rates have been generally trending downward as economic conditions continue to slowly improve, some recent enrollment growth is attributable to policy actions including ACA provisions implemented in advance of January 2014, such as expansions of adult coverage in California. However, beginning in January 2014, the ACA is anticipated to lead to significant increases in Medicaid enrollment as a result of new streamlined Medicaid eligibility and enrollment policies and a single application for Medicaid, CHIP, and subsidized Marketplace coverage that are required across all states as well as an expansion in Medicaid eligibility to nearly all adults with incomes below 139% of the federal poverty level for states that are implementing the ACA Medicaid expansion. 3 While this expansion was intended to occur nationwide, the Supreme Court ruling on the ACA effectively made it a state option, and 26 states are implementing the expansion in 2014. (Figure 3)
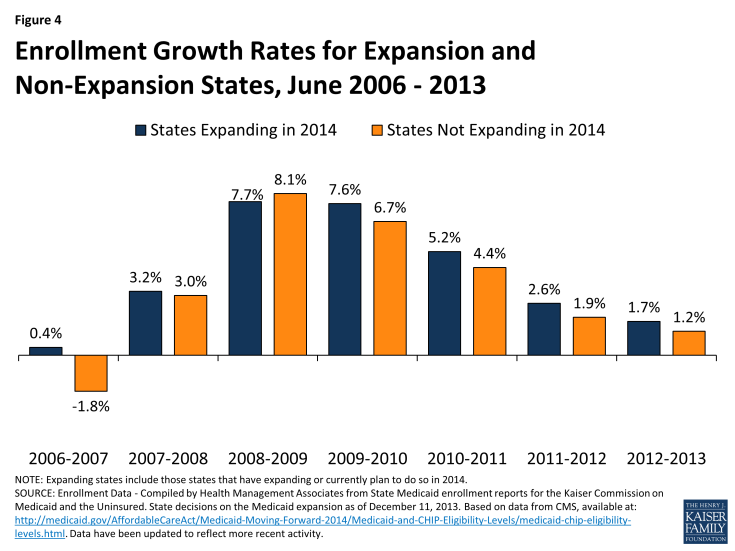
Going forward, states that implement the expansion are expected to experience higher Medicaid enrollment growth compared to states that have not expanded at this time. However, from June 2012 to June 2013 enrollment growth rates across the program are similar in expanding states (1.7 percent) and not-expanding states (1.2 percent.) Looking back over several years, those states expanding in 2014 have generally had slightly higher growth rates than states not planning to expand, though the growth rates were quite similar. (Figure 4)
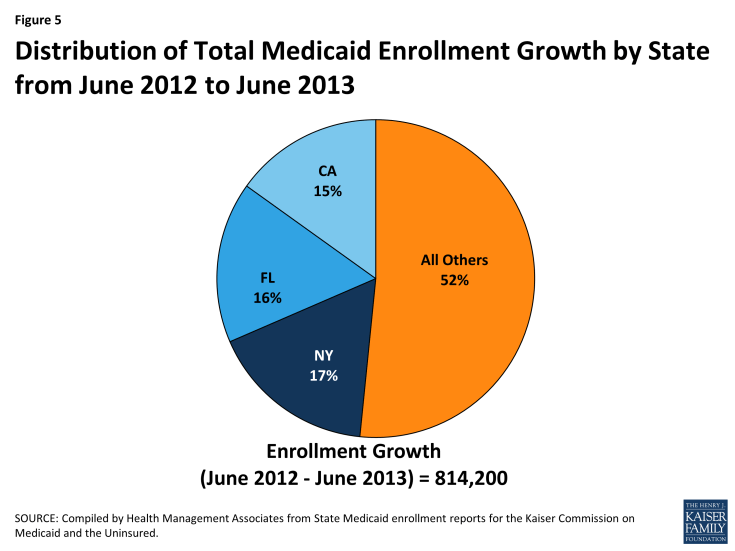
Cross State Trends. Across the country, enrollment in Medicaid reached 55 million as an additional 814,200 individuals enrolled in coverage between June 2012 and June 2013. Almost half of this enrollment growth was accounted for in three states (New York, Florida, and California). (Figure 5) Florida and New York saw enrollment growth across many parts of their programs. On the other hand, enrollment growth in California was driven by growth in its Low Income Health Program (LIHP), a county-based adult Medicaid expansion, discussed in more detail in a later section.
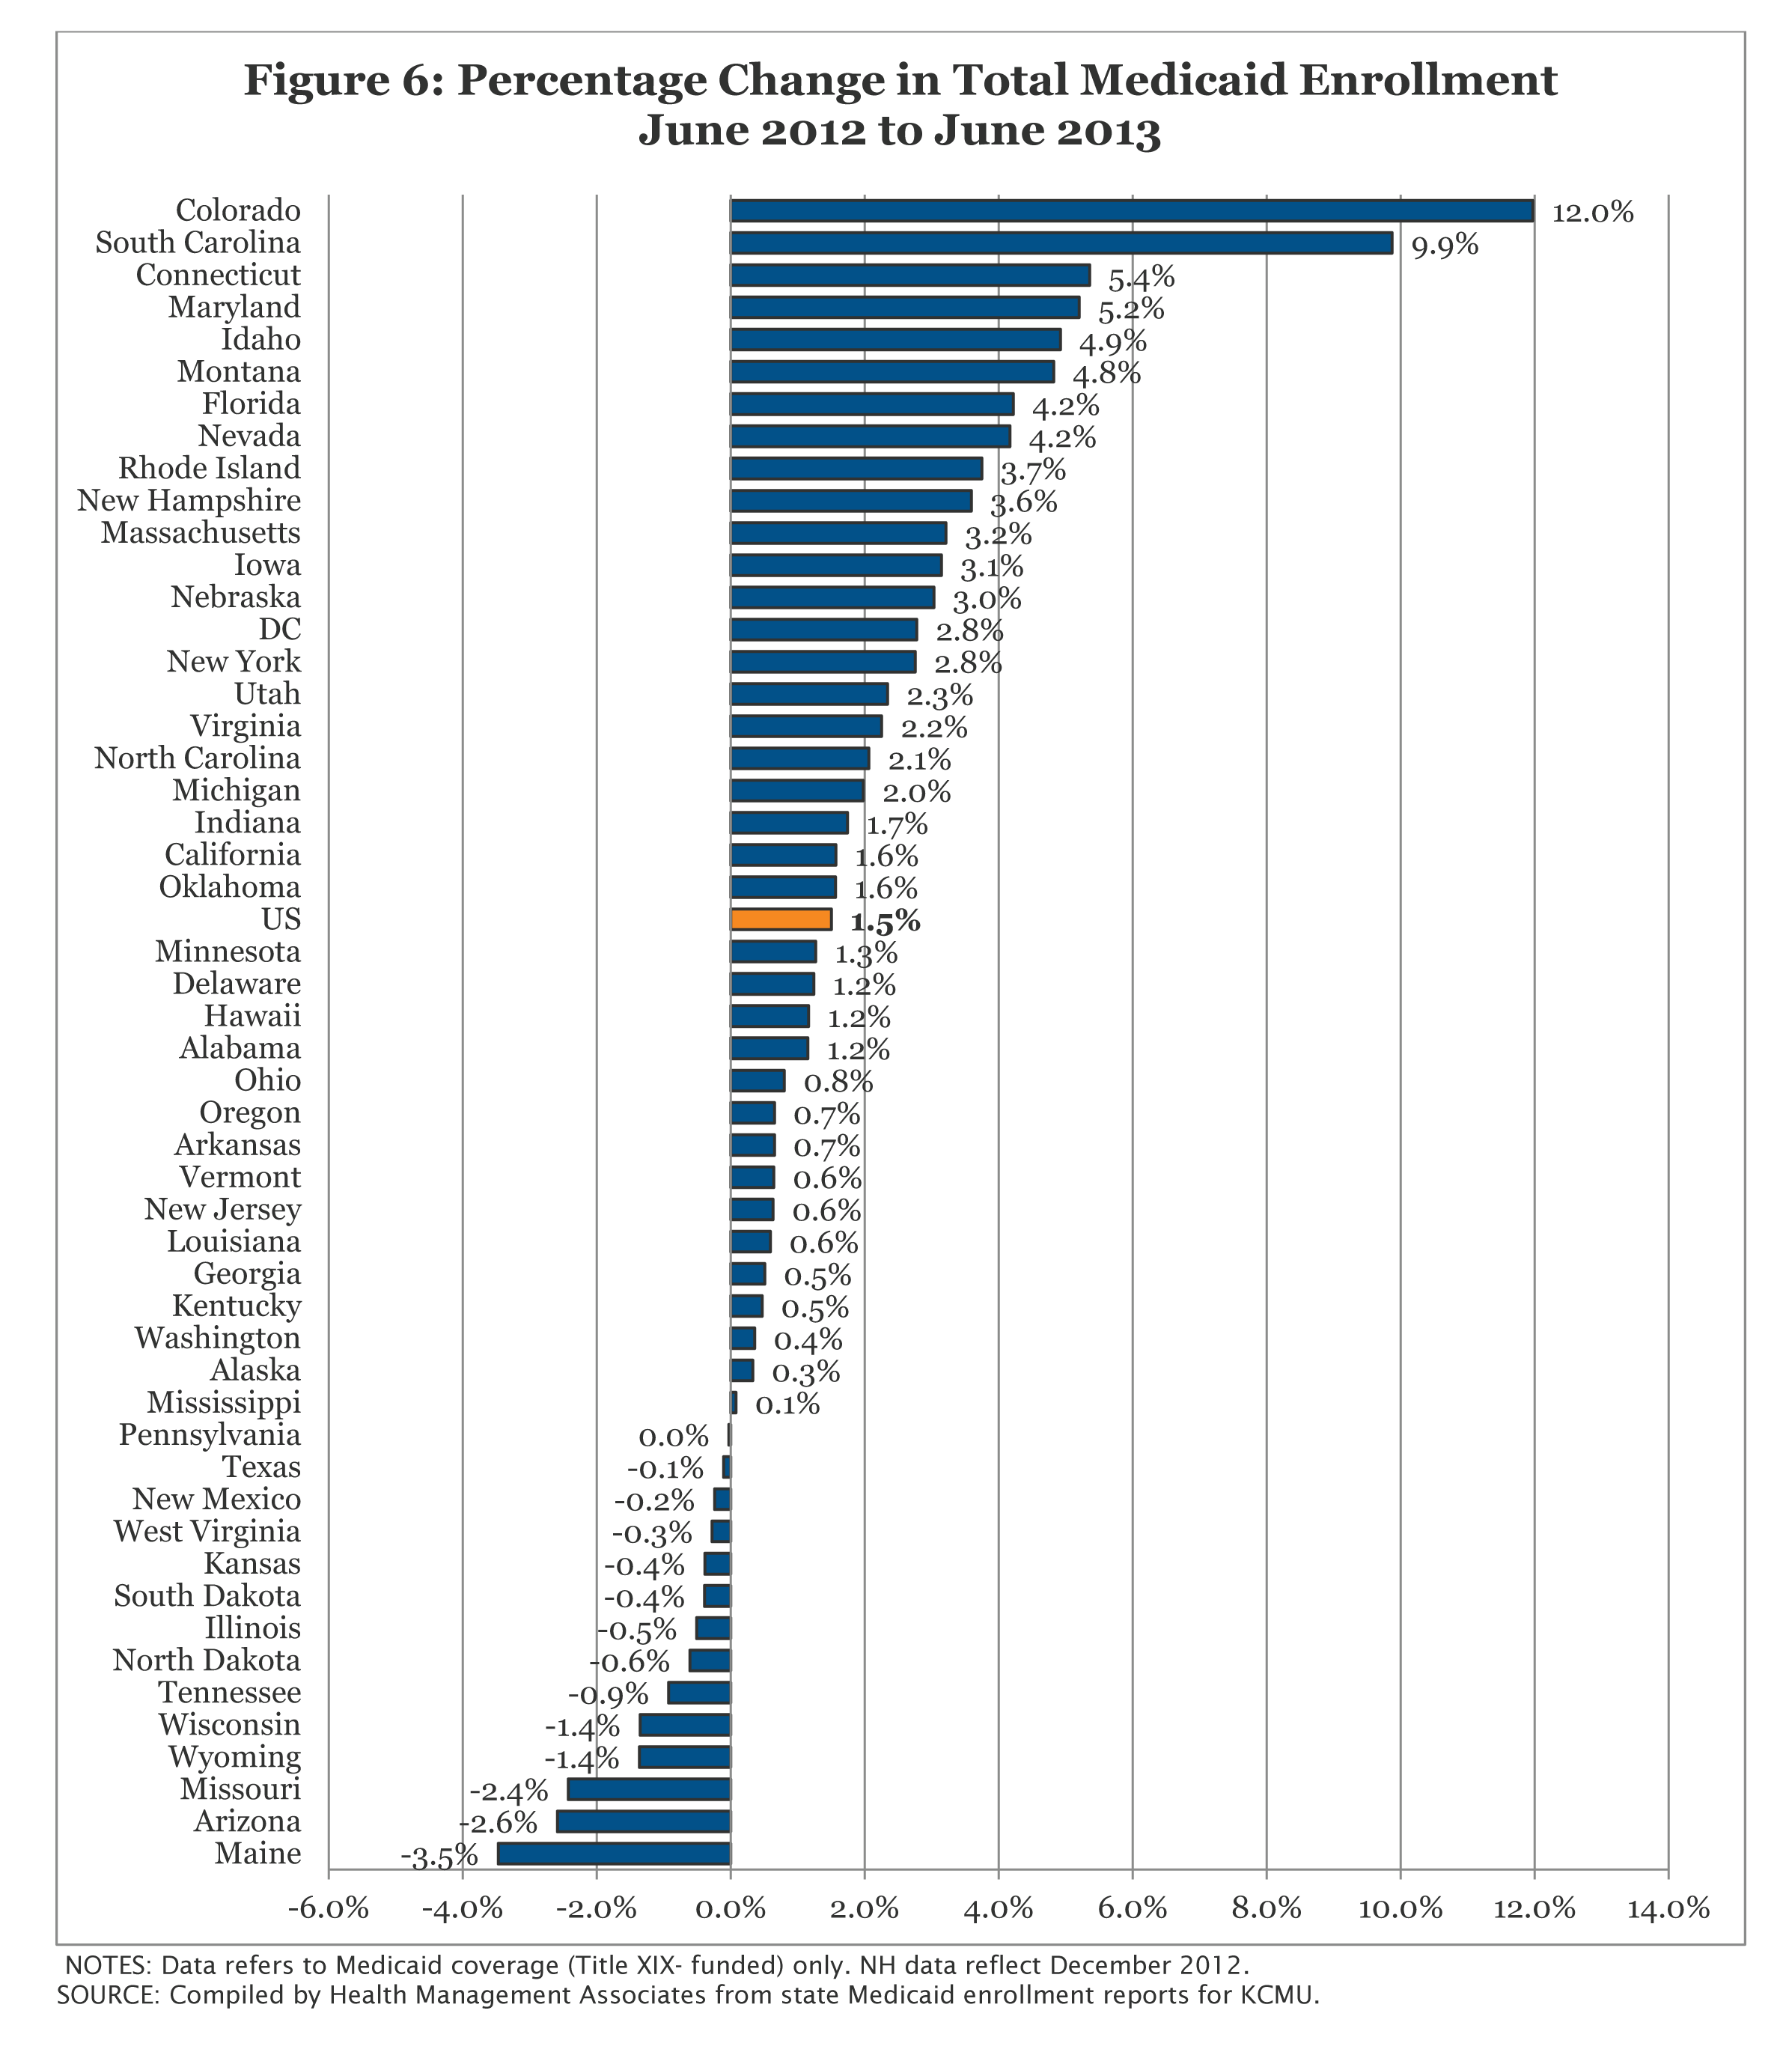
In contrast, declines in enrollment between June 2012 and June 2013 occurred in 13 states. (Figure 6) Three of these states with some of the larger declines during this period (Arizona, Maine and Wisconsin) have recently implemented eligibility restrictions for non-disabled, non-elderly adults that were exempted from the MOE provisions; these restrictions are also discussed in further detail in a later section.
In terms of percentage change from one year to the next, enrollment grew at a slower pace than in the prior annual period in 34 states. Colorado and South Carolina were the only states that experienced double digit growth; both of these states have implemented a number of policy changes and eligibility expansions recently that are discussed in later sections.


