Assessing Global HIV Targets in PEPFAR Countries: A Dashboard
Issue Brief
Significant progress has been made in controlling the HIV/AIDS epidemic globally, but there are still 1.7 million new infections each year and 38 million people living with the disease.1 In the absence of a vaccine or cure for HIV, the global community – including PEPFAR, the U.S. government’s global HIV/AIDS effort and the largest commitment by any nation to address a single disease in the world – has sought to identify targets towards ending the epidemic as a public health threat by bringing new infections and deaths down to very low levels, or even zero, using current, evidence-based interventions. These include the global “90-90-90” targets for the end of 2020, set by UNAIDS and agreed to by all U.N. member nations in 2014 (90% of people living with HIV know their status, 90% of people who know their status are accessing treatment, and 90% of people on treatment have suppressed viral loads), and ultimately reaching 95-95-95 by 2030.2 PEPFAR, in turn, set an additional goal in its 2017-2020 strategy of achieving epidemic control of the HIV/AIDS epidemic primarily in 13 high-burden countries by the end of 2020, as a key step toward reaching global targets. PEPFAR defines “epidemic control” as the point at which the total number of new HIV infections falls below the total number of deaths from all causes among HIV-infected individuals.3 UNAIDS also has identified two other measures of epidemic control — the number of new HIV infections per 1,000 population and the ratio of the number of new HIV infections to the number of people living with HIV (see Box: Description of Targets).4
To assess where PEPFAR countries are on achieving these goals, we looked at the latest available data by country and created a dashboard to help monitor progress. We focused on the 46 countries required to develop a PEPFAR Country or Regional Operational Plan (COP/ROP) in FY 2019, highlighting the 13 high-burden countries targeted by PEPFAR’s strategy.5 Key findings include:
- Looking across the 46 PEPFAR countries and all six targets included in this analysis, the majority of countries (40) has met at least one target, 17 countries have met at least half of the targets, and 1 country has met five targets. No country has met all targets and six have not met any target (see Table 1).
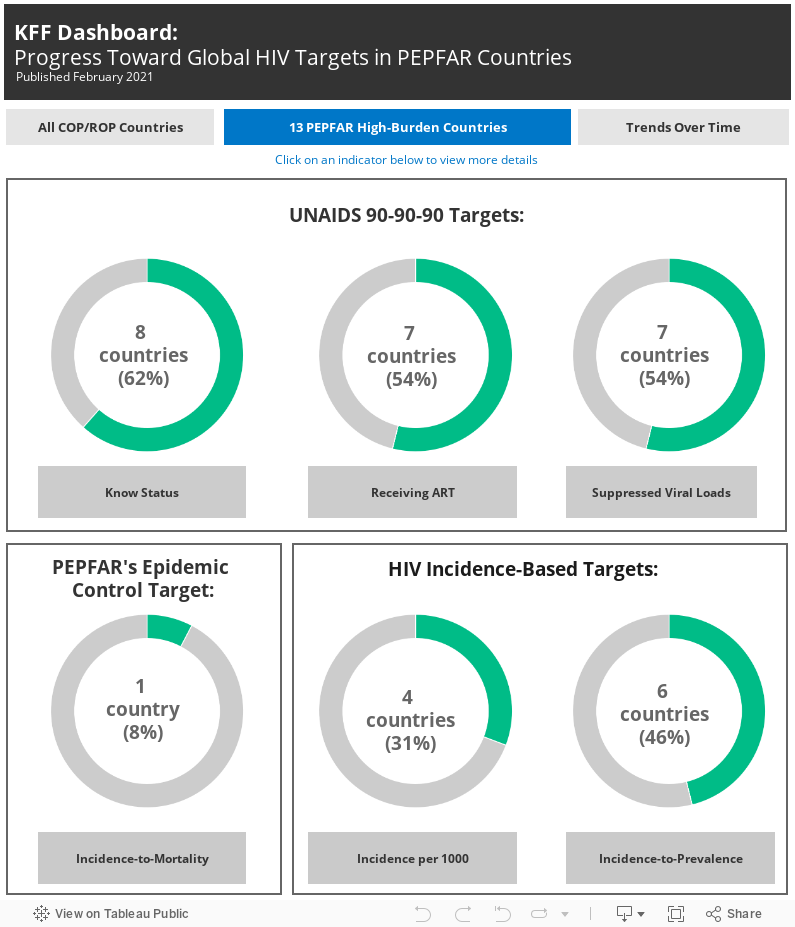
- Five PEPFAR countries have met all three 90-90-90 targets; 11 met the UNAIDS 90-90-90 status target, 9 met the treatment target, and 9 met the viral load suppression target.
- 13 met PEPFAR’s epidemic control metric, including one of the 13 PEPFAR high-burden countries (Cote d’Ivoire).
- 31 countries met the incidence per 1,000 target, including four of the 13 high burden PEPFAR countries (Cote d’Ivoire, Haiti, Kenya, and Rwanda).
- 16 countries met the incidence-to-prevalence target, including six of the 13 PEPFAR high burden countries (Botswana, Cote d’Ivoire, Eswatini, Kenya, Rwanda, and Zimbabwe).
- We also looked at trends over time for the 13 PEPFAR high burden countries from 2014 (the year the 90-90-90 targets were agreed upon) to 2019 (the most recent year for which data are available). Across all 6 targets, almost all countries have shown improvement.
Arguably, these targets are hard to meet, particularly since global funding for HIV in low- and middle-income countries has been largely flat and declined between 2017 and 2019.6 According to UNAIDS, only five countries around the world have met the three 90-90-90 targets, all of which are PEPFAR countries, and no country has met all six targets. Indeed, while trends are improving in PEPFAR countries and the program is estimated to have saved 20 million lives to date and its efforts have helped to change the course of the epidemic in low- and middle-income countries, only a limited number of PEPFAR countries is on target to meet global HIV milestones. PEPFAR may be the largest donor government program in many countries, but it does not work in isolation and numerous actors contribute to the HIV/AIDS response in countries, including local governments. However, these targets have important implications for PEPFAR, as it considers its next strategy, which is expected to be released in 2021, and its future directions. Further, these countries’ trajectories pre-date the COVID-19 pandemic and it remains to be seen how deeply the pandemic will impact HIV/AIDS progress and PEPFAR’s efforts in the years to come.
Box: Description of Targets
UNAIDS “90-90-90” TARGETS7
The UNAIDS “90-90-90” targets were established at the end of 2014 and are set to expire this year.8 These goals were intended to put the world on track to ending the AIDS epidemic by 2030.9 Globally, the 2020 targets will not be met and it remains to be seen how the COVID-19 pandemic will impact progress to date.10 Based on 2019 data, a limited number of PEPFAR countries were on target to meet the three “90-90-90” milestones by the end of 2020. Additionally, there is a wide variation of progress among PEPFAR countries and within regions. UNAIDS recently released new targets for 2025 in an effort to get the world back on track to ending AIDS by 2030.11
PEPFAR’S EPIDEMIC CONTROL TARGET
HIV Incidence-to-Mortality Ratio:
The HIV incidence-to-mortality ratio (IMR) is the ratio of the number of new HIV infections to the number of people infected with HIV who die (from any cause). PEPFAR’s definition of epidemic control is when “the total number of new HIV infections fall below the total number of deaths from all causes among HIV-infected individuals.” When the incidence-to-mortality ratio is greater than one, or when there are more new infections than deaths, the size of the population of people living with HIV grows; when it is less than one, the size of the population shrinks.12 It is important to note that using the incidence-to-mortality ratio by itself may not paint a complete picture, since having an incidence-to-mortality ratio below one is possible with high levels of mortality. Consequently, PEPFAR has noted that decreases in the incidence-to-mortality ratio must also occur within the context of treatment coverage that is greater than 70%.13
HIV INCIDENCE-BASED TARGETS
Progress on HIV/AIDS may also be measured using epidemic transition metrics, including HIV incidence per 1,000 population and HIV incidence-to-prevalence ratio. PEPFAR’s strategy to achieve epidemic control aligns with meeting these global targets.
HIV Incidence Per 1,000 Population:
HIV incidence is the number of new HIV infections per 1,000 population and is one of the indicators PEPFAR monitors to understand countries’ progress toward epidemic control.14 The global HIV incidence target is <1%.15
HIV Incidence-to-Prevalence Ratio:
The HIV incidence-to-prevalence ratio (IPR) uses the number of new HIV infections (incidence) and the number of people living with HIV (prevalence) within a population to measure the average duration of time a person lives with the disease. The benchmark for epidemic control is an incidence-to-prevalence ratio of 3% (3 HIV infections per 100 people living with HIV per year). When the number of new infections is less than 3%, the epidemic is recognized as being in a “state of control” and the total population of people who live with HIV will eventually decline.16
| A Note about the Dashboard: To use the dashboard, click on any indicator to see country-level data. Click on Trends Over Time to see the progress countries have made in recent years. KFF will continue to track PEPFAR country progress on these indicators and update the dashboard as new data become available.Click here to view the most recent version of dashboard. |
Interactive
A Note about the Dashboard: To use the dashboard, click on any indicator to see country-level data. Click on Trends Over Time to see the progress countries have made in recent years. KFF will continue to track PEPFAR country progress on these indicators and update the dashboard as new data become available. Click here to view the most recent version of dashboard.
| Table 1: PEPFAR Countries Preparing COPS/ROPS That Have Met Global Targets | |||||||
| Country | 13 PEPFAR High-Burden Country | 90-90-90 Treatment Cascade | HIV Incidence-to-Mortality Ratio | HIV Incidence per 1000 Population | HIV Incidence-to-Prevalence Ratio | ||
| % People living with HIV who know their status | % People living with HIV receiving ART | % People living with HIV who have suppressed viral loads | |||||
| Global Target | – | 90 | 81 | 73 | <1 | <1 | <3 |
| Angola | – | – | – | – | – | X | – |
| Barbados | – | X | – | – | X | X | X |
| Botswana | X | X | X | X | – | – | X |
| Burkina Faso | – | – | – | – | X | X | X |
| Burma | – | – | – | – | – | X | – |
| Burundi | – | – | X | – | X | X | X |
| Cambodia | – | – | X | X | X | X | X |
| Cameroon | – | – | – | – | X | X | – |
| Côte d’Ivoire | X | – | – | – | X | X | X |
| Democratic Republic of the Congo | – | – | – | – | – | X | – |
| Dominican Republic | – | – | – | – | – | X | – |
| Eswatini | X | X | X | X | – | – | X |
| Ethiopia | – | – | – | – | X | X | X |
| Ghana | – | – | – | – | – | X | – |
| Guyana | – | X | – | – | – | X | – |
| Haiti | X | – | – | – | – | X | – |
| India | – | – | – | – | – | – | – |
| Indonesia | – | – | – | – | – | – | – |
| Jamaica | – | – | – | – | – | X | – |
| Kazakhstan | – | – | – | – | – | X | – |
| Kenya | X | X | – | – | – | X | X |
| Kyrgyzstan | – | – | – | – | – | X | – |
| Laos | – | – | – | – | – | X | – |
| Lesotho | X | X | – | – | – | – | – |
| Liberia | – | – | – | – | X | X | – |
| Malawi | X | X | – | – | – | – | – |
| Mali | – | – | – | – | – | – | – |
| Mozambique | – | – | – | – | – | – | – |
| Namibia | X | X | X | X | – | – | – |
| Nepal | – | – | – | – | X | X | X |
| Nigeria | – | – | – | – | – | X | – |
| Papua New Guinea | – | – | – | – | – | X | – |
| Rwanda | X | – | X | X | – | X | X |
| Senegal | – | – | – | – | X | X | – |
| South Africa | – | X | – | – | – | – | X |
| South Sudan | – | – | – | – | – | – | – |
| Tajikistan | – | – | – | – | – | X | – |
| Tanzania | X | – | – | – | – | – | – |
| Thailand | – | – | – | X | X | X | X |
| Togo | – | – | – | – | – | X | – |
| Trinidad and Tobago | – | – | – | – | X | X | X |
| Uganda | X | – | X | X | – | – | – |
| Ukraine | – | – | – | – | – | X | – |
| Vietnam | – | – | – | – | X | X | X |
| Zambia | X | X | X | X | – | – | – |
| Zimbabwe | X | X | X | X | – | – | X |
| # Countries that have met target | – | 11 | 9 | 9 | 13 | 31 | 16 |
| NOTES: HIV epidemiological data is for all ages unless otherwise specified.SOURCES: U.S. Department of State, “Where We Work — PEPFAR” webpage, https://www.state.gov/where-we-work-pepfar/. UNAIDS, AIDSInfo database, accessed July 2020. UNAIDS, Global AIDS Update 2020, July 2020. UNAIDS, “Ratio of new HIV infections to number of people living with HIV improving”, April 2020. UNAIDS, “Making the End of AIDS Real: Consensus building around what we mean by epidemic control”, October 2017. | |||||||
Endnotes
- UNAIDS. Global HIV & AIDS statistics — 2020 Fact Sheet; accessed January 2021. ↩︎
- UNAIDS, 90-90-90: An ambitious treatment target to help end the AIDS epidemic, October 2014, accessed: https://www.unaids.org/sites/default/files/media_asset/90-90-90_en.pdf. UNAIDS. UNAIDS, 2025 AIDS Targets, accessed: https://aidstargets2025.unaids.org/# ↩︎
- PEPFAR, Strategy for Accelerating HIV/AIDS Epidemic Control (2017-2020), September 2017. ↩︎
- UNAIDS, “Ratio of new HIV infections to number of people living with HIV improving”, April 2020. UNAIDS, “Making the End of AIDS Real: Consensus building around what we mean by epidemic control”, October 2017. ↩︎
- PEPFAR bilateral programs span more than 50 countries (and more countries are reached through U.S. contributions to the Global Fund). ↩︎
- UNAIDS, Global AIDS Update 2020: Seizing the Moment, July 2020. ↩︎
- The 90-90-90 global targets are based on a shifting denominator with each target based on a subset of the overall care continuum (i.e. the second “90” is based on the first “90”—those that know their status—and the third “90” is based on the second “90” – those that are on ART). To translate the second and third “90s” into a continuum of care metric using everyone living with HIV as the denominator, the targets are calculated to equal 90-81-73. Fast-Track Cities, Frequently Asked Questions about 90-90-90 Targets, the HIV Care Continuum, the Updated National HIV/AIDS Strategy (NHAS), and the Fast-Track Cities Initiative, accessed from: http://www.fast-trackcities.org/sites/default/files/FAQ%20FTCI%20and%20updated%20NHAS.pdf ↩︎
- In its 2020 World AIDS Day report, UNAIDS released updated targets for 2025. UNAIDS, Press release: UNAIDS calls on countries to step up global action and proposes bold new HIV targets for 2025, November 2020. ↩︎
- UNAIDS, 90-90-90: An ambitious treatment target to help end the AIDS epidemic, October 2014, accessed: https://www.unaids.org/sites/default/files/media_asset/90-90-90_en.pdf ↩︎
- UNAIDS. Press release: UNAIDS report on the global AIDS epidemic shows that 2020 targets will not be met because of deeply unequal success; COVID-19 risks blowing HIV progress way off course; July 2020. ↩︎
- UNAIDS. 2025 AIDS Targets; November 2020, accessed: https://www.unaids.org/en/resources/presscentre/pressreleaseandstatementarchive/2020/december/20201126_bold-new-aids-targets-for-2025. ↩︎
- UNAIDS. Making the end of AIDS real: What we Mean by “Epidemic Control.” October 2017, accessed: https://www.unaids.org/sites/default/files/media_asset/glion_oct2017_meeting_report_en.pdf, Ghys, P. D., Williams, B. G., Over, M., Hallett, T. B., & Godfrey-Faussett, P. (2018). Epidemiological metrics and benchmarks for a transition in the HIV epidemic. PLoS medicine, 15(10), e1002678. https://doi.org/10.1371/journal.pmed.1002678 ↩︎
- UNAIDS. Making the end of AIDS real: What we Mean by “Epidemic Control.” October 2017, accessed: https://www.unaids.org/sites/default/files/media_asset/glion_oct2017_meeting_report_en.pdf ↩︎
- PEPFAR, PEPFAR 2020 Country Operational Plan Guidance for all PEPFAR Countries, January 2020. ↩︎
- It is important to note that incidence rates are different within different populations and contexts and should be monitored in conjunction with the number of new HIV infections. For instance, among populations experiencing population growth, the number of new HIV infections could be increasing while the incidence rate is decreasing. Ghys, P. D., Williams, B. G., Over, M., Hallett, T. B., & Godfrey-Faussett, P. (2018). Epidemiological metrics and benchmarks for a transition in the HIV epidemic. PLoS medicine, 15(10), e1002678. https://doi.org/10.1371/journal.pmed.1002678 ↩︎
- UNAIDS. Making the end of AIDS real: What we Mean by “Epidemic Control.” October 2017, accessed: https://www.unaids.org/sites/default/files/media_asset/glion_oct2017_meeting_report_en.pdf ↩︎