
As the Economy Improves, the Number of Uninsured Is Falling But Not Because of a Rebound in Employer Sponsored Insurance
Changes in Coverage Among Workers
While the previous sections have looked at all nonelderly individuals, this section will look solely at nonelderly workers. Between 2007 and 2010 the number of workers declined by 4.9 million (Table 8). All of this decrease was experienced in small and medium size firms (<1,000 workers) or among the self-employed. Overall, there was a decline in the rate of ESI among workers from 72.5 percent to 69.6 percent, meaning 7.7 million fewer workers had ESI. The percentage of workers without coverage increased from 17.6 percent to 19.6 percent, resulting in 2 million more uninsured workers. The decline in the rate of ESI coverage occurred in each firm size category; from 65.6 percent to 62.3 percent in small and medium firms and from 83.5 percent to 80.3 percent in large firms (Figure 16). There was an increase of almost 1 million uninsured workers in small and medium firms and 1.2 million in large firms.
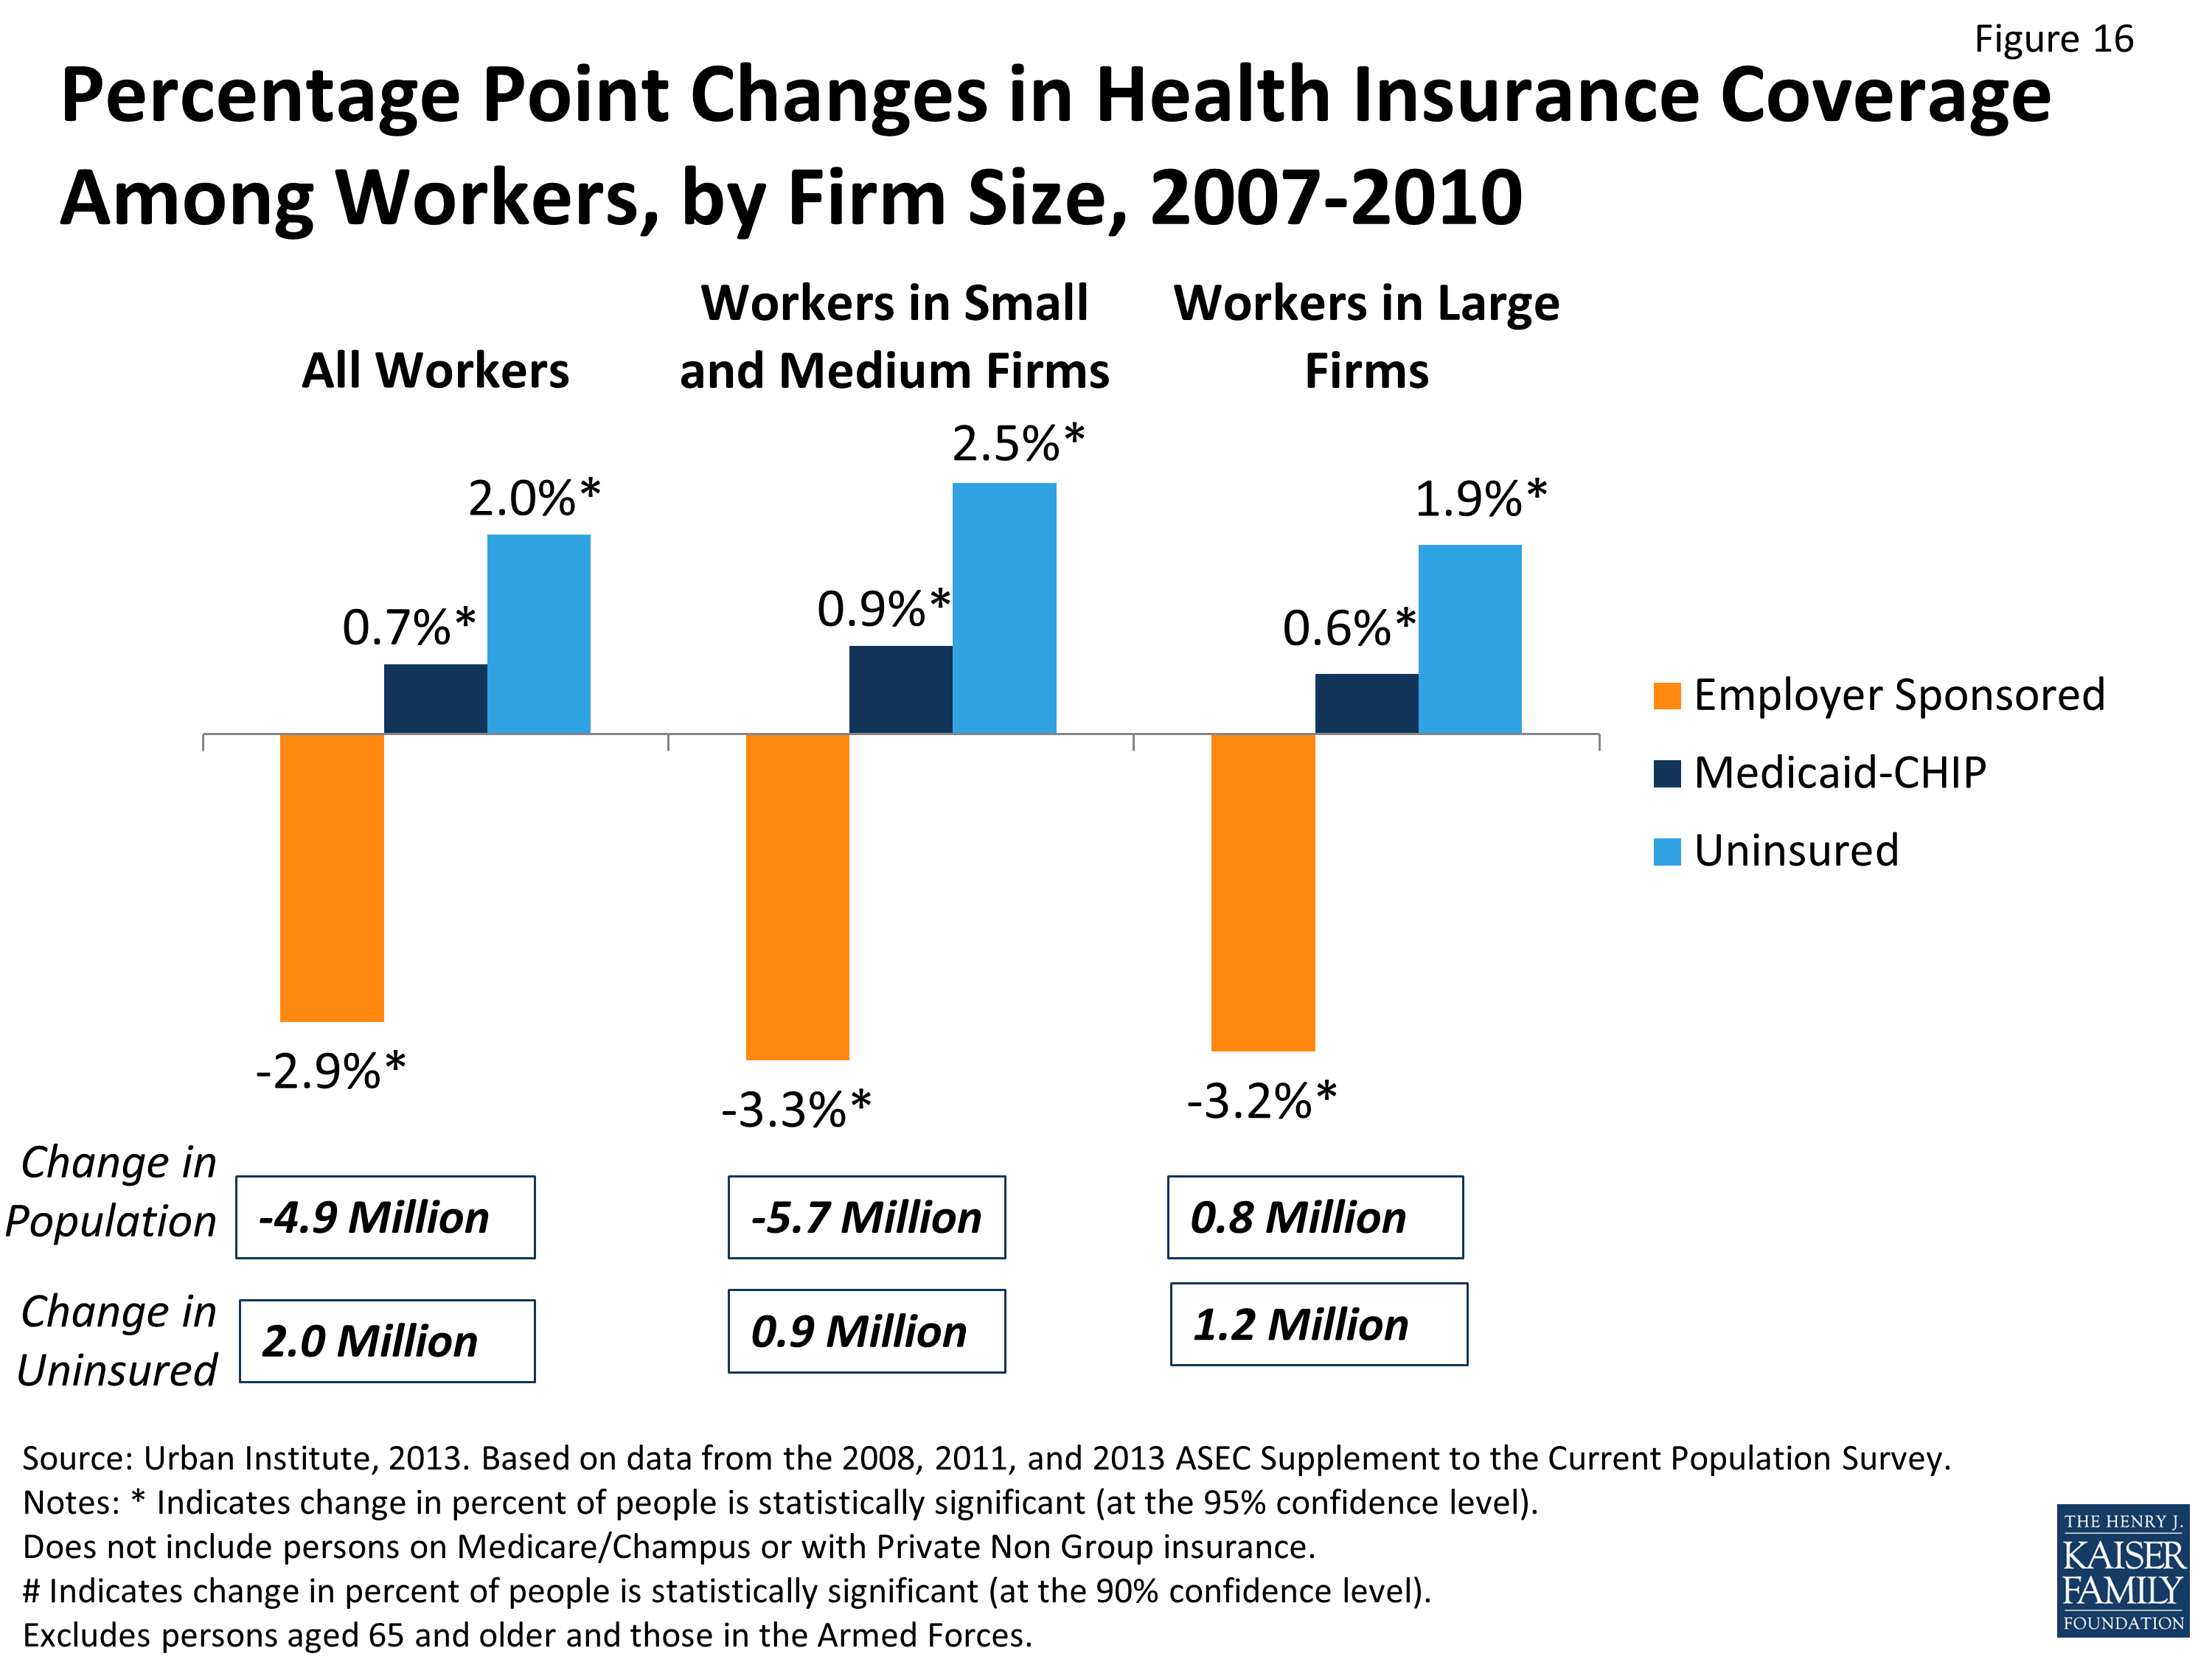
Figure 16: Percentage Point Changes in Health Insurance Coverage Among Workers, by Firm Size, 2007-2010
Between 2010 and 2012, the number of workers increased by 2.1 million, with 1.1 million more workers in small and medium sized firms and 1.0 million in large firms. The rate of ESI continued to decline for all workers by about half a percentage point (Figure 17). All of the decline in the ESI rate was in small and medium size firms. In large firms, the ESI rate increased slightly (0.8 percentage points).

Figure 17: Percentage Point Changes in Health Insurance Coverage Among Workers, by Firm Size, 2010-2012
There are also differences in coverage changes between those workers in industries with high rates of ESI coverage and those in industries with lower rates of ESI coverage (Table 9). High ESI industries are those with high ESI coverage rates (more than 80 percent in 2012). This group consisted primarily of finance, manufacturing, information and communications firms. Low ESI industries had ESI rates lower than 80 percent in 2012. These industries included primarily agriculture, construction, and wholesale and retail trade. Between 2007 and 2010, the decline in the number of workers, 4.9 million, was roughly split evenly between high and low ESI industries. However, the drop in the rate of employer sponsored insurance was greater in low ESI industries than high ESI industries—3.3 percentage points (66.0 percent to 62.7 percent) versus 1.9 percentage points (84.4 percent to 82.5 percent) (Figure 18). The increase in the uninsured rate among workers was also higher in low ESI industries. Thus, most growth in the number of uninsured workers during this period was among those in low ESI industries.
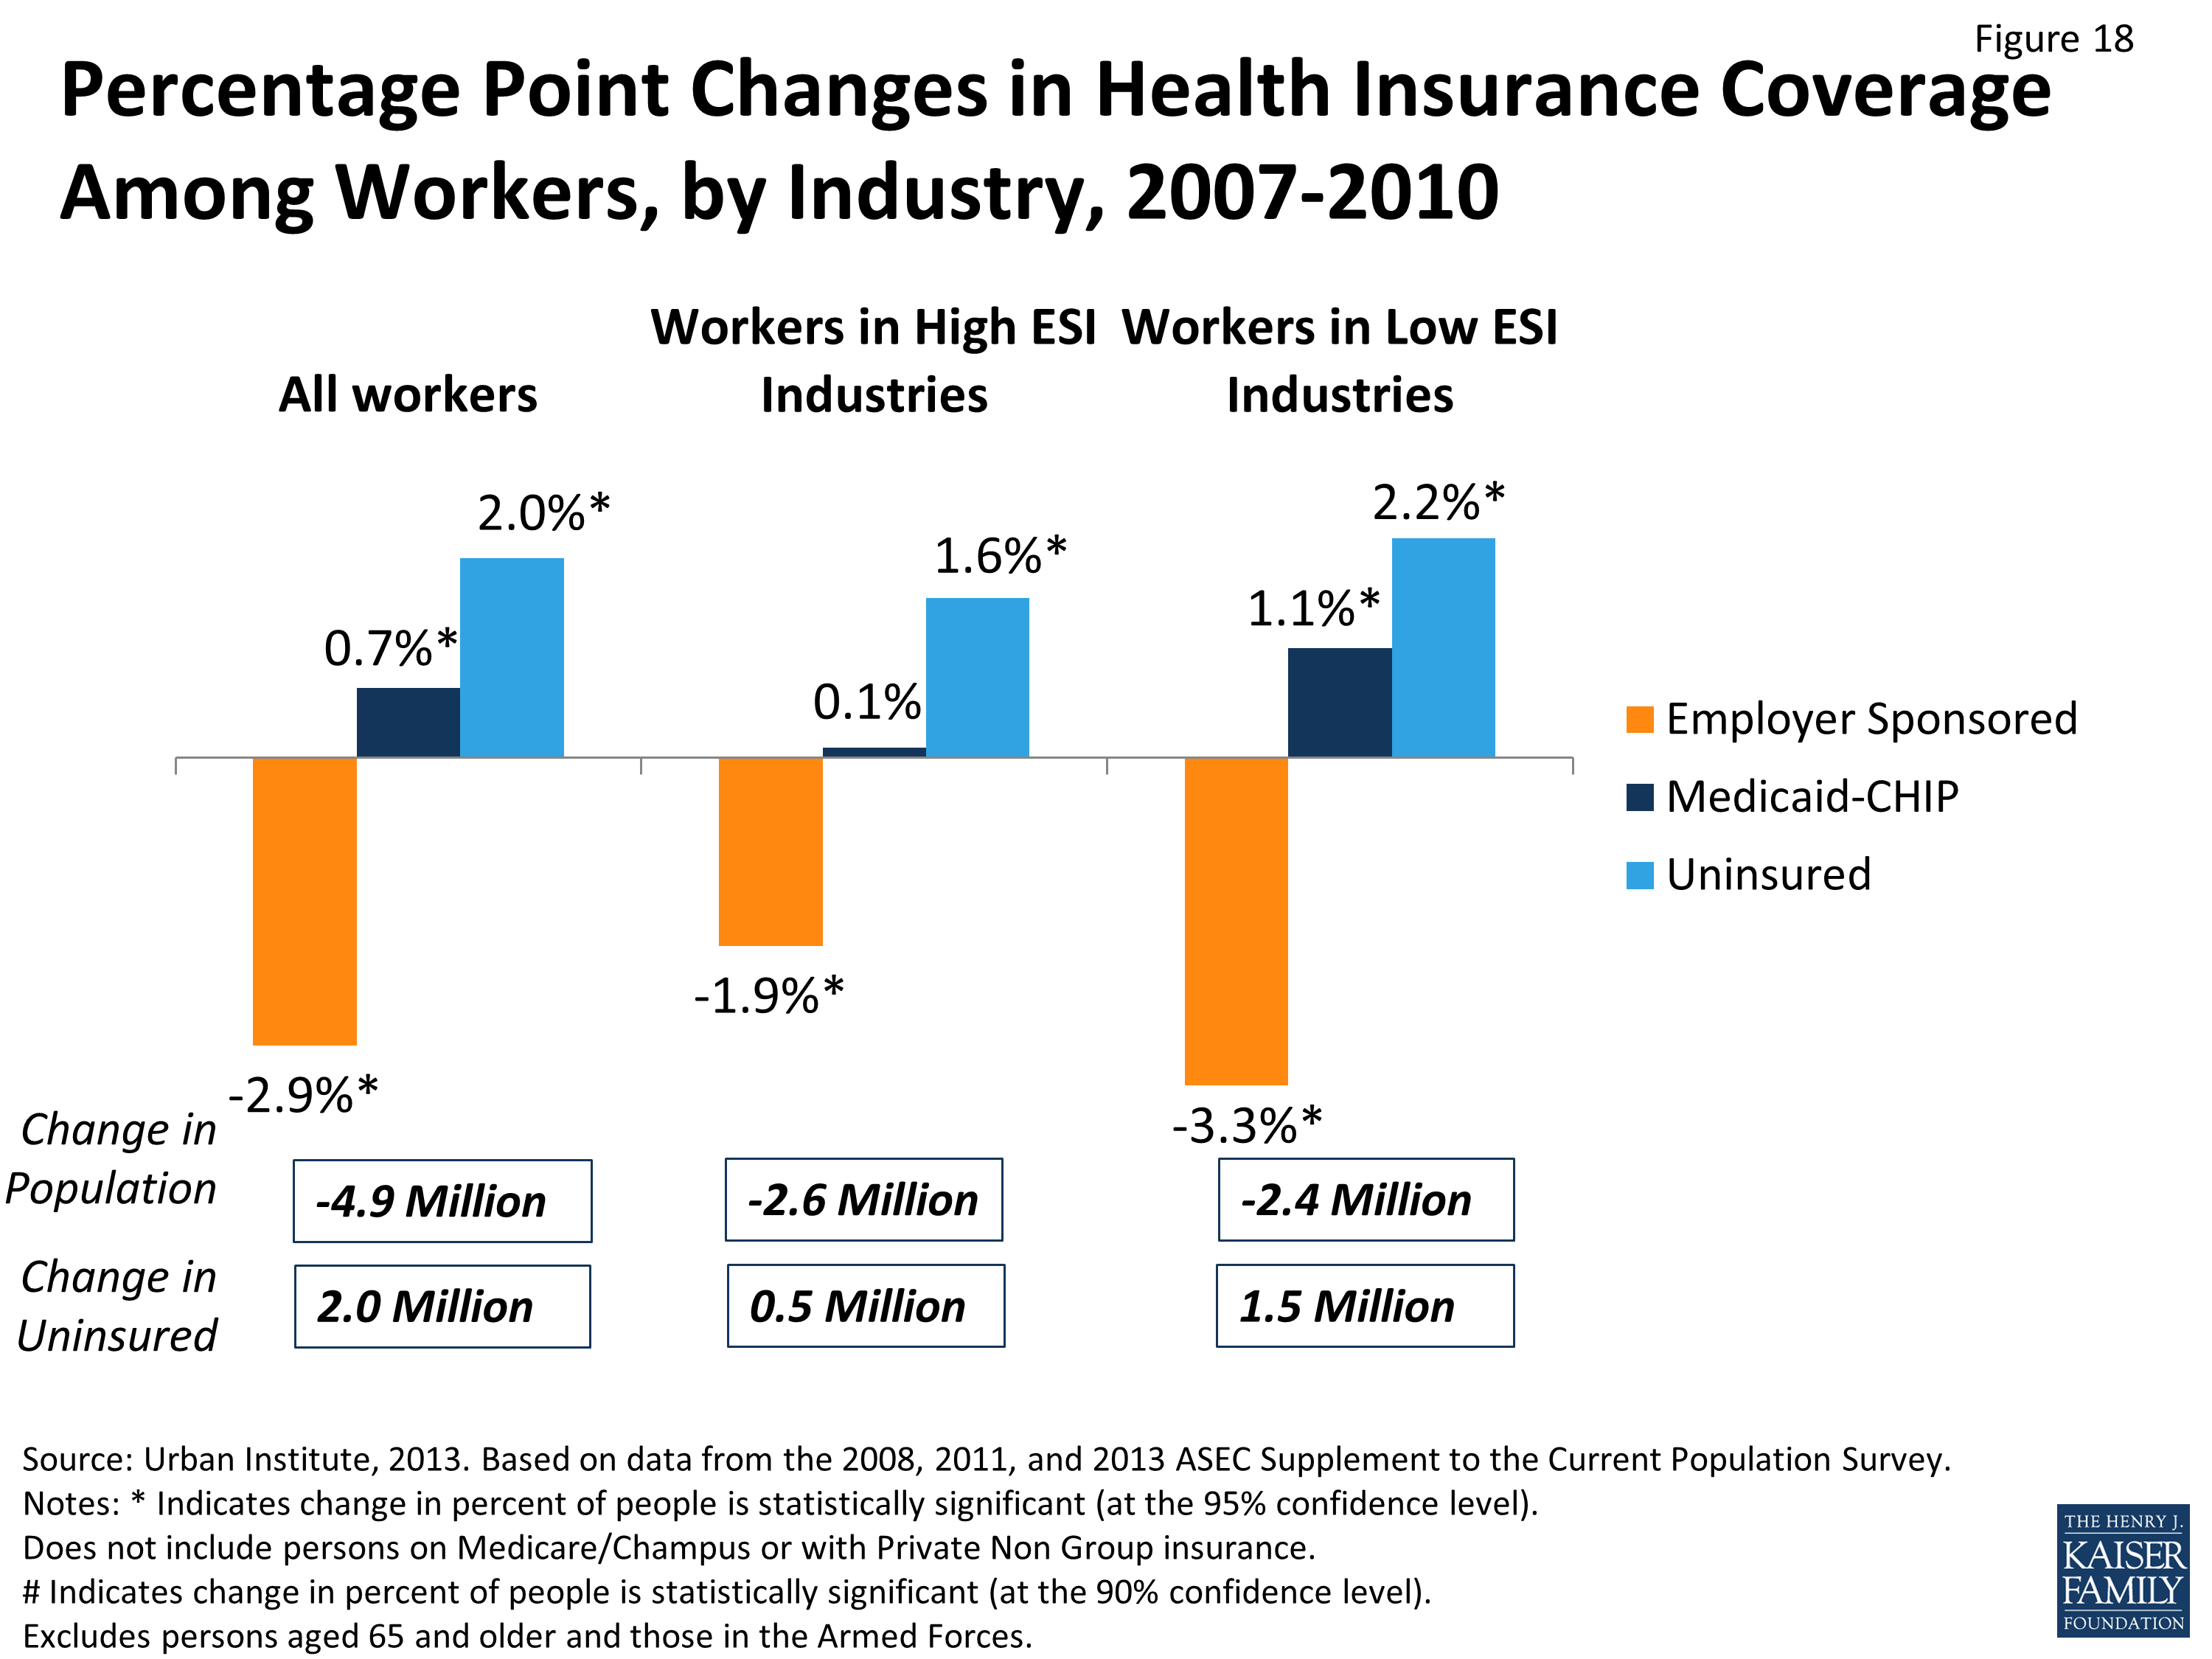
Figure 18: Percentage Point Changes in Health Insurance Coverage Among Workers, by Industry, 2007-2010
Almost all of the growth in workers between 2010 and 2012 —1.8 million out of 2.1 million total—was in low ESI industries. At the same time, the rate of ESI continued to decline in low ESI industries, falling from 62.7 to 62.3 percent. The rate of ESI stabilized in the high ESI industries.
Thus, while there were some gains in coverage for some workers in more recent years, most of the job growth that has occurred since the peak of the Great Recession has been in industries or firms where the rate of ESI continues to decline. These trends indicate that economic recovery may not be accompanied by large gains in employer coverage.
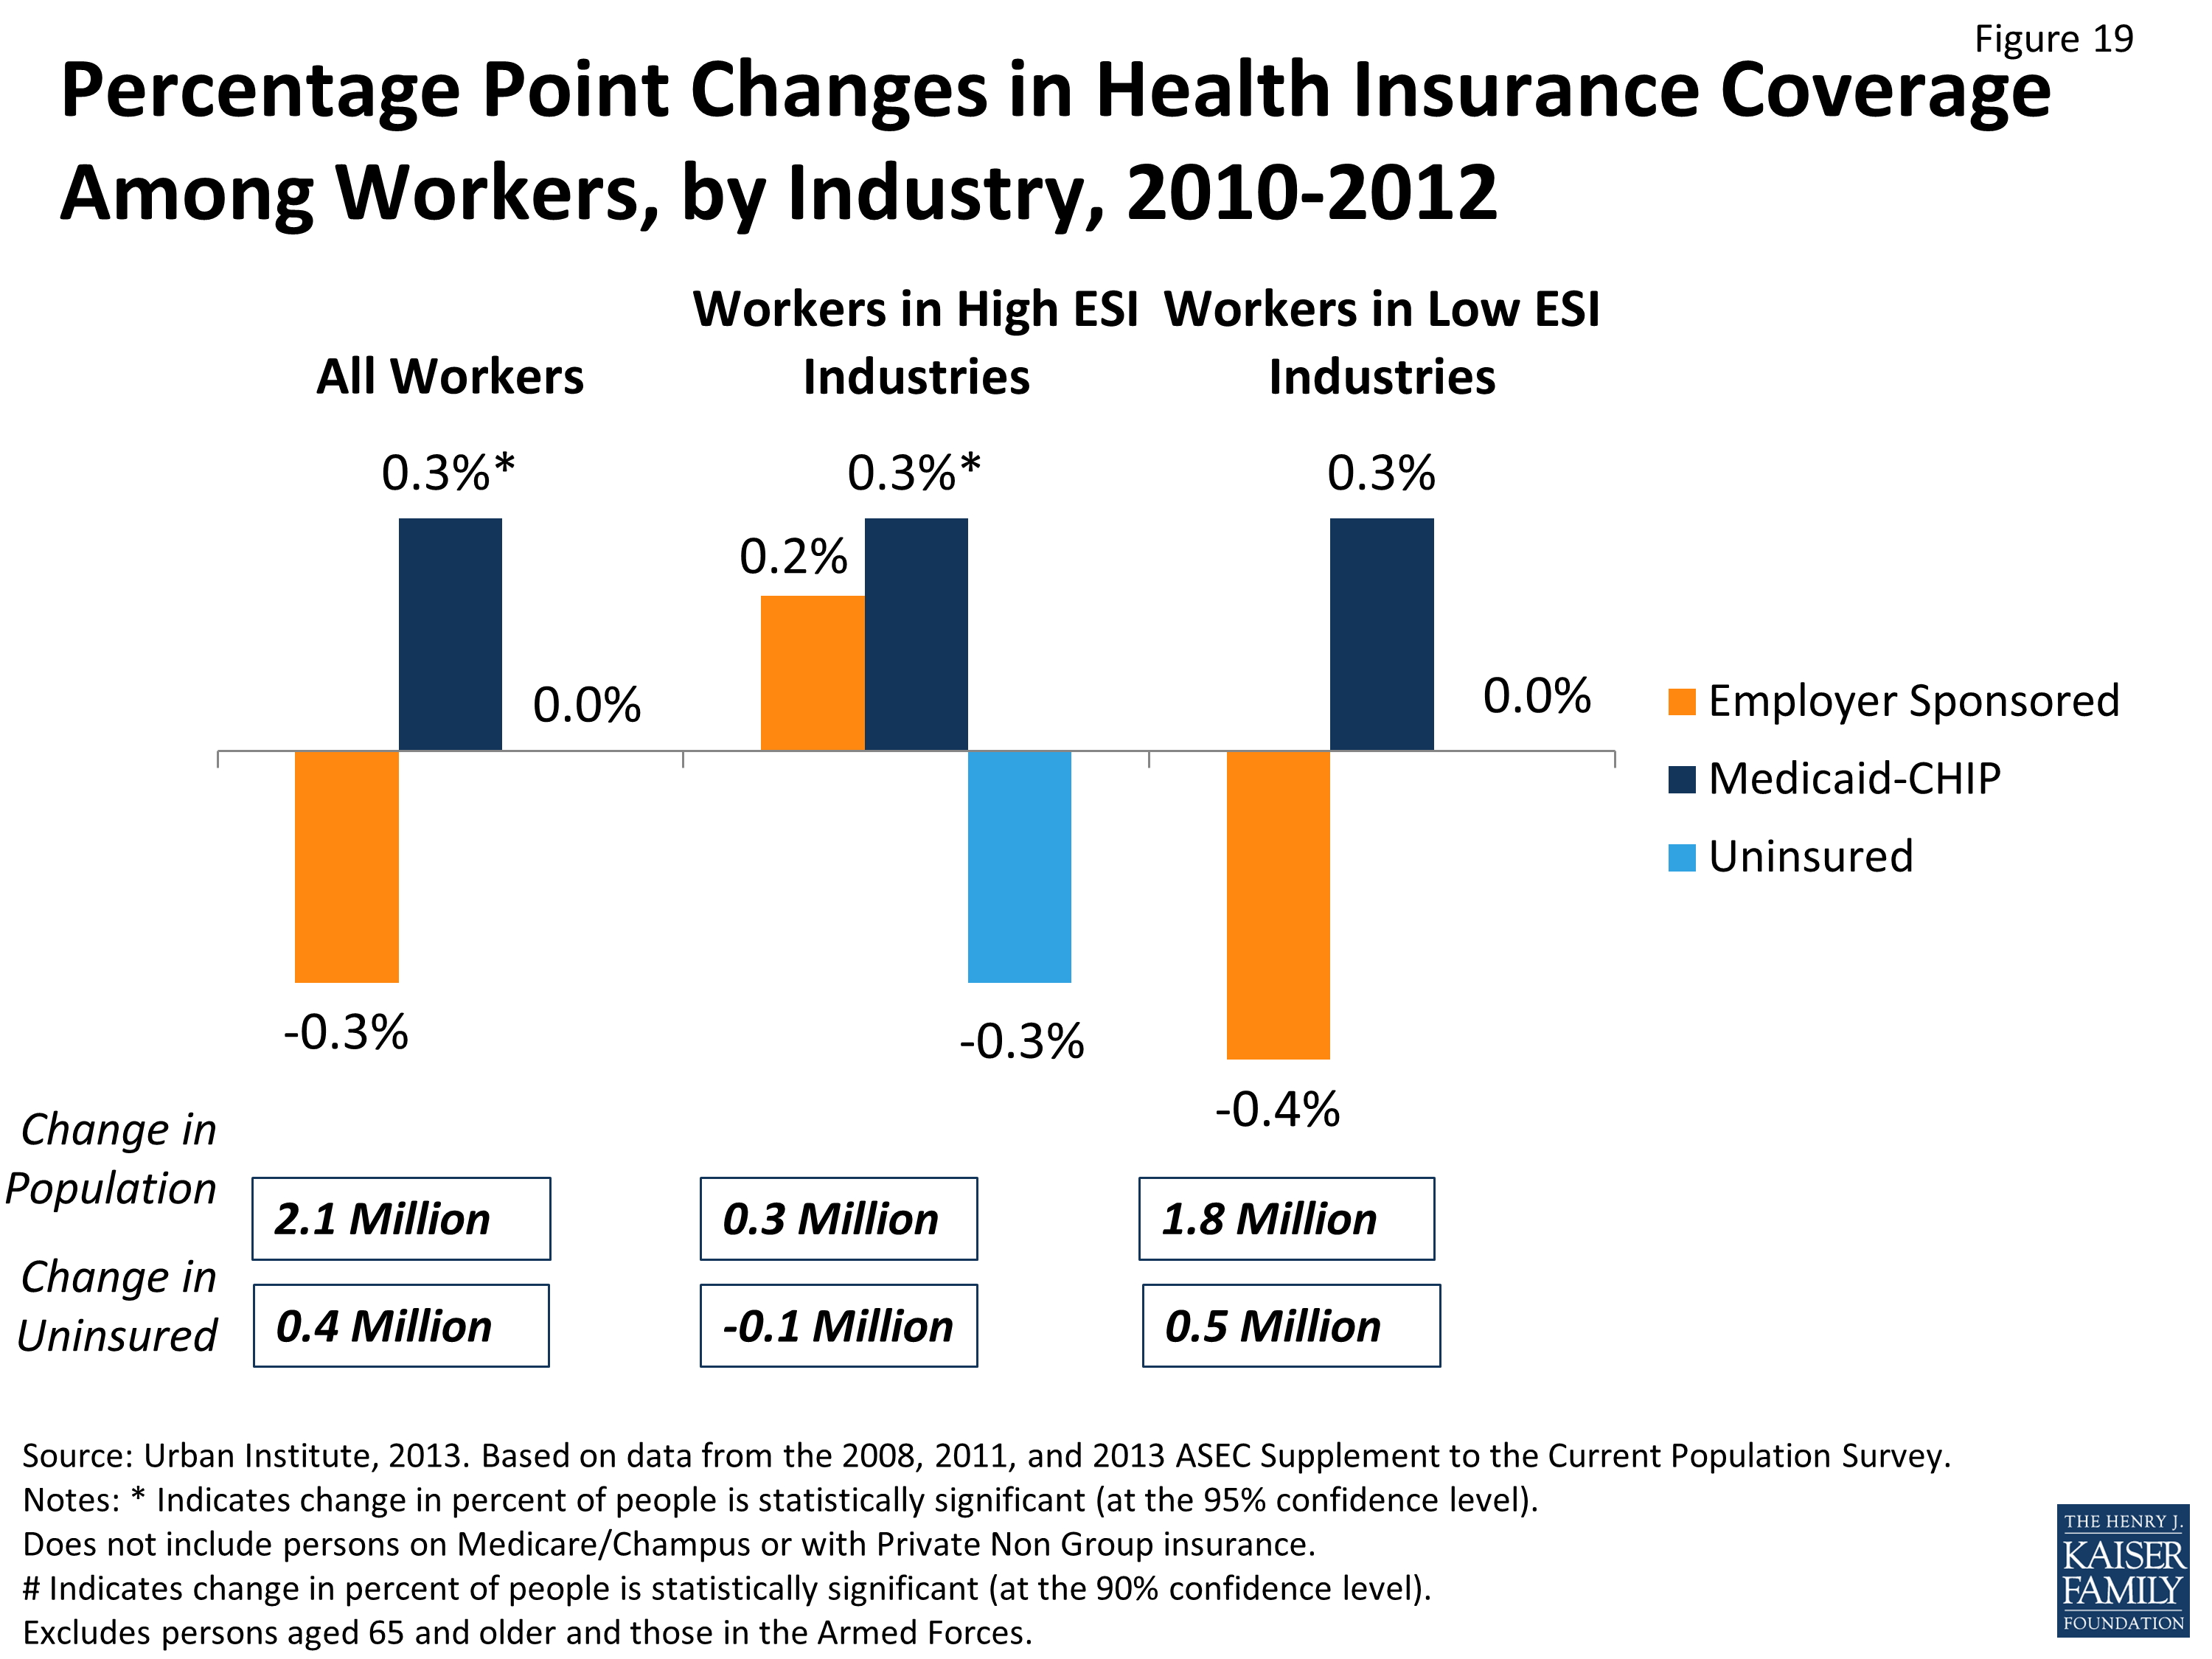
Figure 19: Percentage Point Changes in Health Insurance Coverage Among Workers, by Industry, 2010-2012
Topics
