Introduction
The Consolidated Appropriations Act of 2023 (CAA), enacted in December 2022, ended the pandemic-era Medicaid continuous enrollment policy effective March 31, 2023, setting in motion final planning and preparations for the unwinding by state agencies and CMS. The CAA also phased down the enhanced FMAP through December 2023. To be eligible, states needed to meet specific maintenance of effort requirements including complying with federal renewal requirements, maintaining eligibility and enrollment procedures, taking actions to update contact information and address returned mail, and reporting specific data. During the three-year pause in Medicaid disenrollments, Medicaid and Children’s Health Insurance Program (CHIP) enrollment grew by 32% from 71.3 million to 94.1 million, resulting in the largest ever number of enrollees. The unwinding of continuous enrollment and the unprecedented volume of eligibility work required coordination across federal and state governments, health plans, providers, and community-based organizations; careful planning; close monitoring; and rapid response to try to mitigate loss of Medicaid coverage among individuals remaining eligible.
In this context and with most states still conducting unwinding renewals, the 22nd annual survey of state Medicaid and CHIP program officials conducted by KFF and the Georgetown University Center for Children and Families in March 2024 presents a snapshot of actions states have taken to improve systems, processes, and communications during the unwinding, as well as key state Medicaid eligibility, enrollment, and renewal policies and procedures in place as of May 2024. The report focuses on policies for children, pregnant individuals, parents, and other non-elderly adults whose eligibility is based on Modified Adjusted Gross Income (MAGI) financial eligibility rules. Overall, 49 states and the District of Columbia responded to the survey, although response rates for specific questions varied (Florida was the only state that did not respond).(Back to top)
The Unwinding and Post-Unwinding
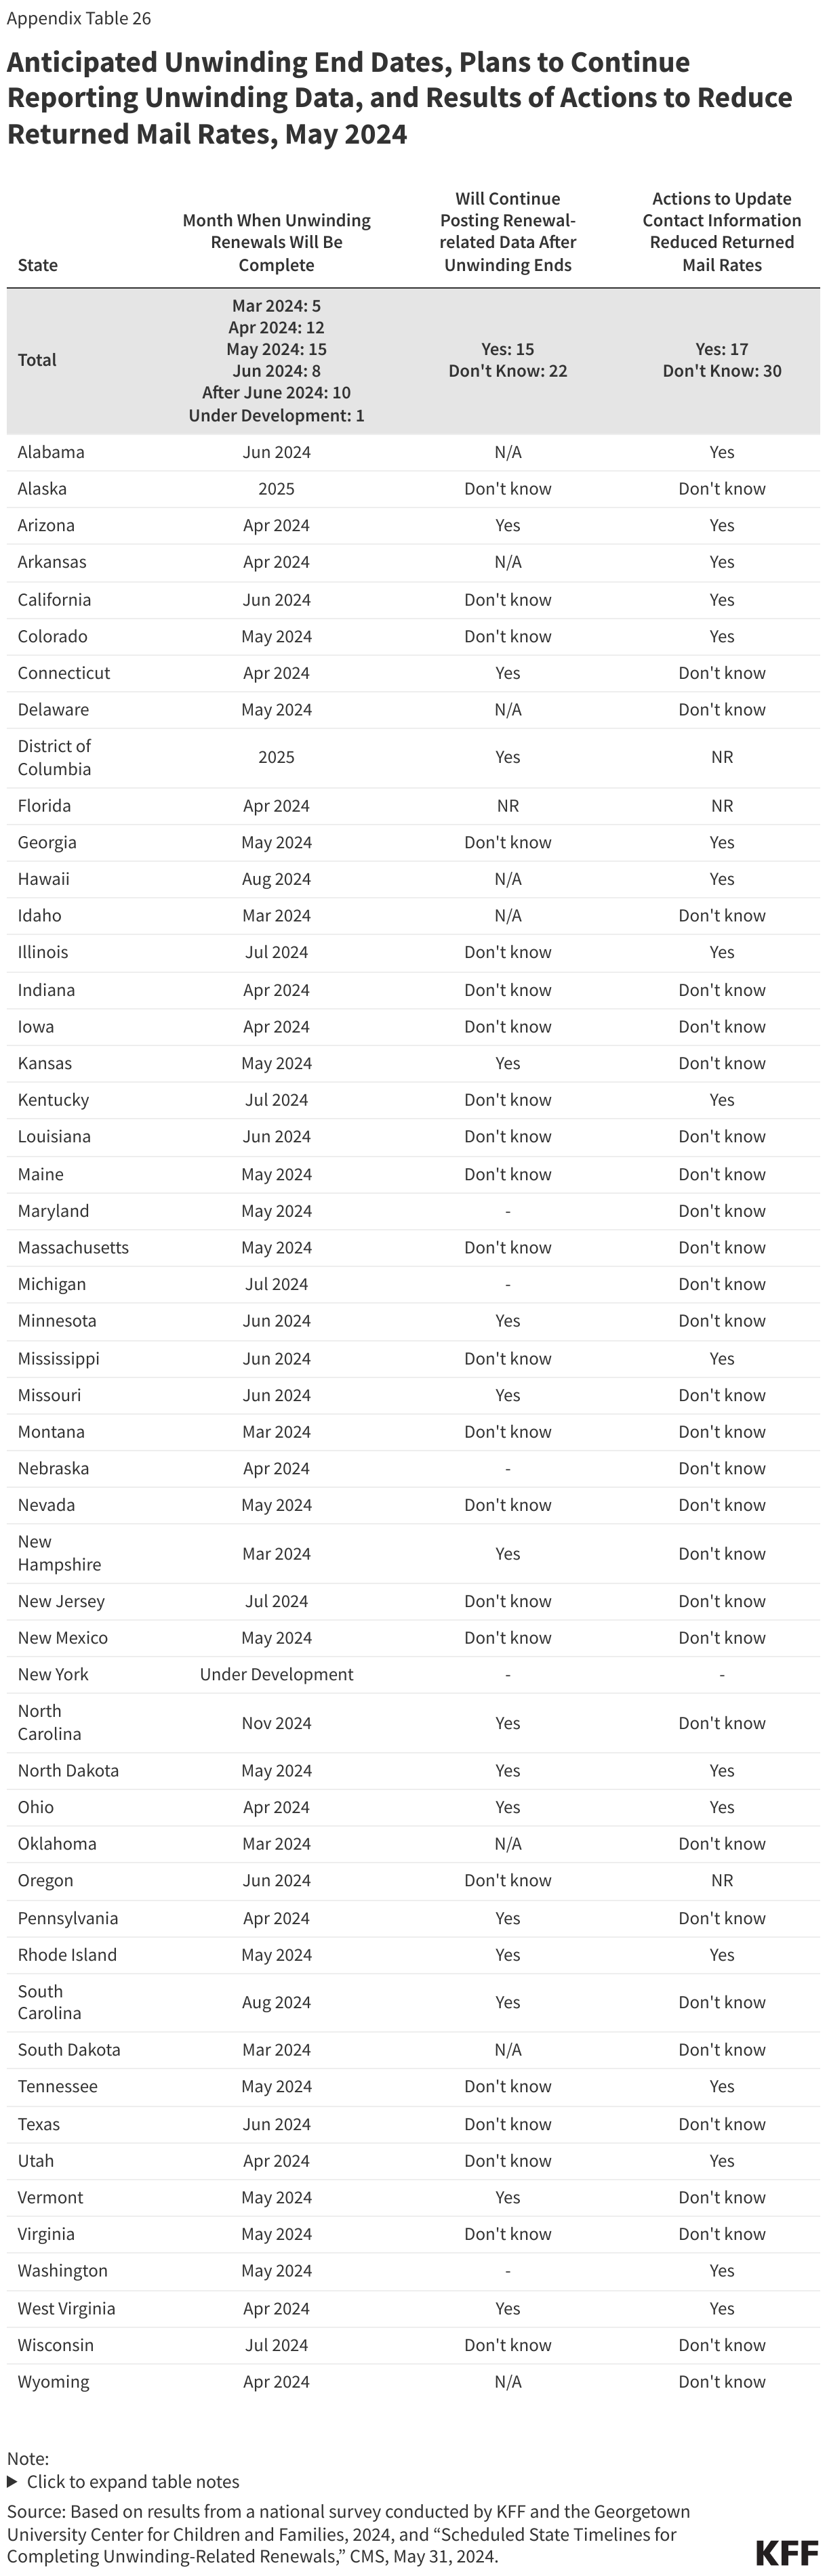
While the unwinding period was expected to end for all states by June 2024, in ten states, the timeline for completing renewals has been extended beyond June 2024. With all states initiating their first monthly batch of renewals no later than April 2023, it was expected that the unwinding would be complete by June 2024. However, due to concerns over high rates of procedural disenrollments, 15 states voluntarily pushed out the deadline for returning renewals by a month or more to conduct targeted outreach and give enrollees more time to complete and return renewal forms. Other states were required to pause procedural disenrollments and/or implement CMS-approved mitigation strategies as a temporary tactic to address areas of non-compliance with federal renewal requirements or other issues discovered during the unwinding. On May 31, 2024, CMS released preliminary estimates of when states will complete unwinding renewals. While most states are expected to complete renewals by June, Illinois, Kentucky, Michigan, New Jersey, and Wisconsin will finish in July while Alaska, District of Columbia, Hawaii, North Carolina, and South Carolina will finish in August or later. New York’s completion month is still under development.
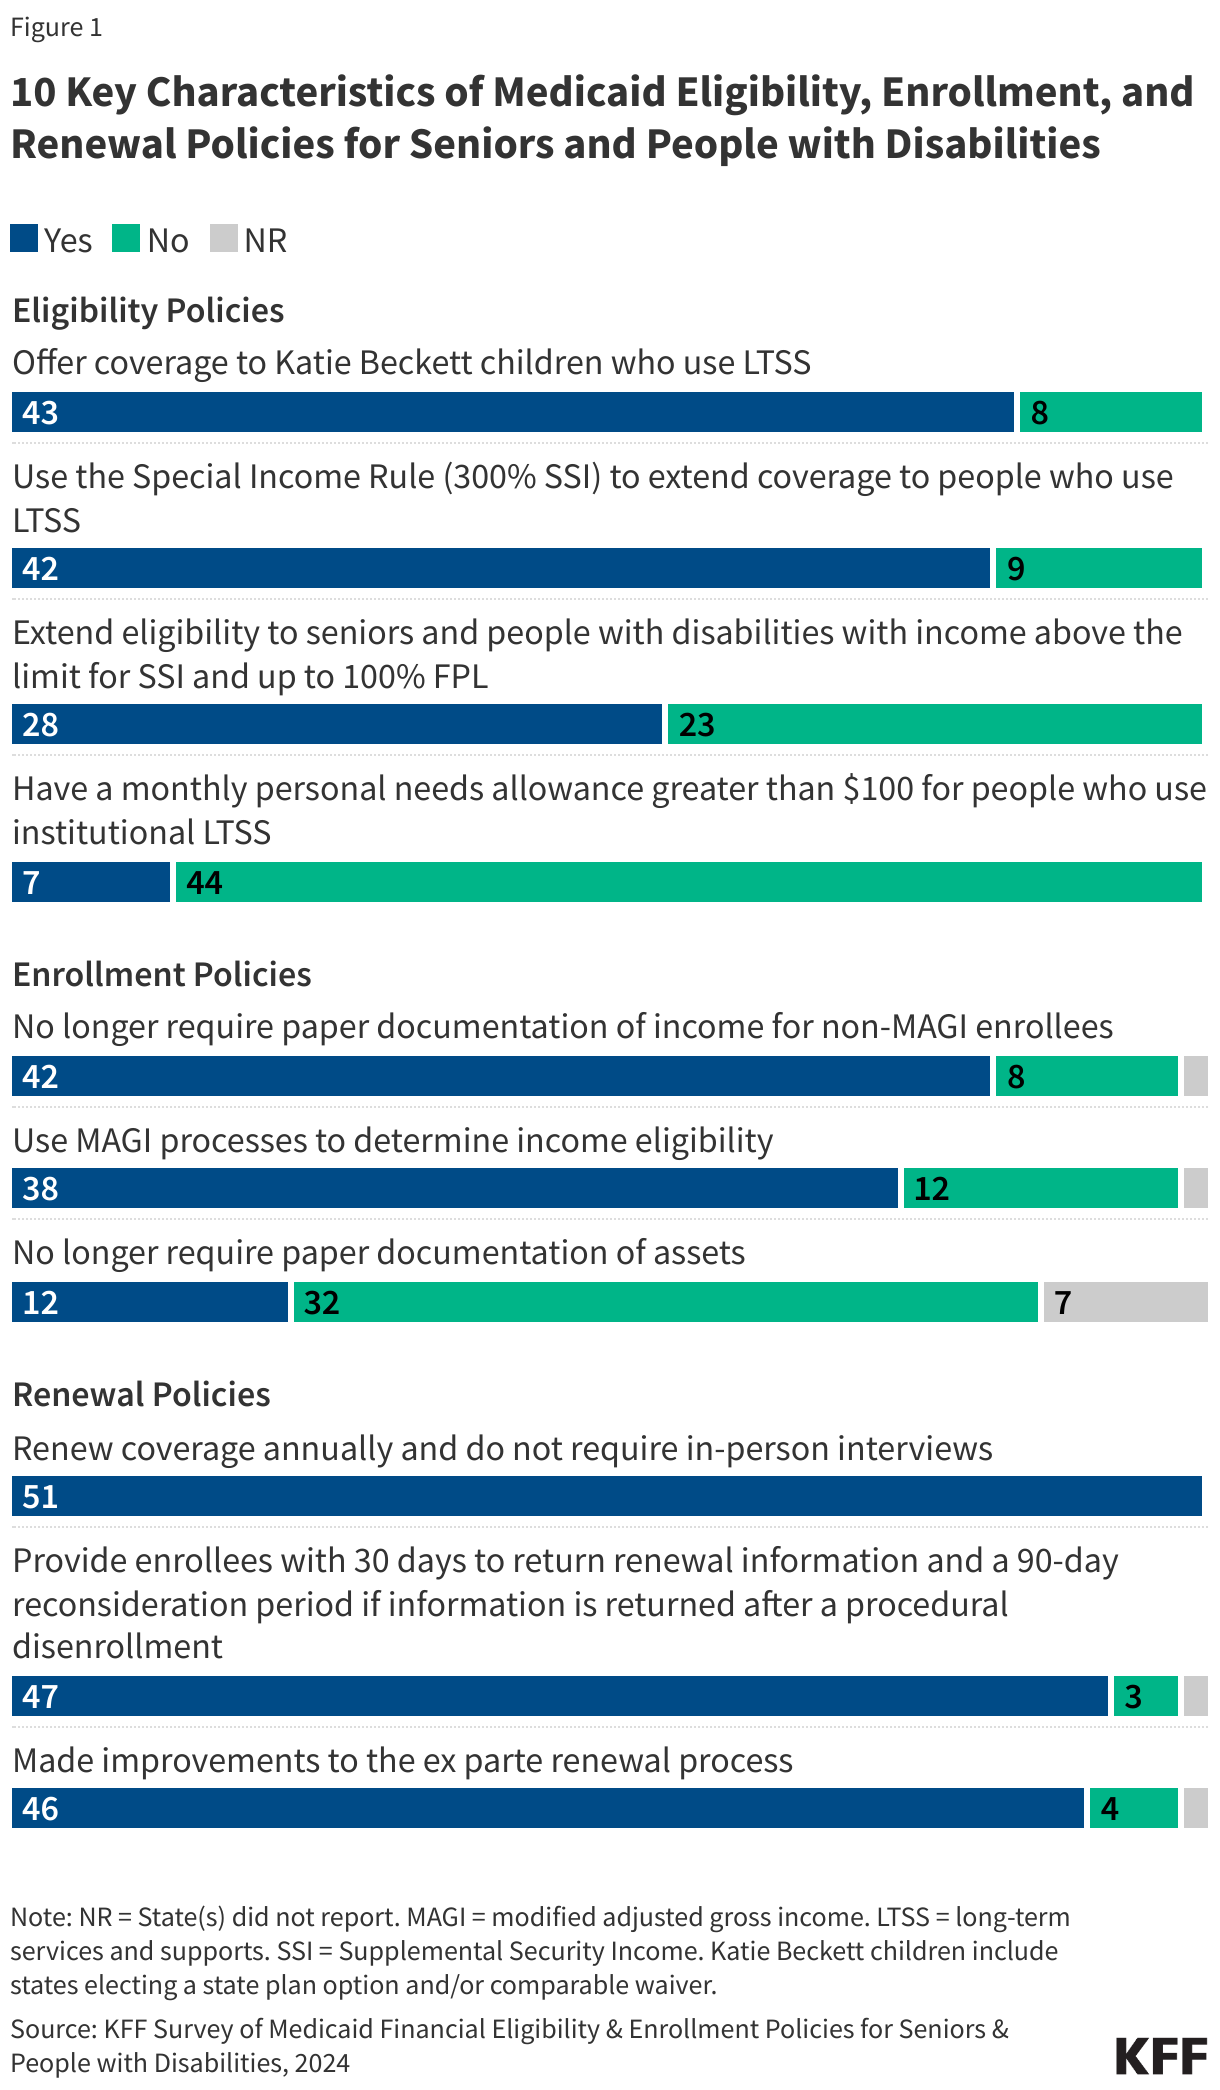
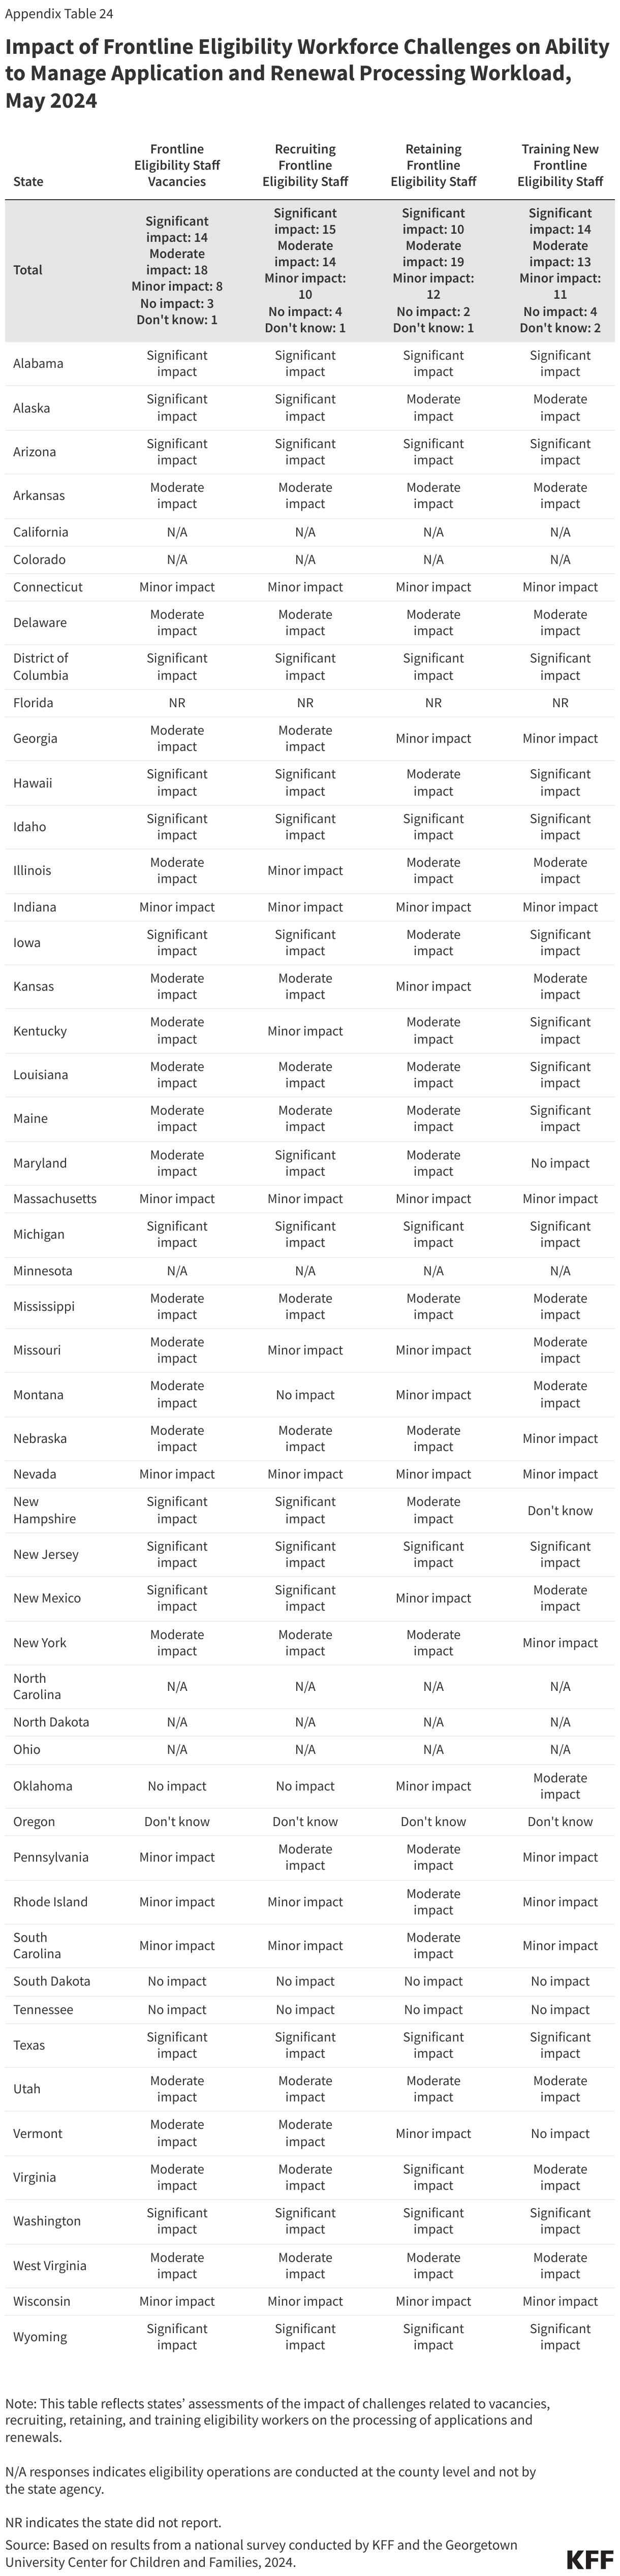
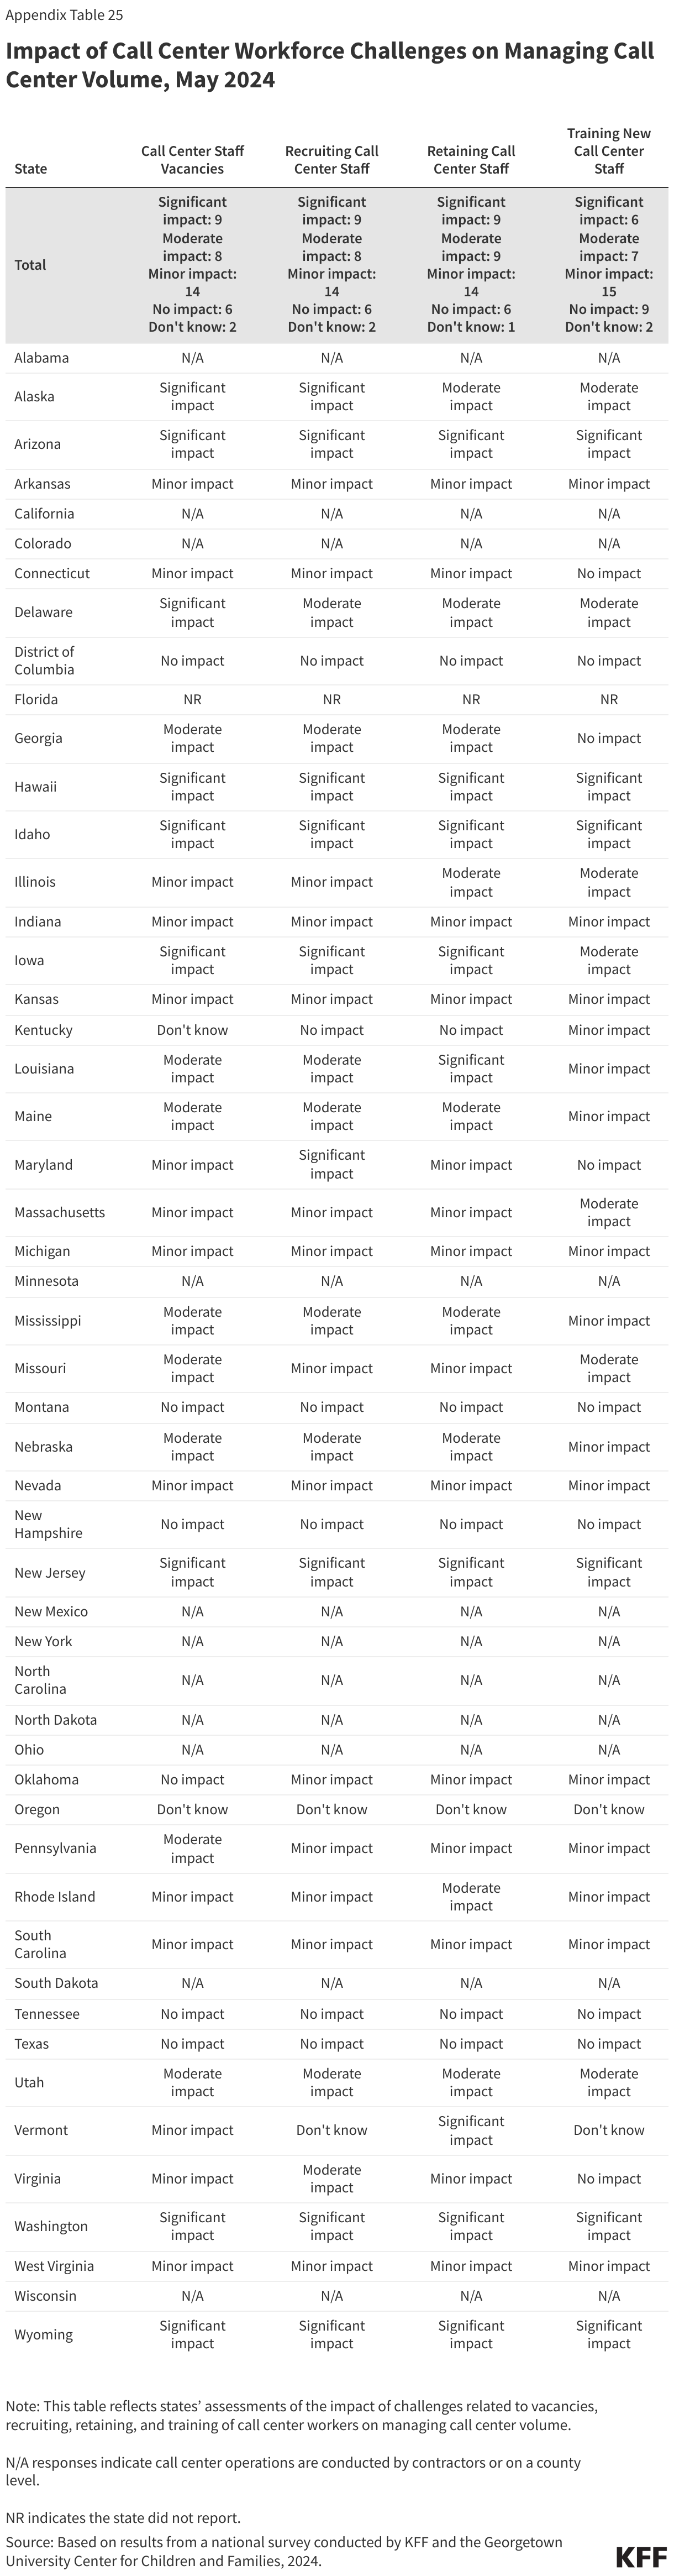
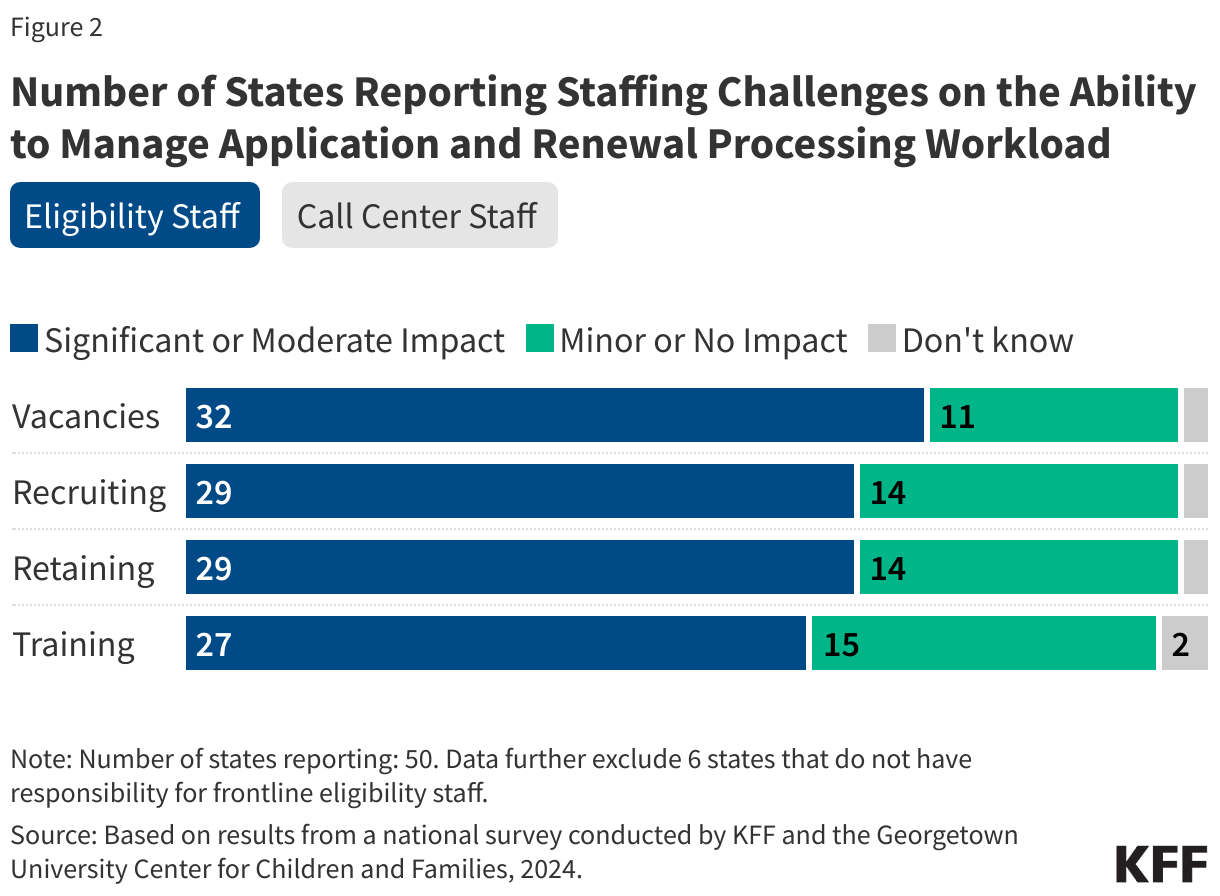
Most states (41) have frontline eligibility staff vacancies while somewhat fewer states (32) report call center staff vacancies. States experienced a significant or moderate impact because of eligibility staff vacancies (32 states), the need to recruit frontline eligibility staff (29 states), retaining staff (29 states), and training new workers (27 states) (Figure 2). Fewer states reported significant or moderate impacts from call center vacancies (17 states), recruiting additional call center personnel (17 states), retaining call center staff (18 states), and training new personnel (13 states).
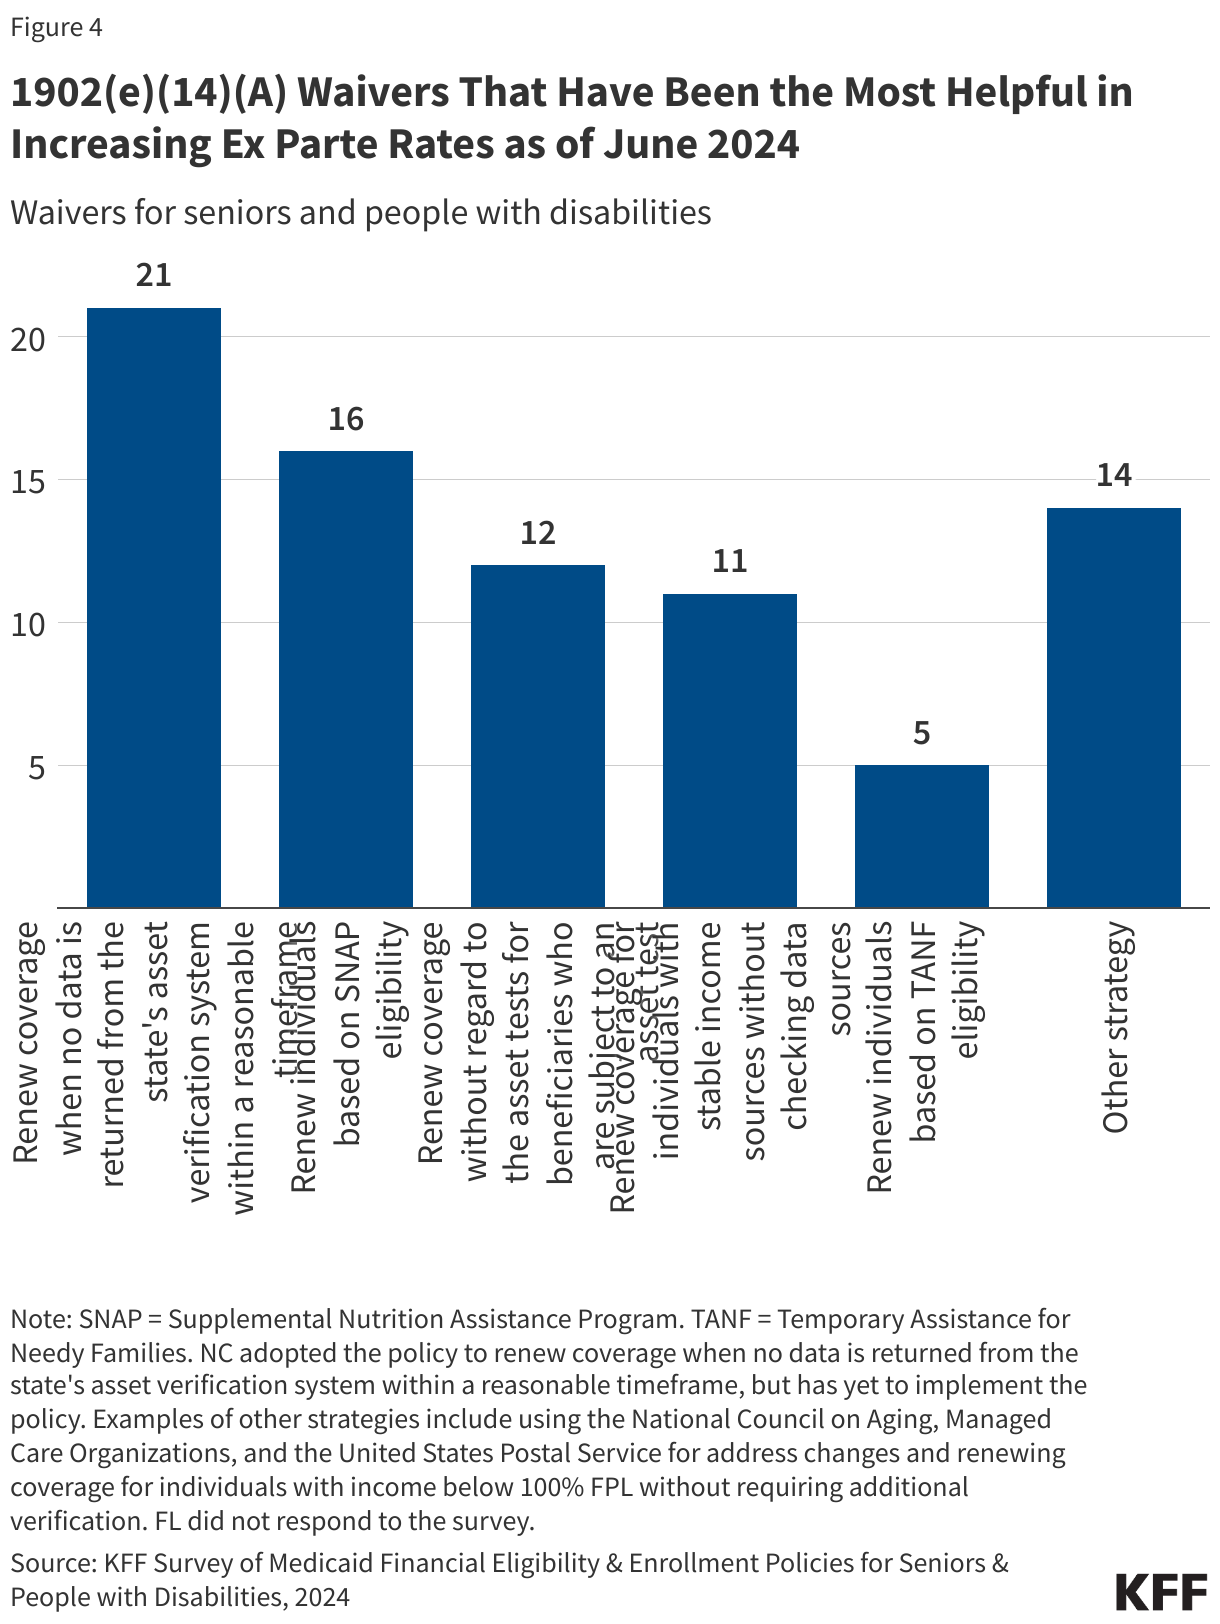
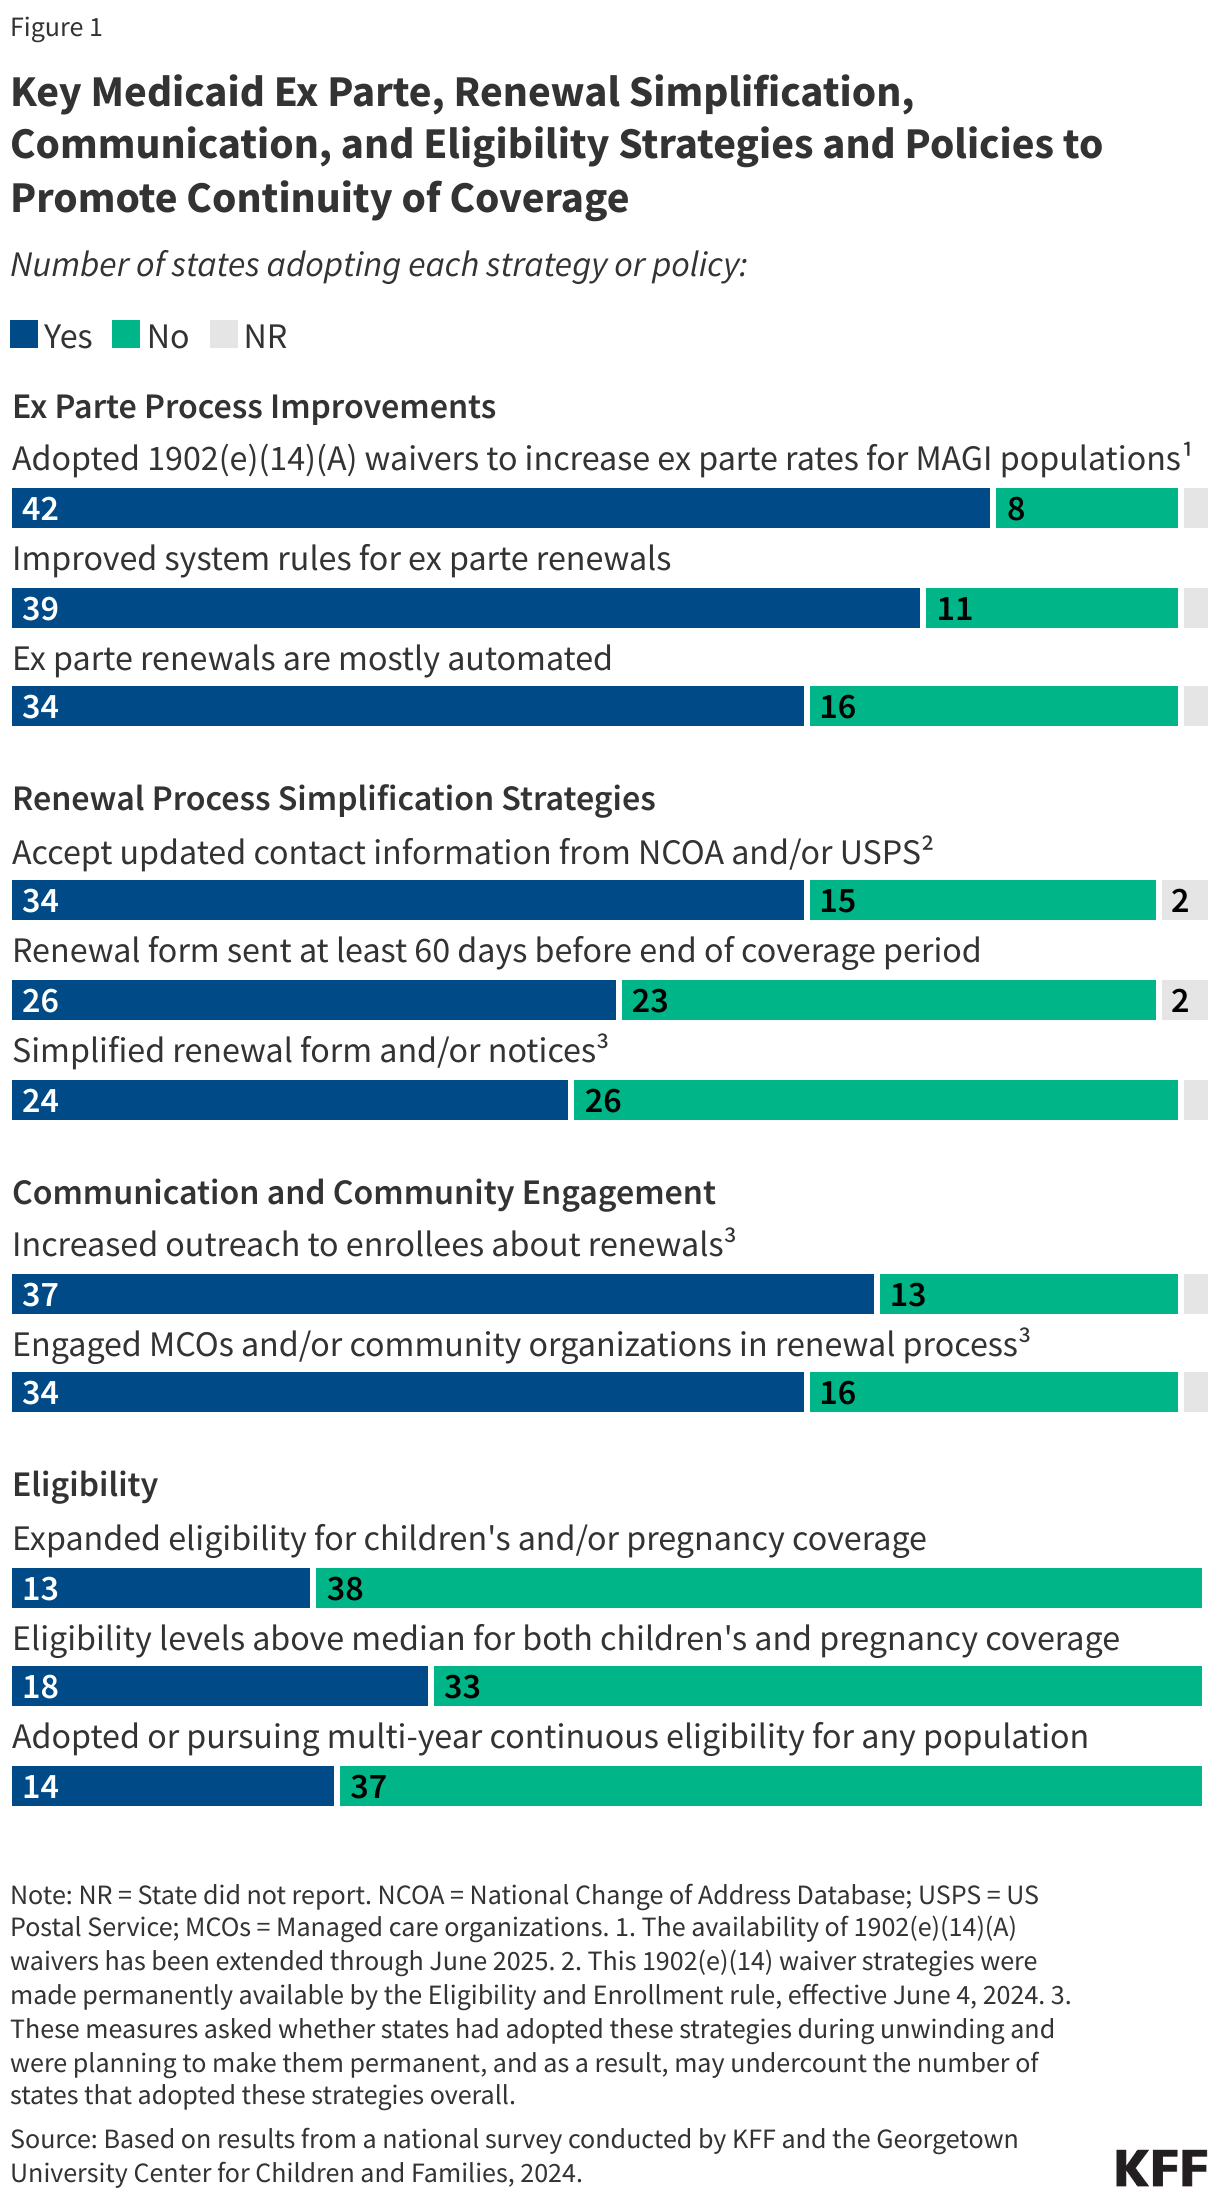
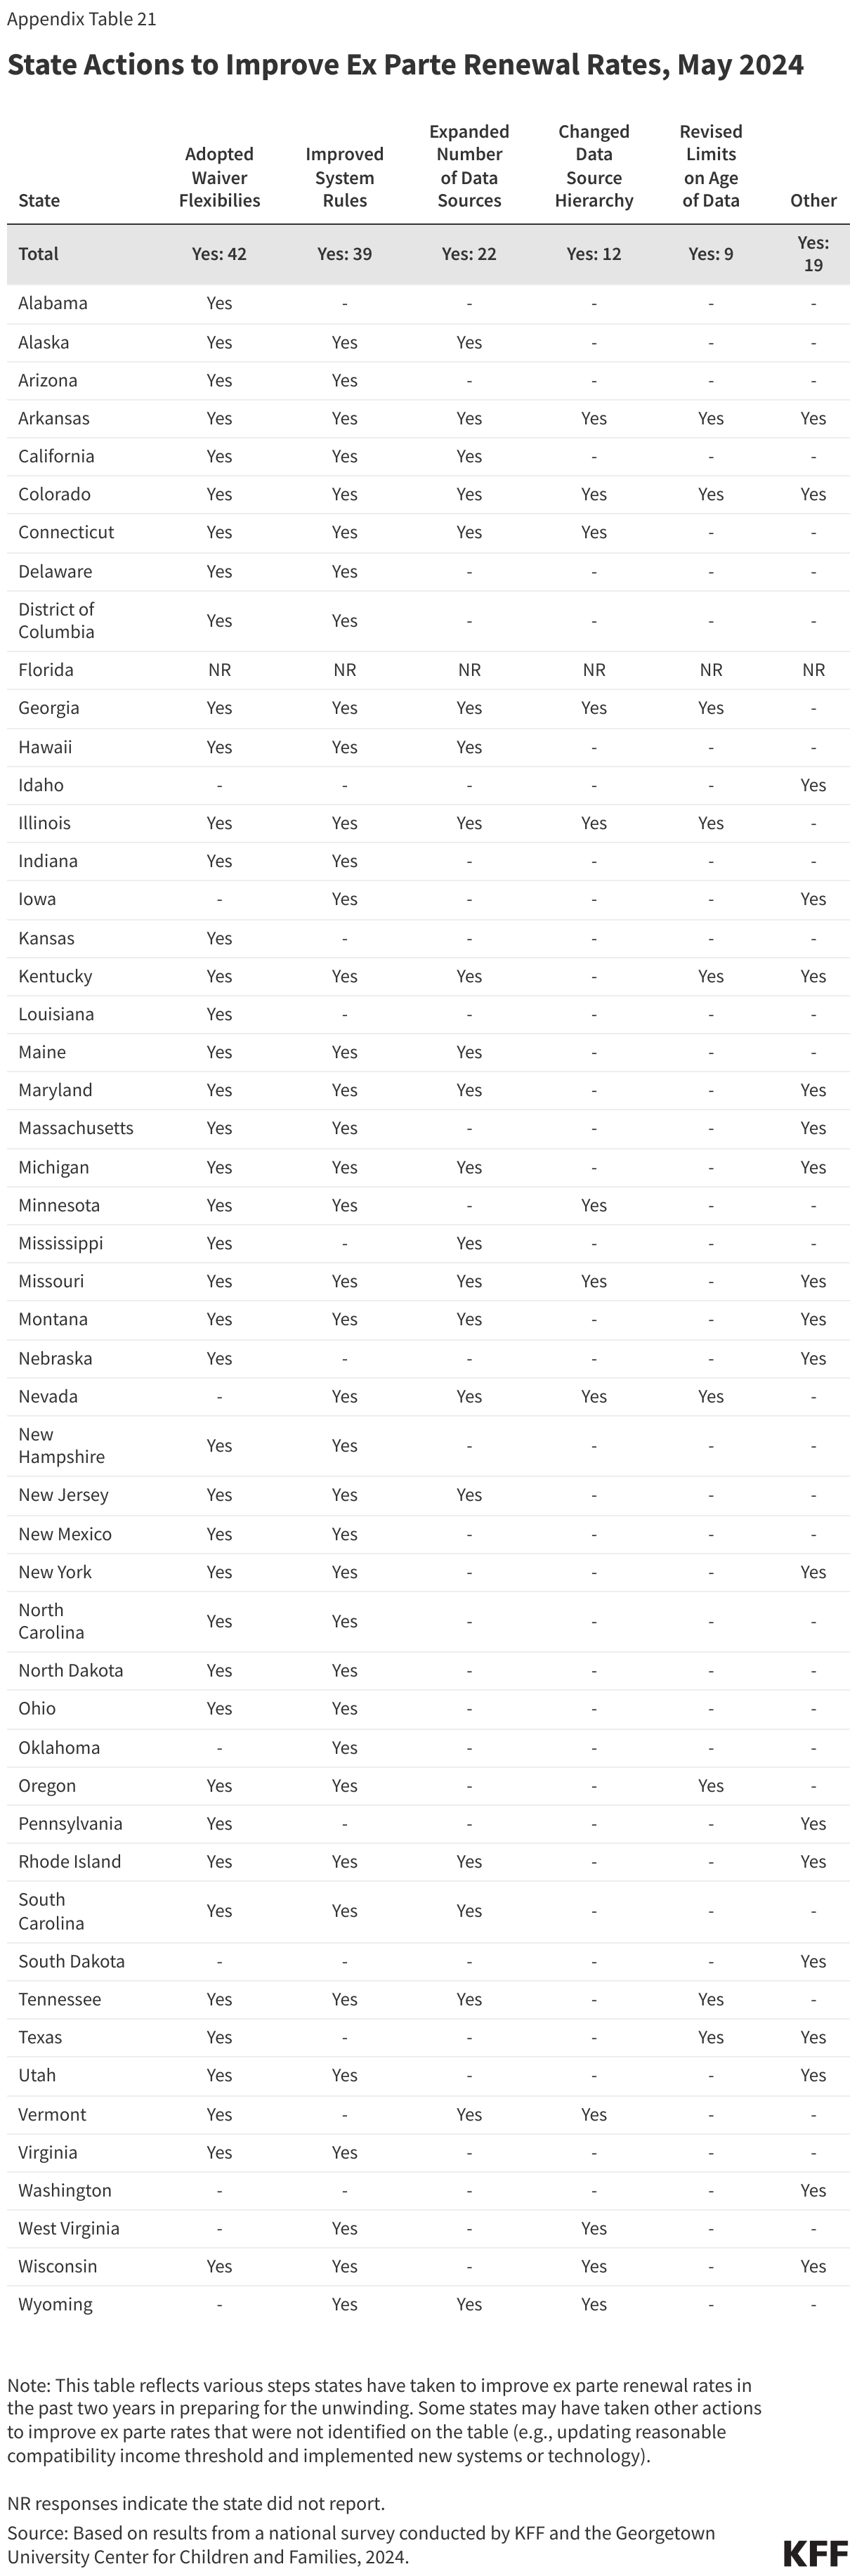
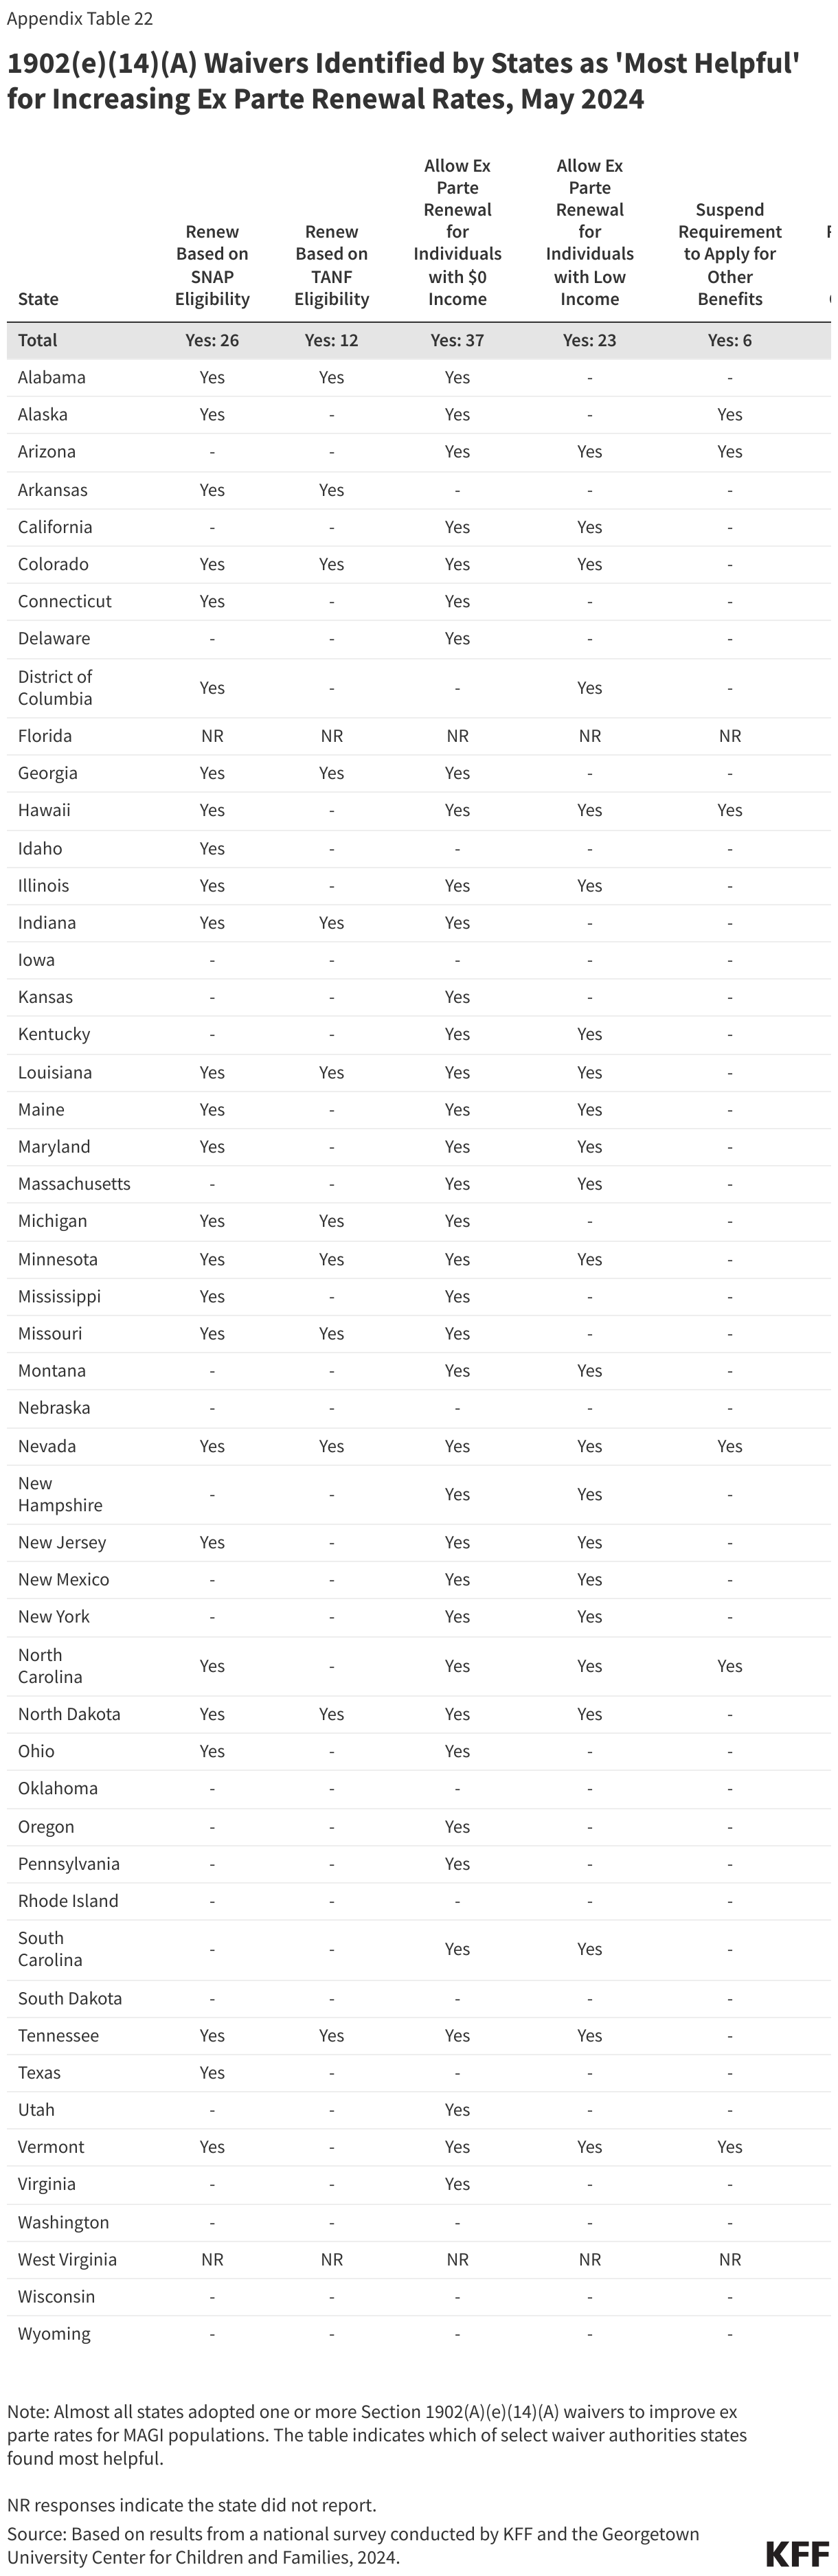
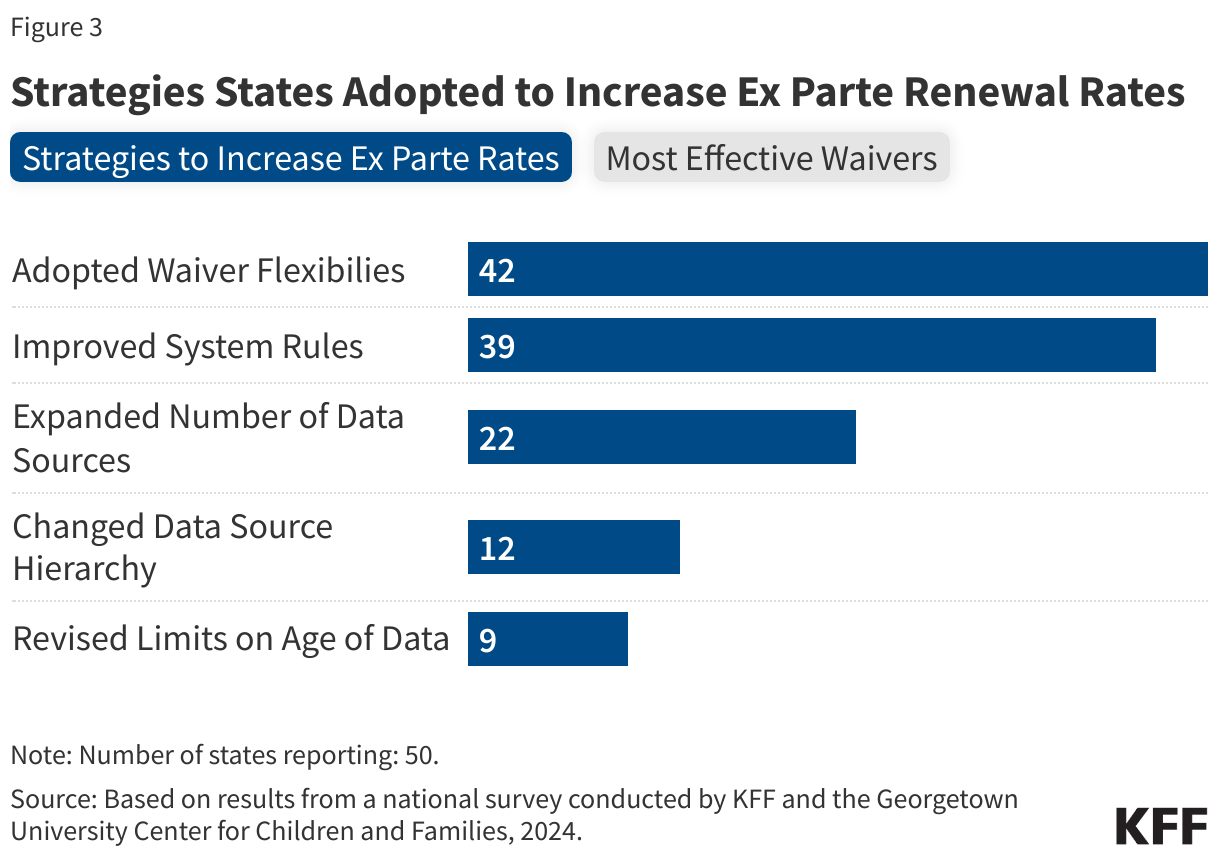
Over the past two years, all states have taken at least one action to improve ex parte renewal rates. Forty-two states adopted waiver flexibilities, while 39 states updated system rules and 22 states expanded the number of data sources they use to conduct ex parte reviews (Figure 3). A dozen states changed the order in which the state accesses various data sources to increase the number of reviews that produce a data match, and nine states revised limits on the age of data used to improve ex parte renewal rates. Among the 42 states that adopted 1902(e)(14)(A) waivers to increase ex parte rates for MAGI populations, nearly all (37) states reported that the flexibility allowing for ex parte renewals for individuals with $0 income in some circumstances was among the most helpful waivers. Other waivers that states said were most helpful were using SNAP eligibility to confirm ongoing Medicaid eligibility (26 states) and allowing ex parte renewals for individuals with low-income (23 states).
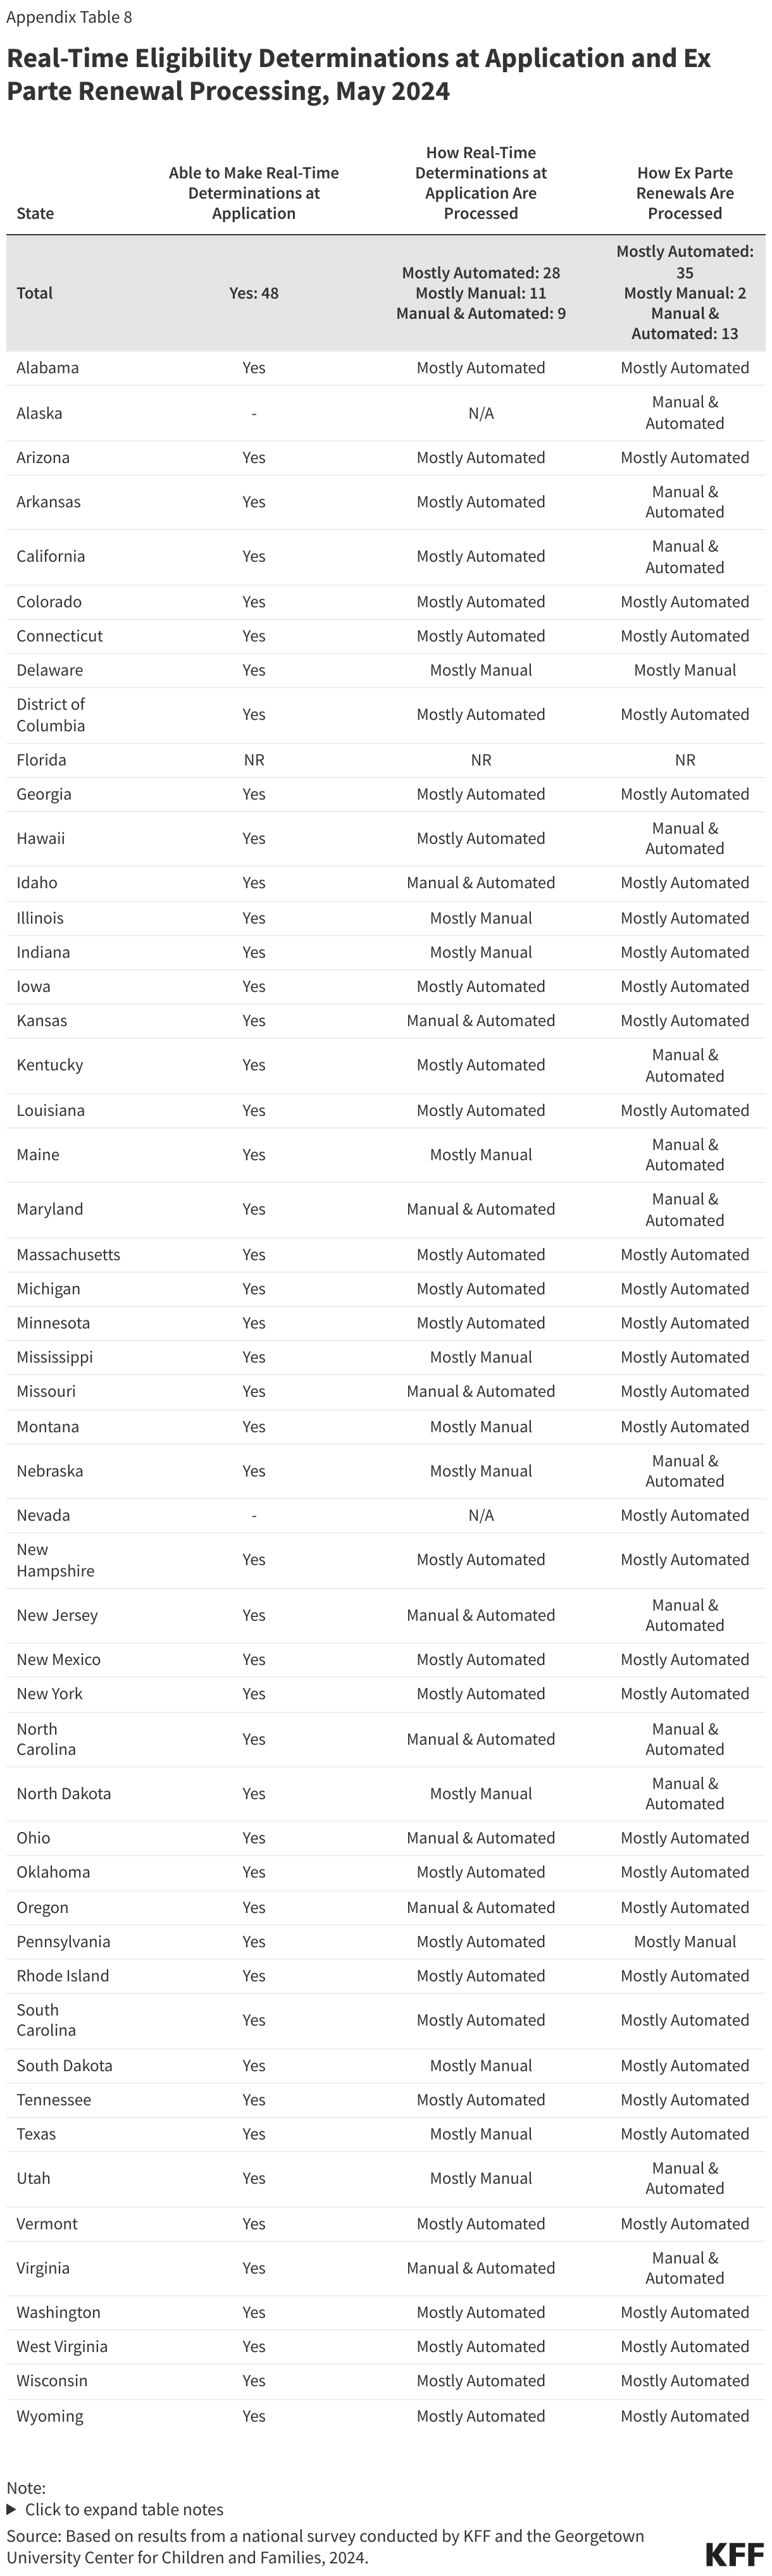
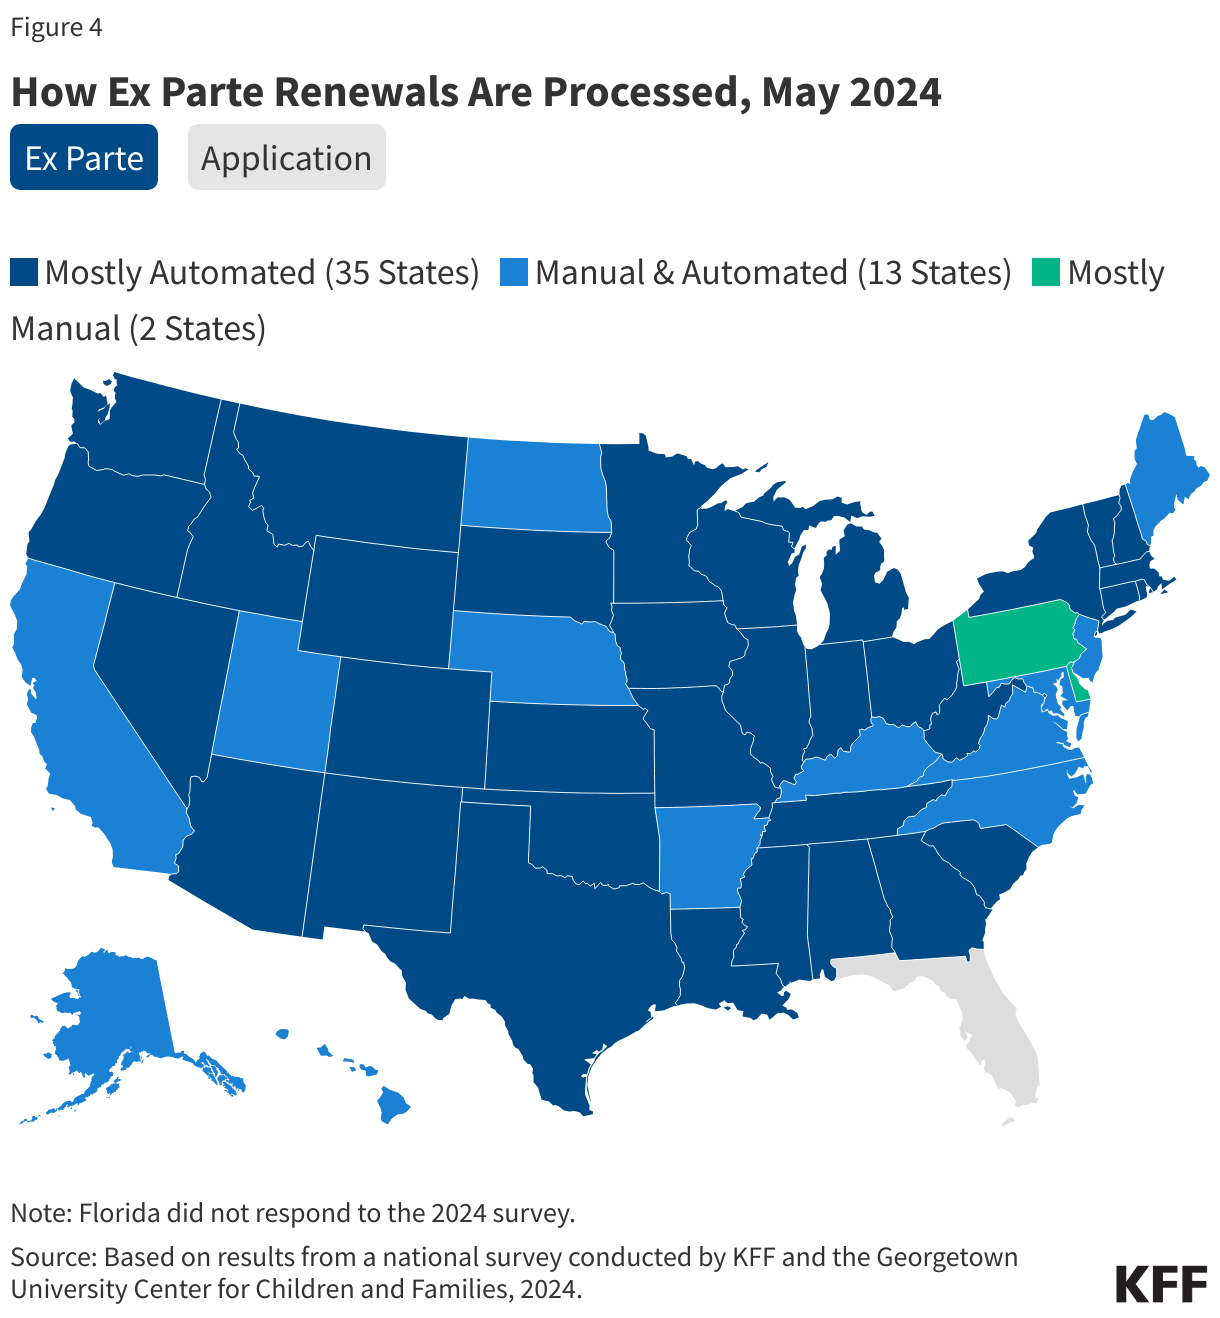
The unwinding has accelerated state efforts to automate ex parte renewals, with 48 states reporting that most or some renewals are conducted by the system, including 35 states that have mostly automated ex parte renewals (Figure 4). Only two states (Delaware and Pennsylvania) report largely manual ex parte processes. However, fewer states report mostly automated processing of applications. While 48 states are able to determine eligibility in real-time at application (defined as 24 hours or less), only 37 states indicate that most or some real-time determinations of new applications are processed automatically by the eligibility system. The remaining 11 states report manual processes for real-time determinations at application, which generally only occur when an individual applies in person or by phone and the eligibility worker can verify eligibility immediately.
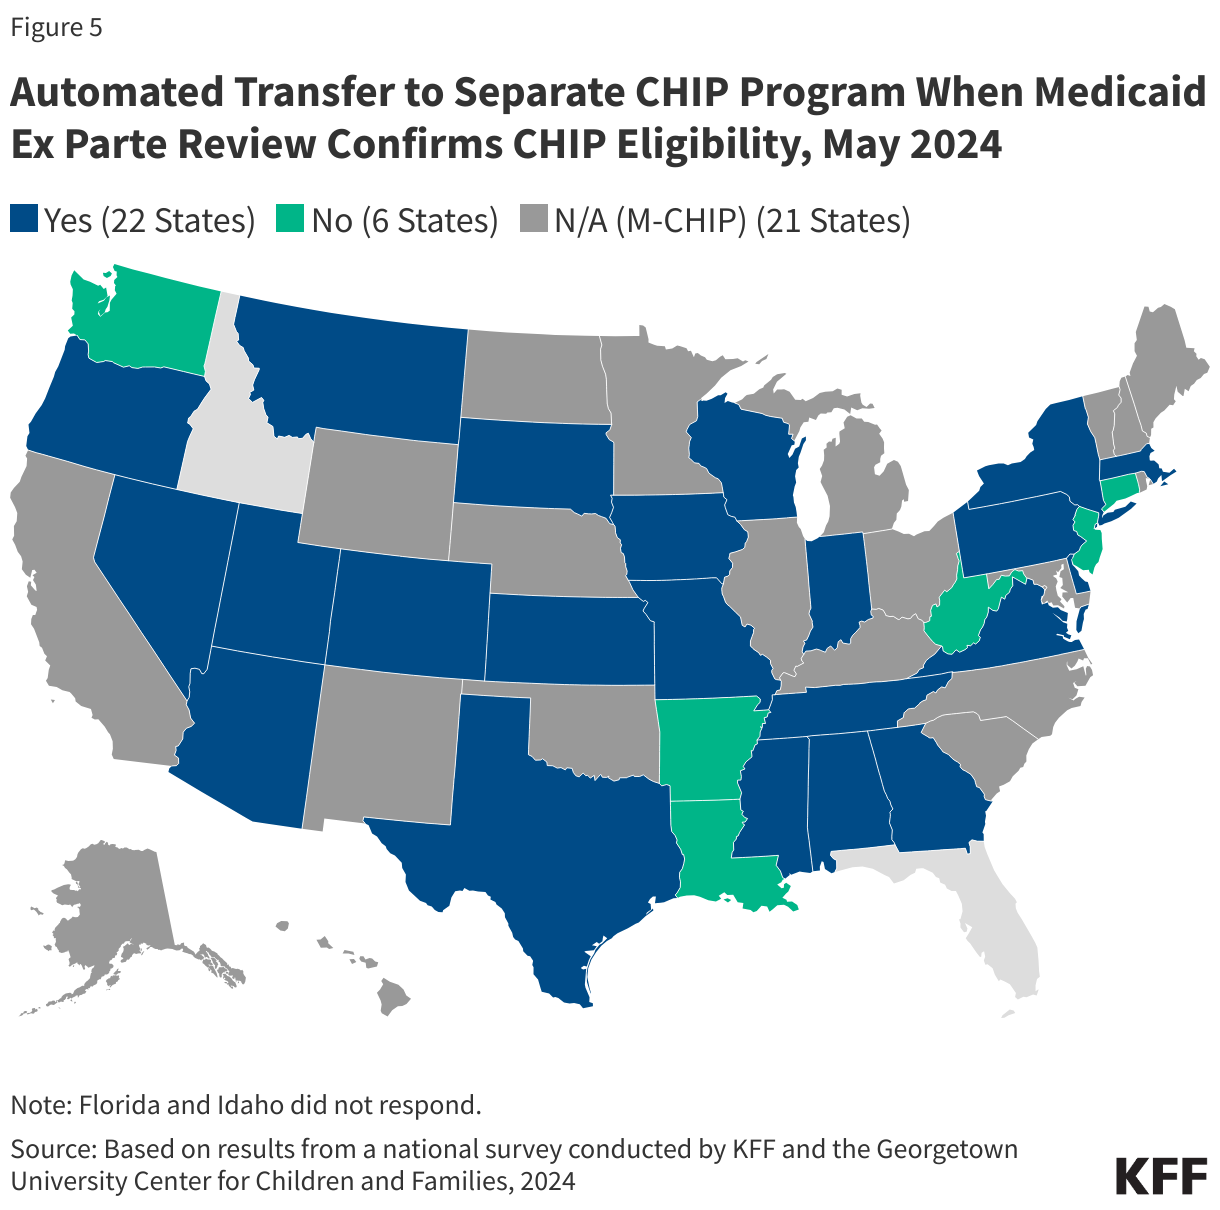
Although not required to do so, 22 of the 28 reporting states that operate separate CHIP programs transition a child enrolled in Medicaid to CHIP if the state has reliable data through the ex parte process that verifies the child’s eligibility for CHIP (Figure 5). In contrast, seven states do not transfer children from Medicaid to the state’s separate CHIP program if the family does not return the Medicaid renewal form. Automatically transferring an eligible child from Medicaid to the separate CHIP can help promote continuity of coverage for children. The recently finalized Eligibility and Enrollment Rule requires states to ensure seamless transitions between Medicaid and CHIP effective June 4, 2024.
| Streamlining the Medicaid, Children’s Health Insurance Program and Basic Health Program Application, Eligibility Determination, Enrollment, and Renewal Processes Final Rule On April 2, 2024, the CMS published the second part of a two-part final rule that simplifies the eligibility and enrollment processes for Medicaid, the Children’s Health Insurance Program (CHIP), and the Basic Health Program (BHP). The first part was finalized earlier and addresses enrollment barriers in the Medicare Savings Program (MSP), a non-MAGI coverage group, which allows states to cover the cost of Medicare premiums for low-income seniors and people with disabilities. The second part of the rule addresses several eligibility and enrollment requirements affecting both MAGI and non-MAGI groups.
|
Post-Unwinding
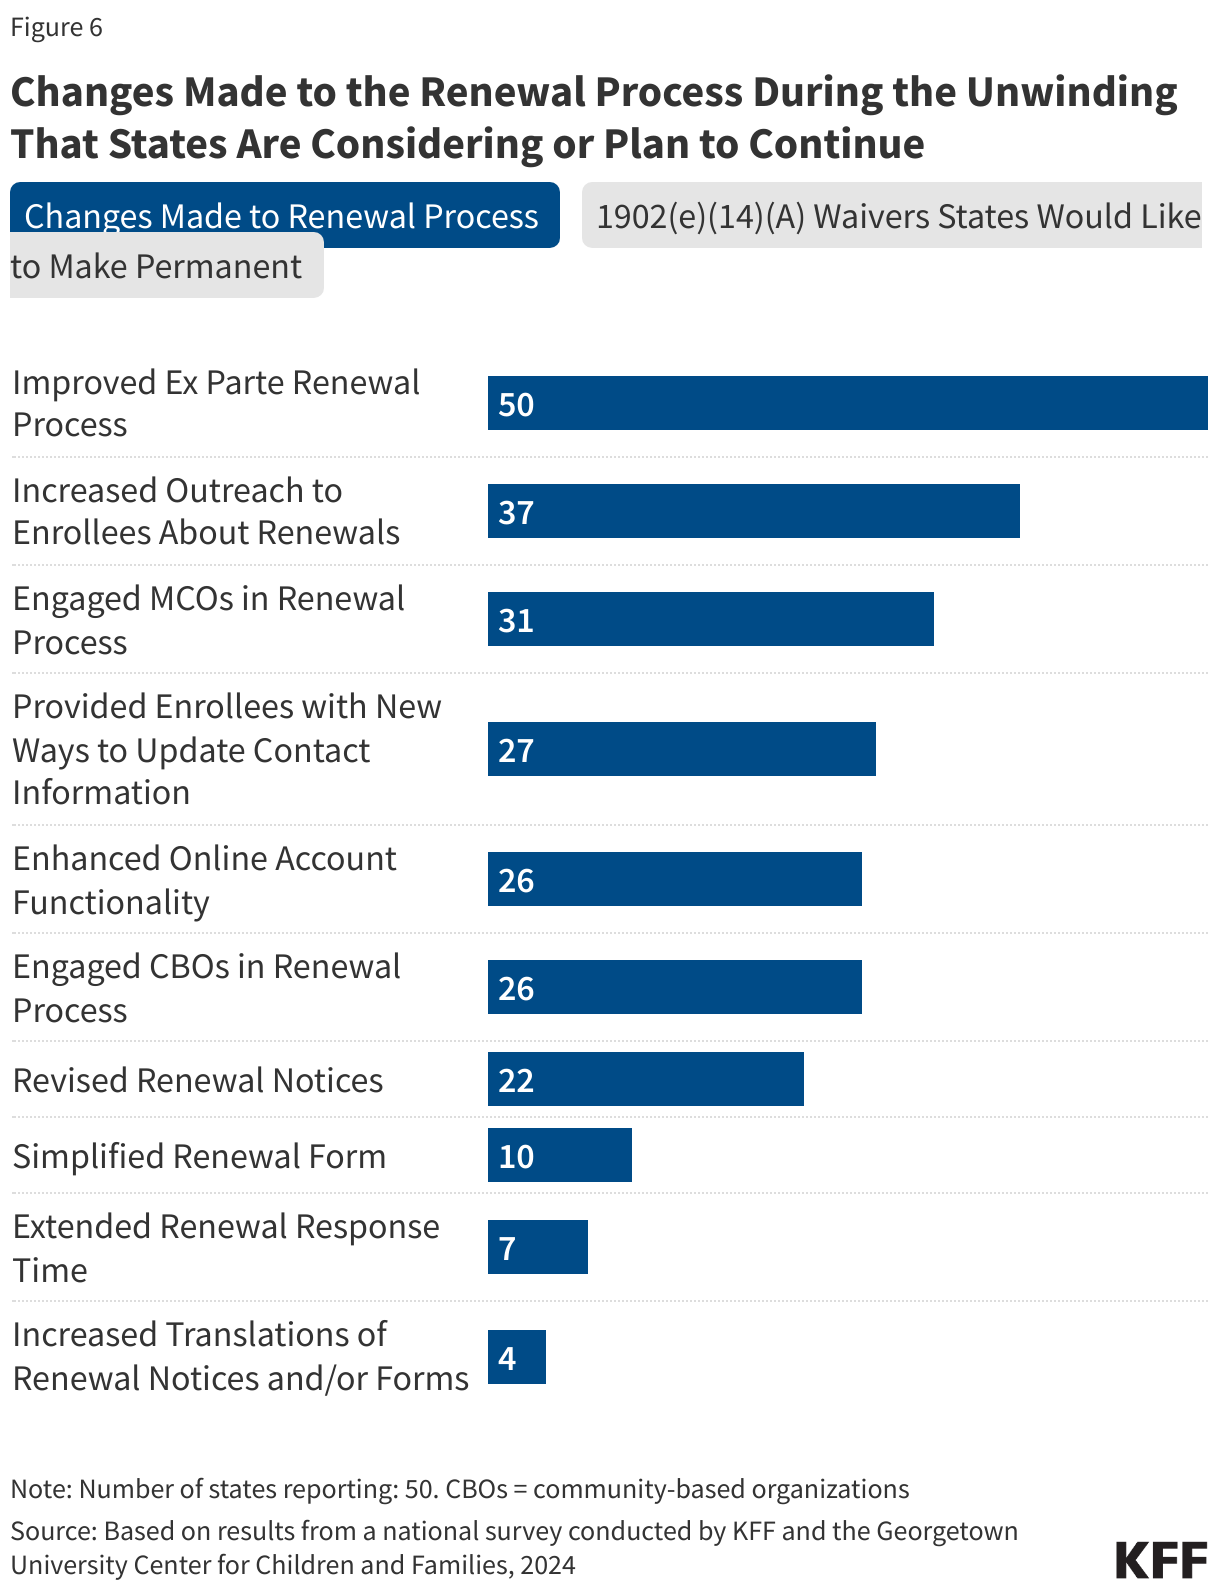
Most states (42) are interested in maintaining 1902(e)(14)(A) waiver flexibilities that have been most useful to streamlining renewal processes and outcomes (Figure 6). The waiver strategies cited by the largest numbers of states – accepting updated contact information as verified from USPS sources (reported by 34 states) and health plans (reported by 29 states) – have already been made permanent through the Eligibility and Enrollment Rule. CMS currently is reviewing all other waiver strategies to determine which can be implemented on a longstanding basis under other authorities. In the meantime, these temporary strategies have been extended through June 2025 to protect enrollees from inappropriate terminations as states complete their unwinding periods and address any backlogs in processing new applications and re-enrollments. Other waiver strategies that states are interested in continuing include enrolling or renewing individuals based on SNAP and/or TANF eligibility (25 states) and renewing coverage when no income data is reported from state data sources (29 states) or reported income is below the poverty level (17 states).
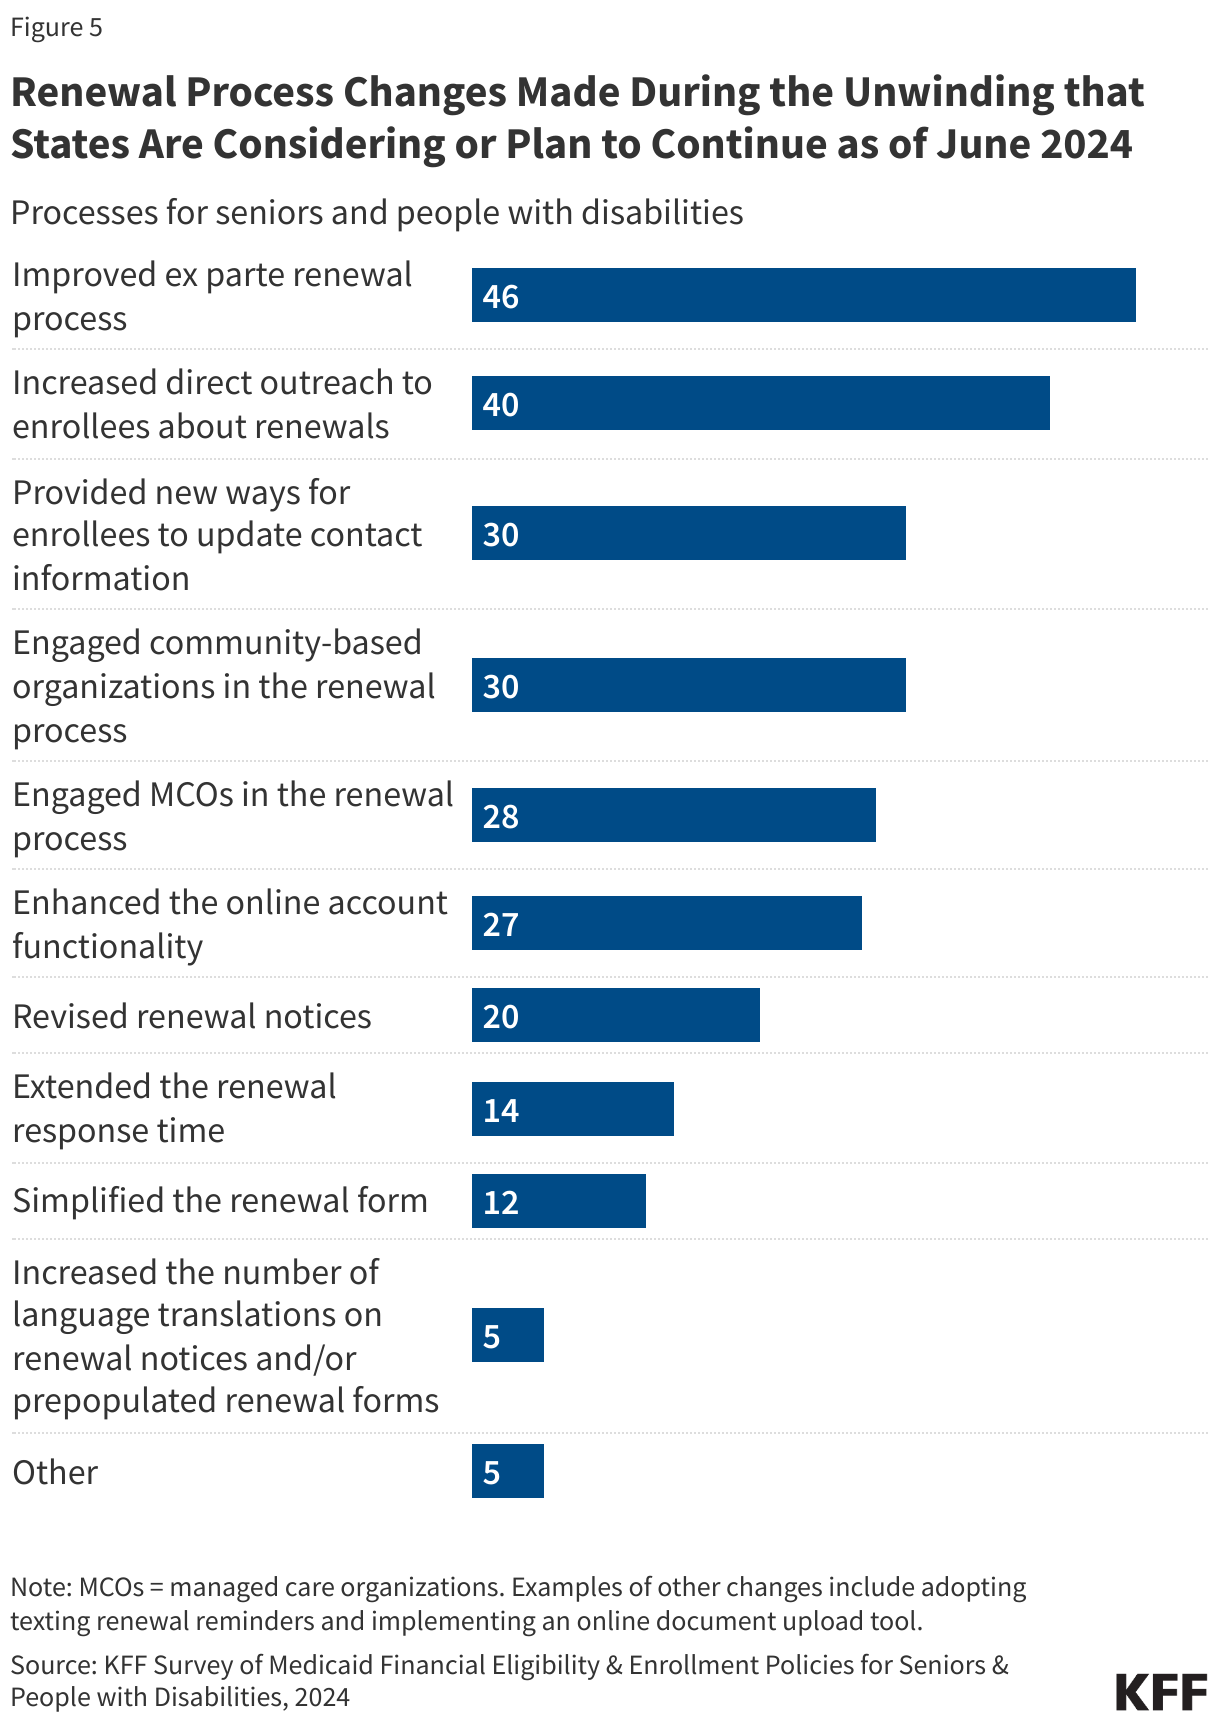
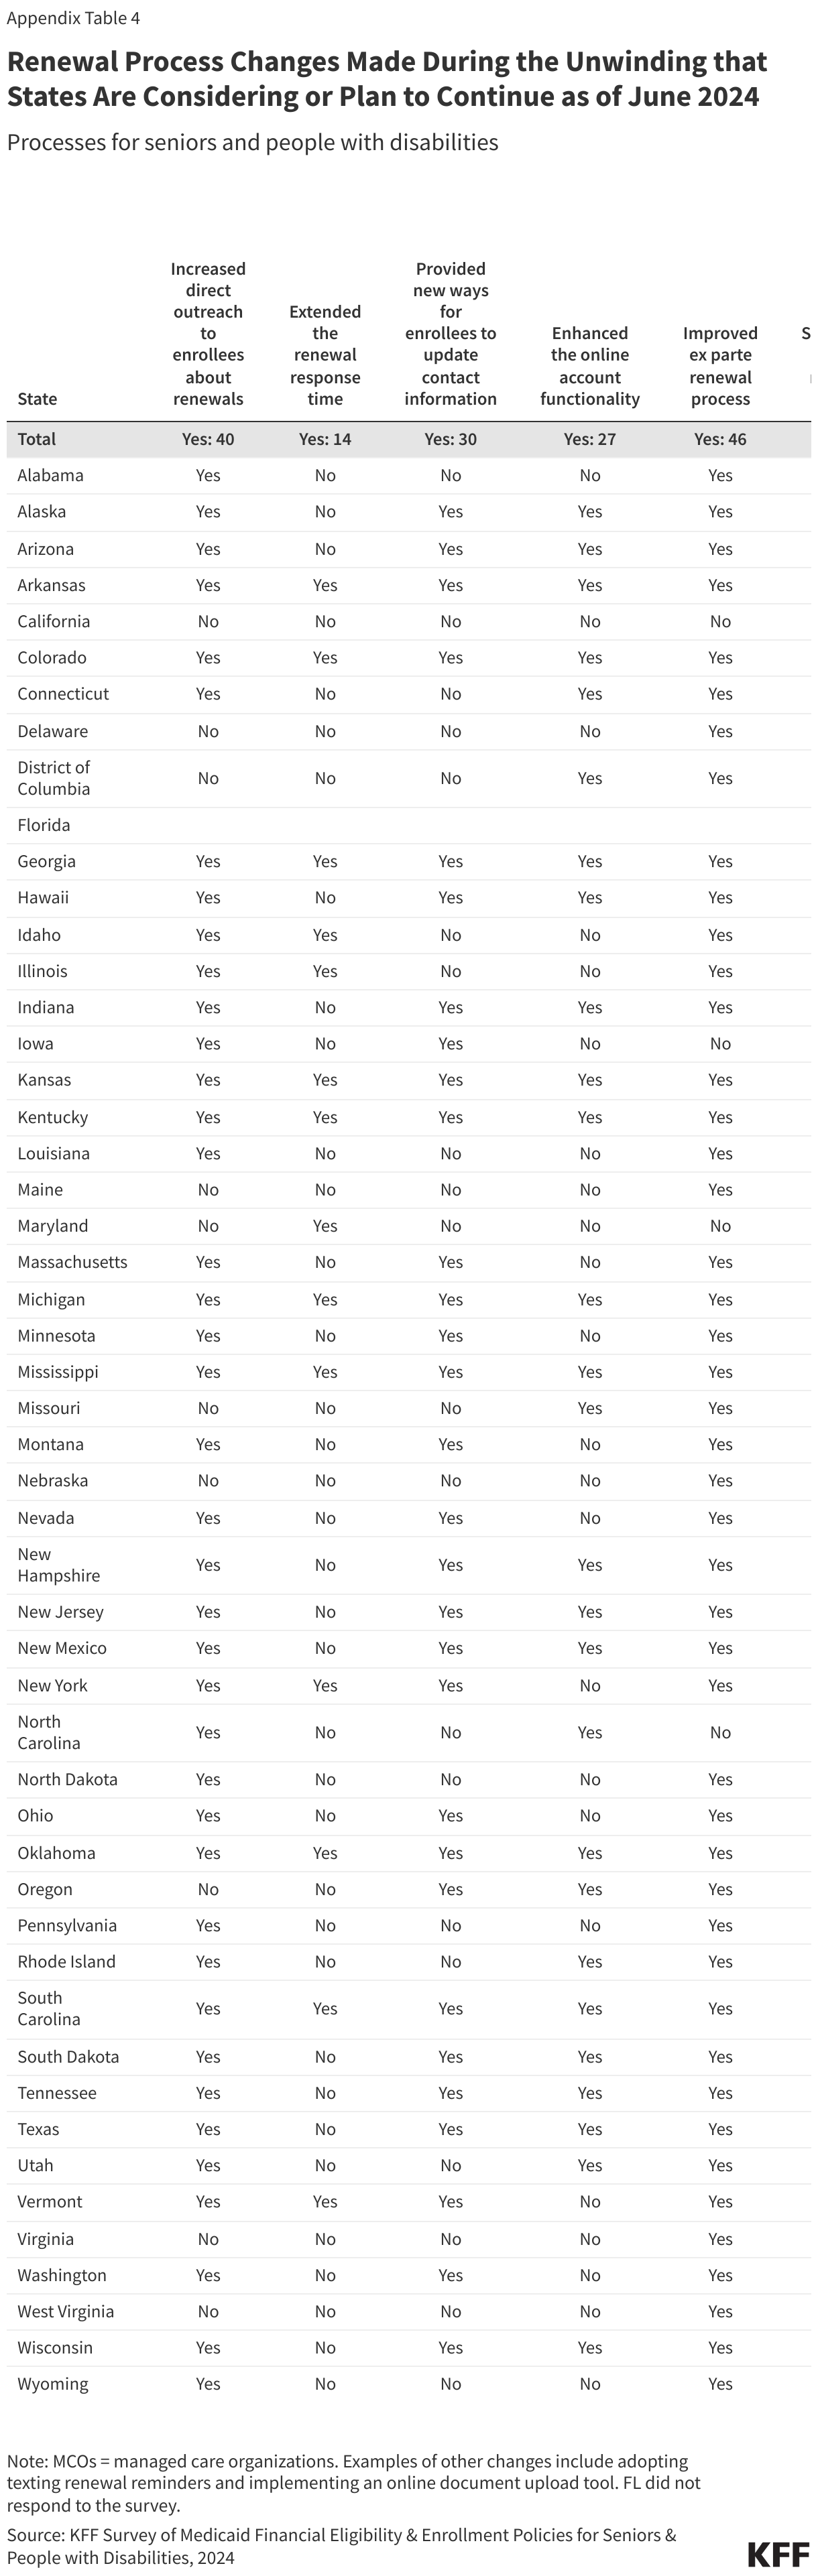
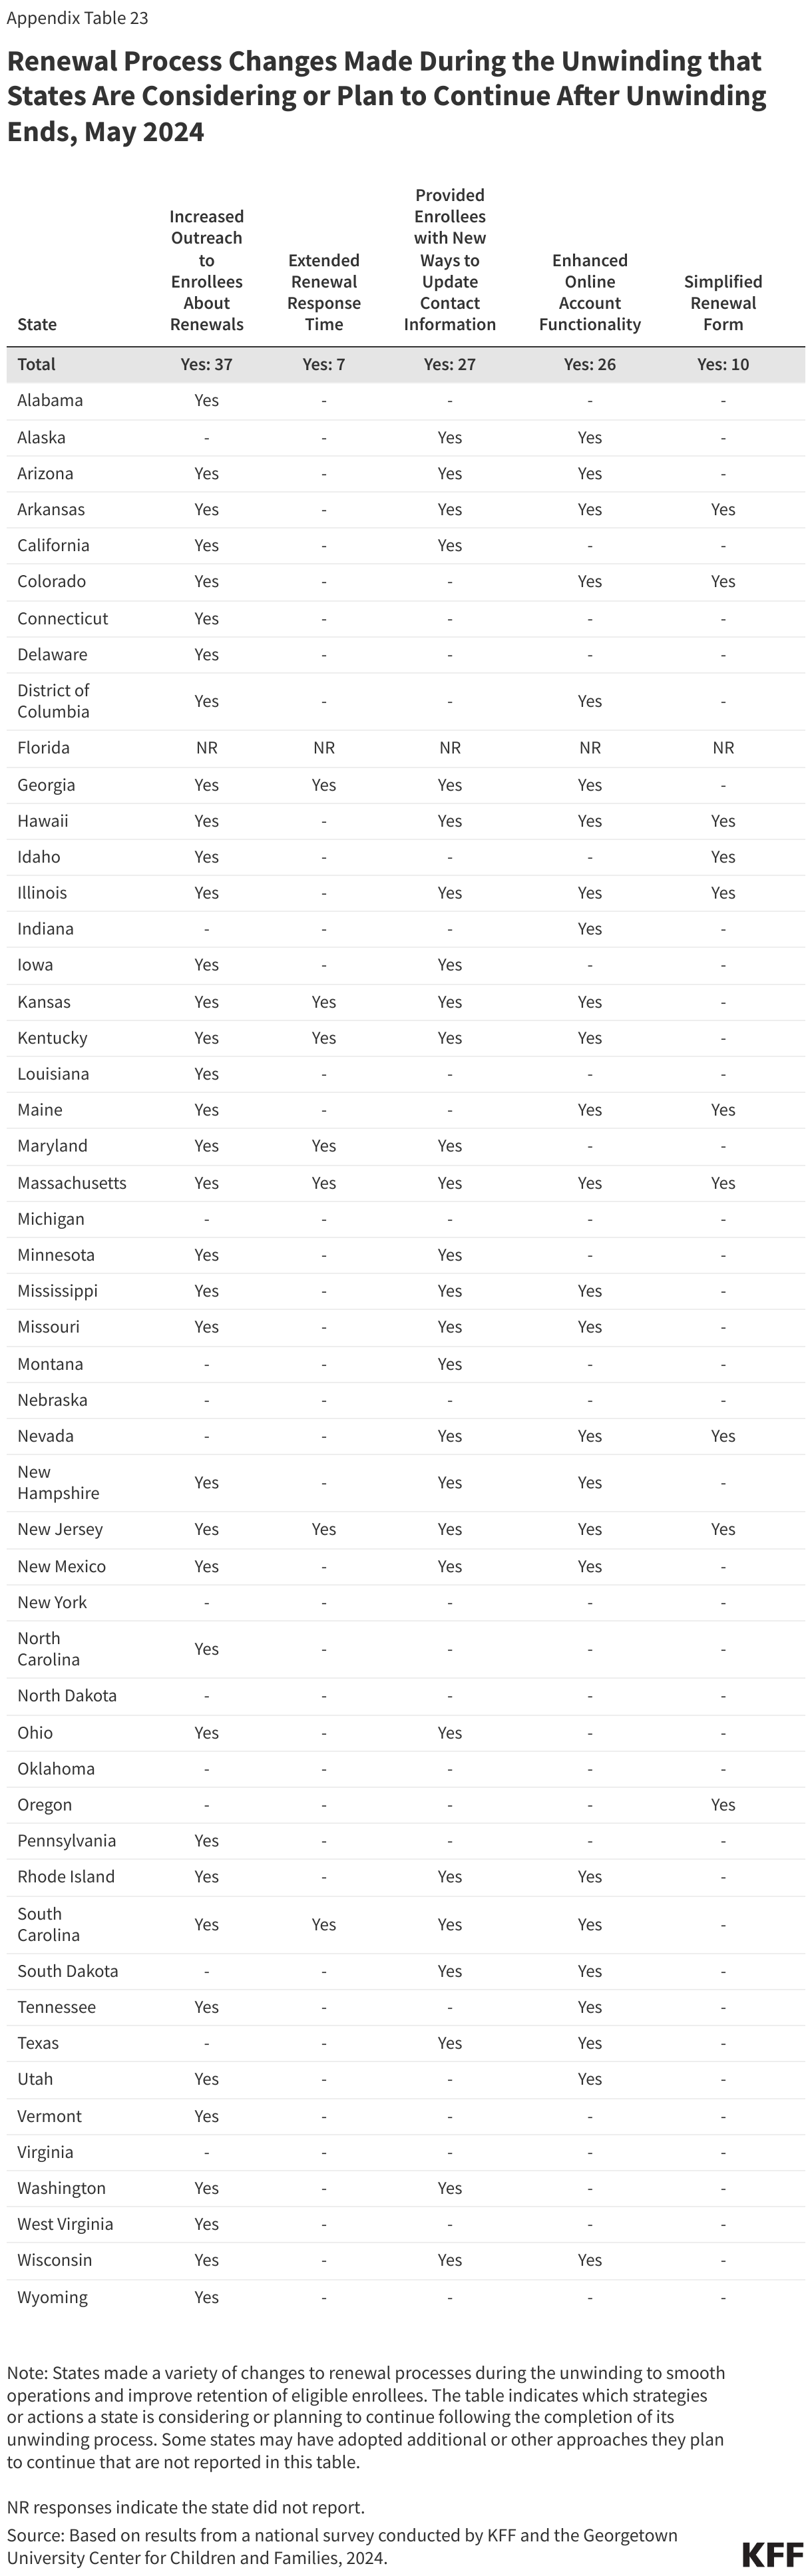
All states boosted communications and/or engagement with community groups, and most are considering or plan to continue many of these changes beyond the unwinding period. Topping the list of strategies to maintain are increased outreach to enrollees (37 states) and engaging health plans in the renewal process (31 states). Half of the states (27) said they plan to maintain new ways for enrollees to update contact information; 26 states plan to both continue engaging community-based organizations in the renewal process and maintain enhanced online account functionality (Figure 6).
Data reporting has been important for monitoring the unwinding, and while half of states were uncertain about continuing to post renewal data or had planned to stop reporting, new guidance from CMS continues monthly renewal outcome reporting. The CAA requires states to report renewal data and for CMS to make the data public but only through June 2024. While these data help CMS quickly pinpoint concerning trends, the 2- to 3-month lag in public posting by CMS makes it less useful for rapid response by Medicaid stakeholders. Nonetheless, this is the first time that comparable renewal data for all states have been publicly available. Medicaid stakeholders can access the state’s unwinding data on a timelier basis in 42 states that post their own data. At the time the survey was fielded, only 15 of those states confirmed that they were planning to continue posting these data after the unwinding period ends while 22 states were uncertain, and five states responded that they would not continue posting the data. However, on May 30, 2024, CMS released additional guidance stating that states are expected to continue reporting monthly renewal outcomes data to CMS, along with other metrics related to applications and fair hearings. CMS also encouraged states to maintain public dashboards and timelier posting of data after the unwinding period ends.
About a third of states (17) report that enhanced efforts to update enrollee contact information helped reduce returned mail rates while most states (30) did not have data to confirm. The CAA required states to update enrollee contact information and make a good faith effort to address returned mail; similar requirements will become permanent in December 2025 under the Eligibility and Enrollment Rule. States must implement (or retain) processes to regularly obtain information and to update contact information from reliable sources without further verification. If information is received from a reliable source, the state must accept the information as reliable, update the case record, and notify the enrollee of the change. The rule establishes that reliable data sources include mail returned by the United States Postal Service (USPS) with an in-state forwarding address; the USPS National Change of Address (NCOA) database; contracted managed care organizations, prepaid health plans, and primary care case management entities (PCCM); and other data sources identified by the agency and approved by the Secretary.
Lessons Learned
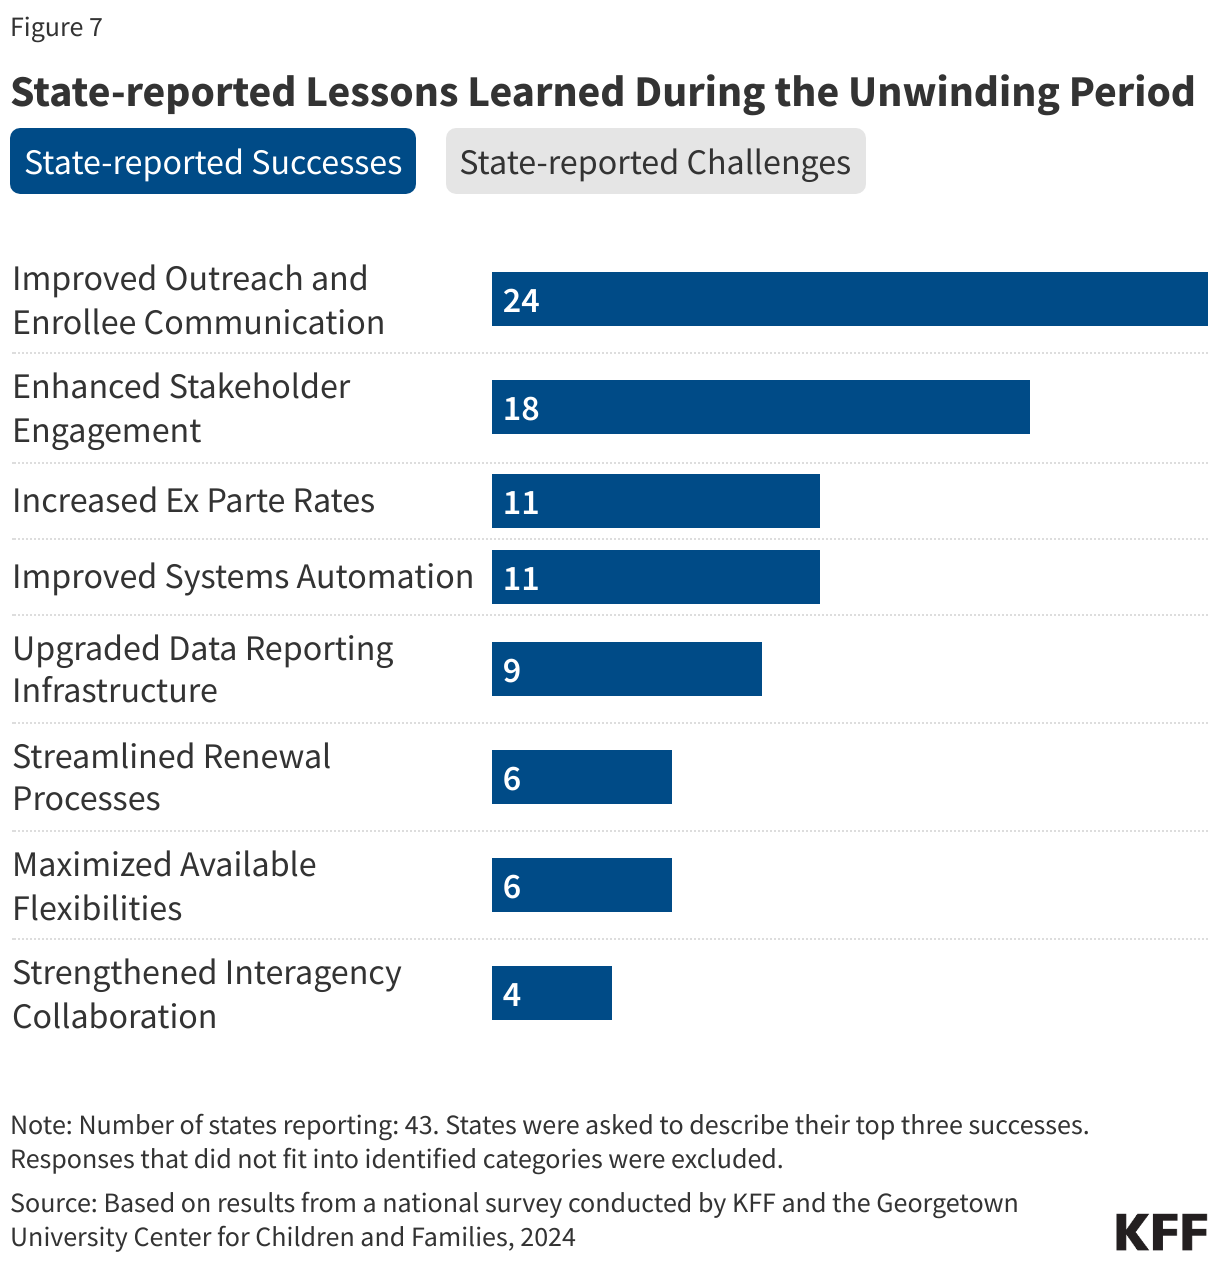
States cited changing or unclear federal guidance, workforce challenges, and the sheer volume of work as the top three challenges they faced during the unwinding (Figure 7). Other challenges centered on systems issues—the need to make systems changes and/or upgrades quickly to respond to the changing landscape or to implement new renewal flexibilities and limitations or problems with their existing system that hindered states’ ability to process renewals efficiently. States also noted challenges with engaging enrollees in the renewal process and communicating effectively about the renewal requirements and process.
Despite the challenges states faced, they made many changes to simplify and improve the renewal process, including improved outreach and enrollee communication, improved engagement with stakeholders and community organizations, and increased ex parte renewal rates (Figure 7). States also noted Improved systems automation and building the infrastructure for data reporting and transparency as significant accomplishments as well as streamlined renewal processes.
(Back to top)
Systems and Enrollment Processes
Eligibility System Integration and Administration
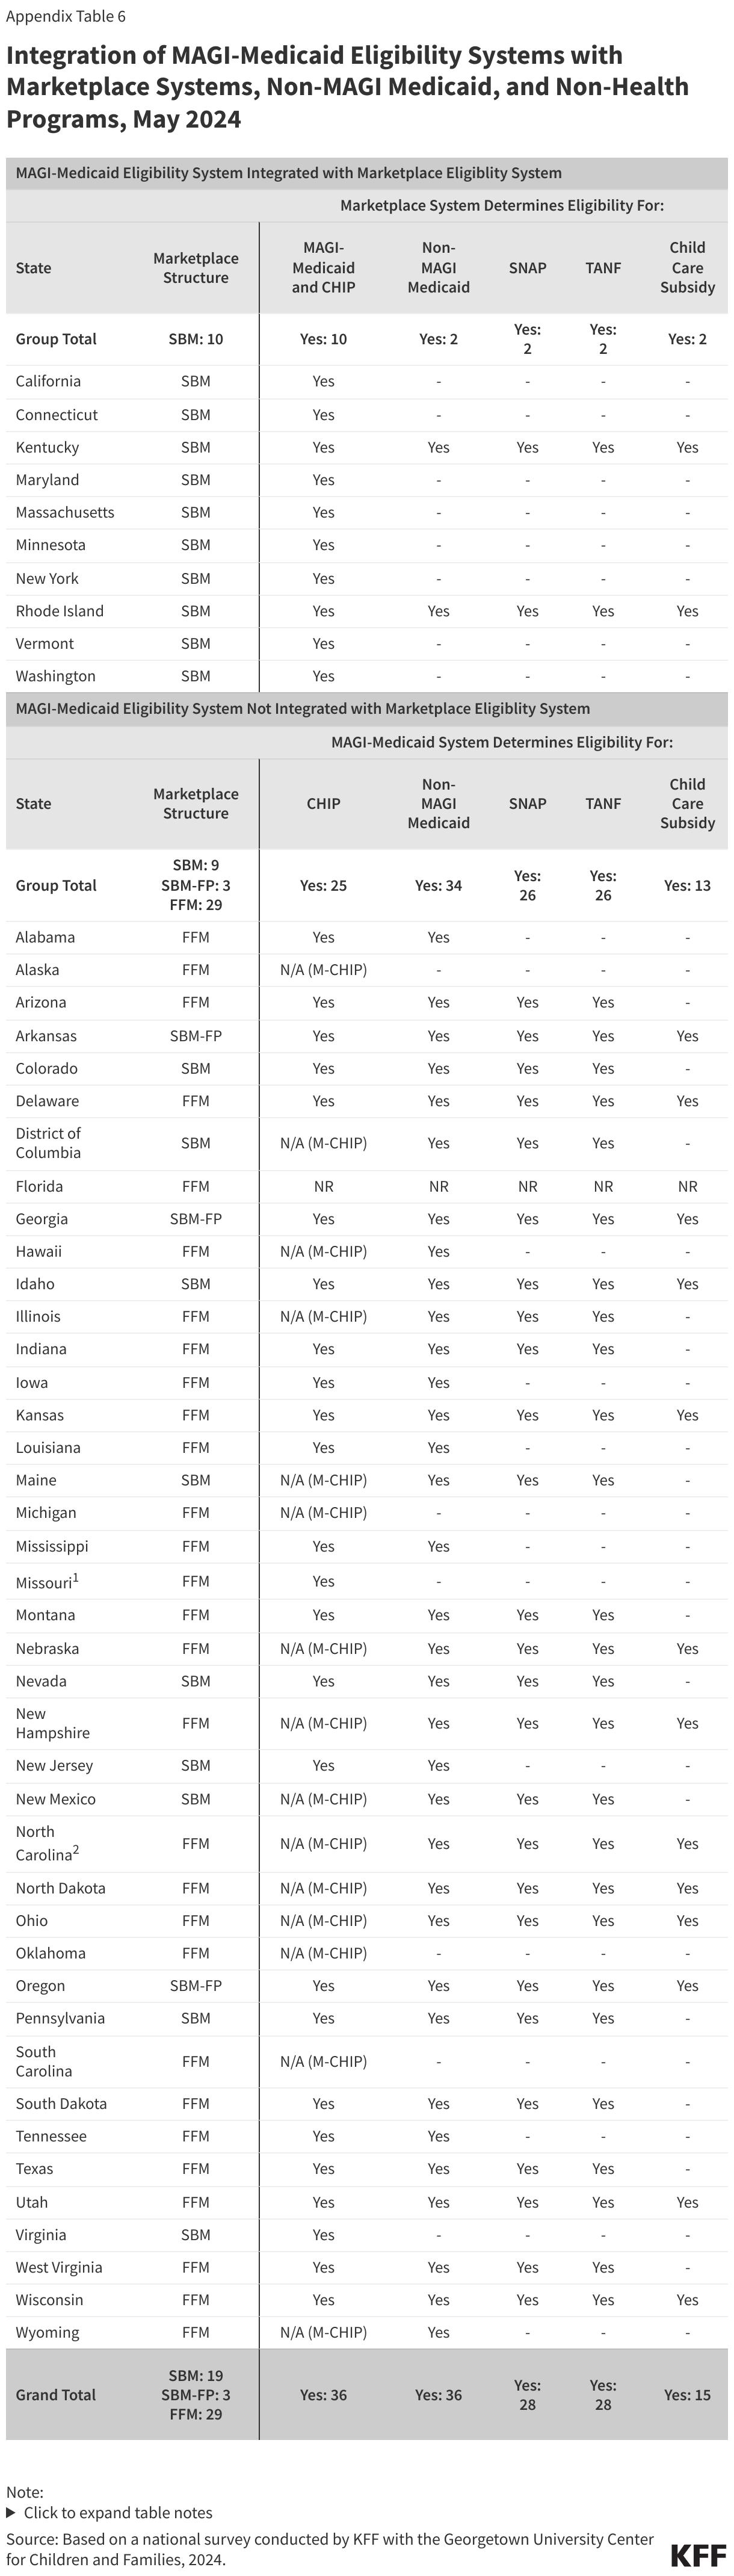
Twenty-two states operate their own State-Based Marketplaces (SBM) but only ten of those states have integrated Medicaid and CHIP into their SBM eligibility systems (Figure 8). Nine SBM states operate an SBM eligibility system that is separate from the MAGI-Medicaid system and three SBM states (Arkansas, Georgia, and Oregon) use the Federally-Facilitated Marketplace (FFM) system – Healthcare.gov – along with the 29 states that rely solely on the federal marketplace. Of the 32 states that use the FFM, nine states (Alabama, Alaska, Arkansas, Louisiana, Missouri, Montana, North Carolina, West Virginia, and Wyoming) accept a Medicaid determination from the FFM based on the state’s eligibility rules (though Missouri is only temporarily accepting determinations from the FFM). The remaining states allow the FFM to assess Medicaid eligibility and process an account transfer from the FFM as a new application.
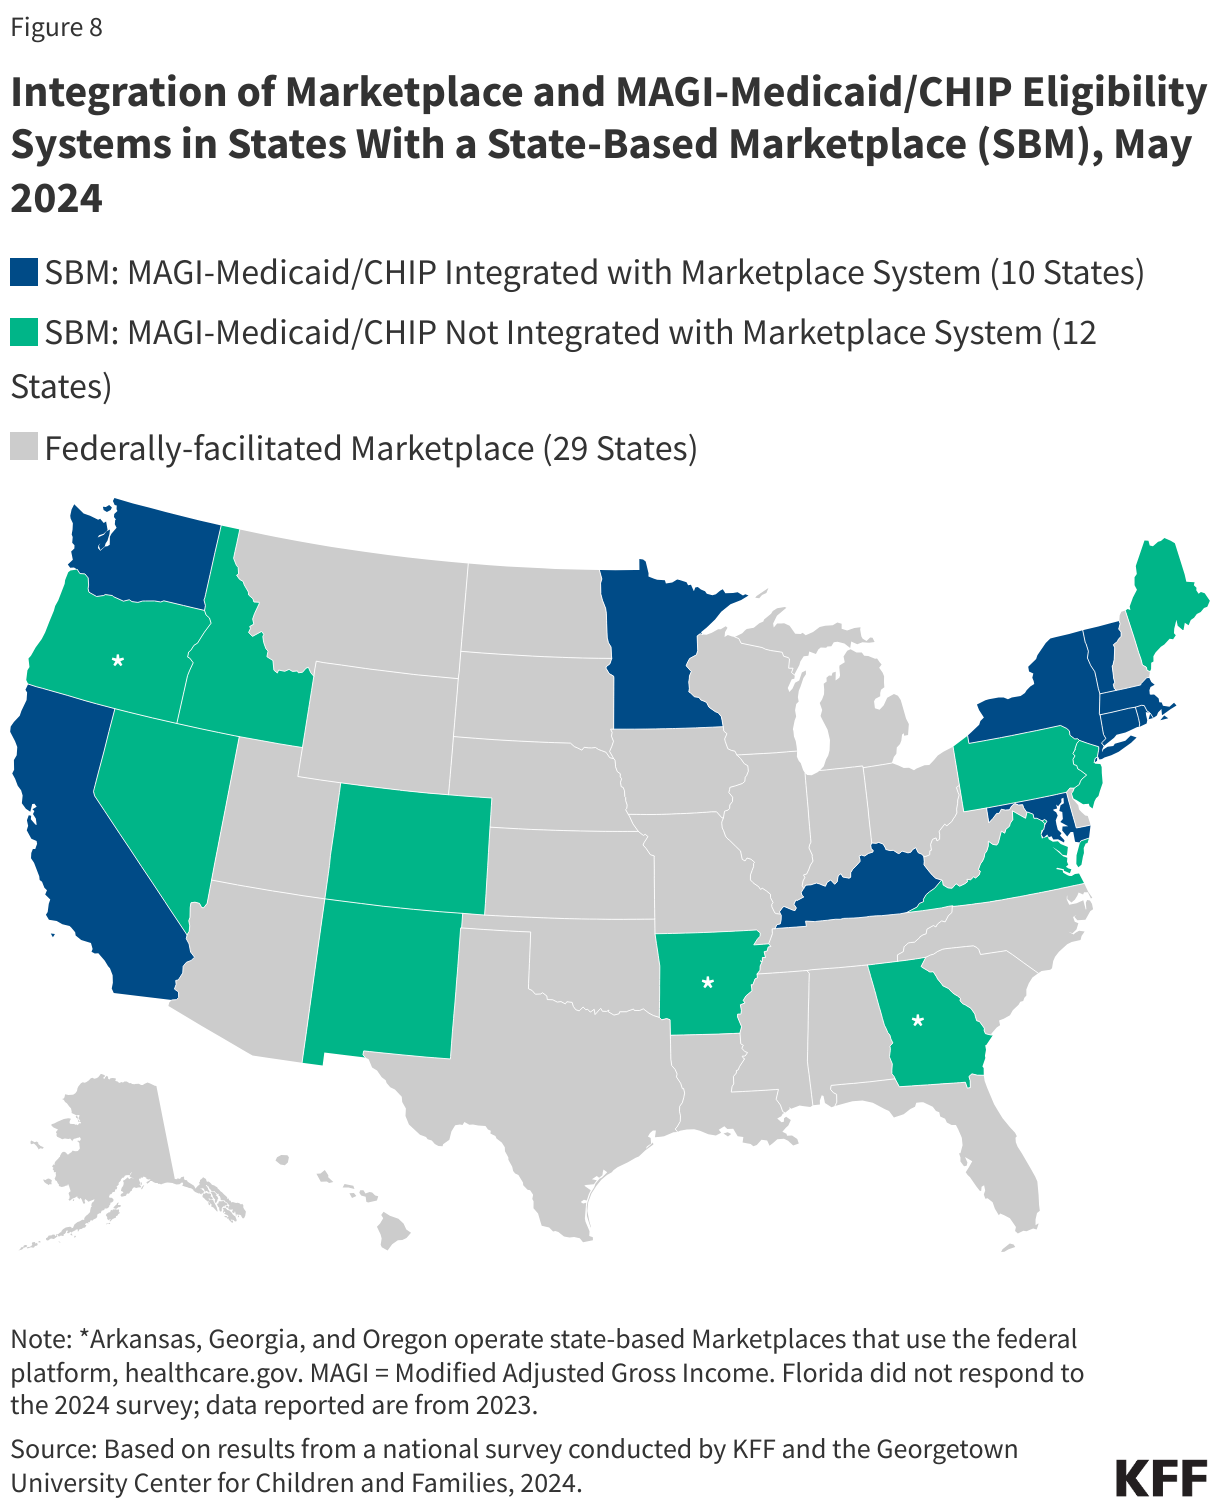
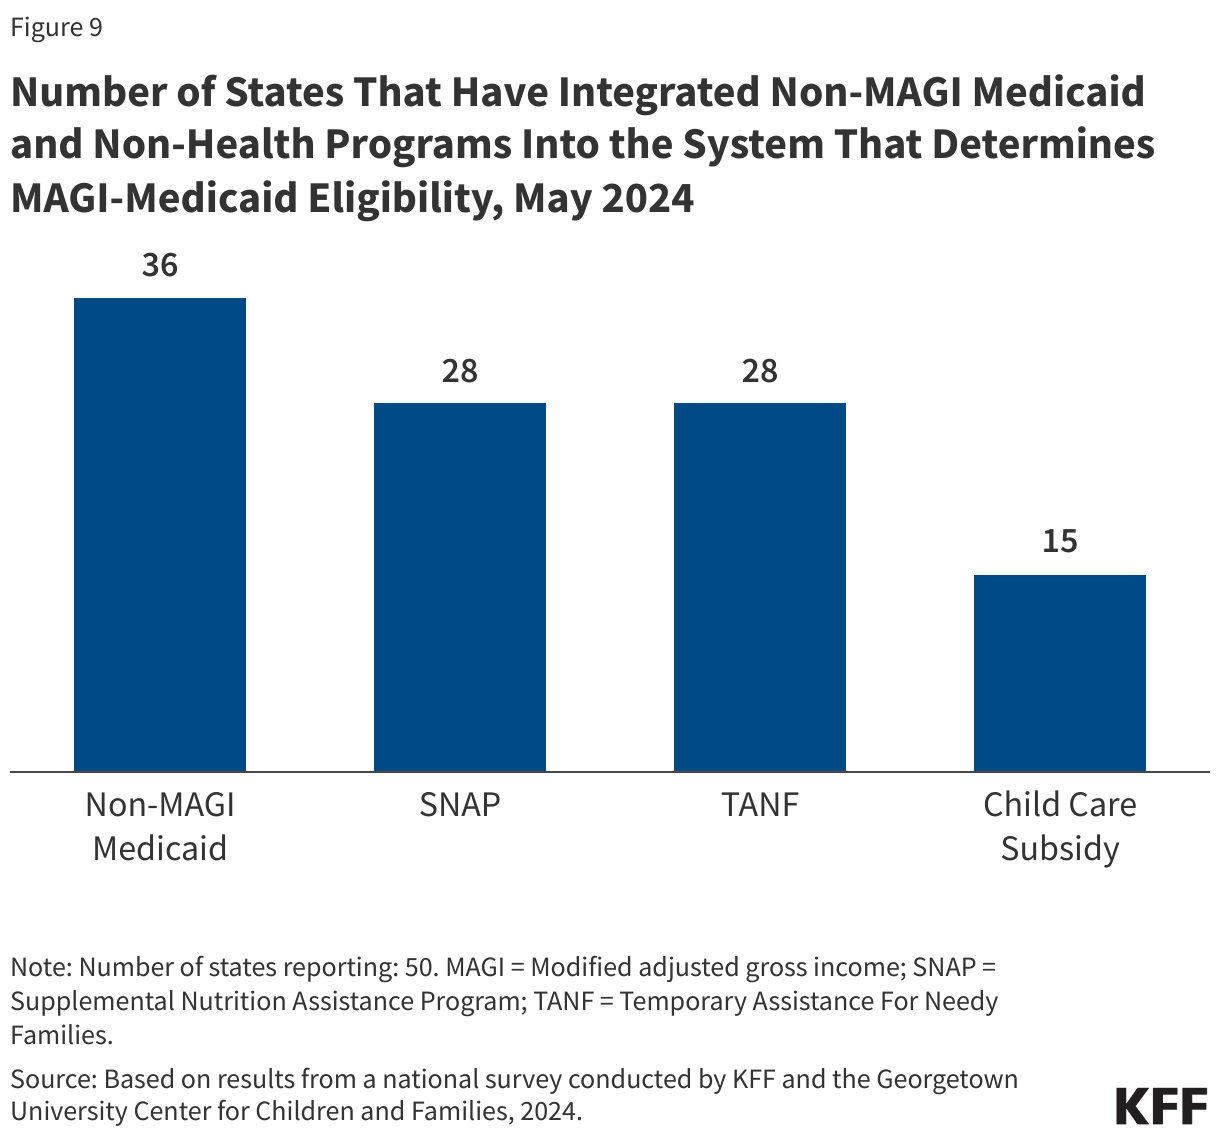
Progress in integrating non-MAGI and non-health programs into the Medicaid and CHIP eligibility system took a back seat to unwinding system changes. In preparing for the unwinding, system changes to facilitate renewals became the highest priority for states. An integrated system makes it easier for individuals to apply for multiple benefits and increases administrative efficiency by aligning eligibility tasks and sharing data. Most states delinked those programs in building new MAGI-based systems required by the ACA but had been making steady progress in re-integrating non-MAGI and non-health programs into their new MAGI-based Medicaid systems. With the priority on system changes needed to manage the unwinding, the count of states with other program eligibility integrated in state MAGI-based eligibility systems remained steady: non-MAGI Medicaid in 36 states; SNAP and TANF in 28 states, and childcare subsidies in 15 states (Figure 9). Of the ten states with an integrated Marketplace and MAGI-based Medicaid system, only Kentucky and Rhode Island have integrated non-MAGI Medicaid and non-health programs into their SBM systems.
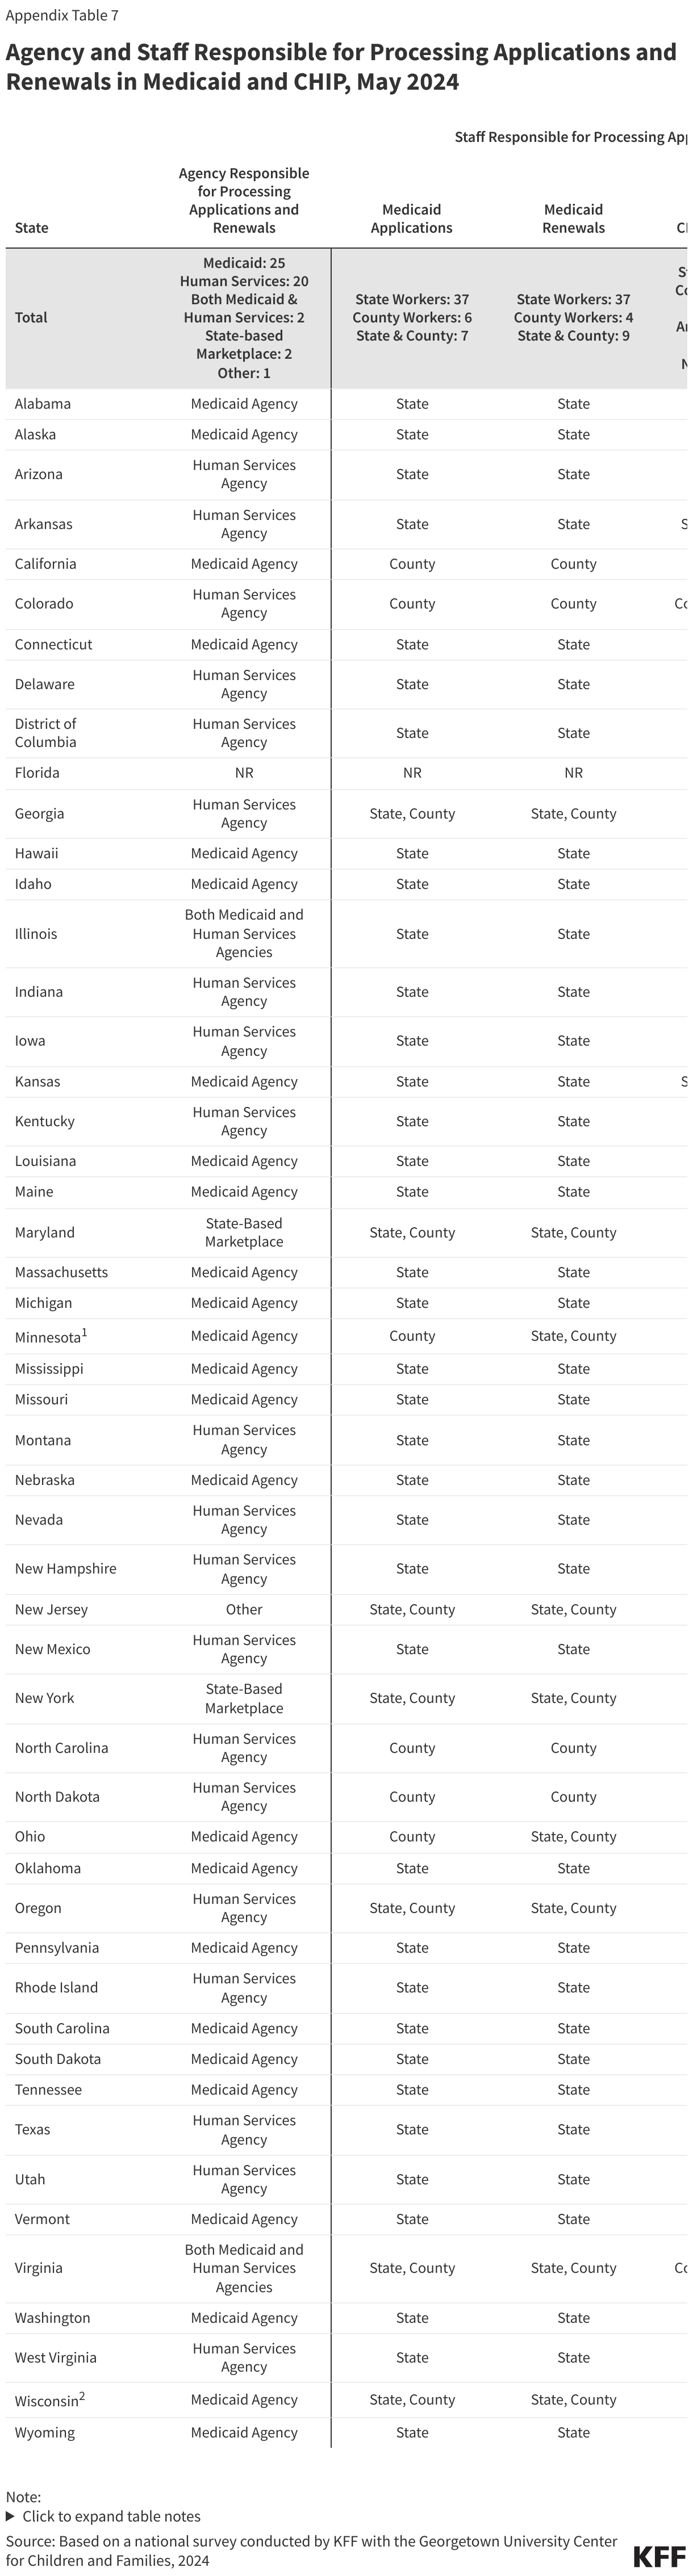
The agency and staff responsible for Medicaid determinations vary across states. While Medicaid agencies can delegate eligibility determinations to another government agency that maintains personnel standards on a merit basis, the Medicaid agency remains responsible for oversight and adherence to federal rules. In 25 states, the Medicaid agency is responsible for processing applications and renewals, while the state’s sister Human Services agency does so in 20 states. In two states (Illinois and Virginia), the responsibility is shared between the two agencies, while the SBM administers Medicaid and CHIP eligibility in Maryland and New York. In 37 states, only state workers process both applications and renewals while a smaller number of states use only county workers for processing applications (6 states) and renewals (4 states). Both state and county workers process Medicaid applications in seven states and renewals in nine states. States may use contractors to assist with administrative tasks related to processing Medicaid applications and renewals but may not delegate determinations to external contractors. With the volume of work during the unwinding period, 29 states reported they currently use contractors to provide administrative support to Medicaid eligibility staff and 21 said they will continue to use contractors when the unwinding period ends.
In 2023, Maine and North Carolina transitioned all child enrollees from the state’s separate CHIP program to a CHIP-funded Medicaid expansion program, bringing the total number of M-CHIP states to 21. Since 2020, a total of five states, including Illinois, Kentucky (which was approved in July 2023 retroactive to July 2022), and Wyoming have transitioned from a separate CHIP to M-CHIP. Rules governing administration of and eligibility processing in separate CHIP programs differ from Medicaid. States may choose to cover all uninsured children eligible for CHIP in Medicaid (known as M-CHIP), through a separate CHIP program only (2 states), or through a combination of a separate CHIP and M-CHIP (28 states). Covering CHIP children in Medicaid streamlines administration and provides all children with child-focused EPSDT Medicaid benefits and other Medicaid protections, including limitations on cost-sharing, while operating a separate CHIP allows states to alter benefit packages and delivery systems and provides more flexibility to impose premiums and cost sharing. Although separate CHIP programs have more flexibility in benefit design, half of the 30 states with separate CHIP programs provide EPSDT benefits to all children.
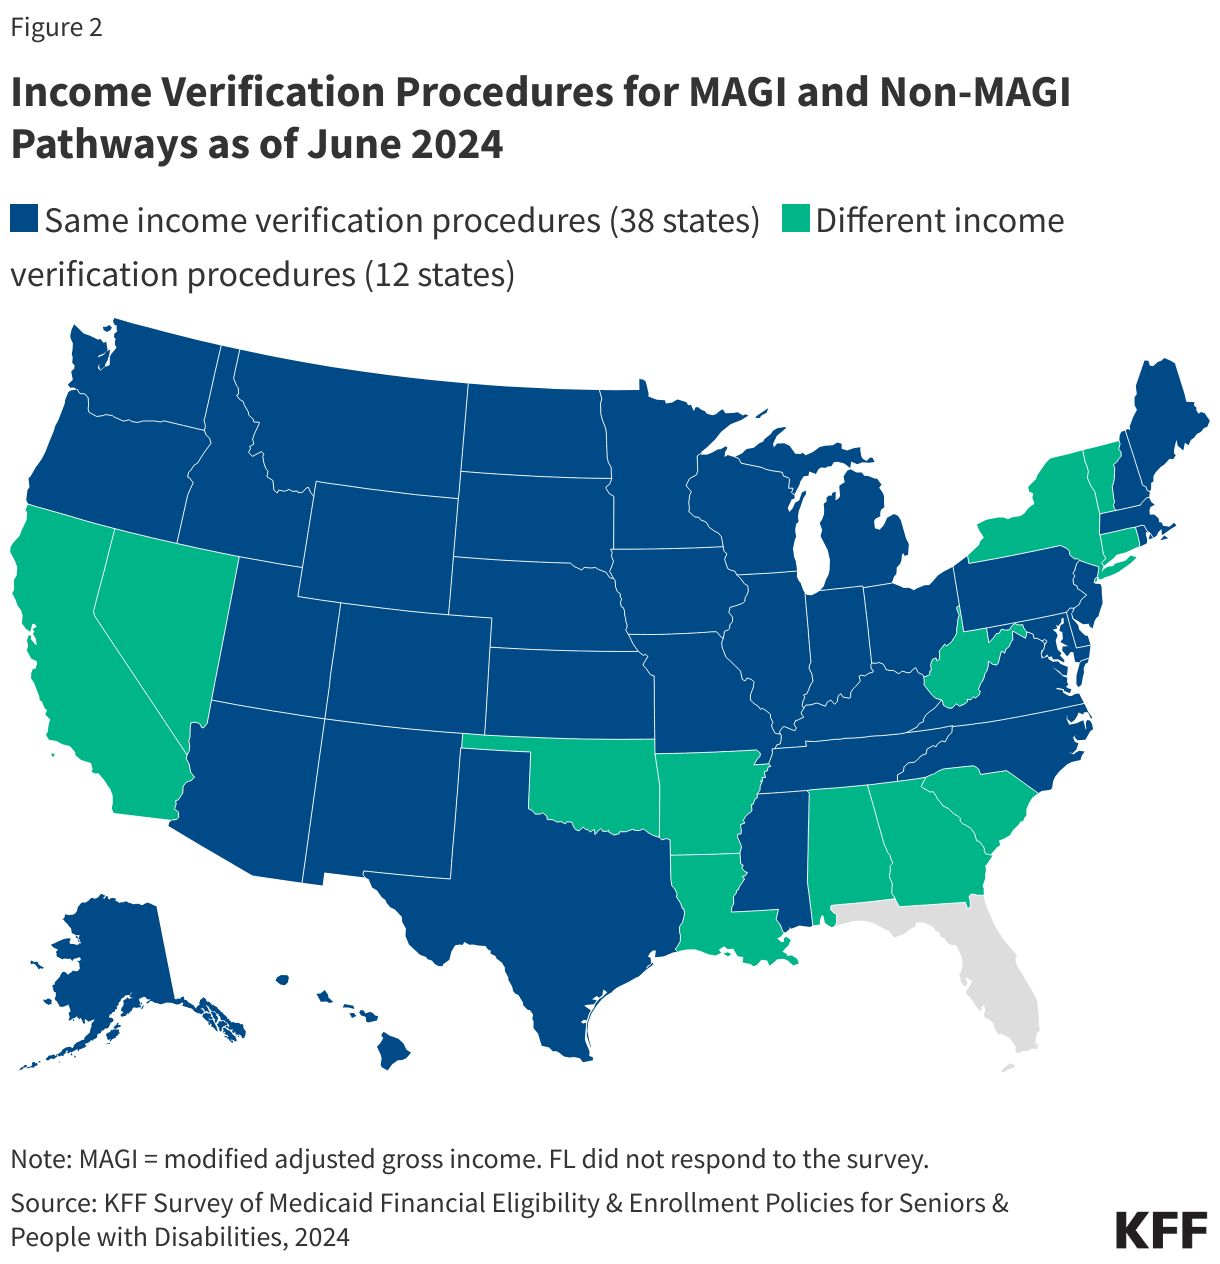
Income Verification
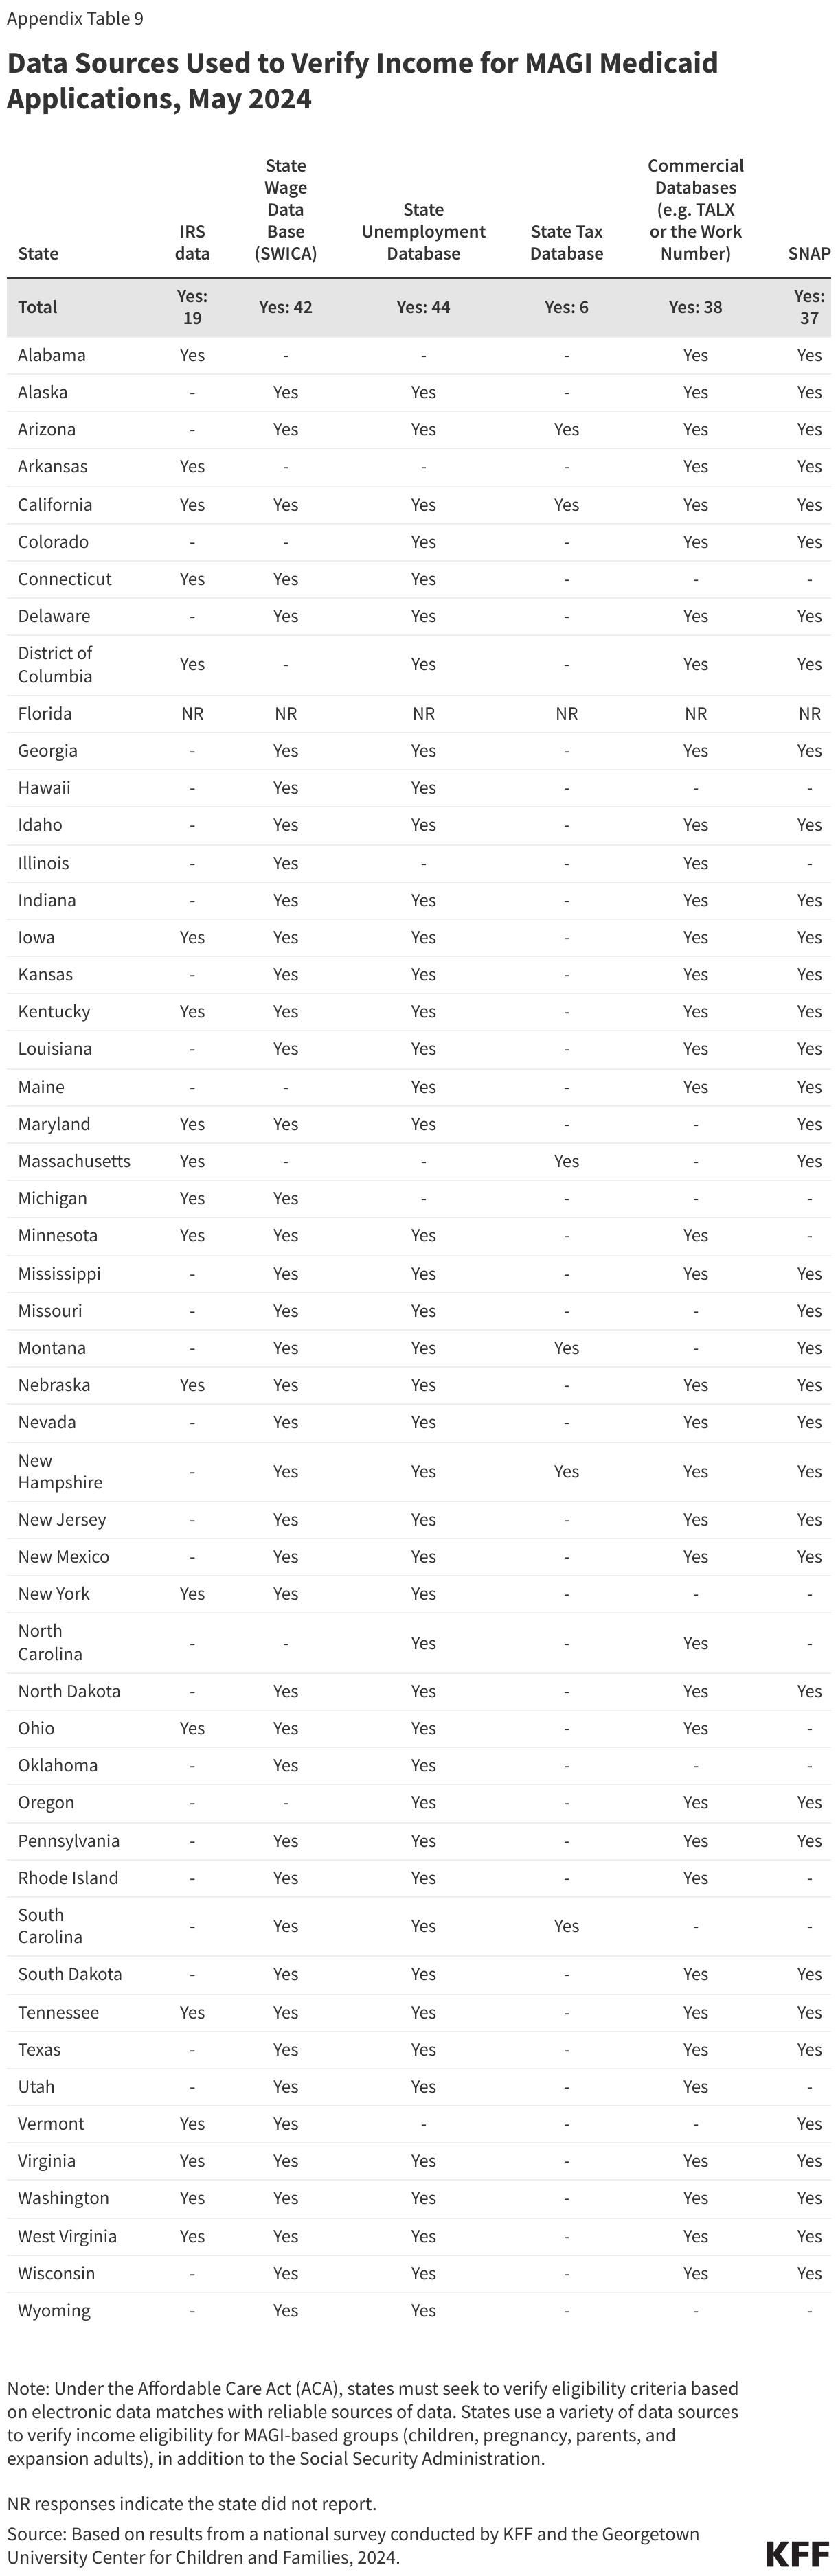
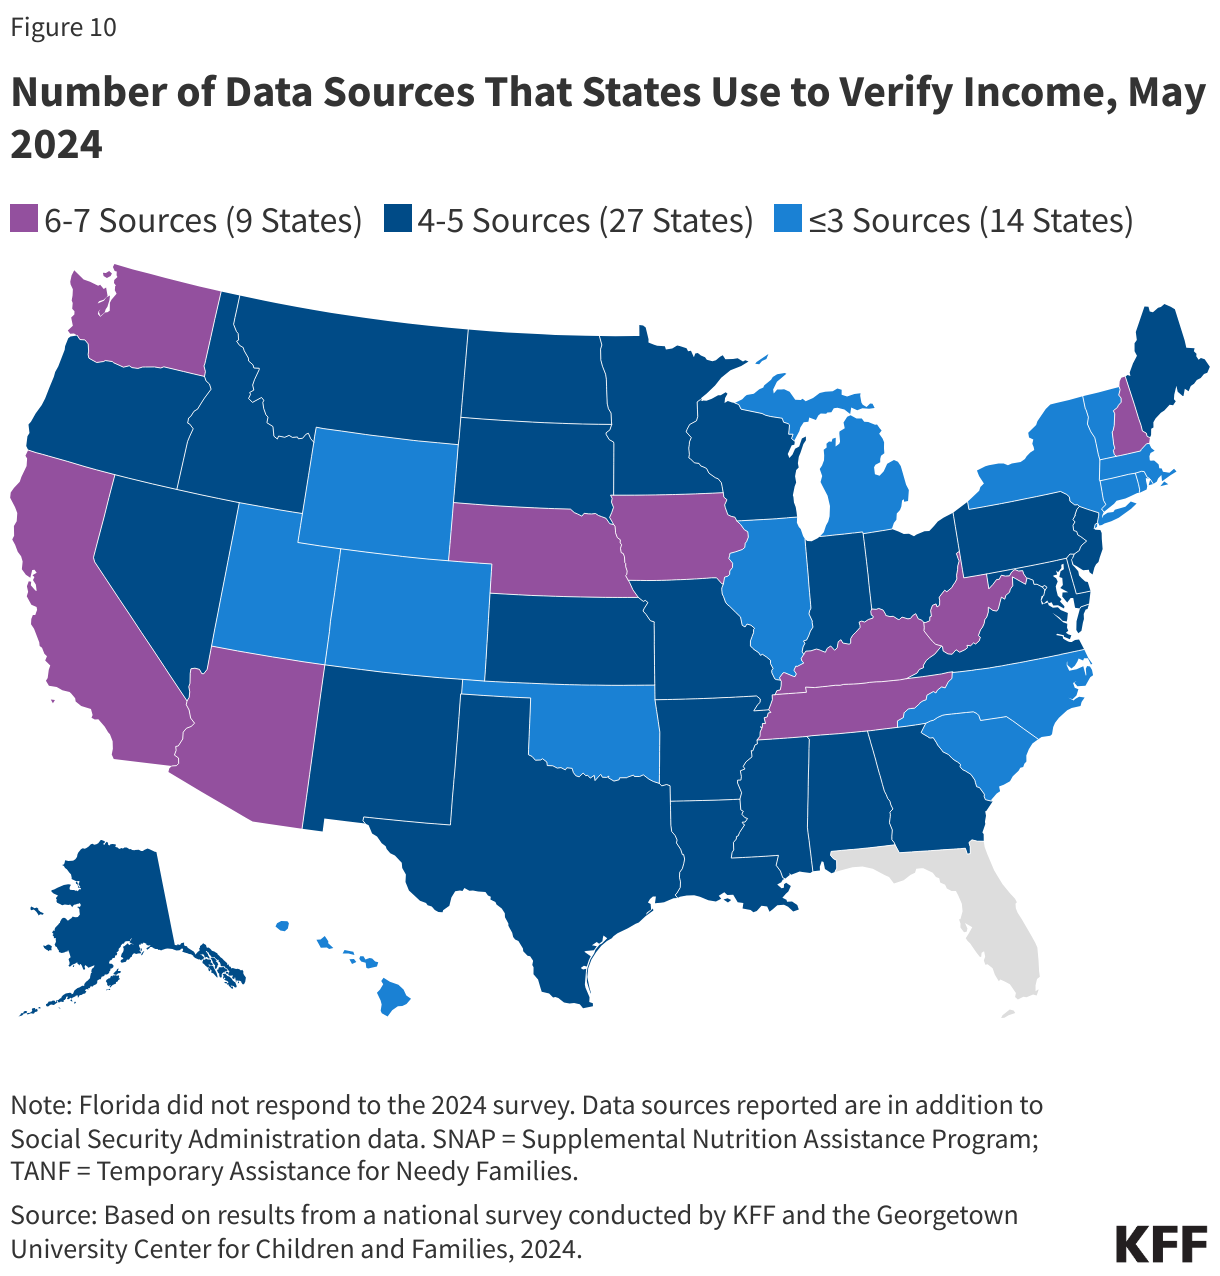
States use a variety of data sources to determine income eligibility; these sources are critical to processing real-time applications and ex parte renewals. States have flexibility in choosing the data sources and age of the data that are used to comply with ACA requirements in first attempting to determine eligibility using reliable data available to the state before requiring paper documentation from the individual. Most states use the state unemployment database (44 states) or the state wage database (42 states), while 38 use commercial databases (e.g., TALX or the Work Number) and 37 states access SNAP data (Figure 10). Fewer states use IRS data (19 states) or state tax department data (6 states). State limitations on the age of the data vary by source. In most states, the age of data is restricted to less than 12 months but can be less than three months, which may lessen the state’s ability to determine eligibility in real-time (less than 24 hours) or renew coverage on an ex parte basis.
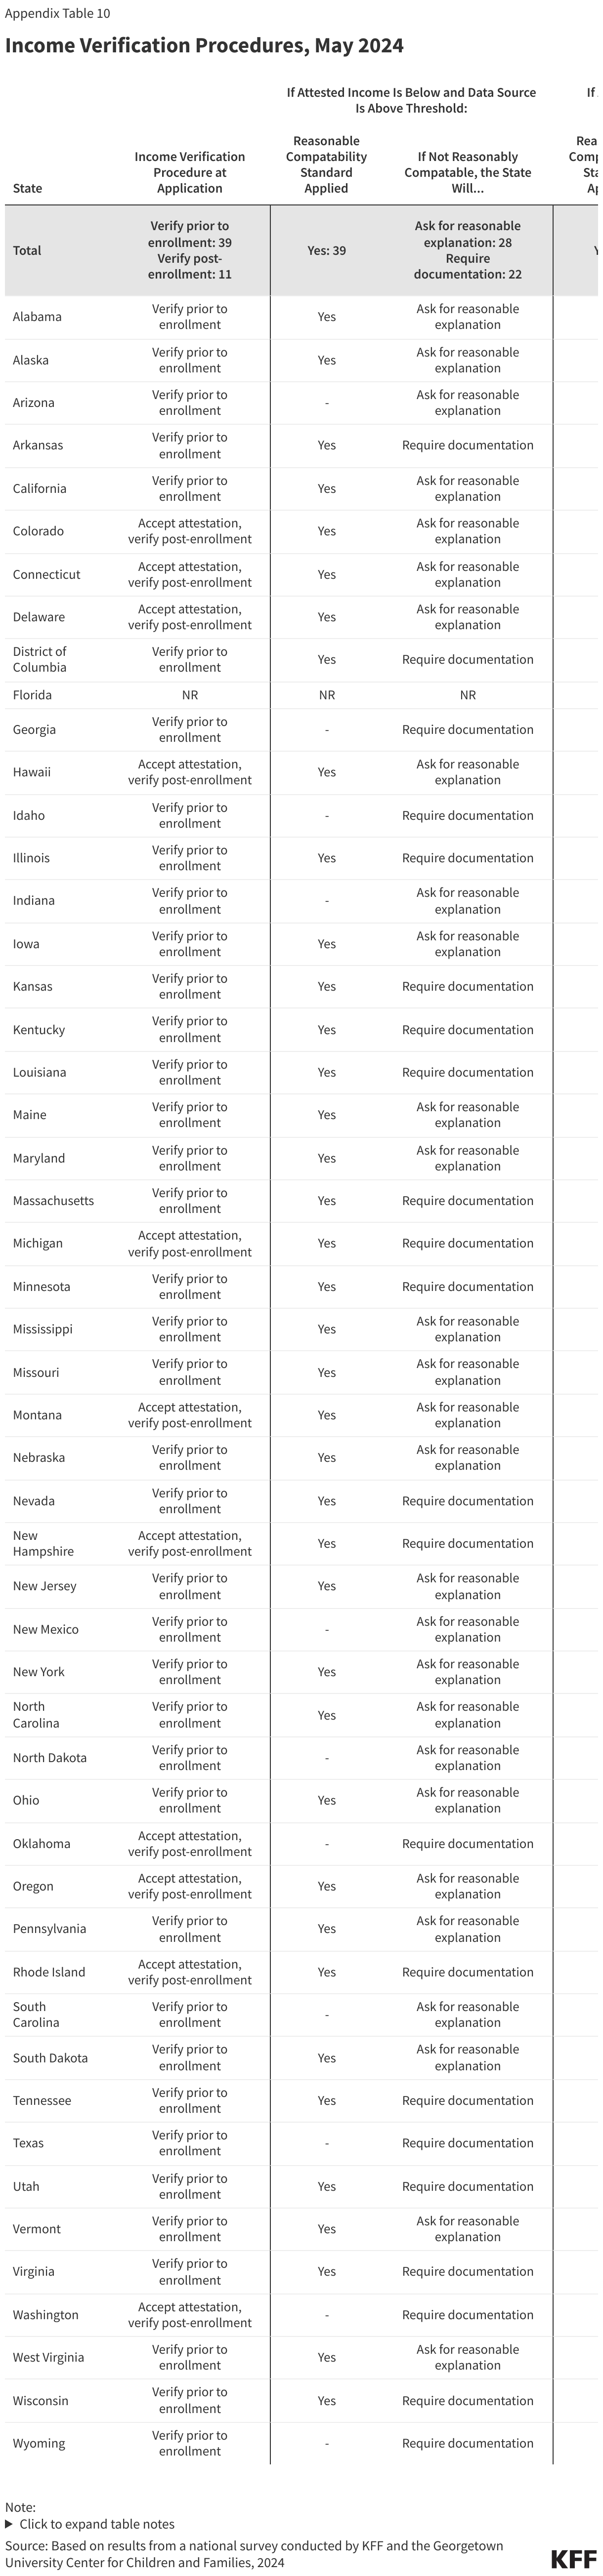
Most states (39) verify income eligibility before determining eligibility at application. All states must verify income eligibility but may opt to do so either prior to or post enrollment. Eleven states base a preliminary determination on the applicant’s attestation of income and verify post-enrollment.
Most states (39) also apply a reasonable compatibility standard to account for differences in reported income and data sources. If reported income and the state’s electronic data source are both below, at, or above the income eligibility limit, the state must accept the finding without reconciling the difference. Additionally, with approval from CMS, states may set a reasonable compatibility standard – that is an acceptable level of variance, as either a percentage of income or a specific dollar amount to account for any difference between the individual’s income attestation and the income data source. For example, in a state with a 10% reasonable compatibility standard, if an applicant’s attestation of income is below the eligibility threshold and the data source is above the threshold, but within 10% of the attestation, the attestation and data source are considered reasonably compatible, and the applicant is determined eligible.
Two-thirds of states (39) apply reasonable compatibility standards when the individual’s attestation is below the income eligibility limit and the data source is above the threshold. When data are not reasonably compatible, states have the option to accept a reasonable explanation (such as I lost my job), which 28 states do, while 22 states require documentation. Eleven states do not apply a reasonable compatibility standard but ask for explanation or require documentation if attested income differs from the data source. When the income attestation is above the eligibility limit and the data source is below, most states (38) accept the individual’s attestation, determine the individual ineligible, and transfer the account to the Marketplace.
Applications, Online Accounts, and Community-Assister Portals
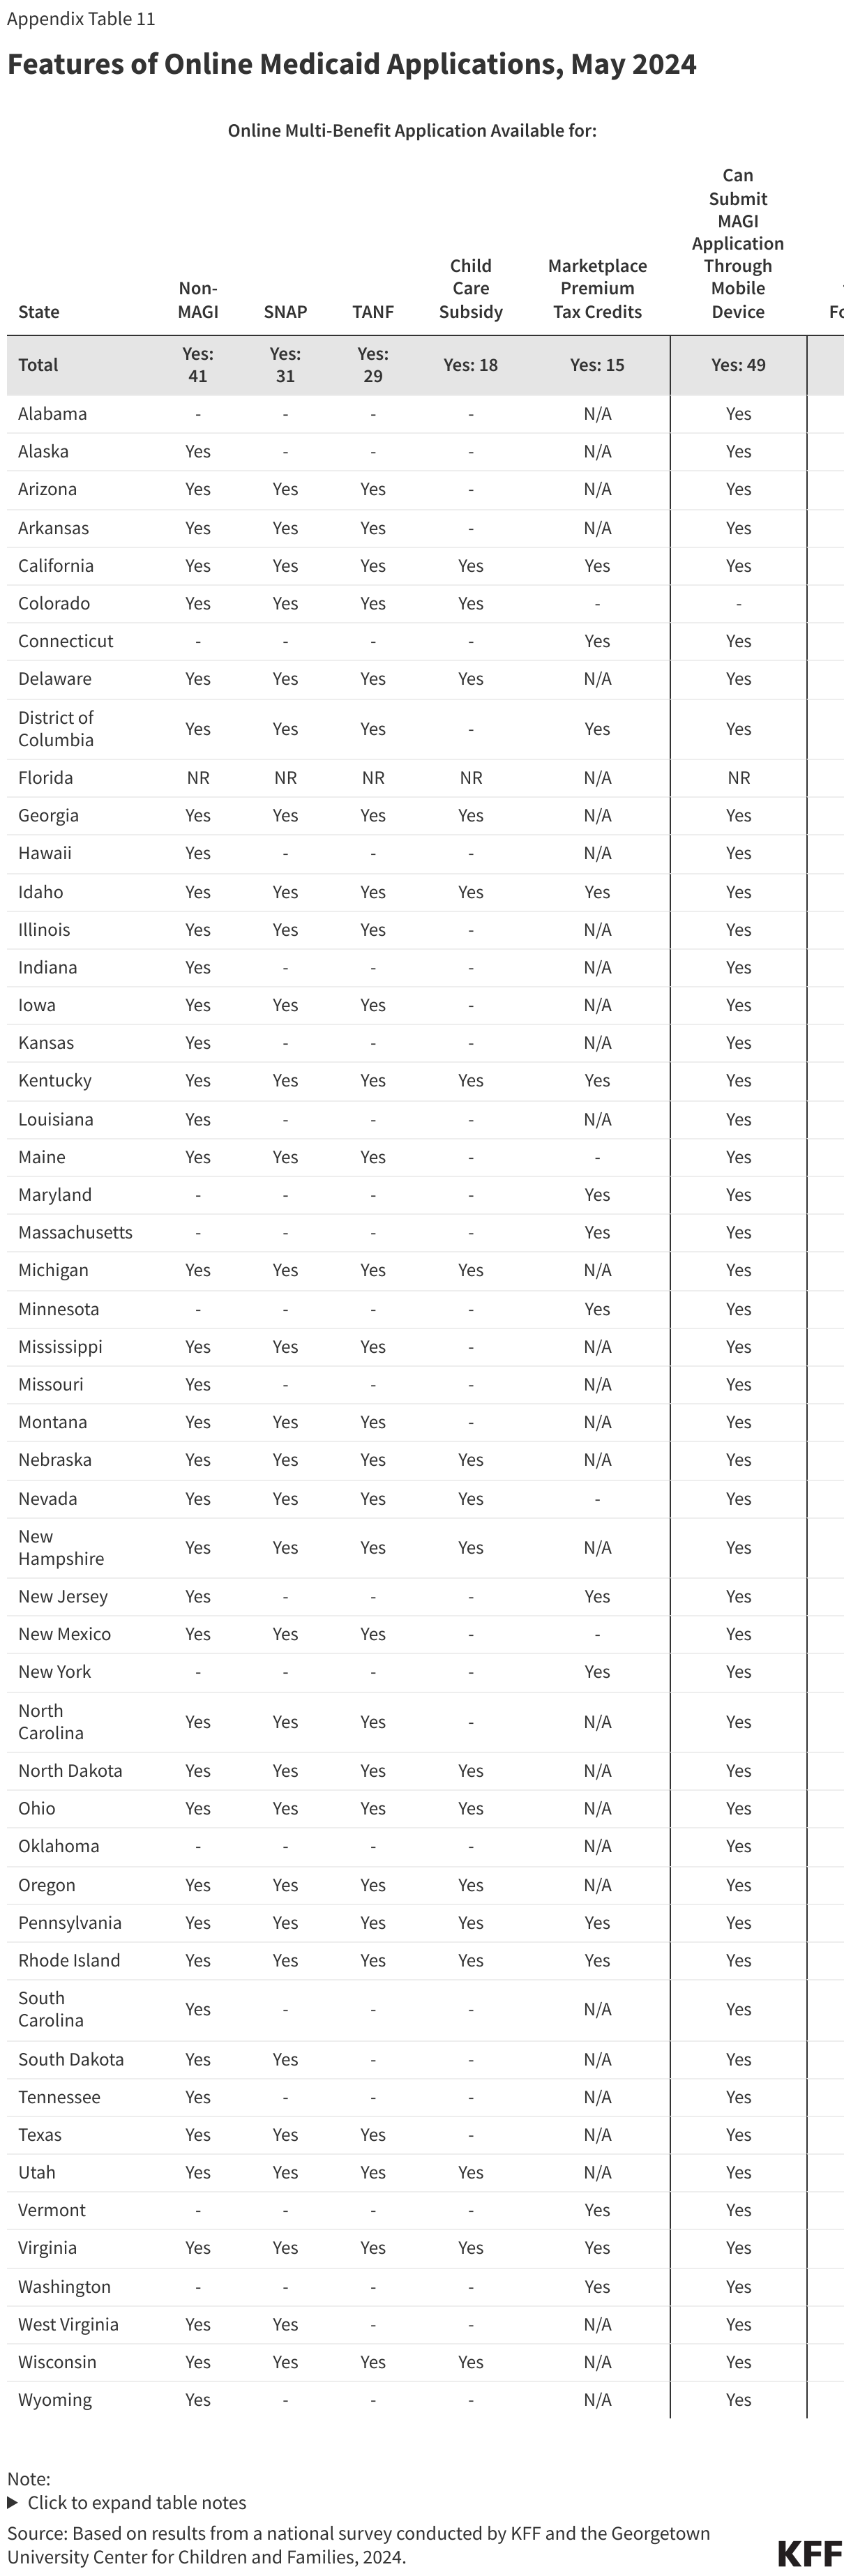
In most states, online MAGI Medicaid applications also allow individuals to apply for non-MAGI Medicaid, as well as other benefits and/or Marketplace subsidies. In 41 states, individuals can apply for both MAGI and non-MAGI-based Medicaid using the same online application portal. Nearly one-third of states have integrated SNAP (31 states) and TANF (29 states) in their online Medicaid applications while 18 states also use their multi-benefit applications to enable families to apply for child care assistance. Of the 19 SBM states with their own SBM eligibility systems, 15 allow applicants to use the same application for Marketplace premium tax credits. That leaves just two states with an online application that is limited to MAGI-based Medicaid. While all states, except Colorado, allow individuals to apply with an electronic signature through a smartphone or tablet, 40 states have taken steps to ensure that applications are mobile-friendly, up from 31 states in 2023.
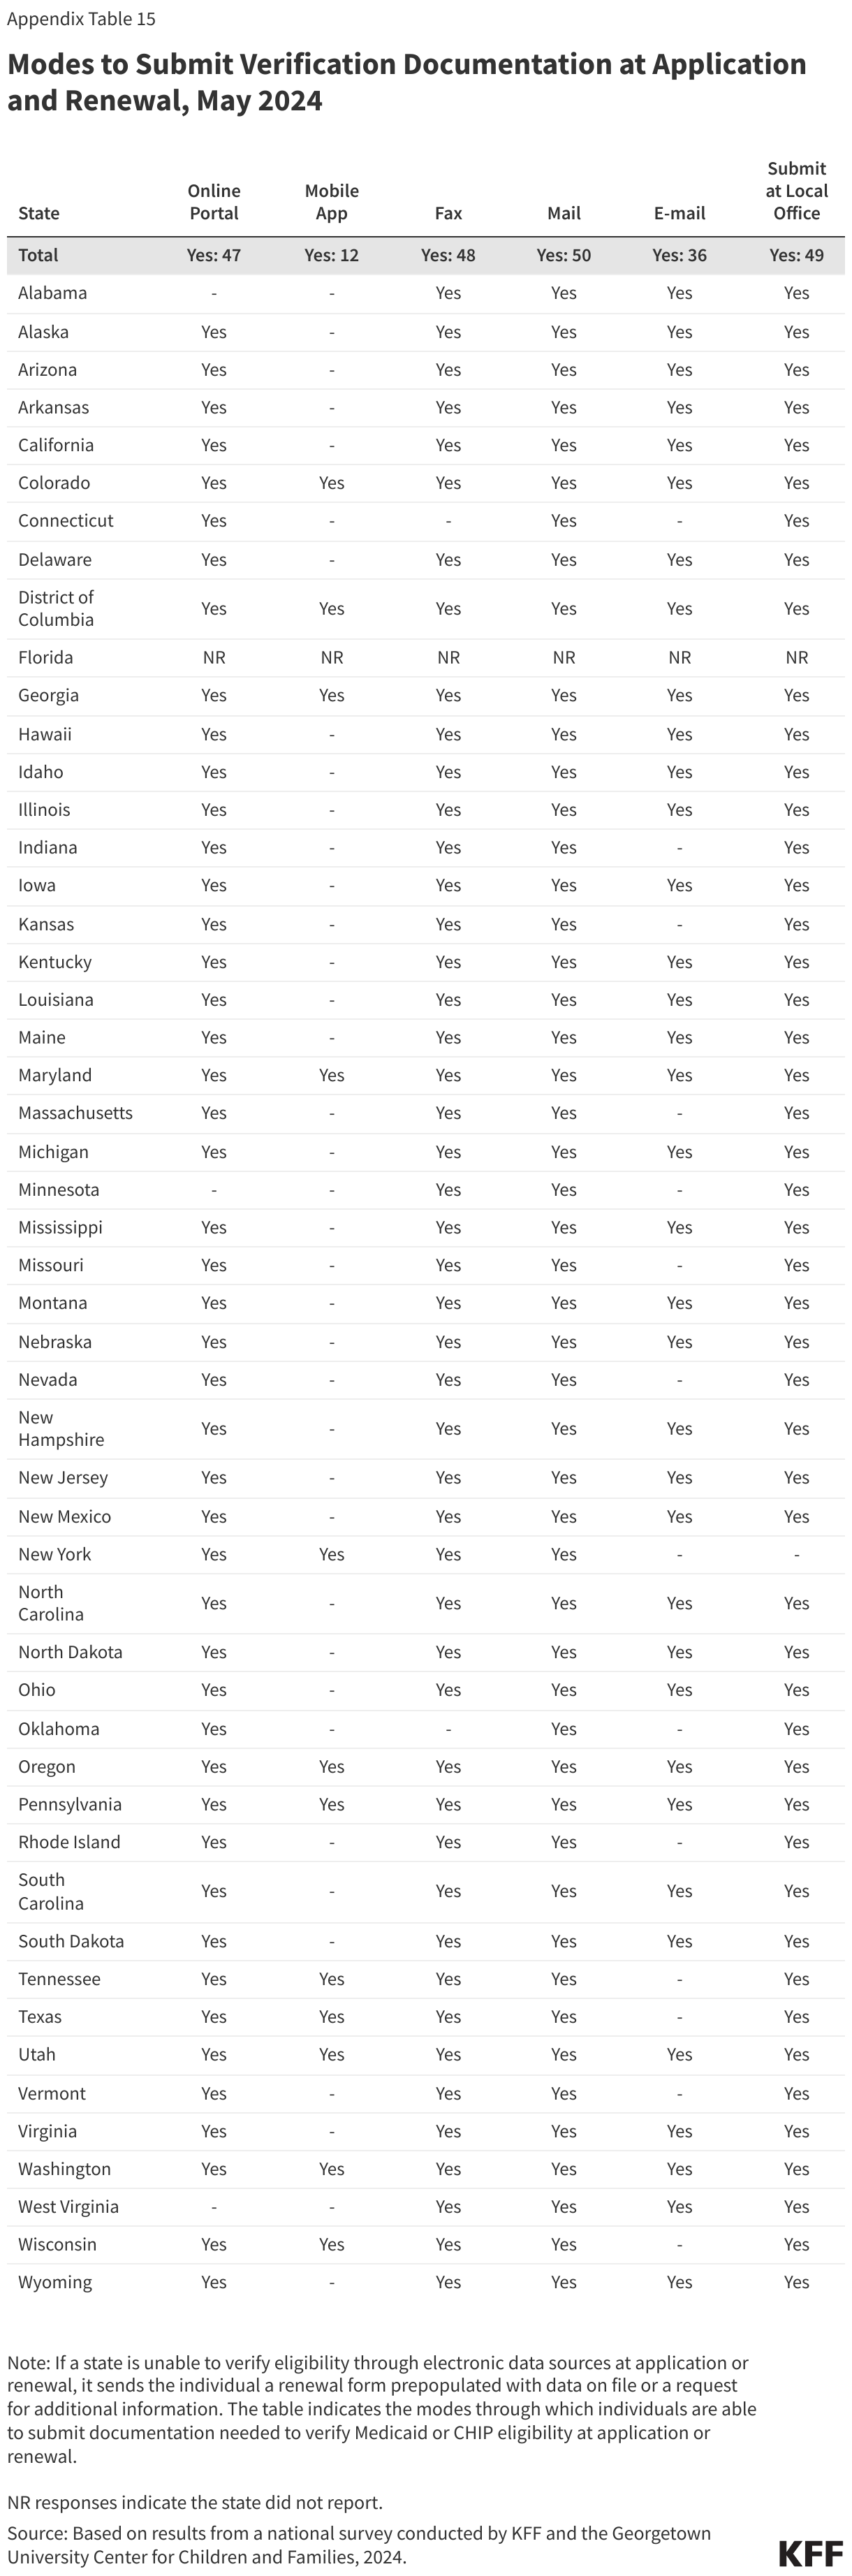
States offer a variety of ways to submit documentation when eligibility cannot be confirmed through data sources. All states accept documents through the mail; other mechanisms include dropping off at a local office (49 states), through the online account (47 states), via fax (48 states), through email (36 states) or through the state’s mobile app (12 states).
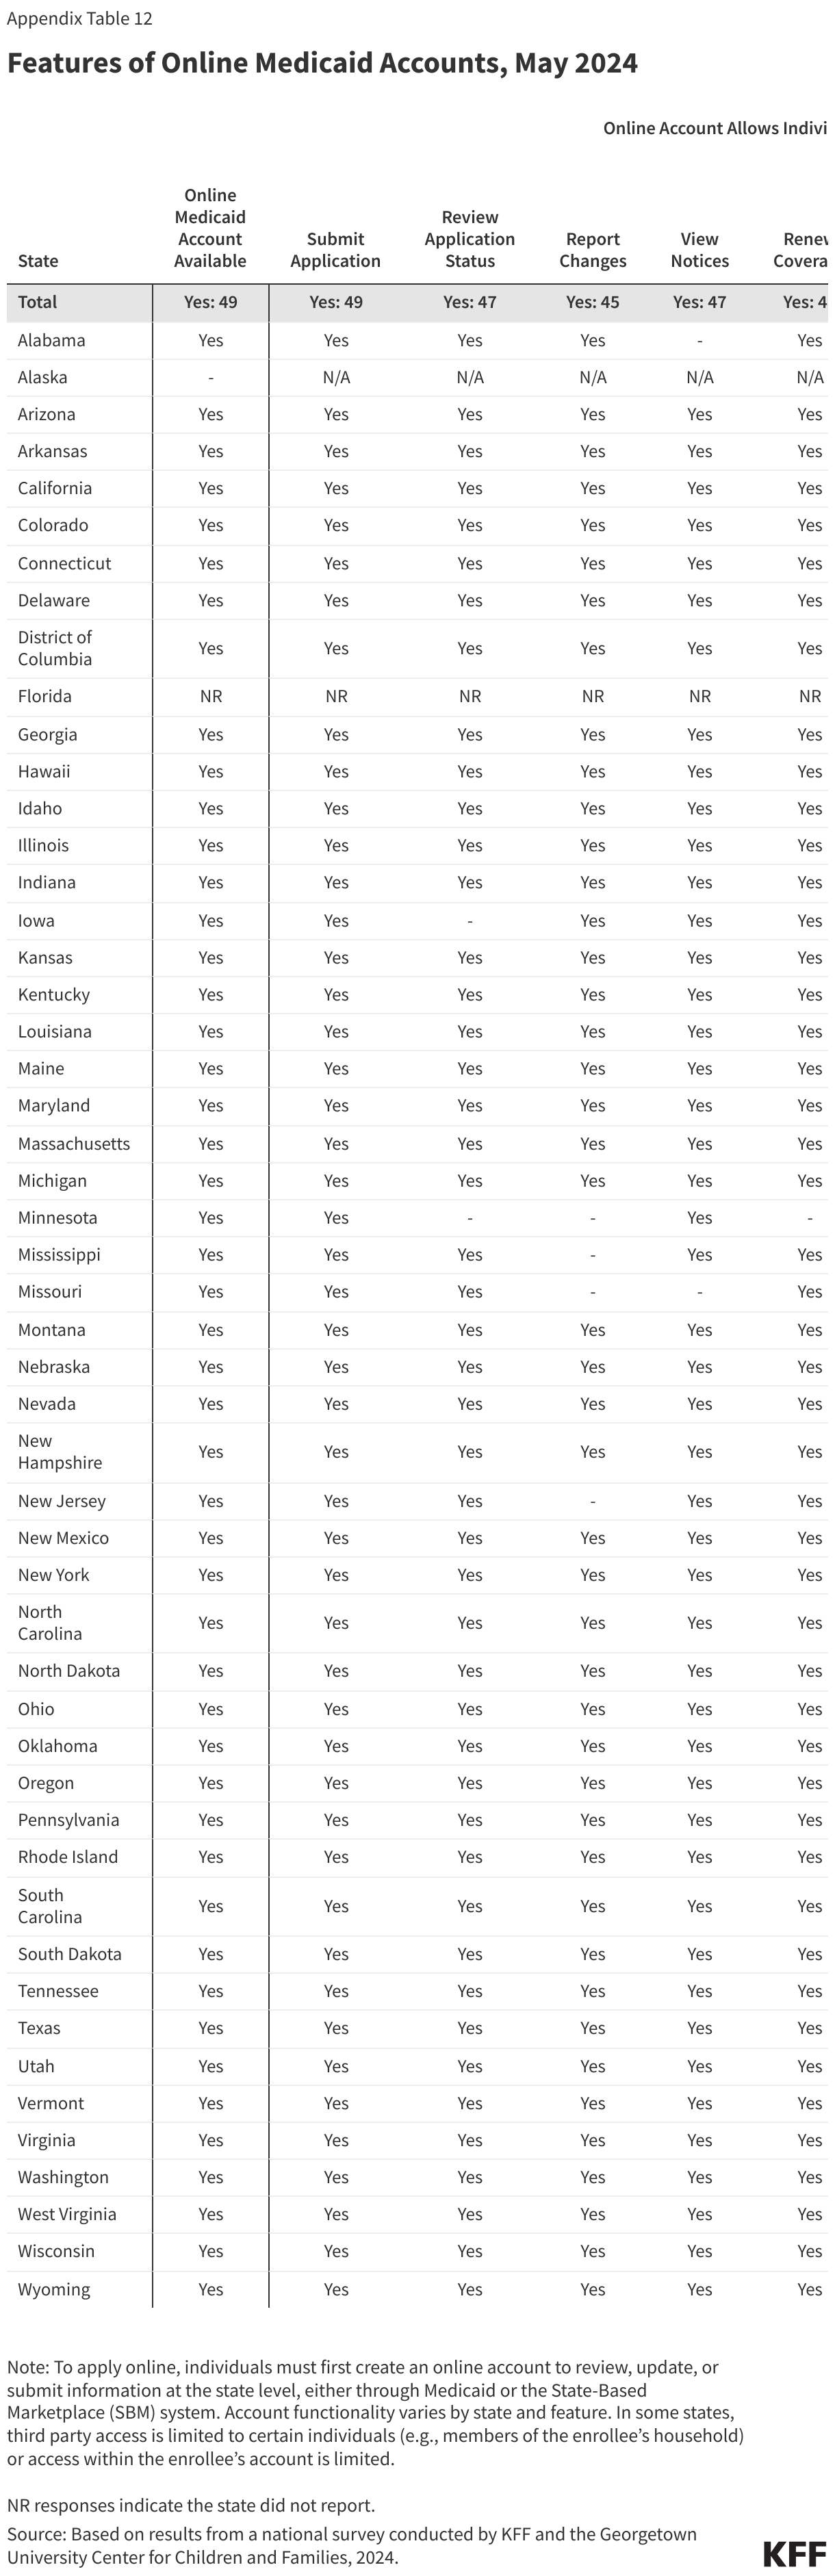
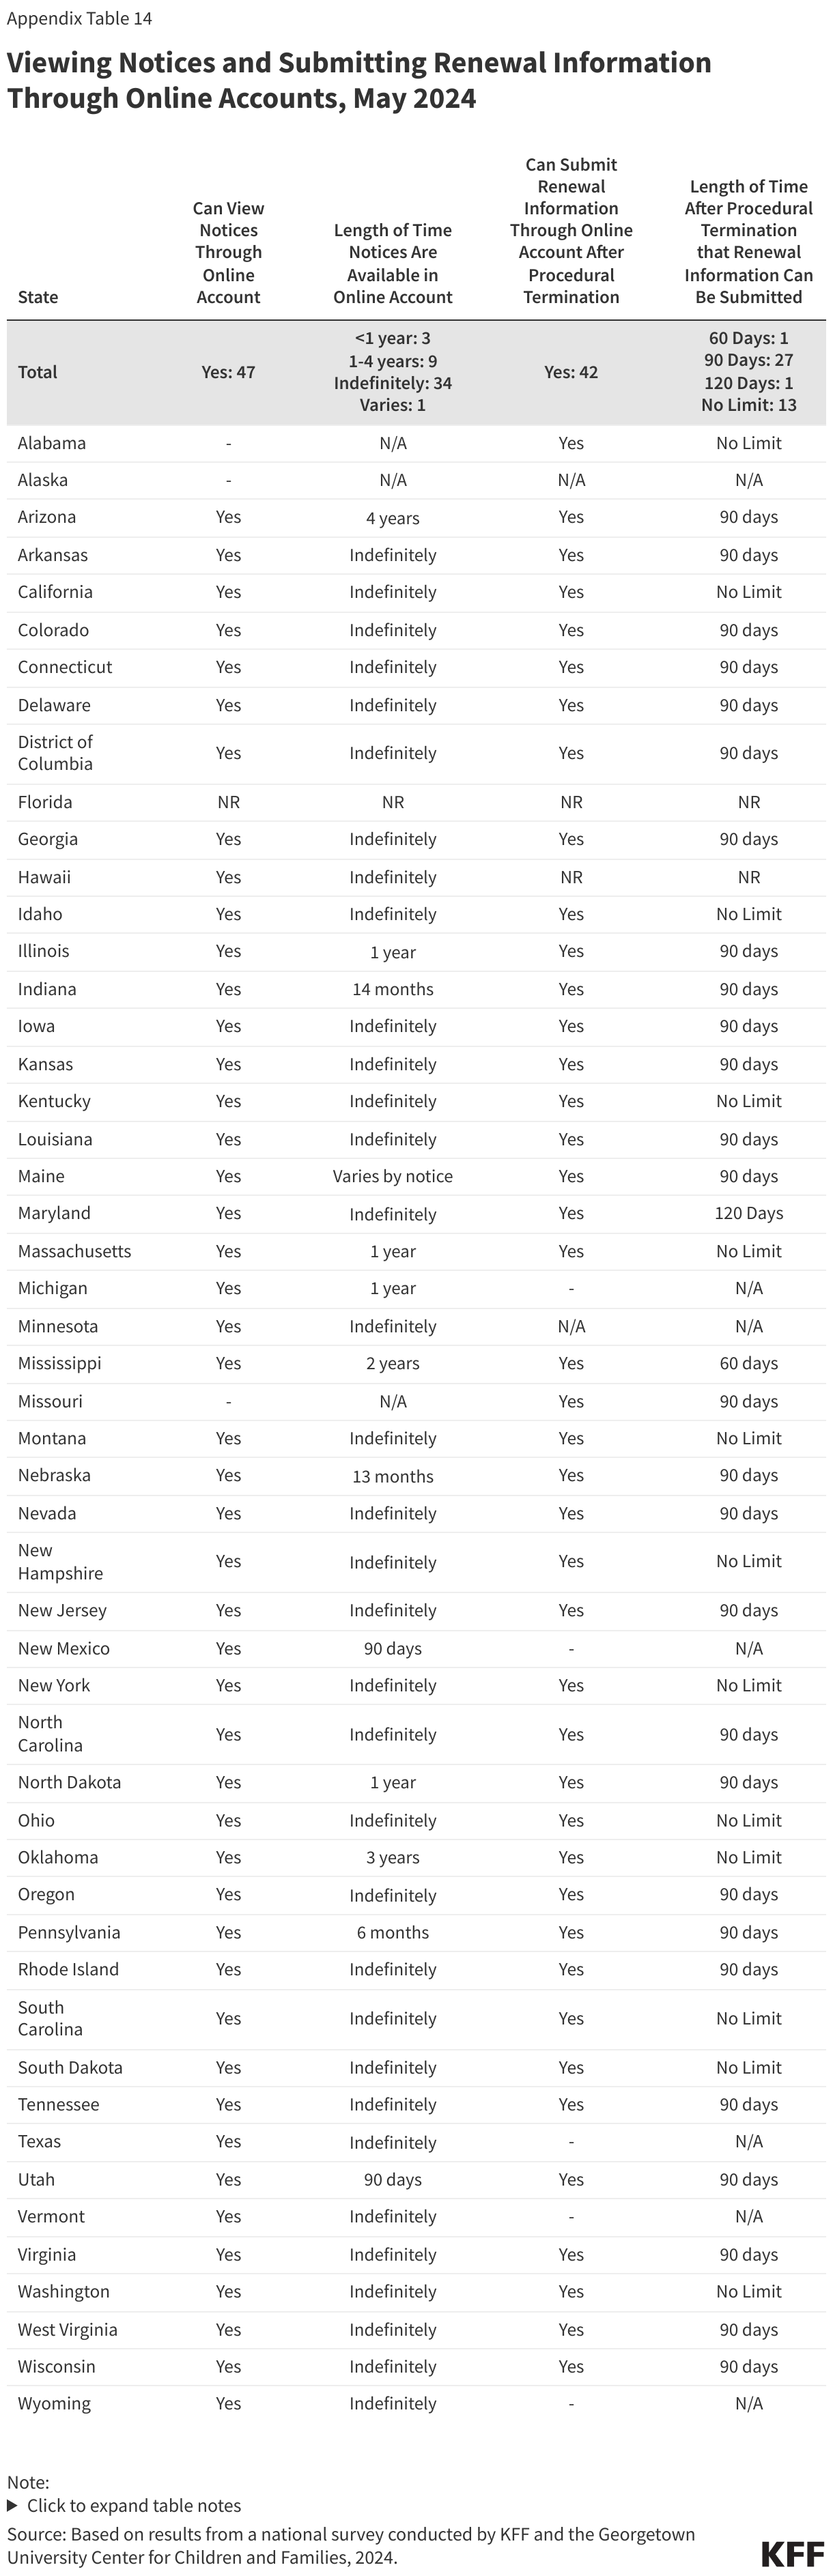
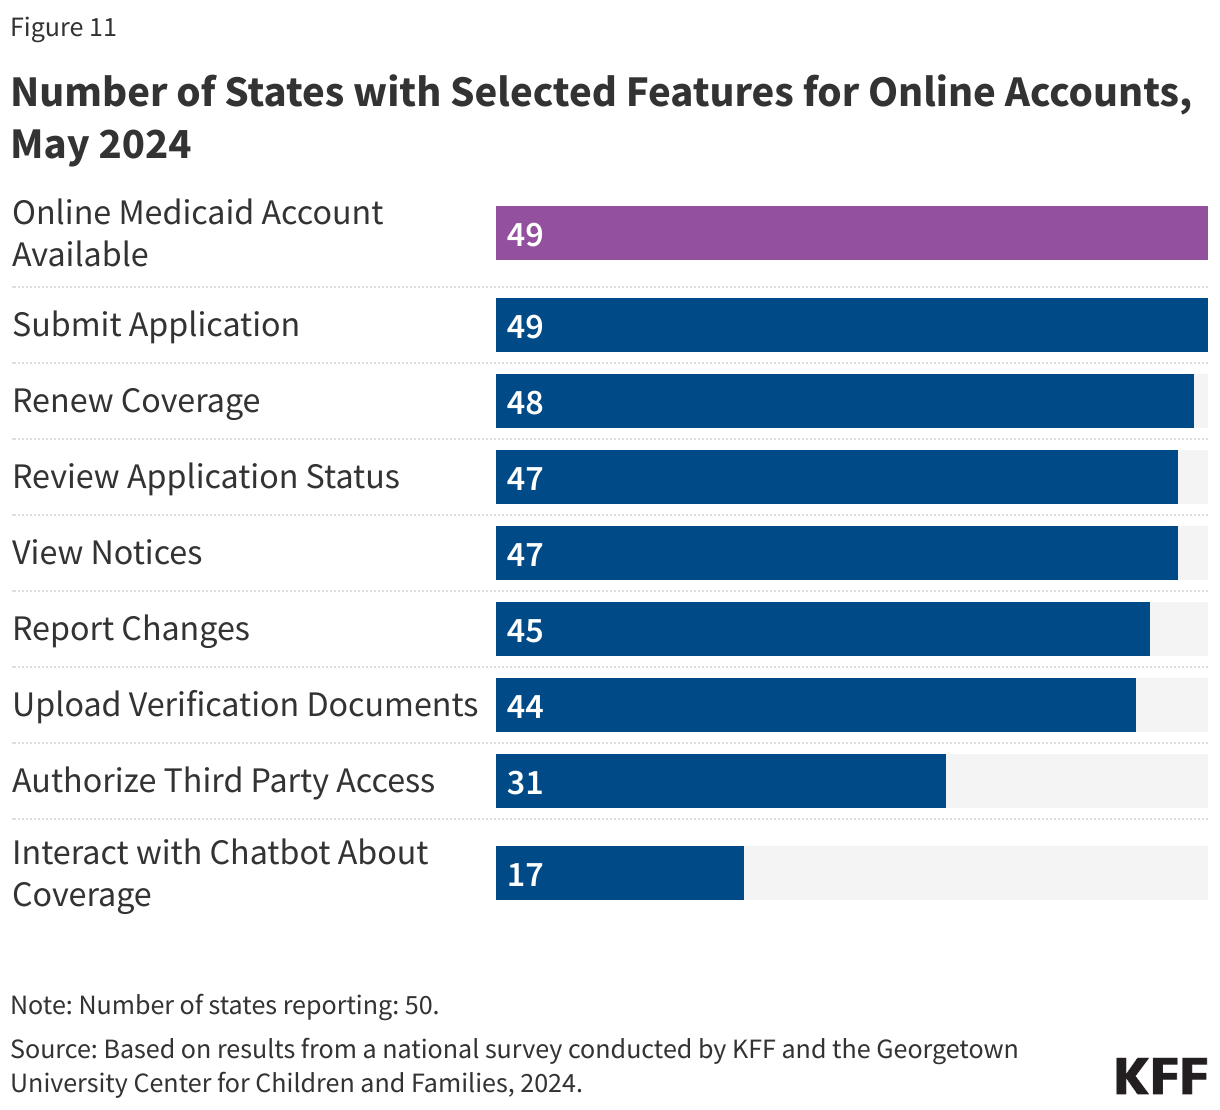
States are maximizing the features of online accounts to assist new applicants and enrollees in monitoring and managing their coverage. To apply online, applicants must first set up an online account as no state offers an online application that is separate from online account management. Beyond allowing enrollees to apply, the 49 states with online accounts offer a range of features including renewing coverage (48 states), reviewing application status (47 states), viewing notices (47 states), reporting changes (45 states), uploading documents (44 states), and authorizing third party access (31 states) (Figure 11). Seventeen states have integrated a Chatbot feature in their online accounts. In the 47 states that allow users to view notices through their online accounts, 34 states report that notices are available indefinitely while 12 states indicate that notices are time-limited, generally available for one to four years, though three states allow notices to only be viewed for less than a year. In the 42 states that permit enrollees to submit renewal documents after a procedural termination, 28 allow individuals to submit renewal information at least 90 days after being procedurally disenrolled, which aligns with the 90-day reconsideration period during which an individual who was procedurally disenrolled may submit needed information without completing a new application.
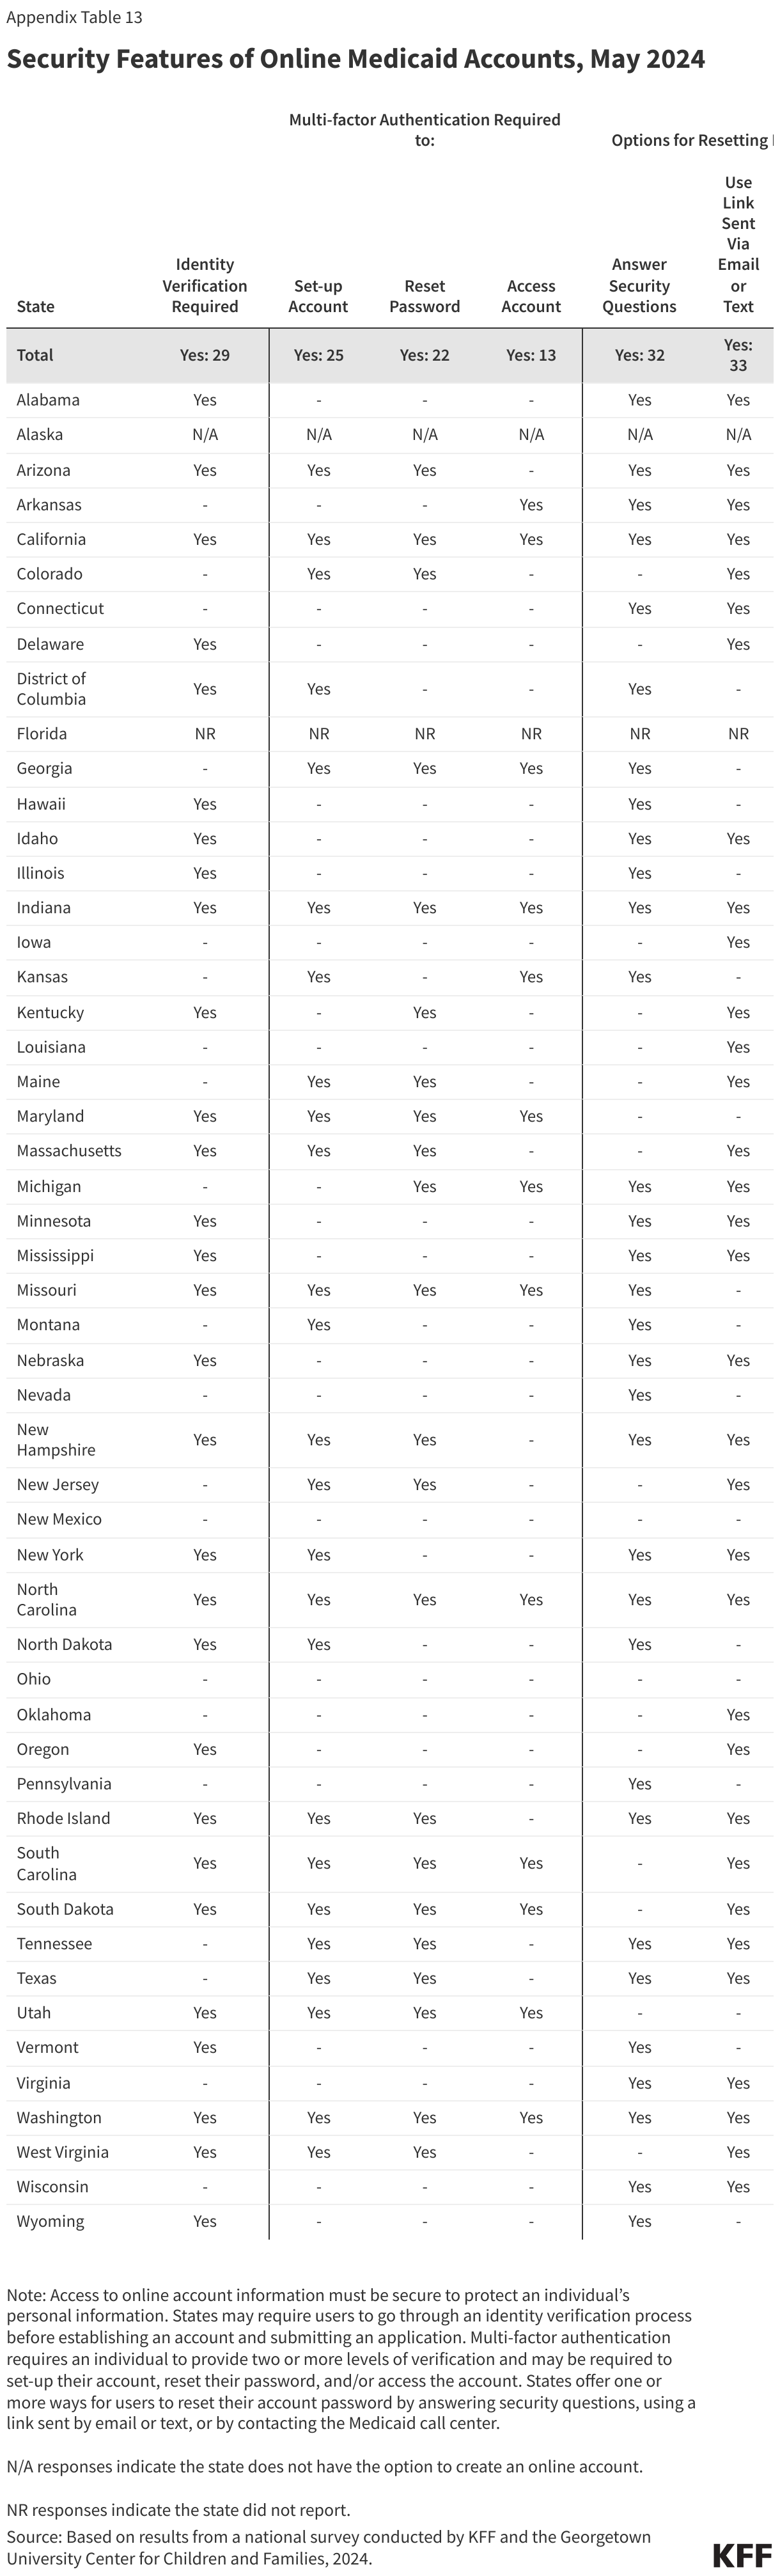
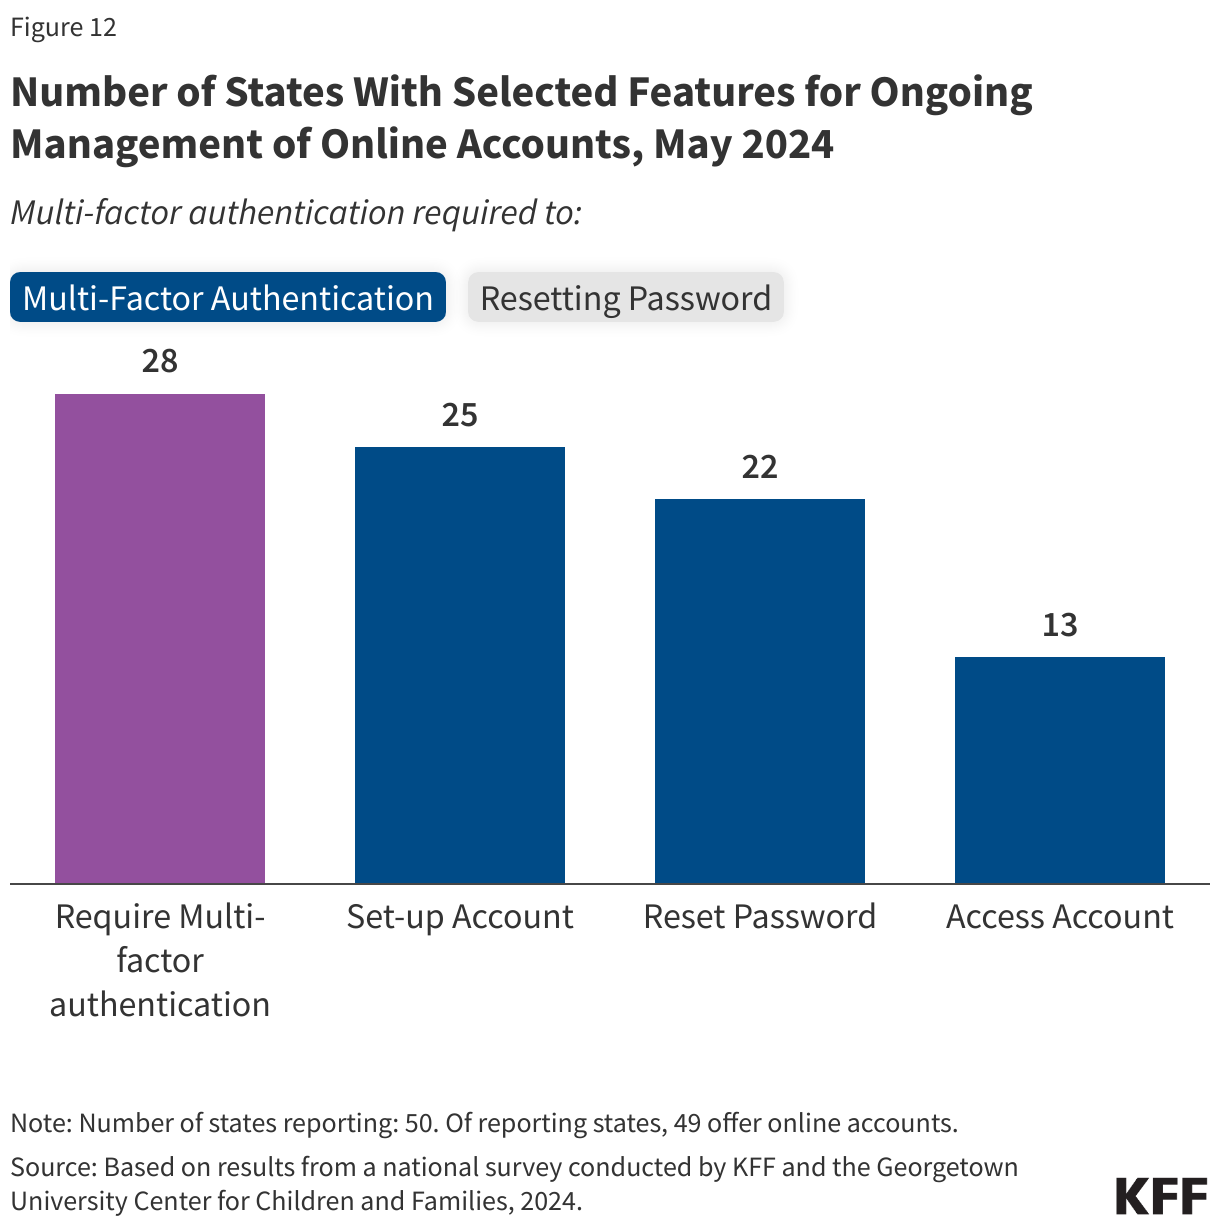
The 49 states with online accounts have similar features but there are differences in requirements for setting up accounts and resetting passwords. Online accounts must be secure to protect personal information, though security features can create barriers to accessing accounts for some enrollees. More than half of states (29) require new users to go through an identity verification process before setting up an account. In addition, in the 28 states that require multi-factor authentication, this security measure is required to set up an account in 25 states, to reset the password in 22 states, and every time the account is accessed in 13 states (Figure 12). The process for resetting the account password varies as well with many states (32) offering more than one way; users can reset passwords online by answering security questions in 32 states, through a link sent via email or text in 33 states, or by contacting the Medicaid call center in 29 states.
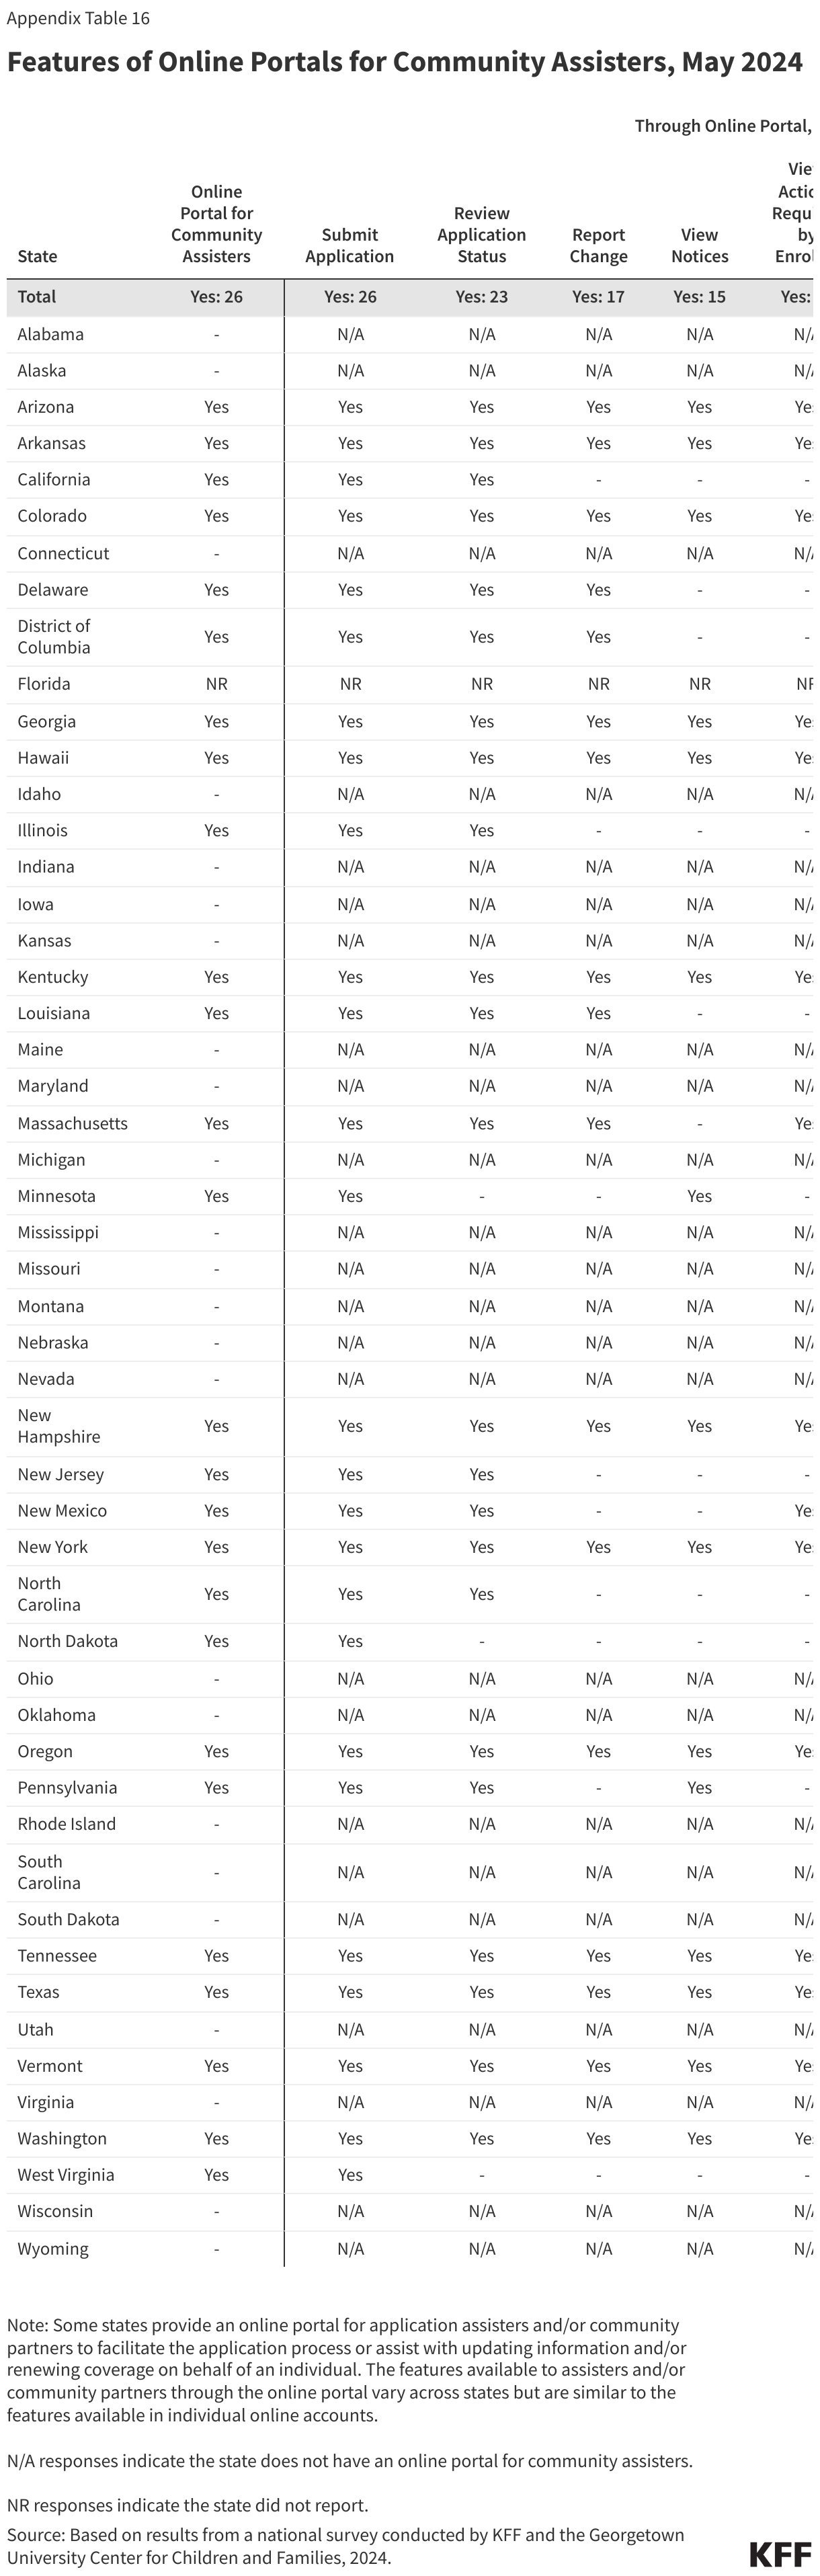
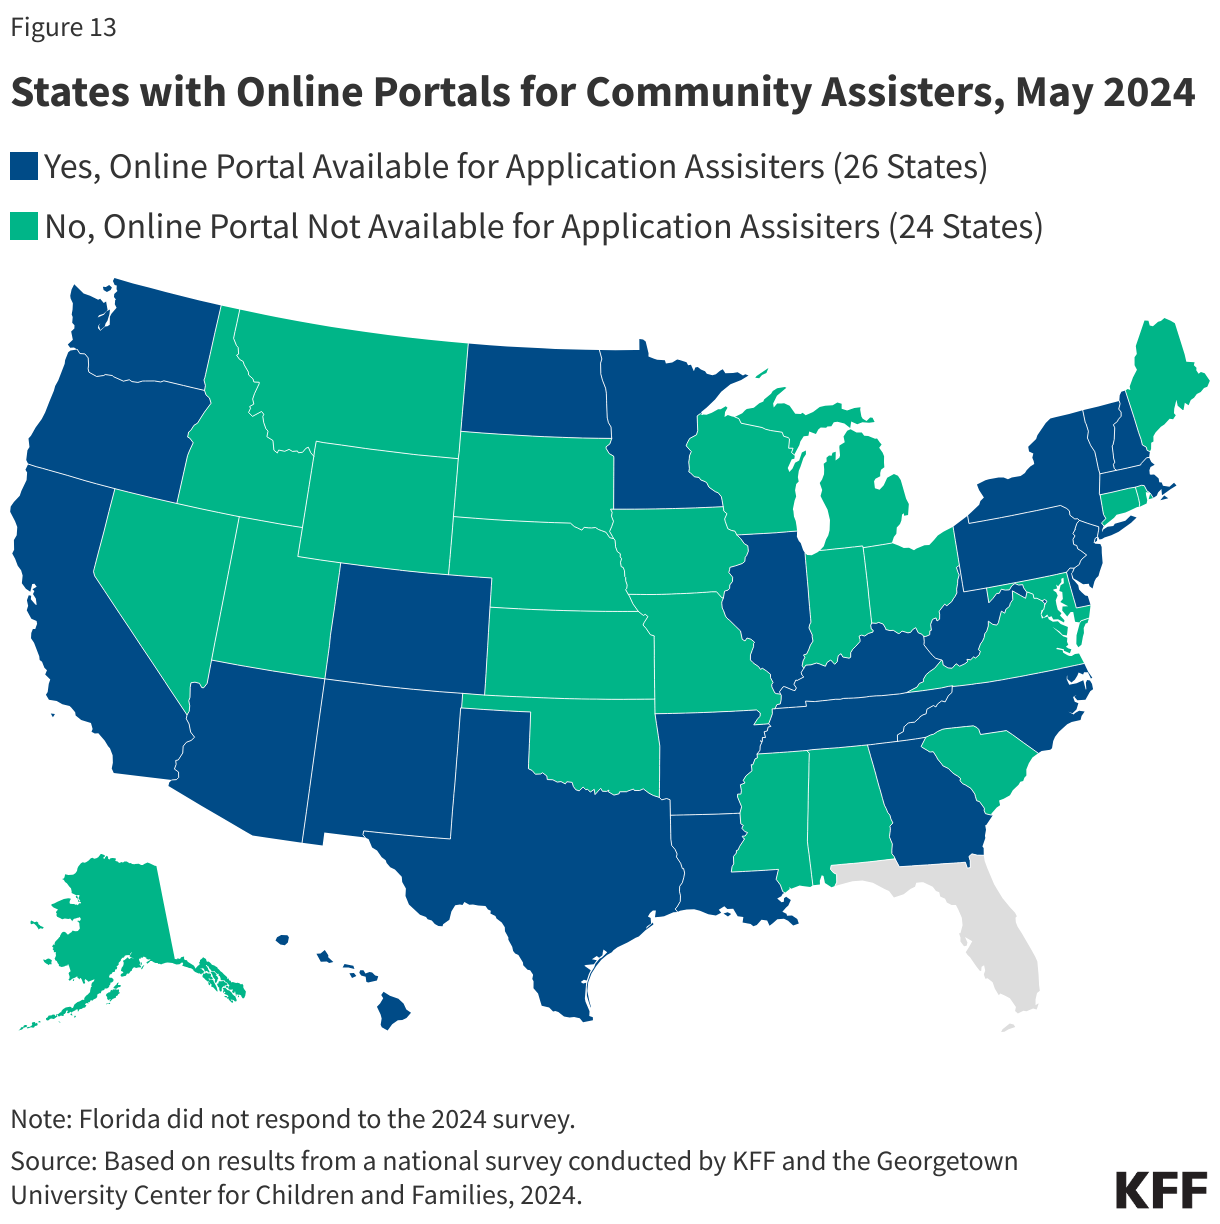
Half of the states (26) have a portal for assisters and community groups to submit facilitated applications (Figure 13). These portals are available to a range of entities depending on the state, including federal and state navigators and application assisters, community health centers, hospitals and other providers, managed care organizations, and community-based organizations that help those in need of assistance with applying for and renewing Medicaid and CHIP coverage. All 26 states with a separate community assistance portal allow assisters to submit applications and most states allow assisters to review application status (23 states) and upload documents (21 states), but other features are more limited. Assisters are permitted to submit renewal information through the portal in 18 states; report changes in circumstances or update mailing addresses in 17 states; and view notices, actions required by the enrollee, and view renewal dates in 15 states. Secure assister portals create administrative efficiencies by allowing assisters to perform tasks that facilitate enrollment and renewal and providing a mechanism for states to monitor assister performance.
Renewal Processes and Changes in Circumstances
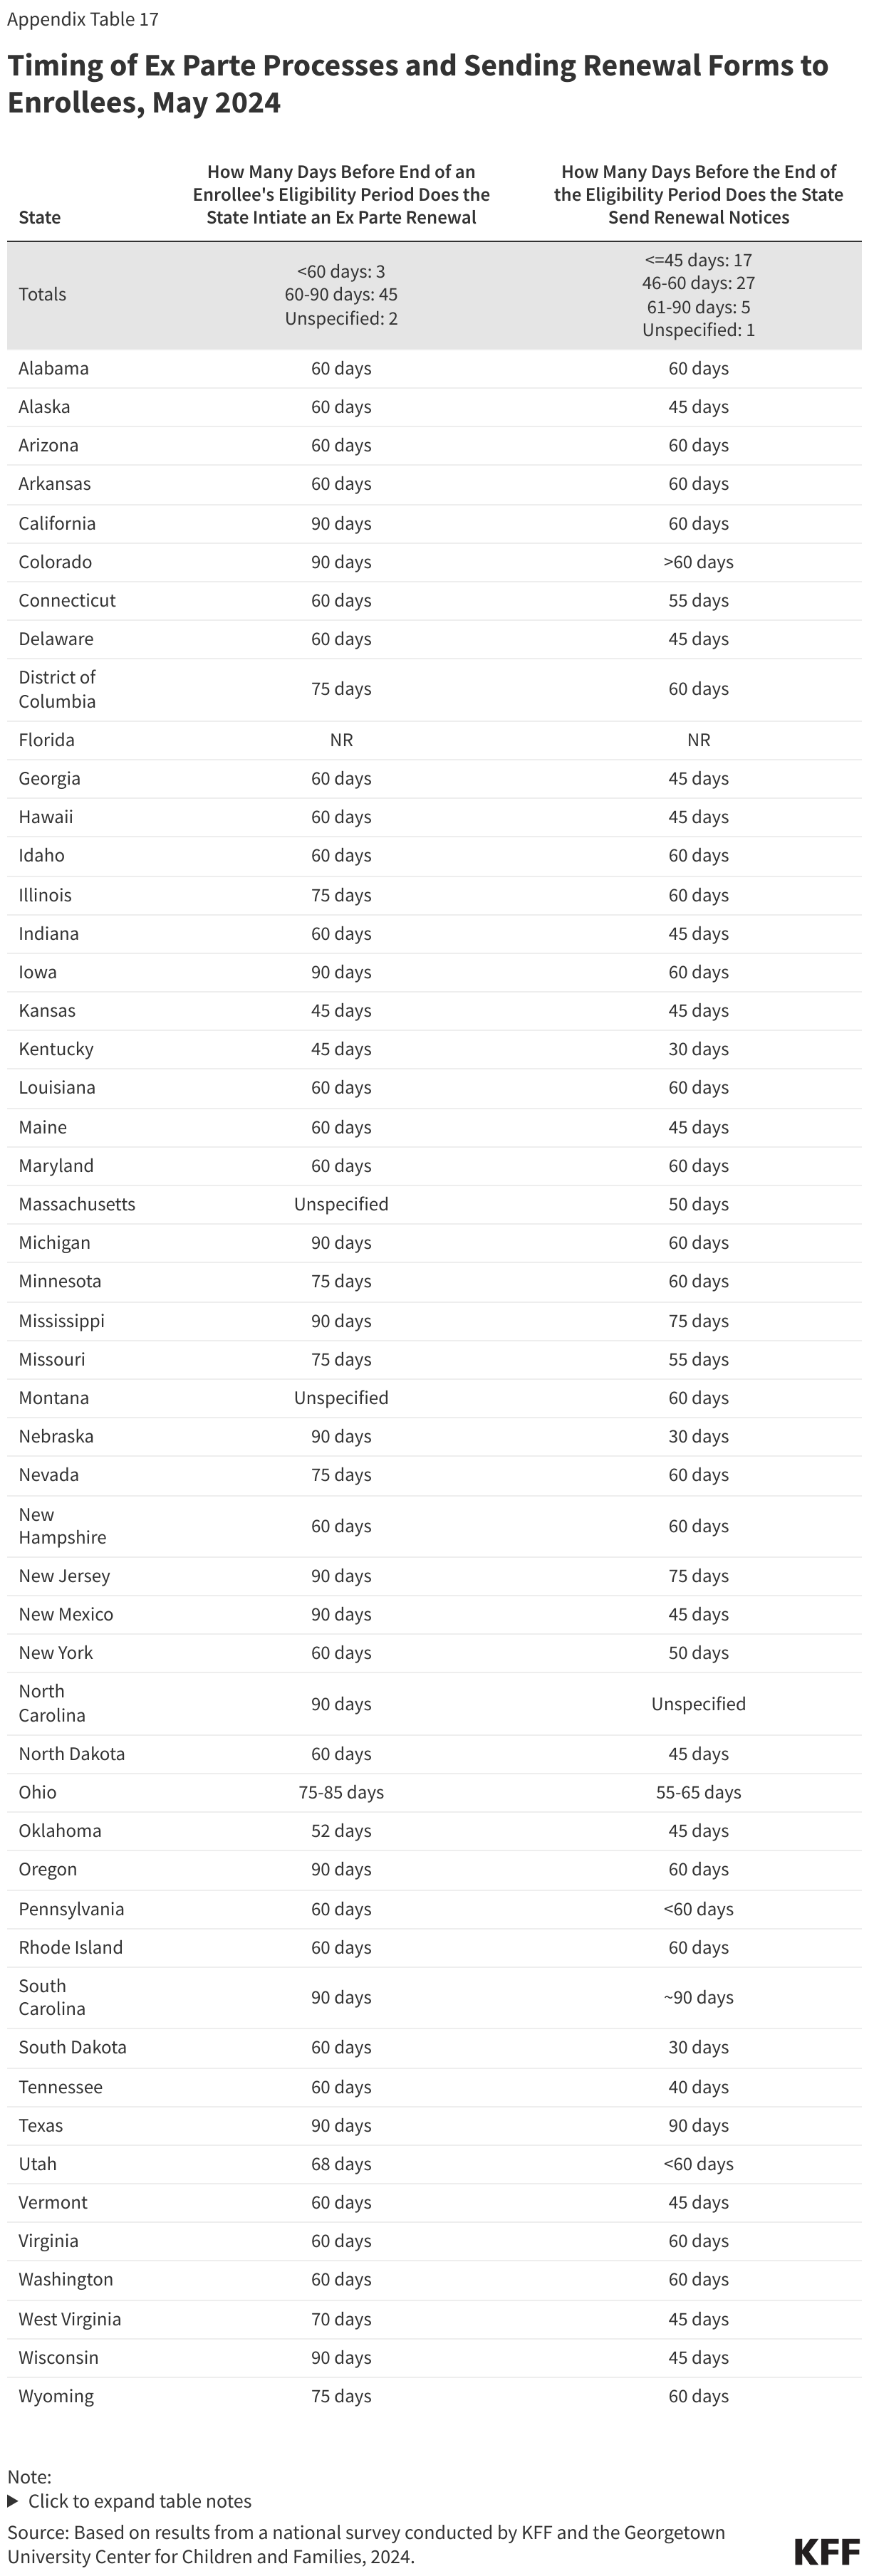
Nearly all states (45) initiate ex parte data processes at least 60 days prior to the end of an individual’s renewal period. States are required to provide MAGI-based enrollees with at least 30 days to return renewal forms or provide needed information. Thus, ex parte processes need to be initiated with sufficient time to check available data sources, determine which renewals can be automatically redetermined, and generate notices or print and mail renewal forms to enrollees whose ongoing eligibility cannot be redetermined automatically. About a quarter of states (13) initiate the ex parte process 90 days in advance of the end of the renewal period, 9 states initiate between 60 and 90 days, nearly half of the states (23) initiate ex parte data matches 60 days in advance while 3 states do so between 45 and 60 days.
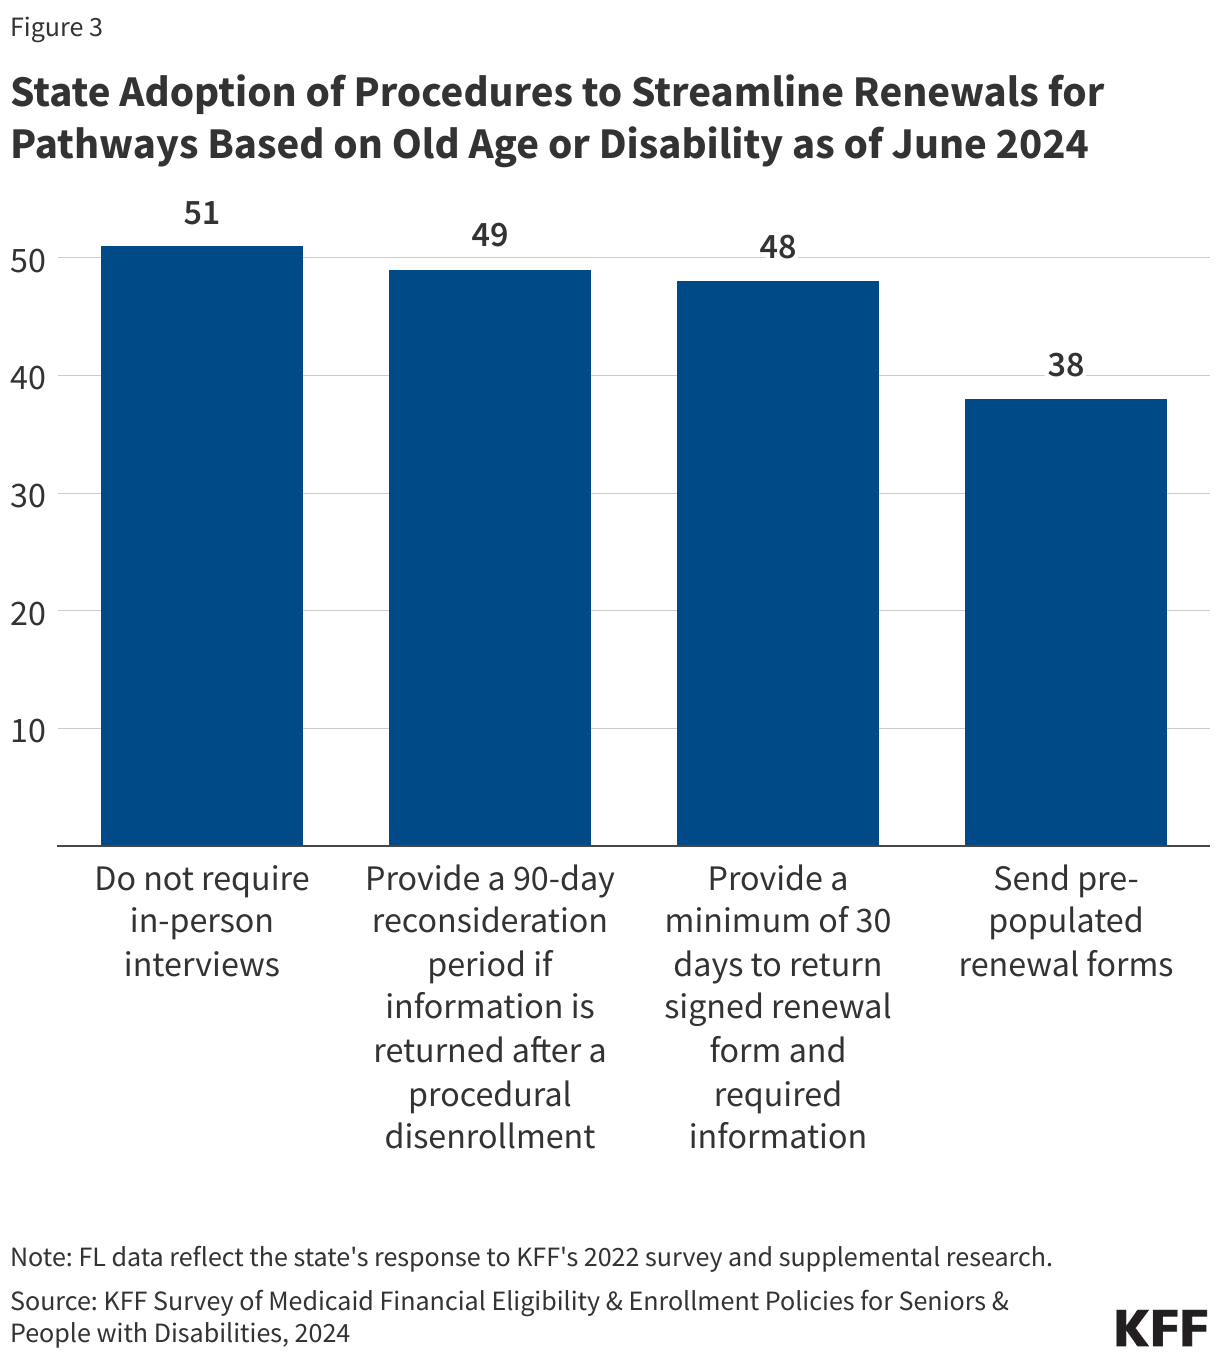
Almost all states send out pre-populated renewal notices with enough lead time to ensure that enrollees have 30 or more days to respond. In some states, renewal forms and notices are generated automatically after the system has attempted an ex parte review. Three-quarters of states send out notices from 40 to 60 days (41 states) in advance, and 5 states send out forms from roughly 75 to 90 days in advance. Three states send out renewal notices 30 days before the renewal is due, which is the federal minimum requirement. Due to potential mail delays, sending forms further in advance may give enrollees more time to respond.
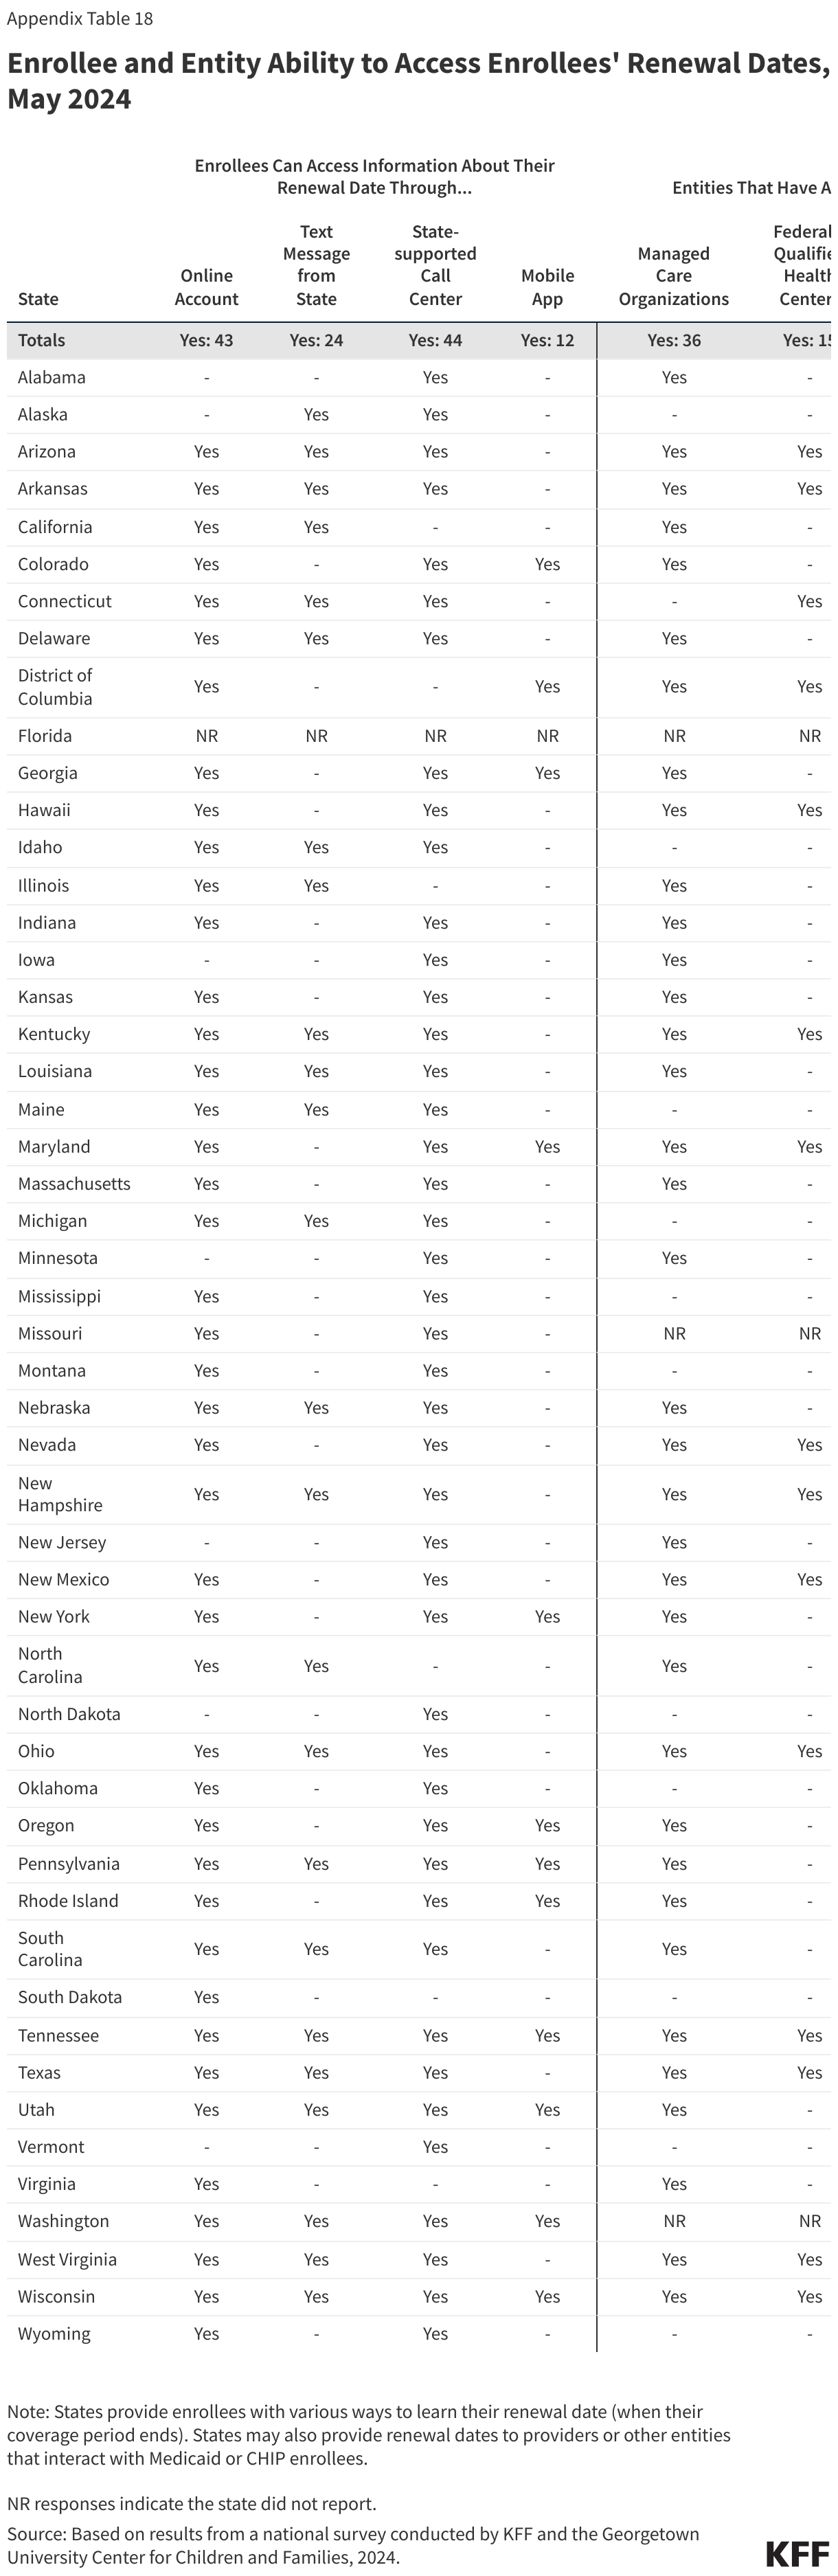
States offer several ways for enrollees to check their renewal dates, and provide renewal date information to health plans, providers, and navigators or other assisters to increase outreach about renewals. During the unwinding knowing one’s renewal date became important since many enrollees were not required to complete a renewal during the 3-year pause on disenrollments. In 44 states, enrollees can access their renewal date by contacting the call center, and in 43 states, enrollees can find the date in their online account. Enrollees can find their renewal date in their mobile app in 12 states. Nearly half of the states (24) use text messages to remind enrollees of their renewal date, and 11 states provide other mechanisms including mail or through the managed care plan or a local office. Minnesota and Rhode Island created an online renewal lookup tool to facilitate access to renewal dates. States also provide access to information that includes enrollees’ renewal dates to health plans (36 states), federally qualified health centers (15 states), pharmacists (9 states), other Medicaid providers (17 states), and navigators and/or assisters (18) states. These entities may share renewal information with members, patients, and clients of upcoming renewal dates to encourage them to complete and return the form.
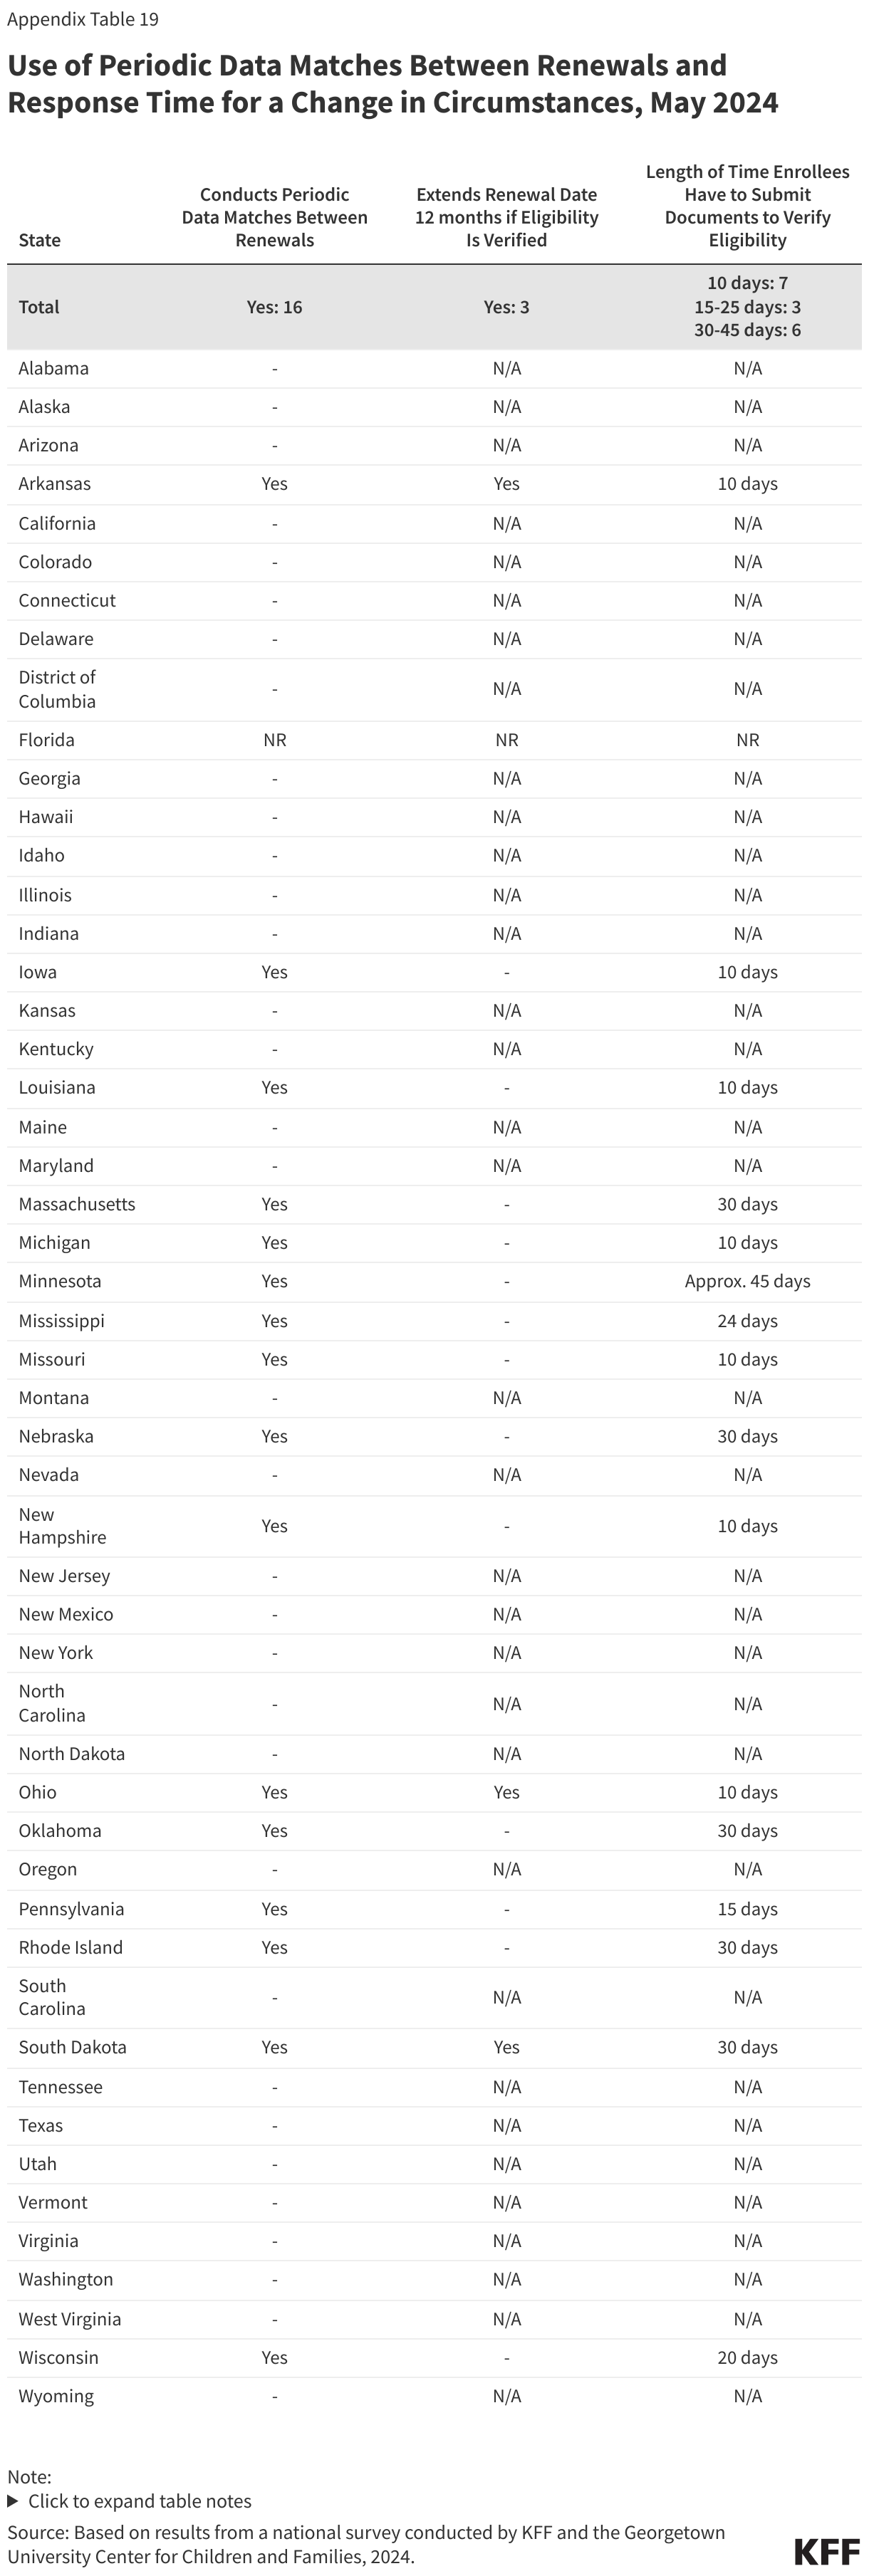
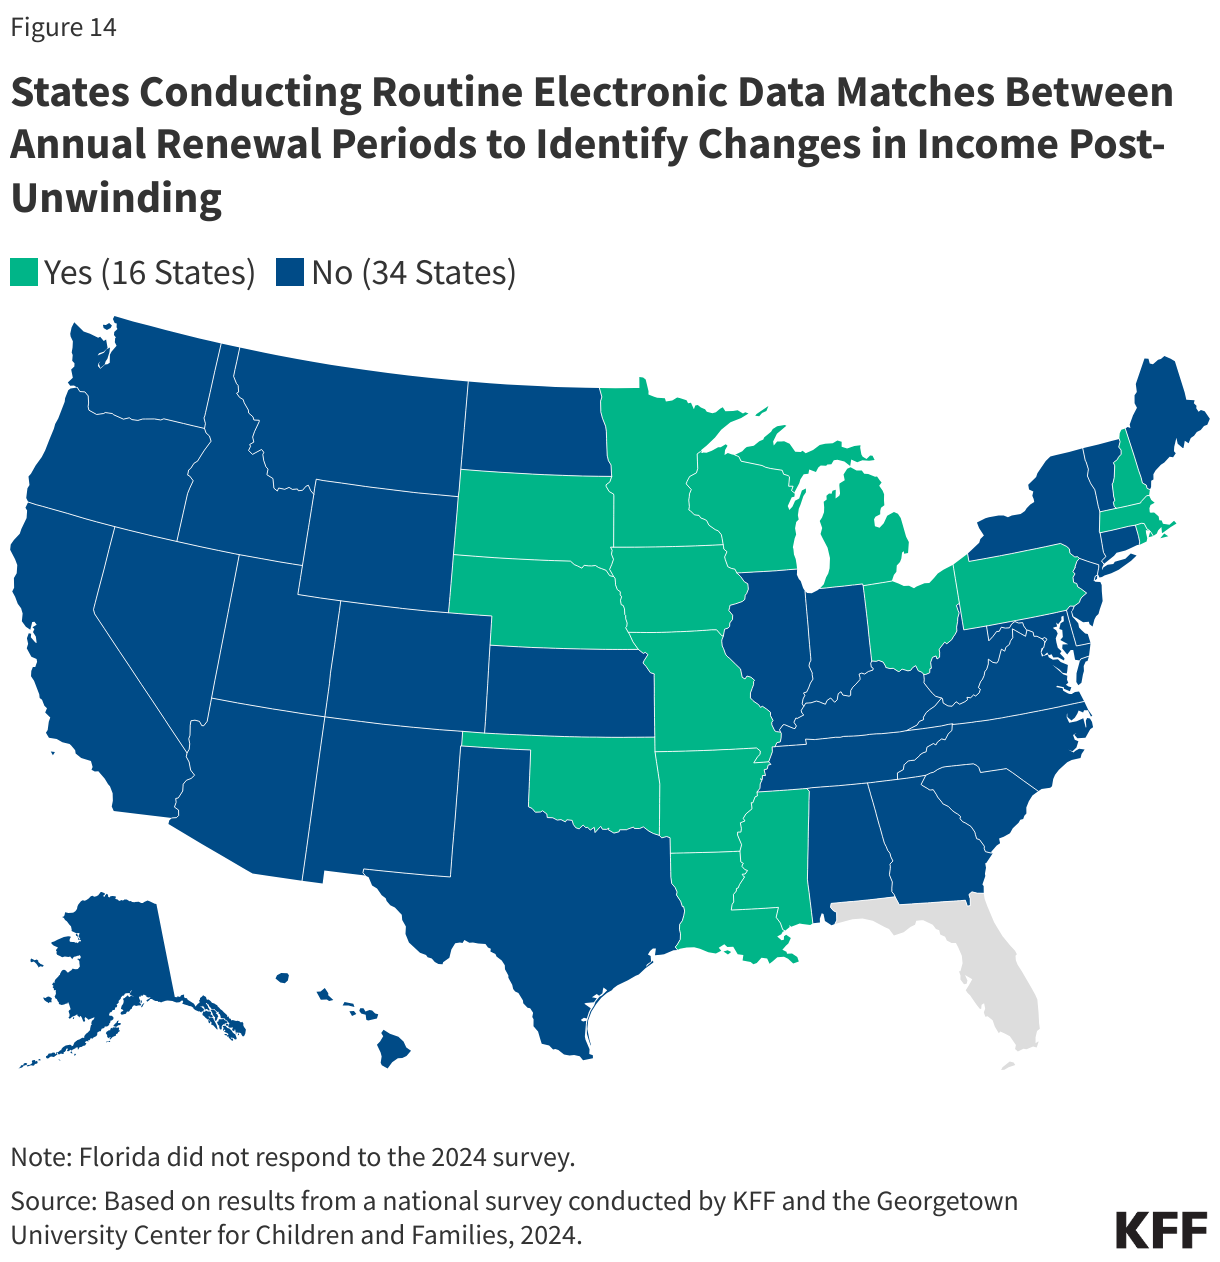
One-third of the states (16) plan to conduct periodic data matches between renewals to identify changes in circumstances (Figure 14). States may only conduct renewals once a year for MAGI enrollees, but without continuous eligibility, states are required to act on reported changes in circumstances that affect eligibility, most often relating to income. States may opt to conduct periodic data checks to identify changes, which are more likely to impact low-income wage earners who experience frequent income fluctuations during the year. In these cases, enrollees may churn off and back onto coverage, creating gaps in access and continuity of care, as well as creating additional work for eligibility staff. If ongoing eligibility is confirmed through a mid-year data check, states have the option to push out renewal dates for 12 months but only 3 of the 16 states that conduct periodic data matches do this even if the state has all the information needed to do so. Additionally, nearly half of these states (7) provide only ten days for enrollees to respond to a request for information although known delays in mail delivery can make it challenging for enrollees to submit information before coverage is terminated. The Eligibility and Enrollment rule will require states to provide 30 days for enrollees to respond to requests for information beginning in June 2027, which aligns with the current rules for renewals.
(Back to top)
Medicaid and CHIP Eligibility
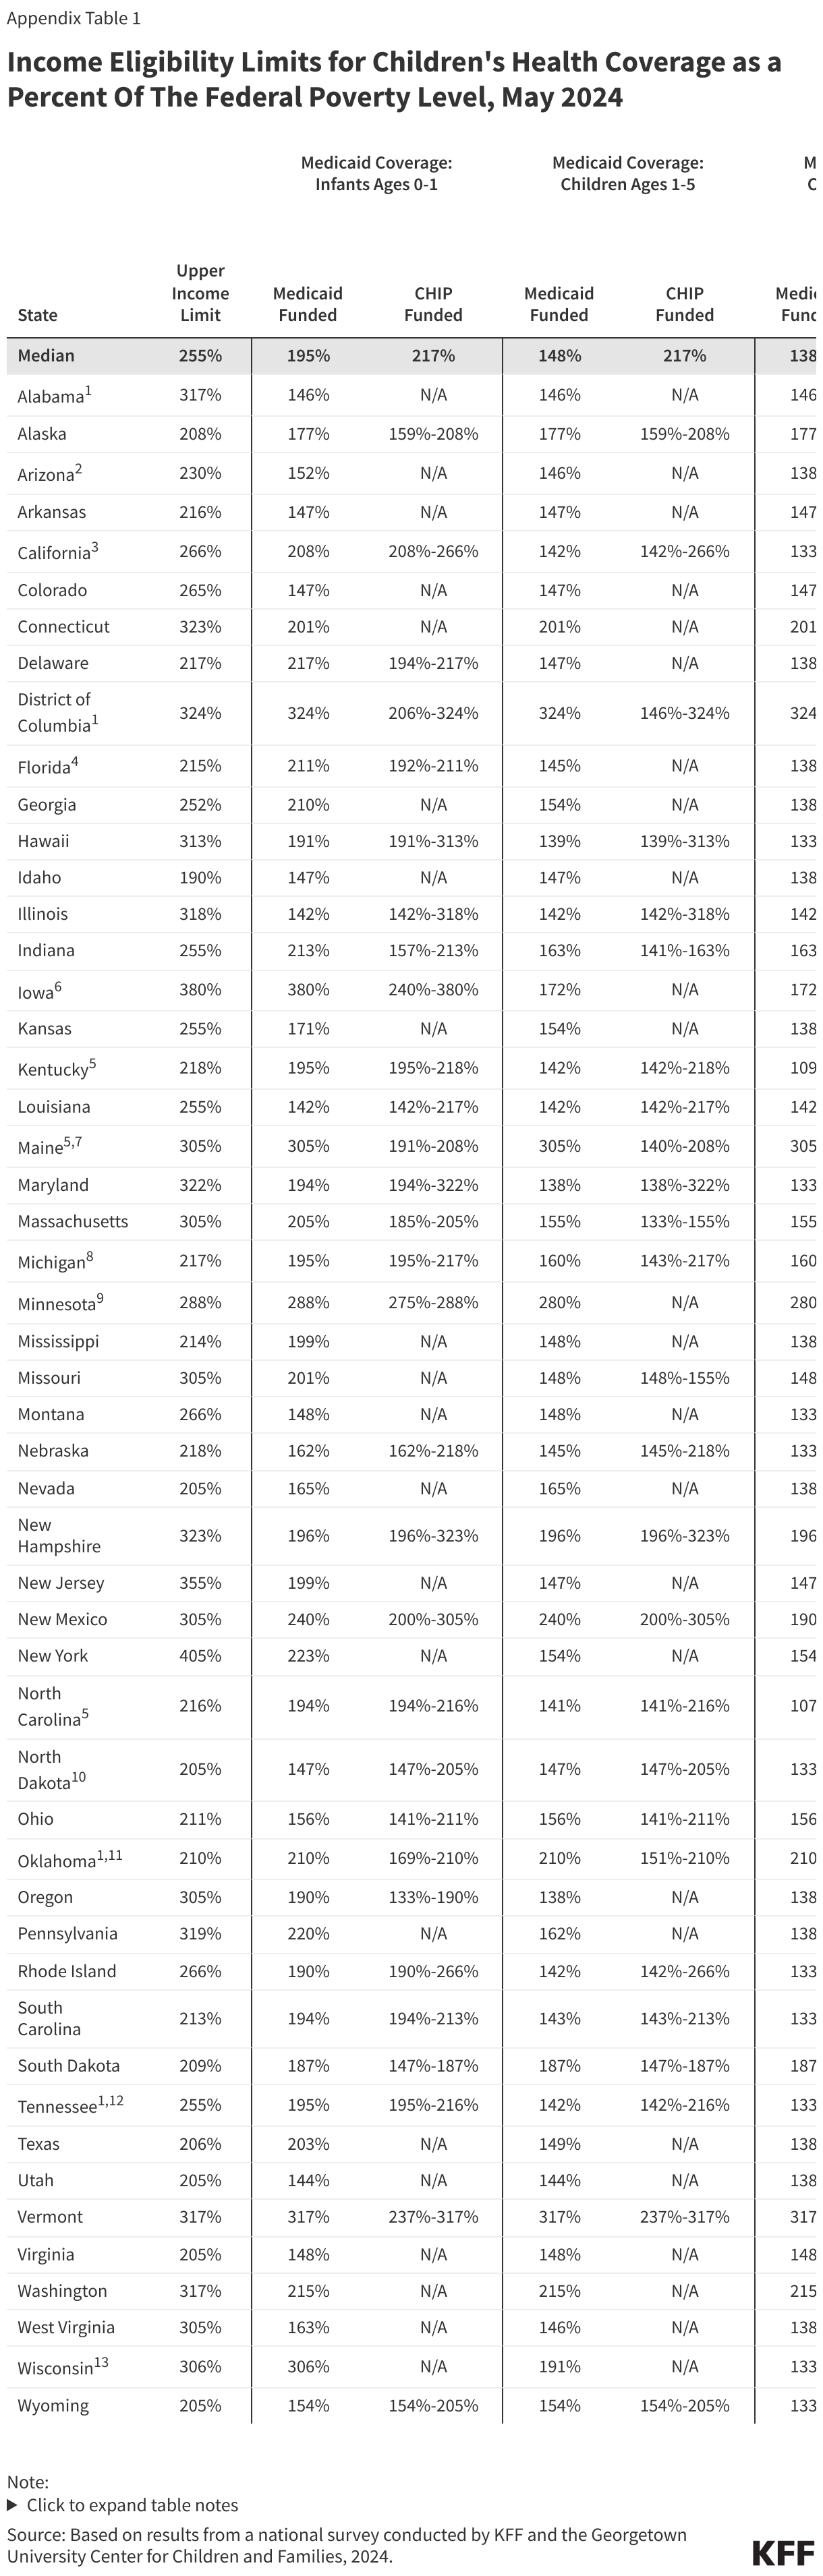
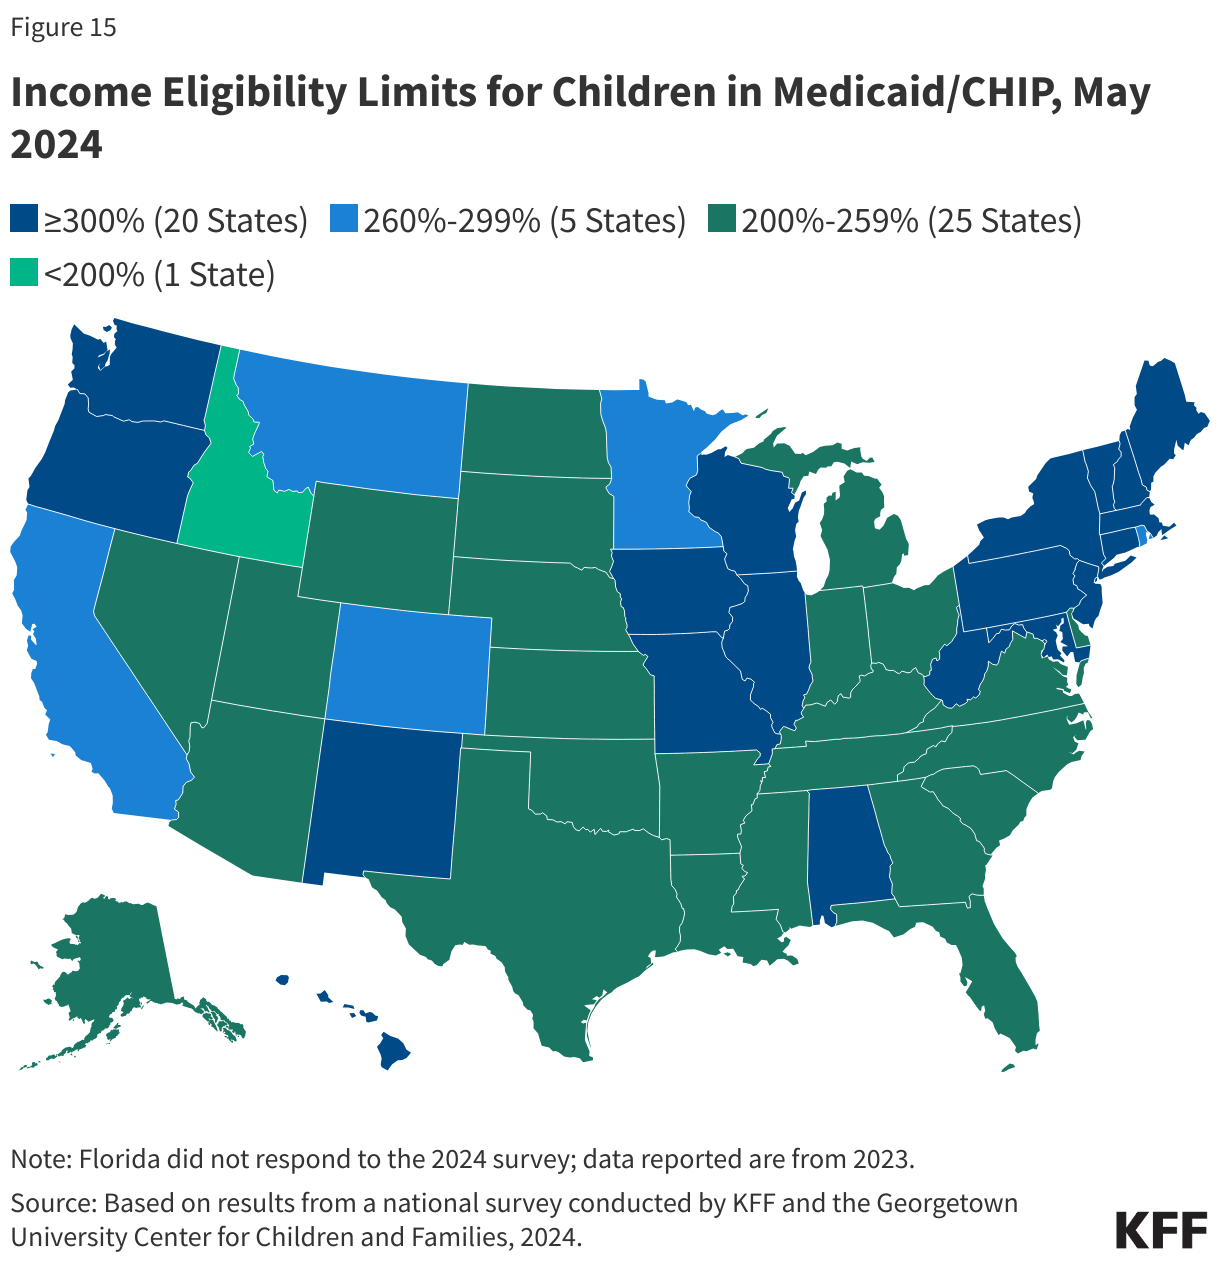
Child eligibility remains the highest for all MAGI eligibility groups, with the median children’s upper eligibility level holding steady at 255% FPL. Three states expanded children’s eligibility levels–Arizona increased eligibility from 205% FPL to 230% FPL in its separate CHIP program, Maine raised eligibility from 213% FPL to 305% FPL, while North Dakota expanded child eligibility to 205% FPL, up from 175% FPL. With the increased eligibility in North Dakota, Idaho now has the lowest eligibility level for children at 190% FPL and is the only state with a child eligibility level below 200% FPL. New York still has the highest child eligibility level at 405% FPL. As of May 2024, 20 states cover children at or above 300% FPL (Figure 15).
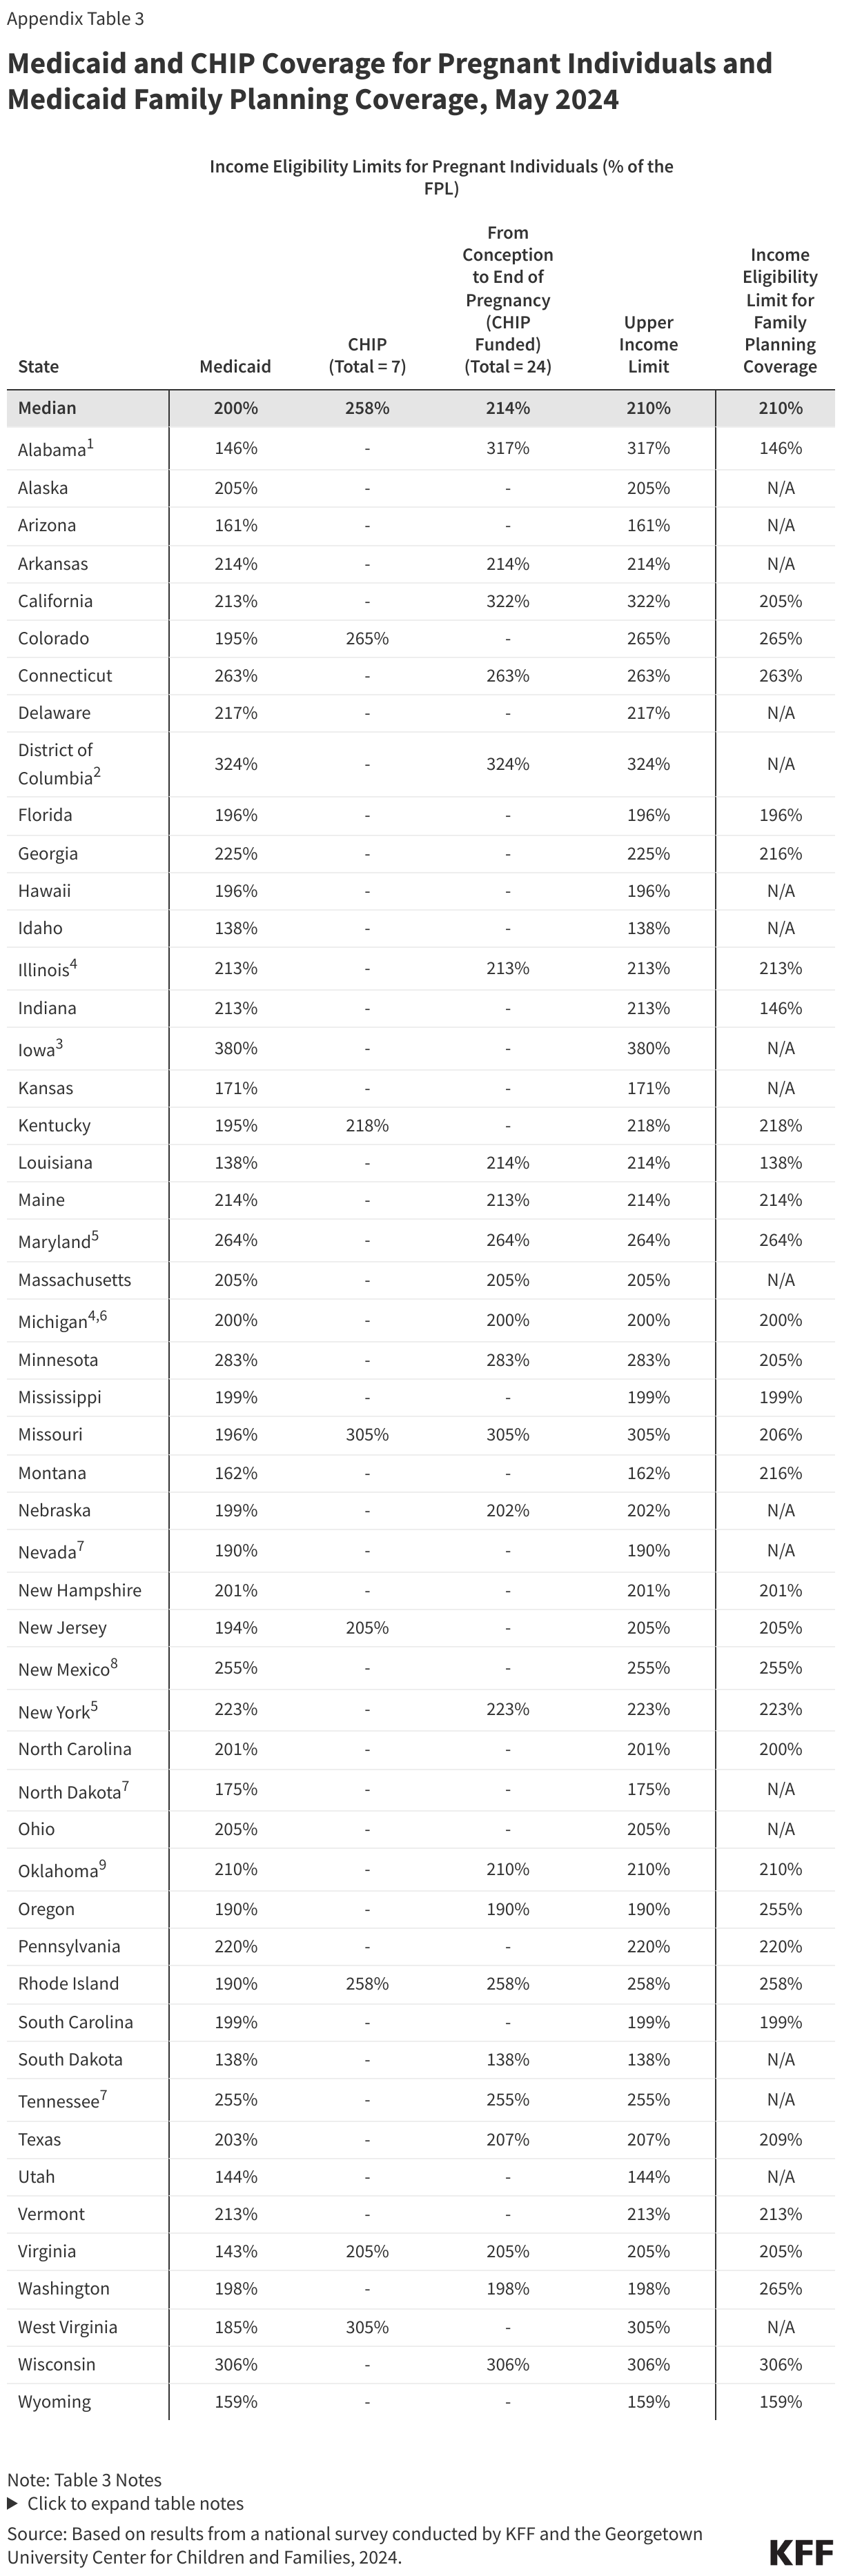
The median eligibility limit for pregnancy coverage in Medicaid and CHIP increased to 210% FPL with eligibility expansions in three states. Nevada, North Dakota, and Tennessee all increased eligibility levels for pregnancy coverage; Tennessee implemented the most significant change, increasing the pregnancy eligibility level from 200% FPL to 255% FPL. As of May 2024, 36 states provide pregnancy coverage to individuals with income at or above 200% FPL. Eligibility levels range from 138% FPL in Idaho and South Dakota to 380% FPL in Iowa. However, Iowa recently passed legislation that will reduce eligibility for pregnancy and infant coverage in Medicaid, lowering the eligibility levels to 215% FPL effective January 1, 2025 (infants will be covered up to 307% FPL in the state’s separate CHIP program). The CAA made permanent the option for states to extend Medicaid postpartum coverage to 12 months. As of June 2024, 47 states have implemented the 12-month extension.
North Carolina and South Dakota newly implemented the Medicaid expansion and now cover adults with incomes up to 138% percent FPL, leaving ten states without Medicaid expansion. South Dakota voters passed a ballot initiative in 2022 and the state implemented coverage in July 2023. In May 2023, North Carolina passed legislation to adopt Medicaid expansion and coverage began in December 2023, making it the first state to implement Medicaid expansion via legislative action, rather than a ballot initiative, since Virginia in 2018. As of May 2024, parents and adults without dependent children with incomes at or below 138% FPL ($20,783 per year for an individual; $35,632 for a family of three in 2024) are covered in 41 states.
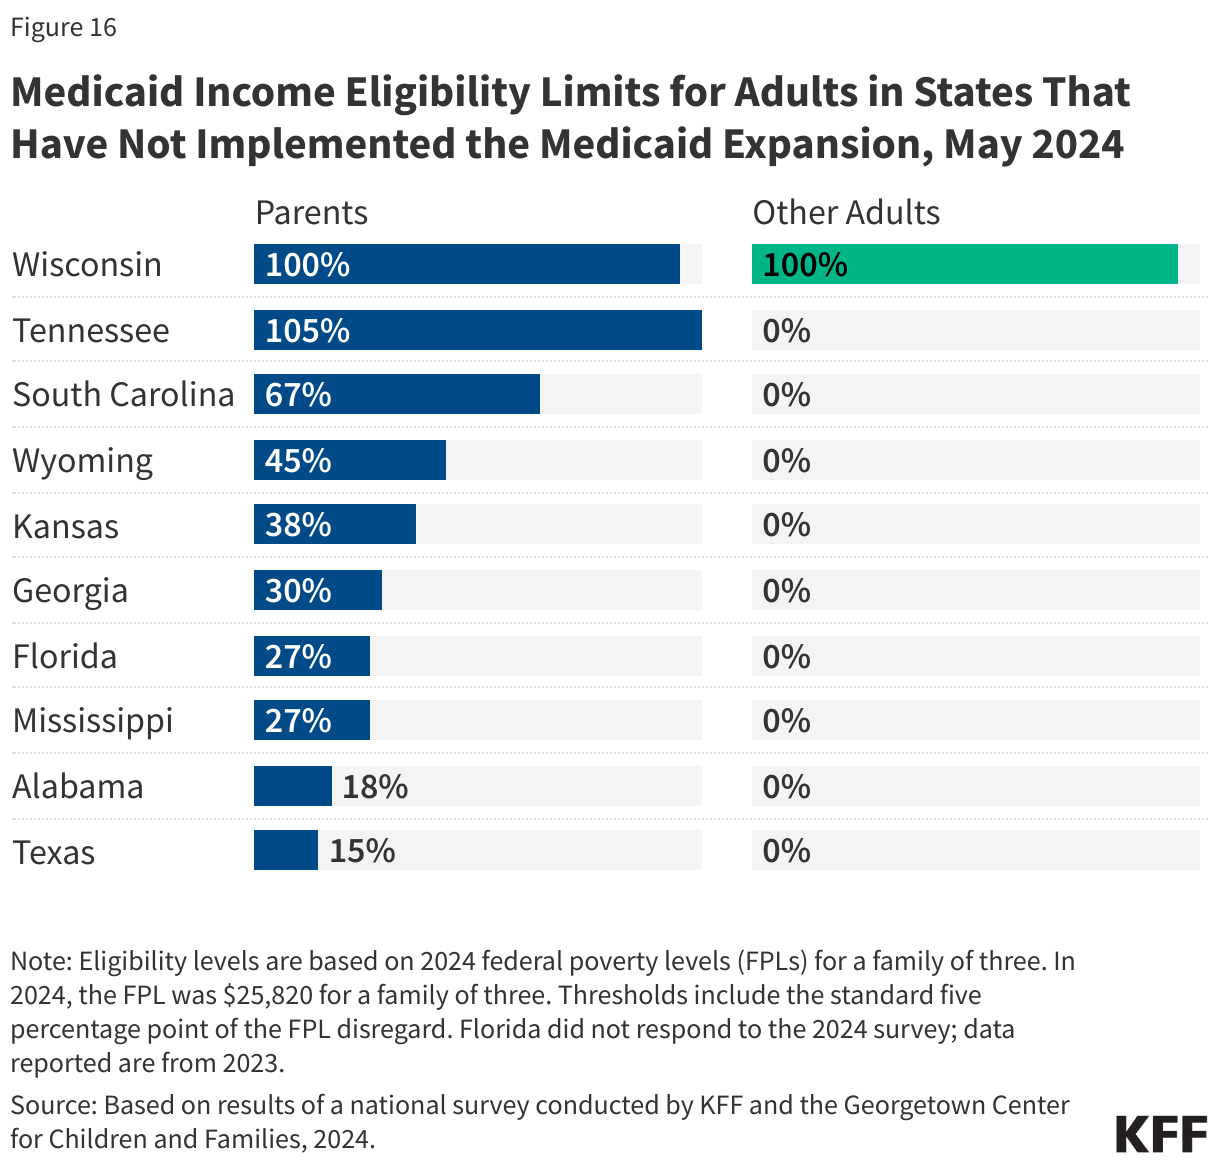
In states that have not implemented Medicaid expansion, median eligibility for parents decreased to 34% FPL. Five of the remaining non-expansion states (Florida, Georgia, Mississippi, Texas, and Wyoming) use fixed dollar thresholds to determine income eligibility for parents and caretaker relatives (Tennessee recently received CMS approval to set parent eligibility at 105% FPL rather than base eligibility on a fixed dollar amount). Dollar thresholds are not routinely updated so the equivalent federal poverty level eligibility threshold decreases over time as the federal poverty level increases to account for inflation. In 2024, Mississippi was the only state to adjust its dollar threshold, from $480 per month to $492 for a family of three. Eligibility for parents and caretaker relatives ranges from a low of 15% FPL in Texas to 105% FPL in Tennessee and 100% in Wisconsin, with median eligibility at 34% FPL for the ten non-expansion states (Figure 16). Of the ten states that have not implemented Medicaid expansion, Wisconsin is the only one that provides coverage to adults without dependent children based on income eligibility, setting eligibility at the same level as parents (100% FPL) through a section 1115 waiver. In September 2023, Georgia implemented a waiver to cover parents who do not qualify for section 1931 parent/caretaker eligibility and childless adults with incomes up to 100% FPL if they meet a work and premium requirement as conditions of initial and continued eligibility.
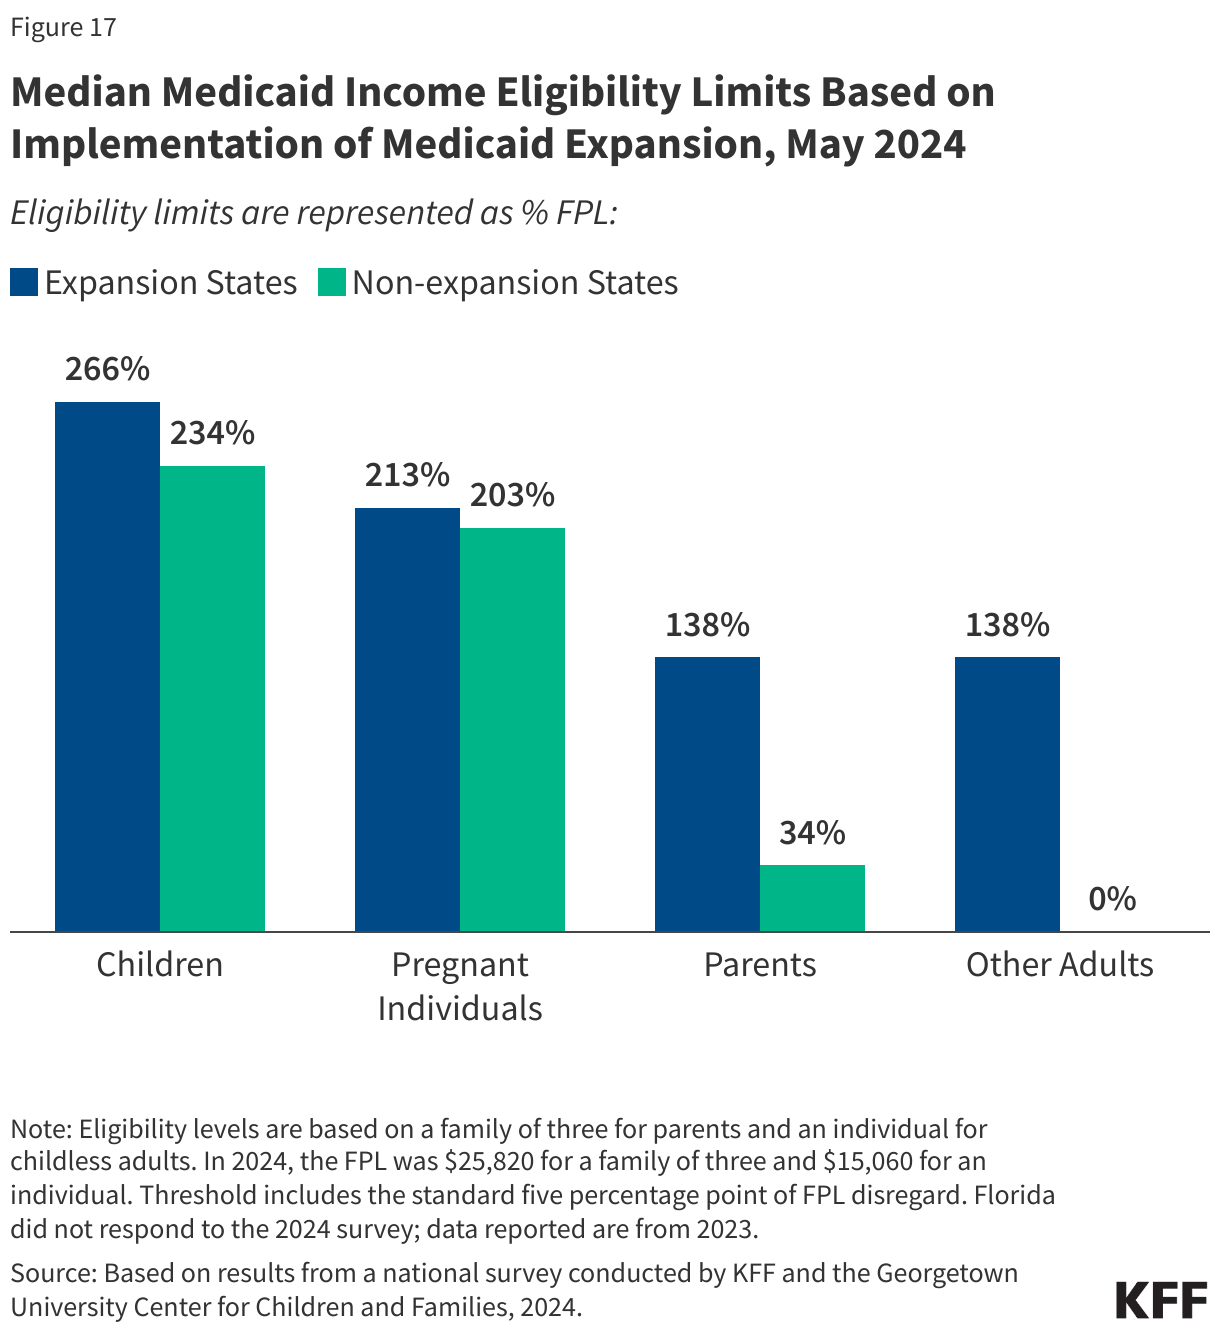
Non-expansion states have lower median eligibility levels for all MAGI Medicaid groups. Although no non-expansion state covers adults without dependent children, these states also have lower median eligibility levels for children (234% FPL compared to 266% FPL in expansion states), for pregnancy coverage (203% FPL compared to 213% FPL), and for parents (34% FPL compared to 138% FPL) (Figure 17).
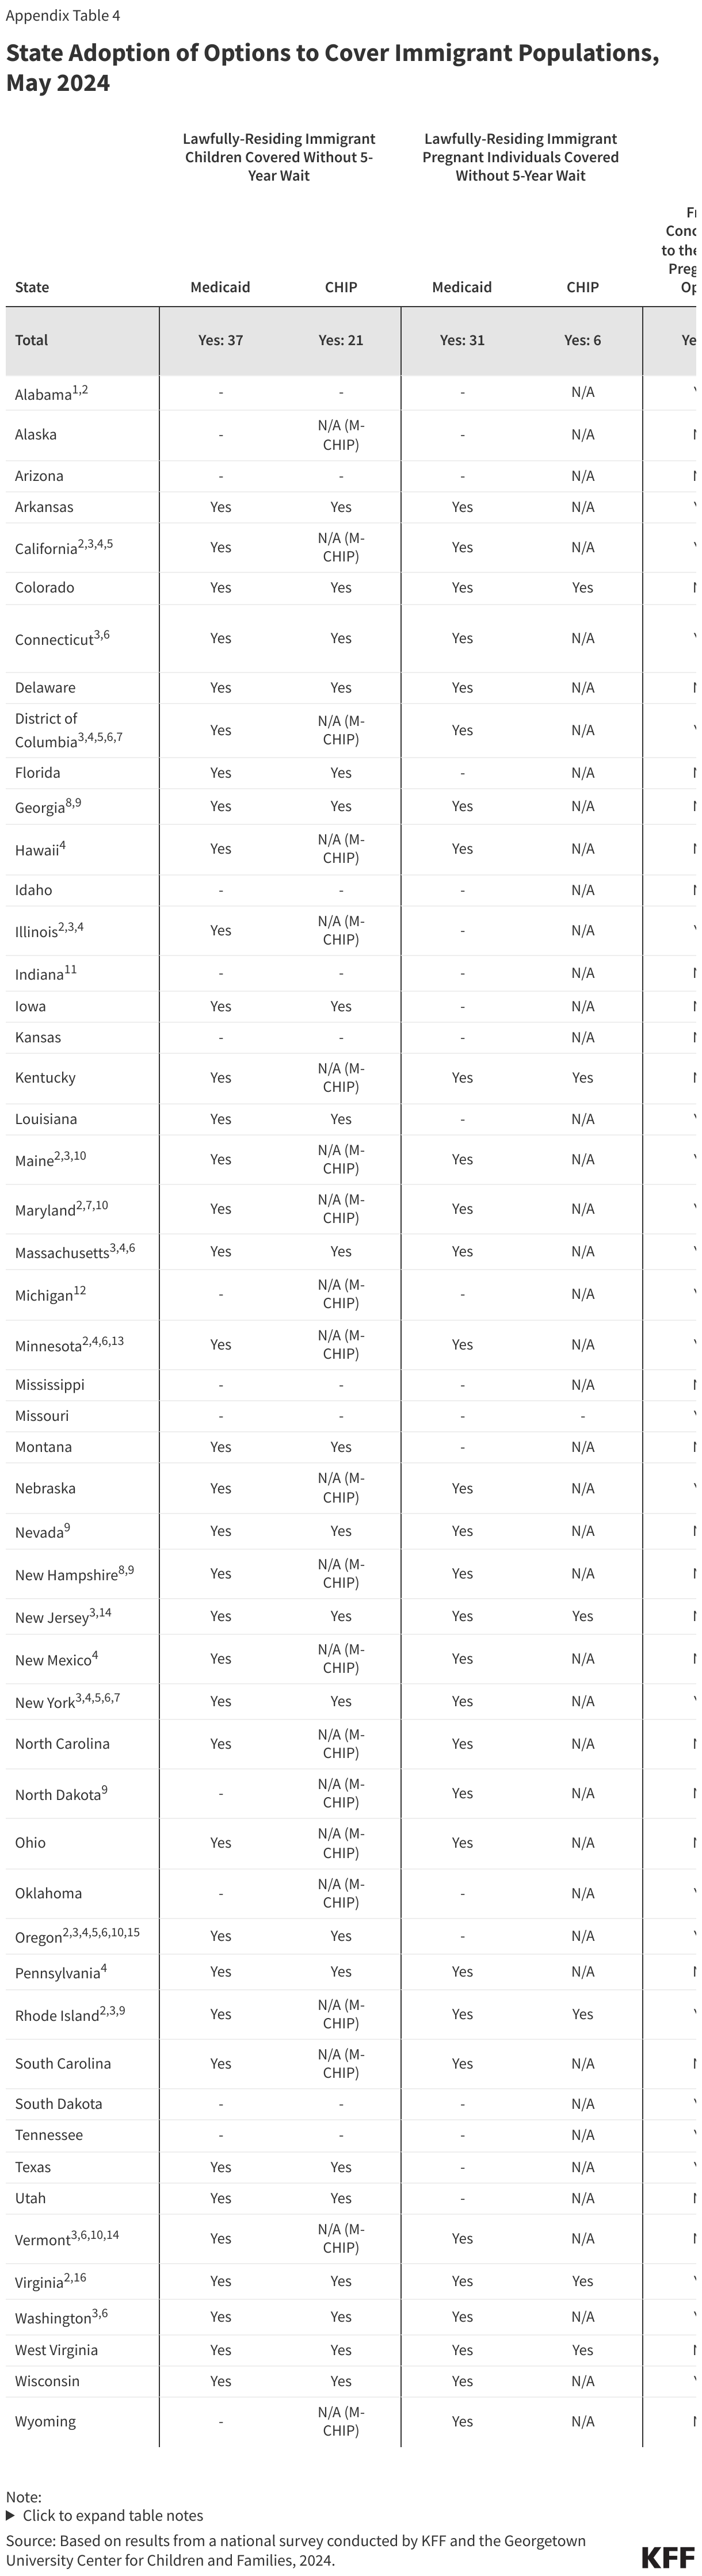
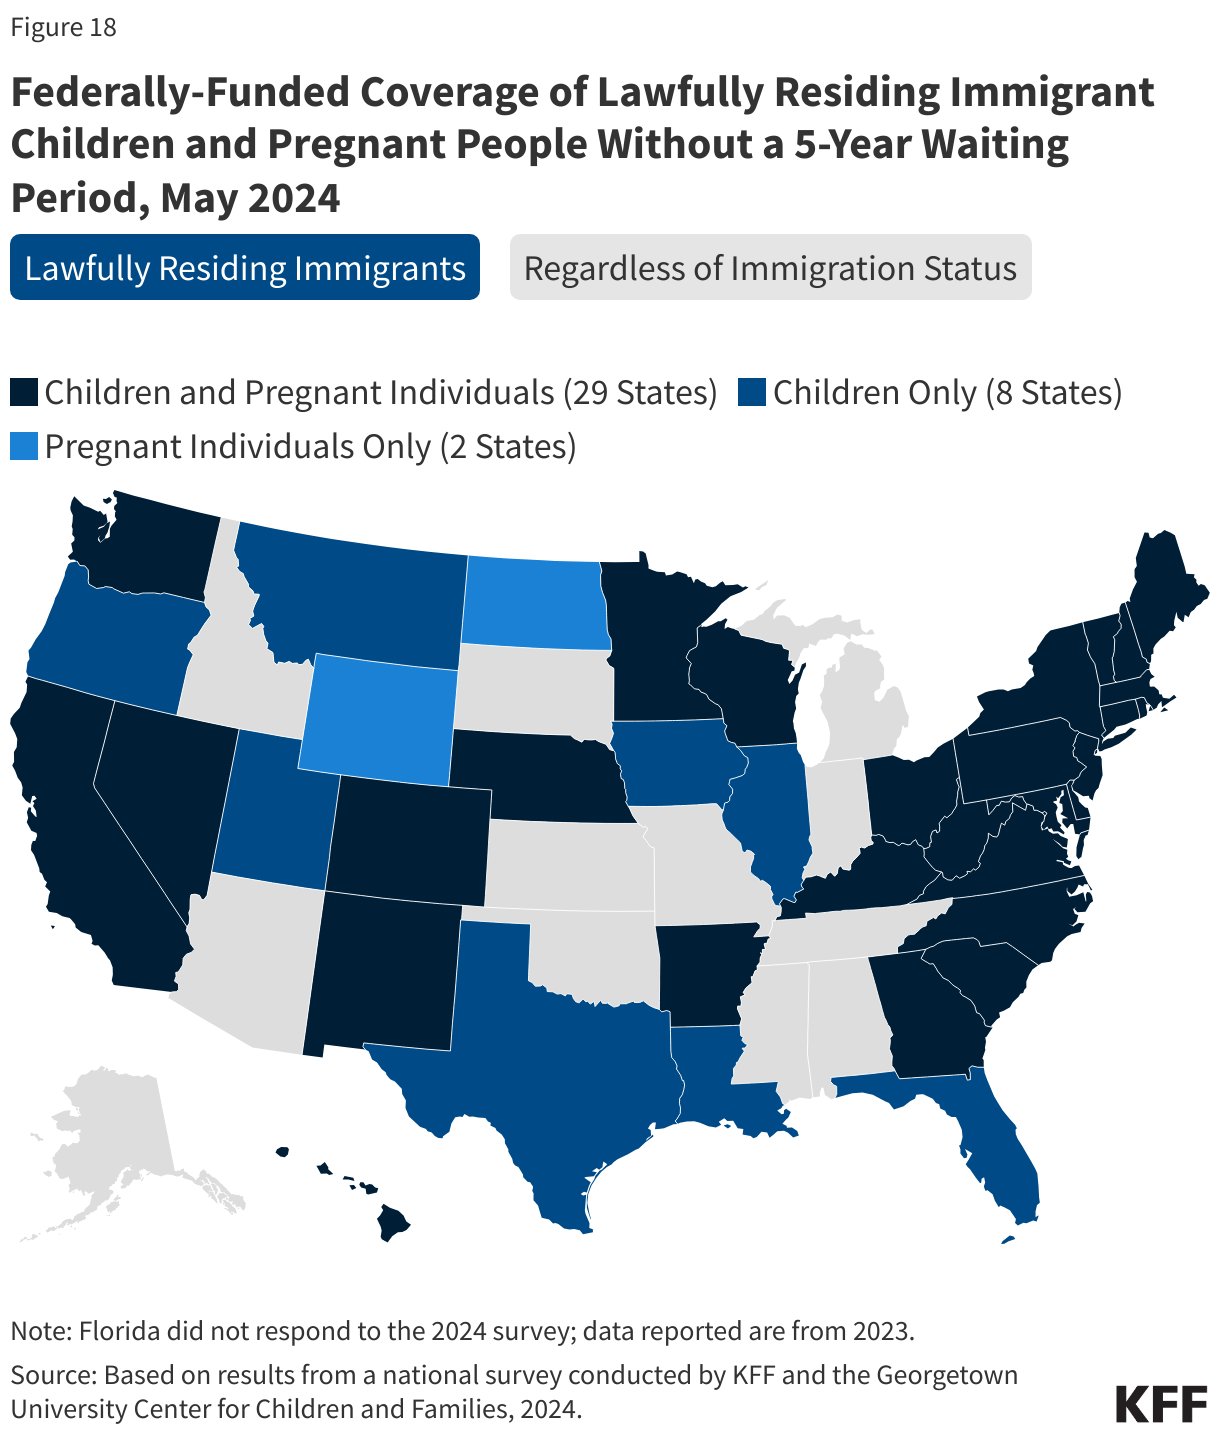
As of May 2024, 45 states have adopted federally funded options to extend coverage to some immigrant children and/or pregnant individuals (Figure 18). Most lawfully residing immigrants must wait five years after they obtain qualified status before they can enroll in Medicaid or CHIP. However, states have the option to waive the five-year waiting period for lawfully residing children and pregnant people. As of May 2024, 37 states have adopted this option for children and 31 states have taken up the option for pregnant people in Medicaid, as have six of the seven states using CHIP to cover pregnant adults. All states covering recent lawful residents during pregnancy, except North Dakota and Wyoming, have adopted the option for children as well. Michigan is planning to eliminate the waiting period for children and pregnant individuals in August and Indiana plans to do so in 2025. In addition, states can provide pregnancy coverage regardless of immigration status through the From Conception to the End of Pregnancy (FCEP) option in CHIP. Twenty-four states provide this coverage, including two states (Maryland and New York) and the District of Columbia that newly adopted the FCEP option in 2023 and early 2024. Almost a dozen states (11) are also providing 12 months of postpartum coverage for FCEP enrollees using CHIP health services initiative funds or state funds, and one state (Maryland) is providing four months of postpartum coverage.
States are increasingly using state-only funds to extend coverage or limited benefits to some immigrant children, pregnant individuals, and other adults who do not have federal pathways to coverage. Thirteen states now cover all income-eligible children regardless of immigration status using state funds, although Connecticut only covers children under age 13 and Utah, which newly implemented this coverage, caps the number of children who can be enrolled. Vermont and New Jersey also provide state-funded coverage to pregnant people who do not qualify for federal funding, although New Jersey’s coverage is limited to pre-natal care. As of May 2024, ten states use state-only funds to cover other immigrant adults who are otherwise ineligible, including three states (California, District of Columbia, and Oregon) that cover all income-eligible adults regardless of immigration status.
Two states, Illinois and Michigan, newly implemented family planning expansion programs, increasing the median eligibility level for these programs to 210% FPL. Thirty-three states now use federal funds through a state plan option or waiver to cover family planning only services. Oklahoma also expanded eligibility for its family planning program from 138% FPL to 210% FPL, which aligns with eligibility levels for pregnancy coverage in the state. As of May 2024, eligibility levels ranged from 138% FPL in Louisiana to 306% FPL in Wisconsin.
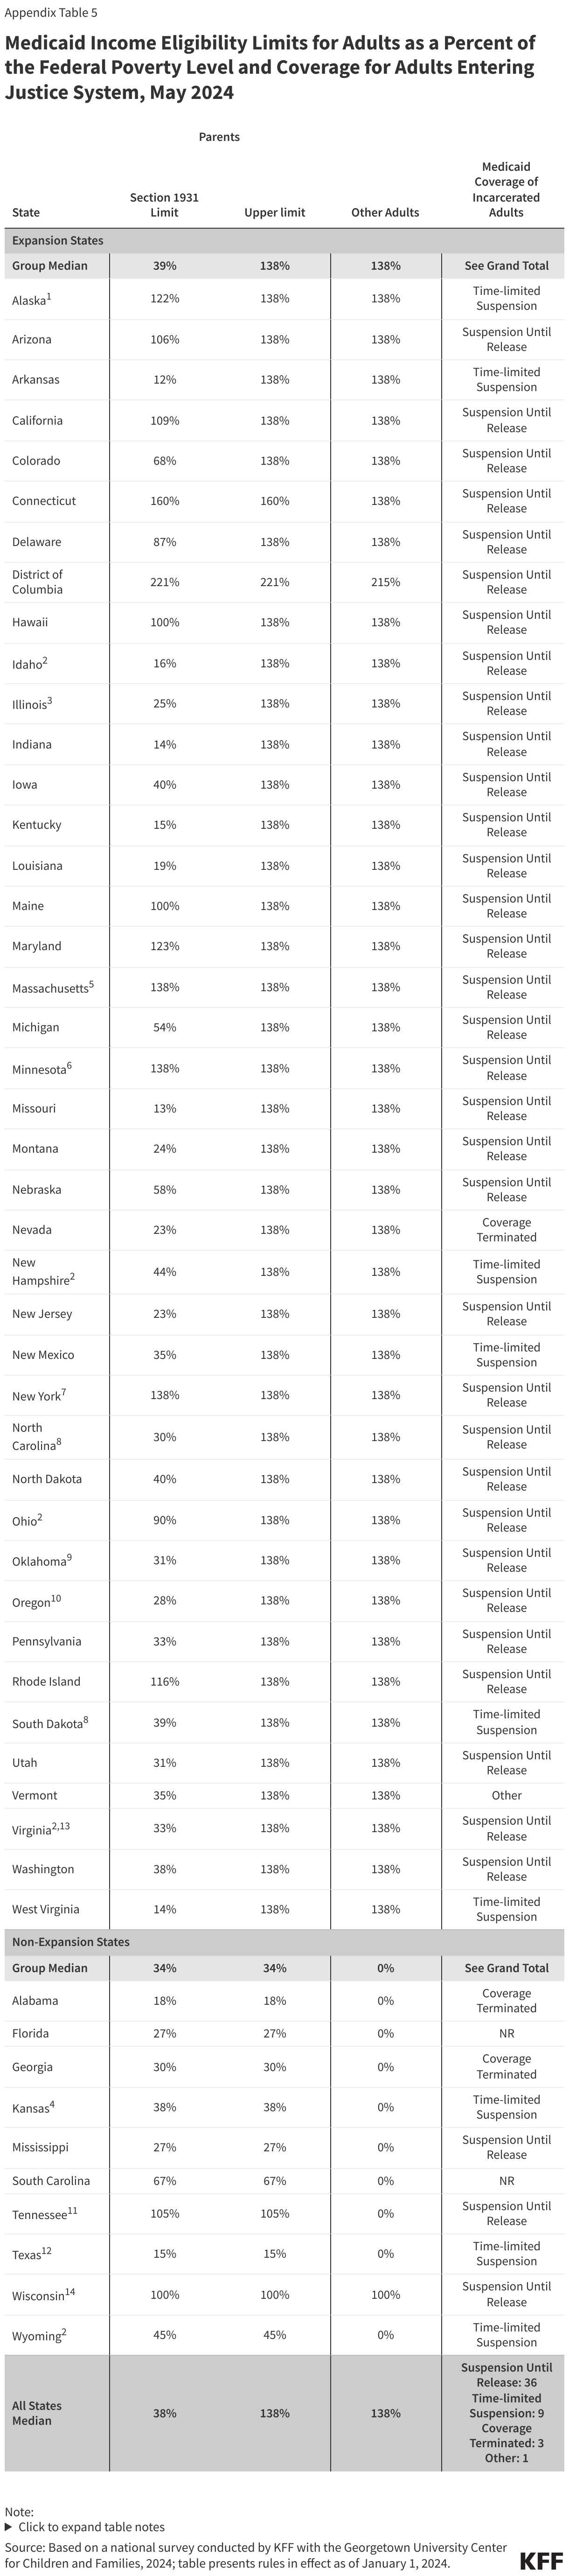
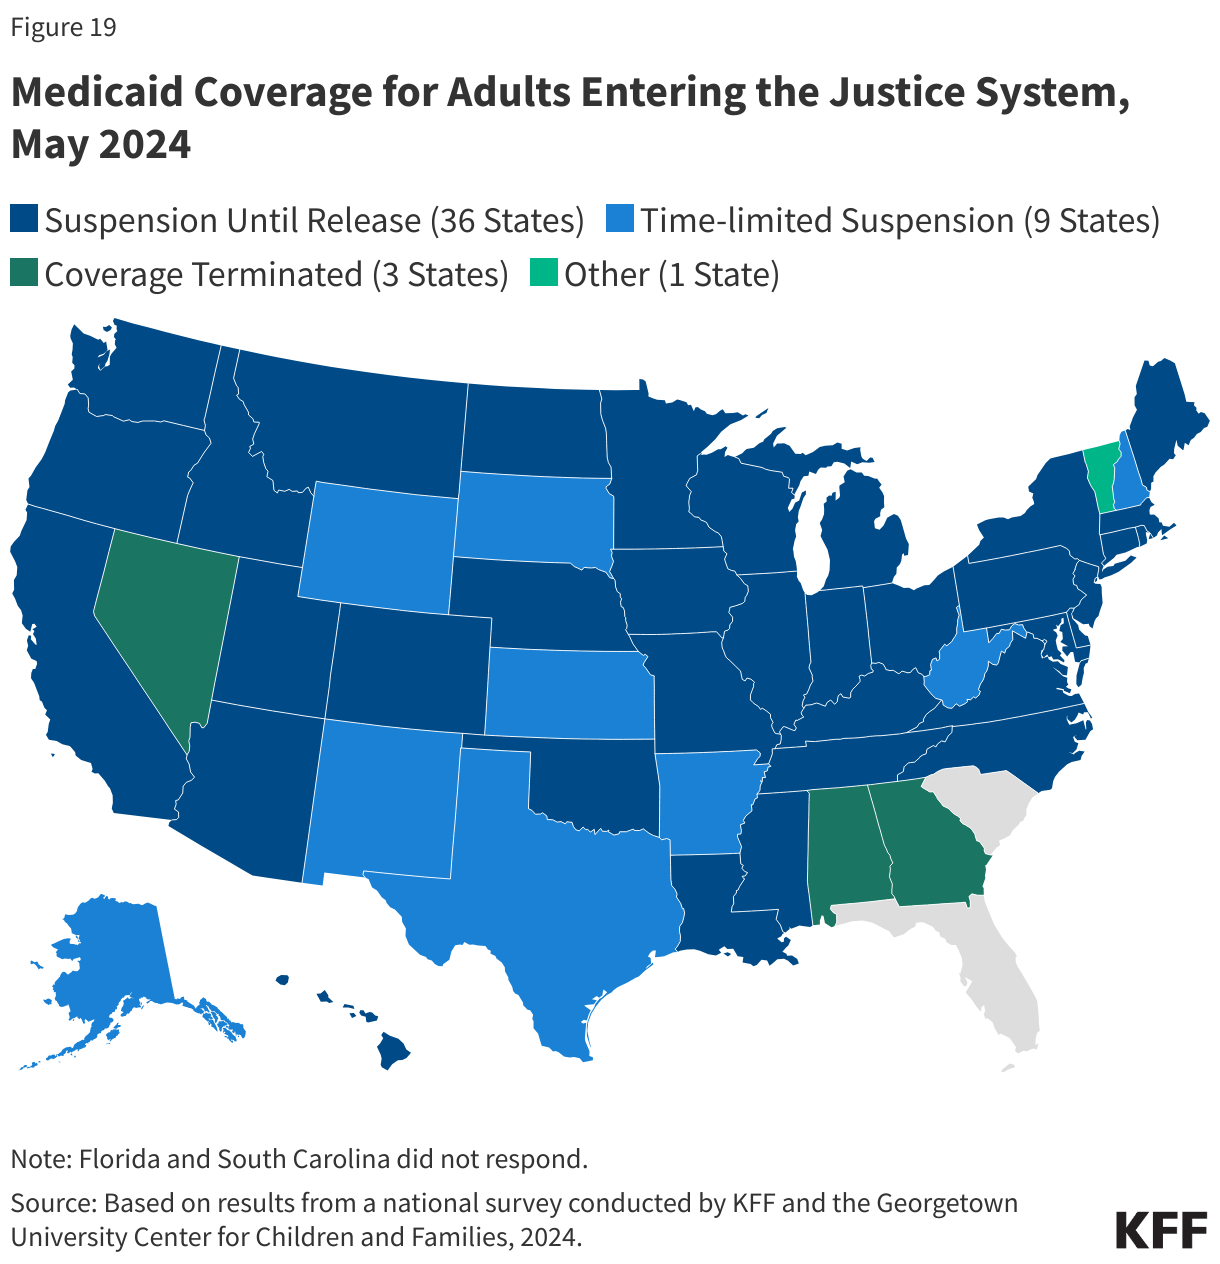
Most states suspend Medicaid coverage for adults (45 states) during incarceration (Figure 19). Federal law provides that incarceration status does not preclude eligibility for Medicaid. However, Medicaid benefits are limited to inpatient services requiring at least a 24-hour stay in a medical institution. Since passage of the ACA, more individuals entering and leaving carceral settings are eligible for Medicaid. In response, more states have opted to suspend rather than terminate coverage for adults to facilitate reinstatement of coverage upon release. New rules that went into effect on October 24, 2019 prohibit states from terminating coverage for eligible juveniles. The CAA requires states to suspend rather than terminate Medicaid coverage for all individuals who are incarcerated starting January 1, 2026.
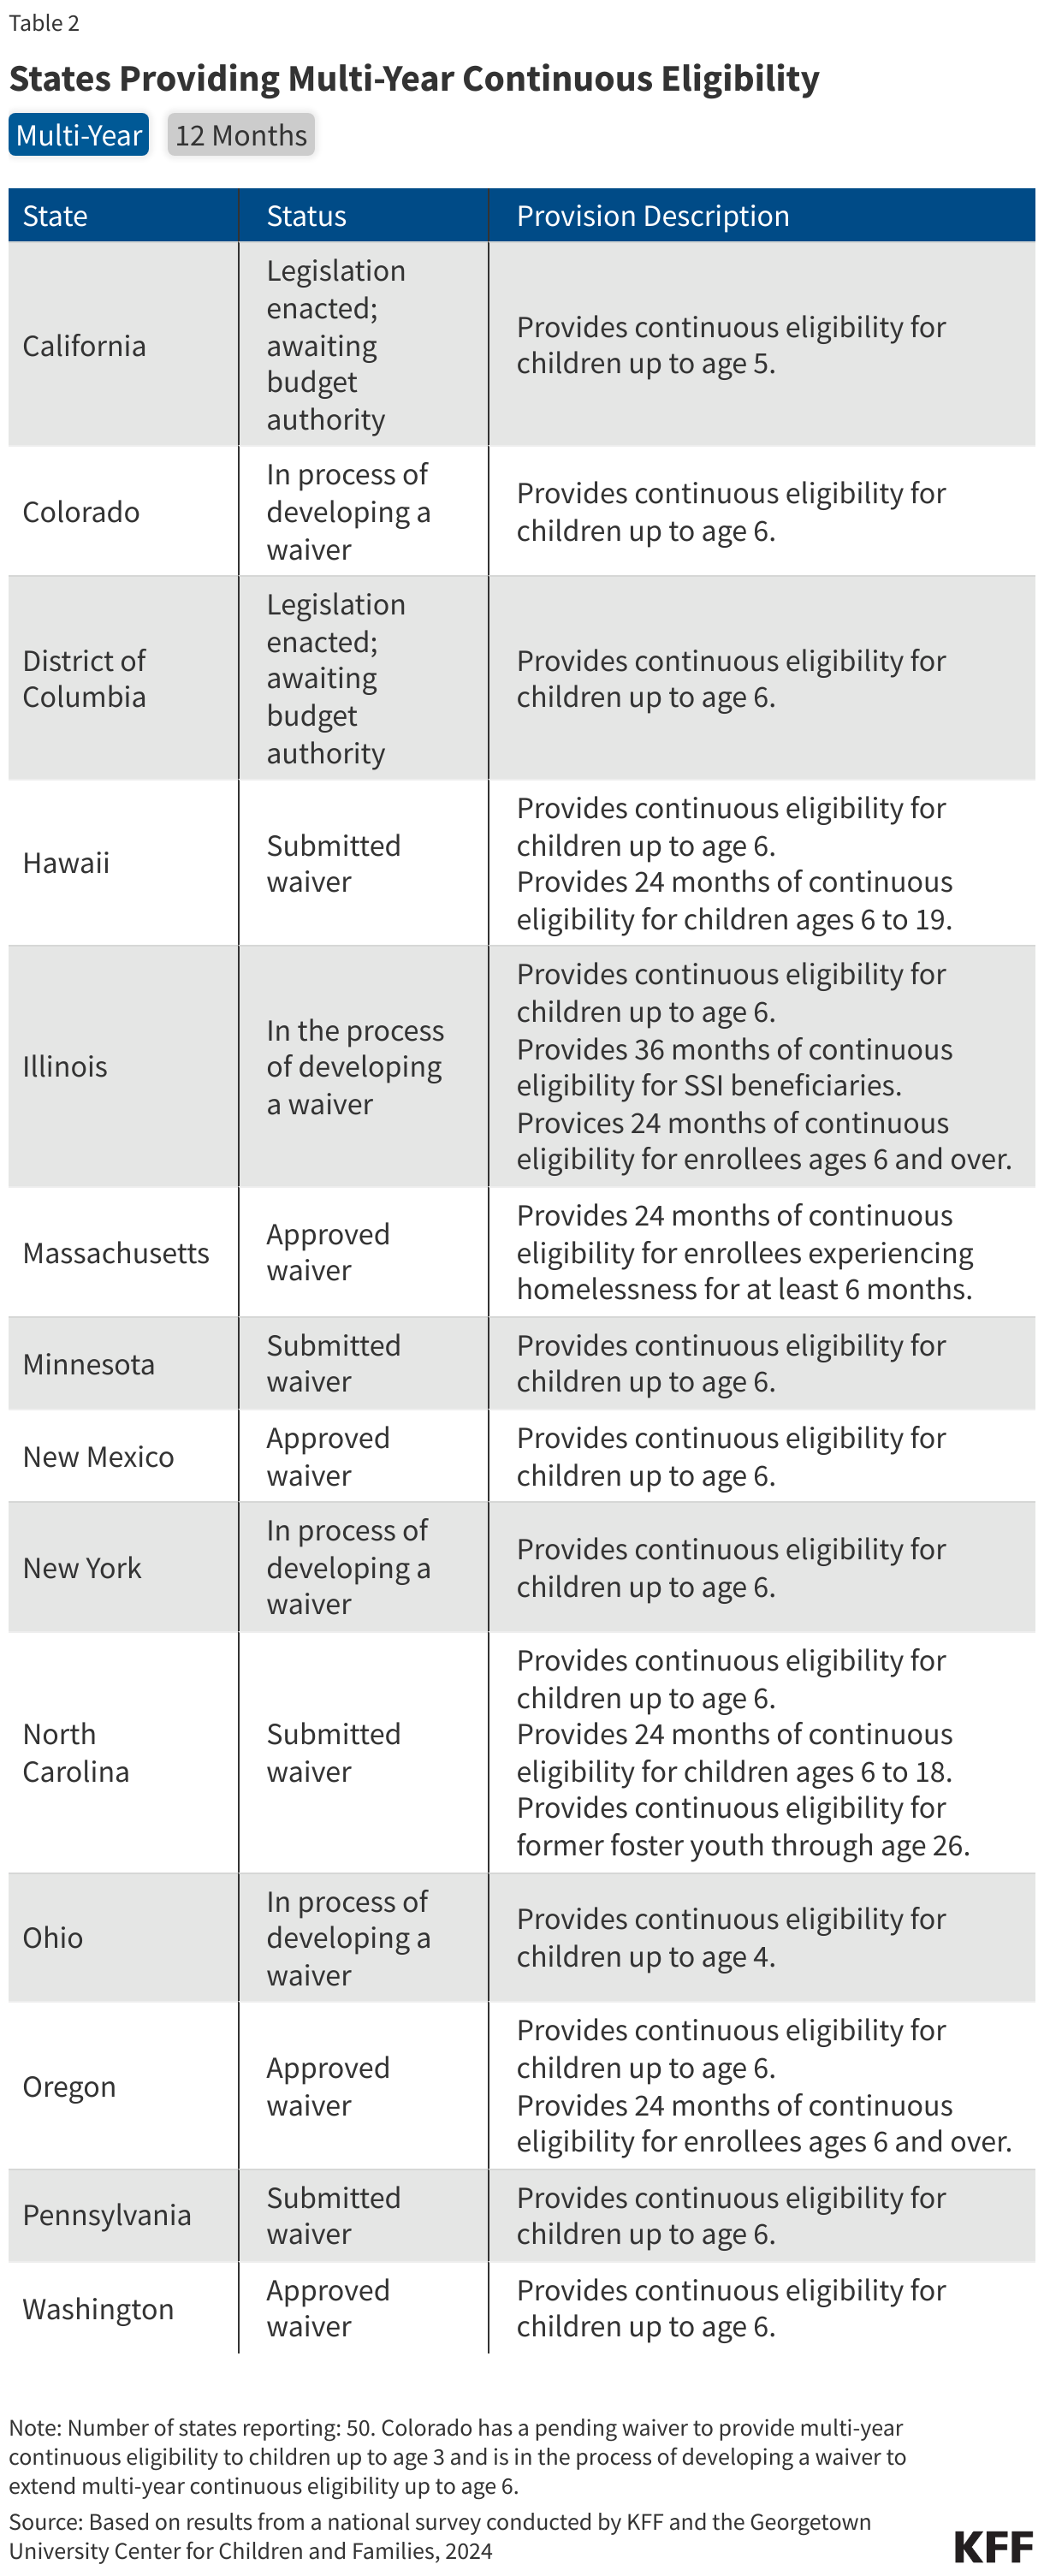
All children in Medicaid and CHIP are now protected from mid-year churn with mandatory 12-month continuous eligibility while 13 states are taking additional steps to provide multi-year continuous eligibility for children. Twelve-month continuous eligibility was a longstanding state option for children although only about half the states had adopted the policy in Medicaid. As of January 2024, all states are now required to keep children continuously enrolled for a full year with limited exceptions for moving out of state or requesting voluntary disenrollment. However, 13 states are seeking to provide continuous eligibility beyond 12 months for young children, which promotes continuity of coverage and access to care during the early development period. New Mexico, Oregon, and Washington have federal approval to cover eligible children continuously from birth to age six, while ten other states have submitted section 1115 waivers or are in the process of developing waivers to implement multi-year continuous eligibility for young children (Table 2). Oregon has also received federal approval to cover children over the age of six and all adults for two continuous years. Nine other states also cover or are proposing to cover targeted adult groups for continuous periods, including three states that provide multi-year continuous eligibility and six states that provide 12-month continuous eligibility to all or some adults (Massachusetts provides both 12-month continuous eligibility for all adults and 24-month continuous eligibility to adults experiencing homelessness).
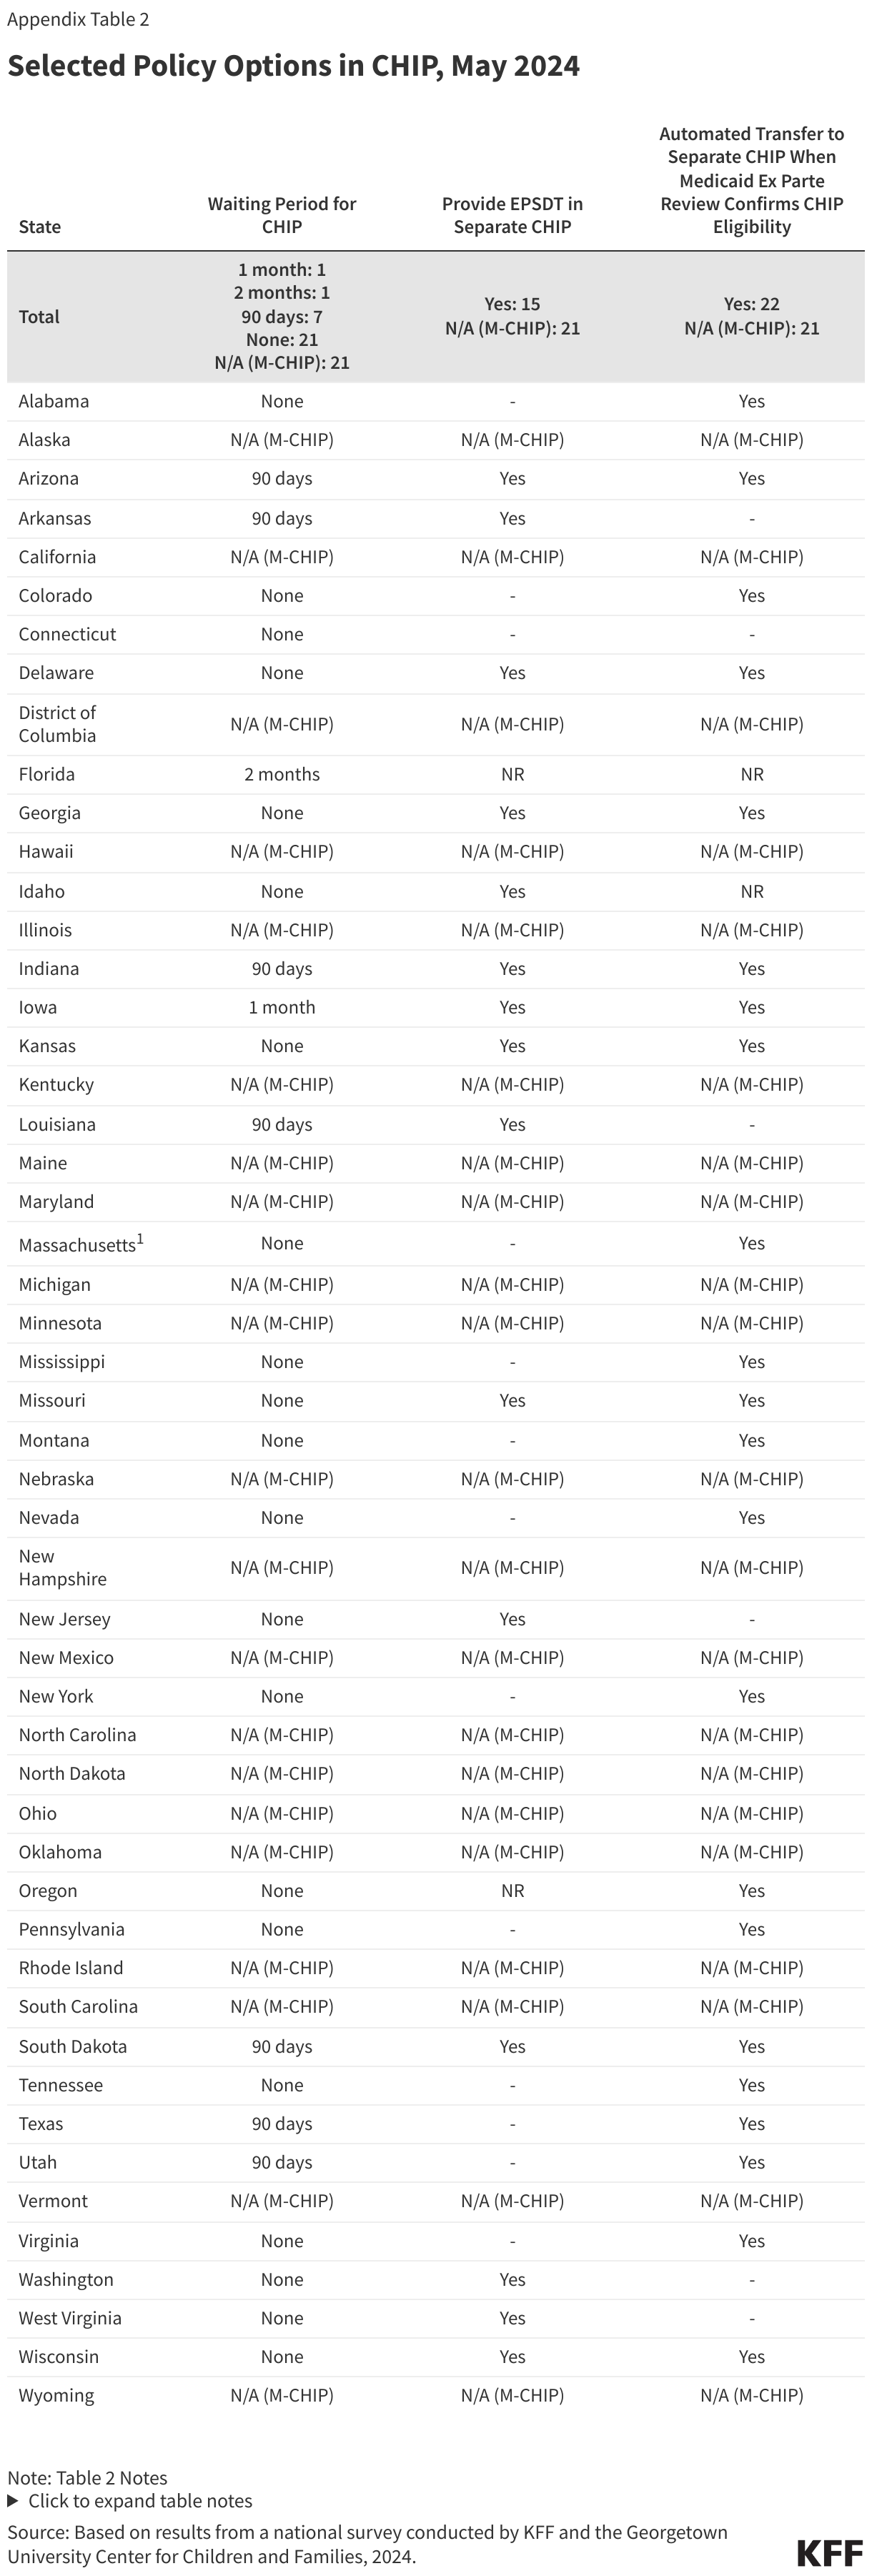
Nine states have retained waiting periods before an uninsured child is eligible for CHIP, down from 38 states a decade ago. CHIP waiting periods are a mechanism to discourage families from dropping group insurance to enroll in CHIP. Citing little evidence of substitution of coverage and temporary coverage options available to CHIP-eligible children during a waiting period, the Eligibility and Enrollment final rule eliminates CHIP waiting periods effective June 2025.
Premiums and Non-Payment Policies for Children
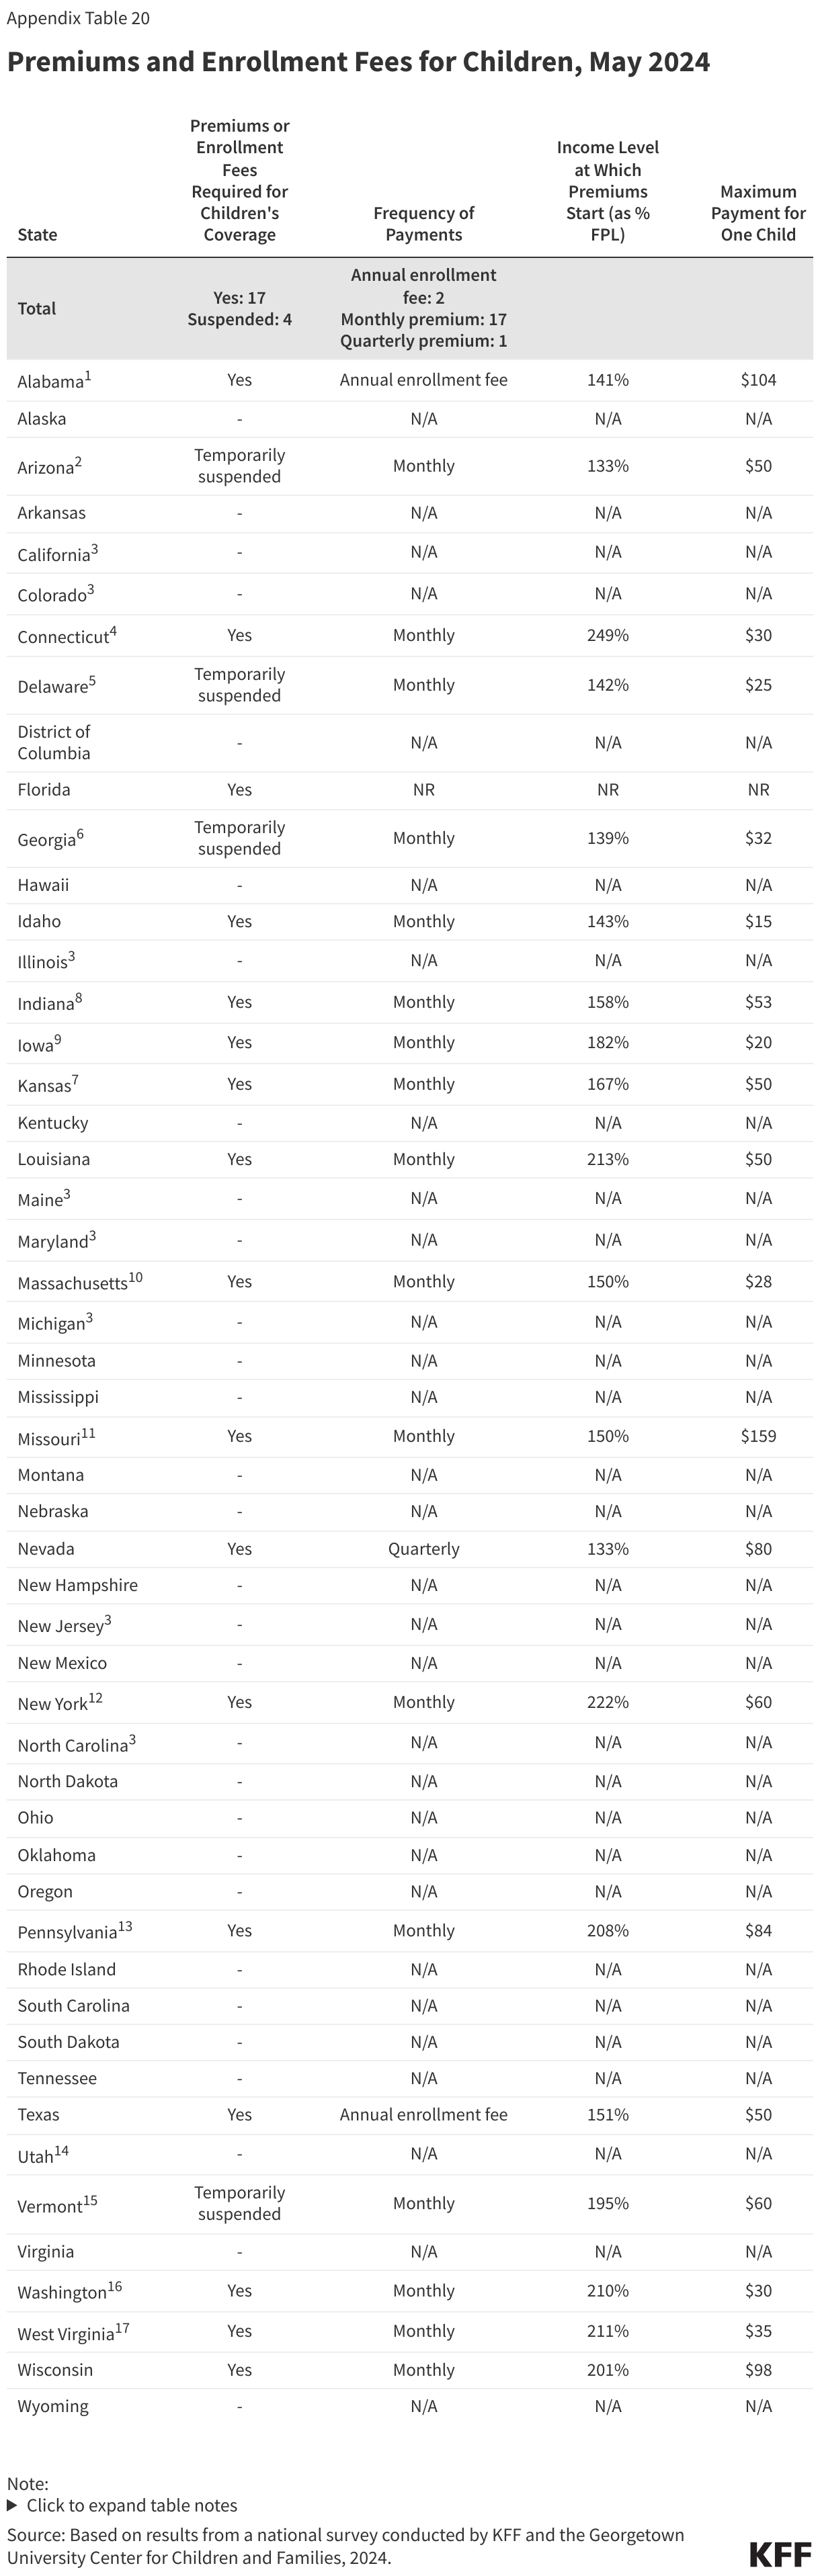
Twenty-one states charge premiums for children (Figure 20). States cannot impose premiums in Medicaid or M-CHIP for children with income below 150% FPL but are permitted to charge premiums in their separate CHIP programs with family incomes as low as 133% FPL. Under federal rules, the maximum out-of-pocket costs for all enrolled members of families can be required to pay is limited to no more than 5% of total family income, which states must track to ensure families do not pay more than the cap. During the COVID-19 public health emergency, most states that charged premiums suspended or waived them for some or all enrollees. As of May 2024, premiums remain suspended in four states (Arizona, Delaware, Georgia, and Vermont). California, Colorado, Illinois, Maine, Maryland, Michigan, New Jersey, and North Carolina all removed CHIP premiums since 2020, and Utah will eliminate premiums in July but will increase other cost-sharing requirements at the same time. Delaware is awaiting CMS approval to discontinue premiums entirely and Vermont has suspended premiums indefinitely.
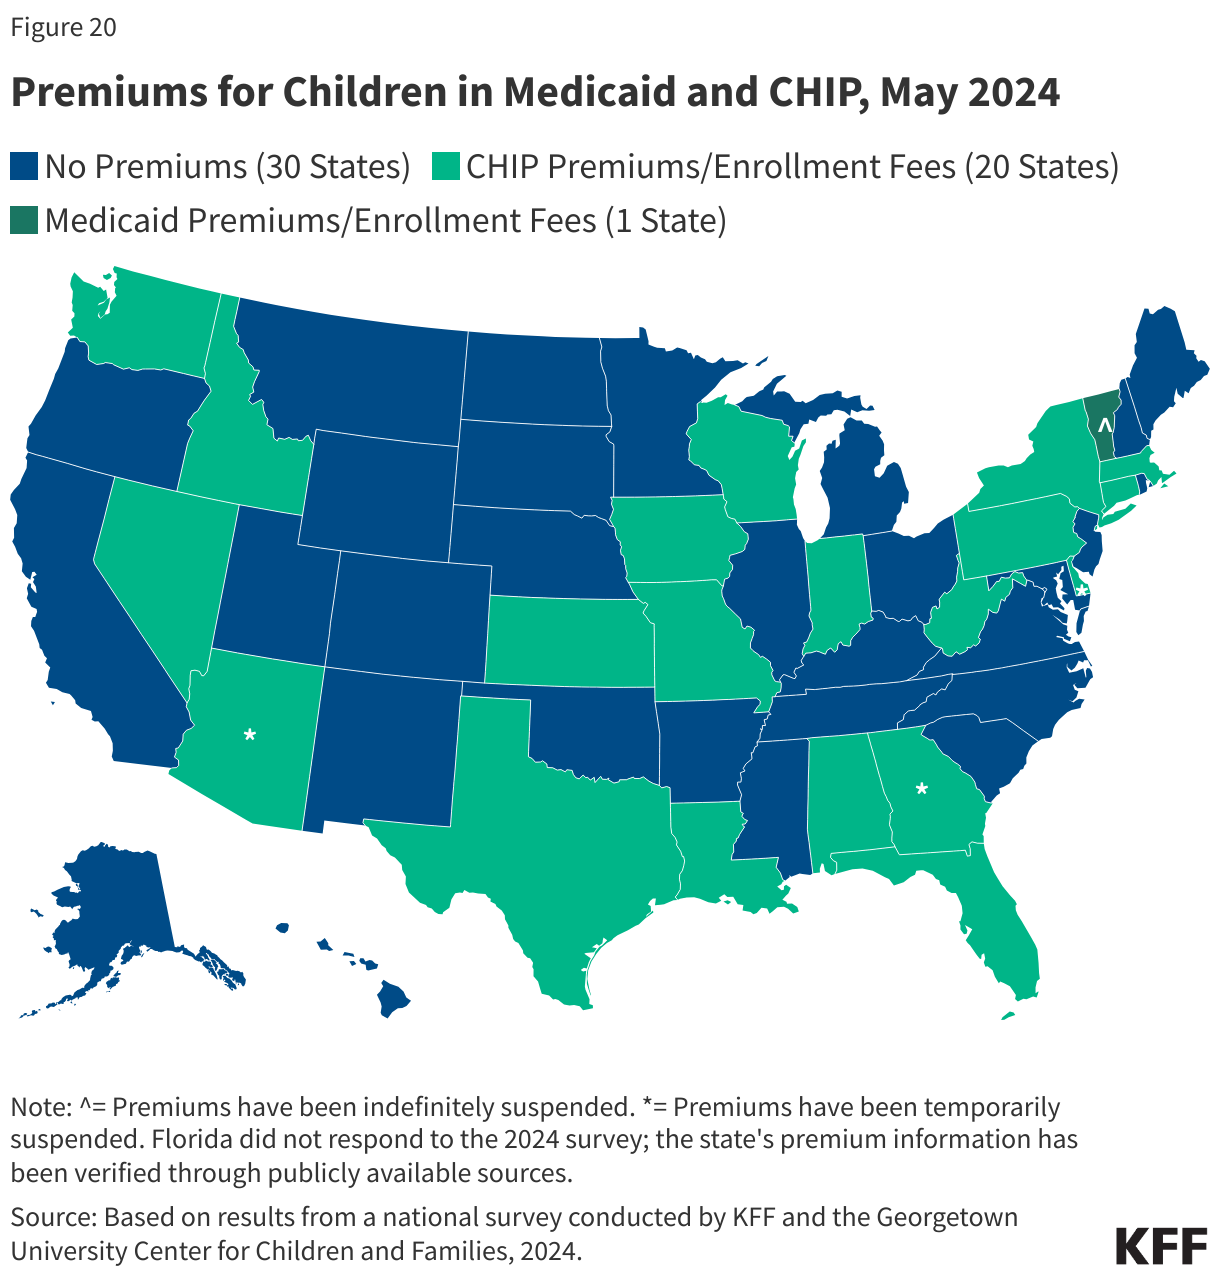
Premium amounts and periodicity vary by state. States may impose premiums on a monthly, quarterly, or annual (also known as an enrollment fee) basis. Most states (17) that charge premiums do so monthly while one state charges quarterly premiums (NV) and 2 states (AL and TX) require an annual enrollment fee. Premiums can be family-based (7 states) or charged per child, either with a family maximum that limits the amount of premiums a household pays (10 states) or without a family cap (3 states). As of May 2024, the maximum premium or enrollment fee for one child ranges from $15 in Idaho to $159 in Missouri. The premium amount often varies by income level. Six states charge premiums to children with family incomes below 150% FPL. New York eliminated premiums for the lowest income band in 2022, so premiums now begin at 222% FPL instead of 160% FPL.
New federal rules will affect states’ current policies for non-payment of premiums, including for the nine states that have lockout periods. As part of the CAA, 12-month continuous eligibility for children in Medicaid and CHIP became mandatory for all states. With this change which went into effect January 1, 2024, states are no longer allowed to disenroll individuals for non-payment of premiums after initial enrollment. In the Eligibility and Enrollment regulation CMS made several changes to CHIP, including prohibiting states from locking enrollees out of coverage as a penalty for non-payment of premiums. While new lockout periods cannot be established in states that do not have them, states that currently impose a lockout have until June 2025 to eliminate the policy. As of May 2024, eight states have a lock-out period, with seven imposing the maximum allowable lock-out period of 90 days (Indiana, Kansas, Louisiana, Missouri, Nevada, Pennsylvania, and Washington). Since 2020, Massachusetts and Wisconsin have eliminated lock-out periods in CHIP.(Back to top)


 Irving Washington
  Hagere Yilma