House Committee on Appropriations Releases FY 2025 Labor, Health and Human Services, Education, and Related Agencies (Labor HHS) Appropriations Bill & Accompanying Report

Published: Jul 9, 2024

The House Committee on Appropriations released its FY 2025 Labor, Health and Human Services, Education, and Related Agencies (Labor HHS) appropriations bill on June 26, 2024 and accompanying report on July 9, 2024. The Labor HHS appropriations bill includes funding for U.S. global health programs provided to the Centers for Disease Control and Prevention (CDC) and funding for global health research activities provided to the National Institutes of Health (NIH). Total global health funding at CDC and NIH through the Labor HHS bill is not yet known, as funding for some programs at NIH is determined at the agency level rather than specified by Congress in annual appropriations bills. Funding for global health programs at CDC totals $564 million, which is $129 million (-19%) below both the FY24 enacted level and President’s FY25 request ($693 million). The bill would eliminate all funding for global HIV programs at CDC; all other program areas would be flat funded compared to enacted and request levels. Also, the report includes a provision requesting an update in the FY 2026 congressional budget justification on how agencies “jointly coordinate global health research activities with specific metrics to track progress and collaboration toward agreed upon health goals.” See the table below for additional detail on global health funding. See other budget summaries and the KFF budget tracker for details on historical annual appropriations for global health programs.

KFF Analysis of Global Health Funding in the FY25 House Labor Health & Human Services (Labor HHS) Appropriations Bill

10 Things About Long-Term Services and Supports (LTSS)

Published: Jul 8, 2024

Long-term services and supports (LTSS) encompass the broad range of paid and unpaid medical and personal care services that assist with activities of daily living (such as eating, bathing, and dressing) and instrumental activities of daily living (such as preparing meals, managing medication, and housekeeping). They are provided to people who need such services because of aging, chronic illness, or disability, and include services such as nursing facility care, adult daycare programs, home health aide services, personal care services, transportation, and supported employment. These services may be provided over a period of several weeks, months, or years, depending on an individual’s health care coverage and level of need.

More than 6 million people use paid long-term services and supports (LTSS) delivered in home and community settings and more than 2 million people use LTSS delivered in institutional settings, according to CBO estimates. An unknown, but likely larger number of people, use unpaid LTSS provided by family, friends, or neighbors. Virtually all people ages 65 and older and about 8 million people under age 65 with disabilities have Medicare, but Medicare generally does not cover LTSS. (See Box 1 for more information.) Most people who use paid LTSS either pay for it directly or have services covered under Medicaid. State Medicaid programs must cover LTSS provided in nursing homes, while coverage for most home and community-based services (HCBS) is optional. Eligibility for Medicaid LTSS is complex and varies widely by state. To qualify for coverage of LTSS under Medicaid, people must meet state-specific eligibility requirements regarding their levels of income, wealth, and functional limitations.

In addition to long-standing questions about the costs, affordability, and coverage of LTSS, there are also longstanding challenges finding enough workers to provide LTSS for people who need such services, and the COVID-19 pandemic exacerbated those issues considerably. As of January 2024, employment levels in most LTSS settings remained 4% below pre-pandemic levels. The Biden Administration finalized two rules intended to address the LTSS workforce and access to services. To address workforce shortages in nursing facilities, the Administration finalized a rule that would create new staffing requirements in nursing facilities, require state Medicaid agencies to report on the percent of Medicaid payments for institutional long-term services and supports that are spent on compensation for direct care workers and support staff, and provide funding for individuals to enter careers in nursing facilities. The Administration also finalized a rule aimed at ensuring access to Medicaid services, which included several provisions aimed specifically at LTSS provided in people’s homes and the community, including requiring states to spend least 80% of total payments for certain HCBS on compensation for direct care workers. In addition to federal action, many states have adopted payment rate increases for nursing facilities and HCBS providers with the goal of boosting staffing levels, as reported to KFF in a 2023 survey.

1. Long-term services and supports are extremely expensive and not generally covered by Medicare or health insurance.

The prices of health care services are quite high, but a greater percentage of people who use LTSS pay full price for that care when compared to other health care services. The difference between LTSS and other health care spending stems from the fact that private health insurance generally does not cover ongoing LTSS and Medicare’s coverage is limited to specific circumstances (see Box 1). The Department of Health and Human Services estimates that an average American turning 65 today will incur $120,900 in future LTSS costs, with families paying for over one-third of that themselves. This is higher than the 17% of overall LTSS expenses paid for out-of-pocket shown in Figure 2 because overall LTSS expenses include expenses for those who are under 65.

In 2023, the median annual costs of care in the U.S. were $62,400 for full-time homemaker services (people who help with instrumental activities of daily living such as preparing meals and doing laundry), $68,640 for full-time home health aide care, $116,800 for a private room in a nursing home, and $288,288 for round-the-clock home health aide services, all of which far exceed the median income for Medicare beneficiaries (about $36,000 in 2023, Figure 1). Such costs would also quickly exhaust the median savings for Medicare beneficiaries in 2023 ($103,800). Although nursing facility costs may be higher than the costs of some home-based services, nursing facility costs include round-the-clock monitoring and the costs of room and board. For people living in residential settings, the costs of maintaining a home such as rent, a mortgage, and other household expenses are paid separately from the costs of LTSS. The average costs of an assisted living facility ($64,200) only include the costs of room and board, so any LTSS expenses would be added to that total. Many people may use multiple services simultaneously, so their total annual costs may be like those of nursing facility or round-the-clock care.

Long-Term Services and Supports Are Extremely Expensive and Not Generally Covered by Medicare

Box 1: Does Medicare Cover LTSS?

Medicare is the federal health insurance program established in 1965 for people ages 65 or older, regardless of income or medical history, and later expanded to cover people under age 65 with long-term disabilities. Today, Medicare provides health insurance coverage to 66 million people, including 58 million people age 65 or older and 8 million people under age 65. Medicare covers a comprehensive set of health care services, including hospitalizations, physician visits, and prescription drugs.

Medicare does not generally cover long-term care services but does cover up to 100 days of skilled nursing facility care following a qualifying hospital stay and covers home health services for people who need part-time or intermittent skilled services. As part of the home health benefit, Medicare covers nursing, physical, speech and occupational therapy, and also covers home health aide services, but only for people getting skilled nursing care at the same time, and not on a full-time basis. KFF polling shows that four in ten adults overall incorrectly believe that Medicare is the primary source of insurance coverage for low-income people who need nursing facility care or home care over a long period of time.

  • Medicare covers skilled nursing care for up to 100 days each benefit period in a certified SNF after a qualifying hospitalization.
  • For those who are ”homebound,” Medicare will pay for nurses and therapists to provide services in the home if the beneficiary needs skilled services. Being homebound does not mean that Medicare beneficiaries are unable to leave their homes, but rather that leaving the home is difficult or not recommended because of illness or injury; or that one is normally unable to leave the home because doing so is a major effort. Under those circumstances, Medicare will cover home health care services provided through a certified home health agency for up to 28 hours a week, with more intense care permissible for a short time period when determined necessary by a doctor.
  • Historically, home health and skilled nursing services had been denied in Medicare for beneficiaries when the purpose was for maintenance rather than for rehabilitation, but the Jimmo settlement in 2013 clarified that coverage of skilled nursing and home health care in Medicare was contingent upon beneficiaries demonstrating a need for skilled care rather than a requirement that beneficiaries show potential for their condition to improve.

2. Medicaid paid for more than half of the $415 billion that the US spent on LTSS in 2022, most of which went to home and community-based services.

In 2022, the U.S. spent over $400 billion on LTSS, most of which went to home and community-based services (HCBS), based on KFF estimates of annual National Health Expenditure (NHE) data. Spending on home and community-based services was $284 billion and the remaining $131 billion was spent on institutional LTSS such as nursing facility care (Figure 2). Medicaid paid more than half (61%) of total US spending on all LTSS, followed by out-of-pocket spending (17%), and other public and private payers paid the remaining 21%. (See Box 2 for a description of what services and payers are included and excluded from LTSS spending in the KFF analysis.)

Medicaid Paid for More Than Half of the $415 Billion That the US Spent on LTSS in 2022, Most of Which Went to Home and Community-Based Services

Box 2: How does KFF define LTSS in the NHE data?

Unlike other sources of information on health care spending, the NHE use an accounting structure that captures all expenditures of health care goods and services and investment in the health care sector. Expenditures are classified into high-level service categories and by source of payment. Data sources include federal administrative data, household and individual surveys, surveys of businesses, and economic data from the Bureau of Labor Statistics and the Bureau of Economic Analysis.

KFF defines LTSS to include spending for residential care facilities, nursing homes, home health services and HCBS waivers. HCBS waivers may include a wide range of services such as adult daycare, home health, personal care, transportation, and supported employment. Under the NHE methodology, assisted living services are in both HCBS and institutional categories. Payments made to the assisted living facilities themselves are counted as institutional care unless they are paid for by Medicaid, in which case they are considered HCBS. For services such as home health and personal care that are provided to people in assisted living facilities, they would be considered institutional care if provided through the facility, but HCBS if provided through another provider such as an affiliated home health agency.

KFF’s definition of LTSS includes spending from any of the following sources: Medicaid, individuals, the Children’s Health Insurance Program, the Indian Health Services, the Substance Abuse and Mental Health Services Administration, the Veterans Health Administration, general assistance, other federal programs, other state and local programs, school health, and other private revenues. Medicaid expenditures may include some home health spending that is rehabilitative and not LTSS.

KFF excludes spending from certain payers. Within the excluded spending is $94 billion in Medicare spending, most of which is post-acute care, but some of which is home health spending that might be considered LTSS (see Box 1). KFF also excludes spending from private insurance because much of those expenditures are for rehabilitation and not LTSS. In most cases, private long-term care insurance reimburses people for the expenses they pay out-of-pocket and would be classified as out-of-pocket spending in the NHE data. KFF’s approach would exclude private long-term care spending in cases where private plans make payments directly to an organization, which is most likely for individuals using nursing facility care. Such situations are expected to be uncommon given few individuals receive benefits from long-term care insurance in any given year (see Figure 6).

3. Among the 6 million people who use Medicaid LTSS in the U.S., most are using HCBS and over half are under 65.

In 2021, three-quarters of the 5.7 million people who used Medicaid LTSS were receiving HCBS, but this ranged from 49% in Florida to 98% in Oregon (Figure 3.1). The larger share of people receiving care in the community as opposed to in an institution reflects initiatives to make home and community-based care more widely available in recent years and to remove what has been referred to as the “institutional bias” in Medicaid. Analyses of Medicaid spending on LTSS show that the percentage of LTSS spending that pays for HCBS has increased from only 10% in 1988 to 62% in 2020. While the number of people using Medicaid HCBS exceeds the number who use institutional care nationally, Florida still provides services to more people exclusively in nursing facilities and other institutional settings than in home and community-based settings.

In Nearly All States, The Majority of People Who Use LTSS Are Using HCBS

Over half (57%) of Medicaid enrollees who use LTSS are under 65: Among Medicaid enrollees who use HCBS, 63% are under age 65 compared with 30% of those who use institutional LTSS (Figure 3.2). LTSS are commonly associated with people ages 65 and older, but many younger enrollees use LTSS because of chronic illness or disability. The remaining 44% of enrollees who use LTSS are 65 and older. In comparison, only 6% of Medicaid enrollees who do not use LTSS are ages 65 and older. Among people who use HCBS, 14% are under age 19, and 49% are ages 19-64, whereas over two-thirds of people who use institutional LTSS are ages 65 and older.

Over Half of Medicaid Enrollees Who Use LTSS Are Under 65, Including Two-Thirds of Those Using HCBS and One-Third of Those Using Institutional LTSS

4. On average, Medicaid enrollees who use LTSS have Medicaid spending eight times higher than those who do not use LTSS.

In 2021, Medicaid per person spending was substantially higher for enrollees who used institutional care ($53,666), than for enrollees who used HCBS ($38,275), which was about 8-times greater than average Medicaid spending for enrollees who did not use any LTSS ($5,372) (Figure 4). Per-enrollee spending for those who don’t use any LTSS includes children who comprise 40% of Medicaid enrollees and tend to have much lower per-person spending. Children who use LTSS have spending ten times higher than children who don’t use LTSS ($30,933 versus $3,300). People who used Medicaid LTSS comprised 6% of Medicaid enrollment but 34% of federal and state Medicaid spending which includes the costs of LTSS, managed care premiums, and other services such as hospital care and prescription drugs. (It is not possible to say what share of Medicaid spending pays for LTSS because total spending includes payments to managed care plans, and the split of managed care payments by type of care is unknown). In 2021, Medicaid spending for the 5.7 million enrollees who used Medicaid LTSS, totaled nearly $234 billion. High per-person Medicaid spending among enrollees who use LTSS likely reflects the generally high cost of LTSS and more extensive health needs among such groups that lead to higher use of other health care services and drugs as well.

On Average, Medicaid Enrollees Who Use LTSS Have Medicaid Spending Eight Times Higher Than Those Who Do Not Use LTSS

5. About 700,000 people are on waiting lists or interest lists for Medicaid HCBS, most of whom have intellectual or developmental disabilities.

Home- and community-based services (HCBS) waivers allow states to offer a wide range of benefits and to choose—and limit—the number of people who receive services. The only HCBS that states are required to cover is home health, but states may choose to cover personal care and other services such as private duty nursing through the Medicaid state plan. Benefits offered through a state plan are generally available to all Medicaid enrollees who need them. States may also use HCBS waivers to offer expanded personal care benefits or to provide additional services such as adult day care, supported employment, and non-medical transportation, though they can limit the number of people who receive these services. States’ ability to cap the number of people enrolled in HCBS waivers can result in waiting lists when the number of people seeking services exceeds the number of waiver slots available. Waiting lists reflect the populations a state chooses to serve, the services it decides to provide, the resources it commits, and the availability of workers to provide services. A new rule on Medicaid access will require states to start reporting the number of people on certain types of Medicaid waivers known as “1915(c)” in 2027.

In 2023, a 50-state survey of Medicaid HCBS programs found that there were over 692,000 people on waiting lists or interest lists, and most people on waiting lists have intellectual or developmental disabilities (I/DD), particularly in states that do not screen for waiver eligibility before placing someone on a waiting list (Figure 5). People with I/DD comprise 88% of waiting lists in states that do not screen for waiver eligibility, compared with 51% in states that do determine waiver eligibility before placing someone on a waiting list. People with I/DD comprise almost three-quarters (72%) of the total waiver waiting list population. Seniors and adults with physical disabilities account for one-quarter (25%), while the remaining share (3%) includes children who are medically fragile or technology dependent, people with traumatic brain or spinal cord injuries, people with mental illness, and people with HIV/AIDS. People who are on HCBS waiting lists are generally not representative of the Medicaid population or the population that uses HCBS. Most people on waiting lists have I/DD, but KFF analysis shows that people with I/DD comprise fewer than half of the people served through 1915(c) waivers (the largest source of Medicaid HCBS spending).

About 700,000 People Are on Waiting Lists or Interest Lists for Medicaid HCBS, Most of Whom Have Intellectual or Developmental Disabilities

6. In 2021, just 80,000 people filed claims for private long-term care insurance benefits.

In 2021, about 7.1 million people nationwide paid premiums for private long-term care insurance (LTCI), including standalone LTCI and also an array of products that pair life insurance or an annuity with some long-term care coverage (Figure 6). The age and other demographics of those people are unknown. In 2021, premiums for LTCI averaged $1,860 for the year. While those premiums may sound low relative to private health insurance premiums or to the costs of LTSS, LTCI is purchased before a person develops a need for LTSS and most people pay premiums for many years without using any benefits. That is one of the reasons that only around 80,000 people filed a claim for LTCI benefits in 2021. (Some people who had filed claims prior to 2021 continued to receive benefits in that year. In total, 1.5 million people have filed claims for LTCI benefits since companies started selling LTCI polices.) It is not uncommon for people to die without using benefits or to let their coverage lapse in response to rising premiums (or other factors) before they qualify for the benefits. Those are some of the motivating factors for products that mingle life insurance with LTCI, although in 2021, most of the people with LTCI still had standalone policies (6.3 million).

Unlike private health insurance, it is fairly uncommon for employers to offer and/or subsidize LTCI for their employees. A KFF survey showed that among firms offering health benefits in 2023, 25% offered LTCI and among those, only 39% contributed to the costs of coverage. There are a number of limitations of LTCI. Many policies don’t have inflation protection, limit eligibility for services, do not cover all expenses, and have lifetime limits. Some LTCI policies also don’t offer non-forfeiture benefits, meaning people who pay premiums for years may not get the premiums they have paid back if they let their policy lapse in the event of nonpayment (which may happen due to increased premiums after a rate increase). These unused premium payments can be especially considerable for people who sign up when relatively young. Insurers could also go out of business before coverage is needed.

In 2021, Private Long-Term Care Insurance Paid Out Just 80,000 Claims

7. Longstanding workforce shortages among LTSS providers were exacerbated by the COVID-19 pandemic.

The pandemic greatly exacerbated longstanding shortages of LTSS workers. Employment levels in all health care jobs dropped sharply at the start of the pandemic, but for most health care sectors, including hospitals, employment started to rebound as early as spring 2020. However, employment in the LTSS sectors continued to fall well into 2021 and for nursing facilities, into the beginning of 2022. Recent analysis on the Peterson-KFF Health System Tracker shows that the number of workers in the LTSS sector (all nursing and residential care in Figure 7) was 4% lower in January 2024 than in February 2020. The reduction in workers is largest in the skilled nursing care settings, where the workforce remains 9% lower than in February 2020. Additionally, a 50-state survey of Medicaid HCBS programs found that all states reported shortages of HCBS workers, most frequently among direct support professionals, personal care attendants, nursing staff, and home health aides. Most states (43) also reported permanent closures of HCBS providers within the last year, with some closures reflecting provider shortages. These jobs are mentally and physically demanding, and direct care workers generally agree that the wages are low and do not reflect the demands of the work.

Beyond the formally paid workforce, there are also millions of family caregivers (most of whom are unpaid) who play an important role in filling care needs for older adults and people with disabilities. In 2021, about 38 million family caregivers provided, on average, 18 hours of care per week. Family caregivers deal with high levels of stress, often juggling work and school on top of their caregiving, as well as struggle with consequences of lost income including housing and food insecurity. Families may provide care out of love or a sense of responsibility, but many provide care because they can’t access paid care or are providing more care than they feel able to give based on their training and other life responsibilities.

Workforce Shortages Among LTSS Providers Were Exacerbated by the COVID-19 Pandemic

8. Between 2015 and 2023, the average hours of care that nursing facility residents received decreased.

The adequacy of staffing in nursing homes has been a longstanding issue, and the high mortality rate in nursing facilities during the COVID-19 pandemic highlighted and intensified the consequences of inadequate staffing levels. Between July 2015 and July 2023, the average hours of care that nursing facility residents received declined by 9%, from 4.13 hours to 3.77 hours (Figure 8). The decline occurred over the entire period but the number of hours of care per resident increased briefly in the year 2021. The relatively higher staffing hours in 2021 reflected the fact that the number of residents declined more quickly than the number of staff hours did between 2020 and 2021. Both the average number of deficiencies and the share of facilities with serious deficiencies increased over the same time period, which may in part reflect lower staffing levels.

On April 22, 2024, the Centers for Medicare and Medicaid Services (CMS) released a highly-anticipated final rule that created new requirements for nurse staffing levels in nursing facilities. The final rule requires facilities to have at least 3.48 hours of nursing care per resident per day starting in 2026 for urban facilities and in 2027 for rural facilities. In later years (2027 for urban facilities and 2029 for rural facilities), 0.55 of those hours must be provided by a registered nurse and 2.45 hours from a nurse aide. The remaining 0.48 hours may be provided by any nurse staff type, including LPNs. The rule also requires facilities to have a registered nurse on staff 24 hours per day, 7 days per week; strengthens staffing assessment and enforcement strategies; creates new reporting requirements regarding Medicaid payments for institutional long-term services and supports (LTSS); and provides $75 million for training for nurse aides. KFF estimates that only 19% of nursing facilities would currently meet the three staffing hour minimums required in the final rule if it took effect immediately (3.48 hours overall, 0.55 RN hours, and 2.45 nurse aide hours).

Between 2015 and 2023, the Average Hours of Care That Nursing Facility Residents Received Decreased

9. States have taken steps to increase payment rates for home-based care, but workforce shortages persist.

In KFF’s survey of states’ HCBS programs, all responding states reported taking actions to address workforce shortages (Figure 9). The most common strategy reported was increasing payment rates to HCBS providers (48 states). However, even with the higher payment rates, among the states that were able to report time-based payment rates for personal care providers, most pay under $20 per hour. Some states implemented a permanent payment rate increase, but other states reported that payment rate increases for at least some of the workers were temporary. Other strategies reported include developing or expanding worker education and training programs (42 states) and offering incentive payments to recruit or retain workers (41 states). Less common strategies included establishing or raising the state minimum wage (20 states) and offering paid sick leave for workers (19 states). States also reported several other types of initiatives to strengthen the workforce, including creating platforms or support systems to connect job seekers with employers and positions, launching a social media campaign, and providing outreach to prospective employees. In another survey of states, most states reported increasing payment rates for nursing facilities and HCBS in 2023 and 2024.

Beyond state efforts, the Biden Administration has also taken steps to increase payment rates for the direct care workforce. A final rule on access to Medicaid services would require states to demonstrate that HCBS payment rates are adequate to ensure a sufficient direct care workforce and that at least 80% of total payments for specified HCBS are compensation to direct care workers. In a parallel vein, the final nursing facility staffing rule will require state Medicaid agencies to report the percent of Medicaid payments for institutional long-term services and supports (LTSS) that are spent on compensation for direct care workers and support staff.

States Have Taken Steps to Increase Payment Rates for Home-Based Care, But Workforce Shortages Persist

10. An aging population will need more long-term services and supports.

A KFF interactive on the aging population shows that the percent of the United States population that is ages 65 and older is projected to grow from 17% in 2020 (56 million people) to nearly 25% in 2060 (95 million people) (Figure 10). During this period, the share of older adults who are in their 80s, 90s, and older will also grow. One in twenty of all people in the U.S. is projected to be 85 or older by 2060, a group that is likely to have the highest rates of LTSS needs and utilization as a quarter of them are frail. Advances in assistive and medical technology that allow people with disabilities to be more independent and to live longer, together with the aging of the baby boomers, will likely result in increased need for LTSS over the coming decades. An HHS report found that after age 65, over half of people would at some point need help with at least two activities of daily living, over half would use any type of paid LTSS, and over one-third would use some nursing home care. Expected rates of LTSS need and use are highest among people with lifetime earnings in the bottom income quintile, who have the fewest resources to pay for such care. Other research shows that among people ages 65 and older, those who are Black or Hispanic are much more likely to develop a moderate or severe LTSS than those who are White and have substantially lower financial resources to pay for LTSS. Racial and economic disparities among individuals experiencing LTSS needs may also have long-term intergenerational effects that can disproportionately affect people of color. The aging of the population raises difficult questions about how to address the challenges of coverage, affordability, financing, and workforce shortages to meet the needs of a growing population in need of LTSS.

An Aging Population Will Need More Long-Term Services and Supports
Poll Finding

Polling Insight: 4 Takeaways About Black Women Voters in the 2024 Election

Published: Jul 3, 2024

For decades, Black women have consistently been a reliable voting base for the Democratic Party, and in recent elections Democrats have garnered support from large majorities of Black women.1  However, the KFF Survey of Women Voters shows that many Black women do not feel either political party is looking out for their interests, and express dissatisfaction with their candidate options. Black women experienced disproportionate economic setbacks during the pandemic, with their unemployment rate outpacing that of men and women of other racial and ethnic groups. While pandemic-related unemployment has receded, rising inflation rates have created a scenario in which many families across the country struggle to afford basic household expenses, and Black women are more likely than White or Hispanic women to cite these struggles. This poll shows that, while Black women still largely support President Biden in 2024, some of his previous supporters say they don’t plan to vote for him this fall. Among Black women voters, one quarter of those who voted for Joe Biden in 2020 now say they either plan to vote for Trump in 2024 (8%) or say they will not vote (14%). This analysis highlights the deciding factors and motivations for Black women fewer than six months before the 2024 election.

The analysis presented below is from a multi-mode probability based survey of women voters from state-level voter files, fielded May 23-June 5, 2024. The KFF Survey of Women Voters Dashboard includes more data from the survey, as well as the topline and full methodological details.

#1: Black Women Continue to Identify with the Democratic Party, Though Some Say Neither Party Does a Better Job Looking Out for People Like Them

Black women voters largely identify as Democrats (67%) or lean toward the Democratic Party (10%) and a majority say that the Democratic Party does a better job than the Republican Party looking out for people like them (56%), but about one in three Black women (35%) say neither party looks out for people like them. Fewer Black women voters identify as Republicans (7%) or say that the Republican Party does a better job looking out for their interests (8%).

About One-Third of Black Women Voters Say Neither Political Party Does a Better Job Looking Out for People Like Them

#2: Inflation Is the Most Important Issue for Black Women Voters, and Most Disapprove of Biden’s Handling of It

About half of Black women voters say that inflation, including the rising cost of household expenses (53%) is the most important issue determining their vote in the 2024 presidential race. Ranking far behind this issue are threats to democracy (18%), abortion (12%) and gun policy (6%). Families across the U.S. have been hit hard by the rising cost of household expenses, and Black women voters especially report worrying about affording basic household items for themselves and their families, with about half or more saying they worry “a lot” about affording food (59%), utilities (53%), health care (51%), and housing costs (48%).

At Least Half of Black Women Voters Say They Worry "A Lot" About Affording Groceries, Utilities, and Health Care

Reflecting on the past two presidencies, about one in four Black women voters say they have been better off financially while President Biden is in office (27%) and a similar share say they were better off under President Trump (22%). Half (50%) of Black women voters say which president is in office has made no difference in their financial situation.

Half of Black women say, regardless of who they intend to vote for, the Democratic Party does a better job addressing the cost of household expenses (51%), while few (8%) say the Republican Party does a better job, and four in ten (41%) say neither party does a better job. However, assessing Biden’s handling of the issue of inflation, a majority (55%) of Democratic Black women voters disapprove, including one in four (25%) who say they disapprove “strongly.” By contrast, majorities of Democratic Black women voters approve of Biden’s handling of most other issues, including immigration, abortion and reproductive health care, student loan repayment, and the affordability of health care.

Majorities of Democratic Black Women Voters Approve of Biden's Handling of Most Issues, Majorities Disapprove of His Handling of Inflation and U.S. Involvement in the Israel-Hamas War

#3: Black Women Voters Say Candidates’ Personal Qualities Are More Important than Issues to their 2024 Vote

When deciding who to vote for this fall, Black women voters put a lot of emphasis on the candidates’ personal characteristics and experience. Two-thirds (64%) of Black women voters nationally say a candidates’ personal characteristics, including their leadership ability, character, values, and experience will make the biggest difference to their vote, more than twice the share who say the candidates’ stance on the issues matters most (29%). Reflecting on one of these personal characteristics, a majority of Black women voters say that President Biden respects women generally (57%) and the women he interacts with “a lot” (61%). Very few (4% and 2% respectively) say the same of former President Trump, while majorities say Trump respects women “not at all.”

Black Women Voters Overwhelmingly Say Joe Biden Respects Women He Interacts With and Women Generally, Few Say the Same of Donald Trump

Partisanship may play a larger role in some state specific contexts. Along with the national poll of women voters, the KFF Survey of Women Voters included a representative sample of women voters in Michigan, a key battleground state. While just 6% of Black women nationally say that the candidates’ political party will make the biggest difference to their 2024 vote, this rises to one in five Black women voters in Michigan. On par with Black women nationally, Black women voters in Michigan give the Democratic Party the edge on their assessment of which political party does a better job looking out for people like them, the interests of women, addressing the cost of health care and the cost of household expenses.

#4: Young Black Women Are Less Likely to Say They Will Vote in This Election Than Older Black Women; Many Say Their Dissatisfaction Is Due to Unfulfilled Promises

Similar majorities of Black women across age say they are dissatisfied with their options for president, but views of the candidates may be impacting younger Black women’s decision to turn out more than older Black women. About three in four Black women ages 50 and older (77%) say they are “absolutely certain” to vote. Fewer Black women under age 50 say they are certain to vote (49%), while one-third say there is a 50-50 chance (32%). Seven percent of Black women ages 18 to 49 say they probably or certainly will not vote in November.

This age difference among Black women reflects a broader pattern among women voters who identify as Democrats. Overall, younger Democratic women voters are more likely than their older counterparts to say they disapprove of the president’s handling of issues and are less likely to say they plan to vote.

About Three in Four Black Women Voters Ages 50 and Older Say They Will Certainly Vote in November; Fewer Younger Black Women Say the Same

When asked why they are not satisfied with President Biden as the Democratic nominee for president, many Democratic Black women voters cite answers related to Biden’s age and ability to act as president, and cite unfulfilled campaign promises of the Biden administration.

What is the main reason why you aren’t satisfied with Joe Biden as the Democratic nominee for president?

“President Biden is not in sync with the overwhelming majority of the country on issues that directly affect economic security, housing, over policing, women’s right to health autonomy and international relations that directly influence the safety of non-white identifying Americans.” – 47-year-old Black woman voter, Democratic-leaning independent, California

“Promises he made fell to wayside, feels like too little too late from him.” – 38-year-old Black woman, Democrat, Georgia

“Concerned about longevity. I feel like a younger Democratic candidate could fight for more and harder for our community.” – 28-year-old Black woman, Democrat, New York

“I realize that at his age, he is not the aggressive VP he once was. I don’t think he is as sharp as he will need to be.” – 66-year-old Black woman, Democrat, Illinois

With pollsters forecasting a close presidential election, even slight advantages could tip the electoral balance in favor of either candidate. Black women voters have long been a strong base to the Democratic Party, and this poll finds their continued support for the party. However, if Black women do not feel adequately represented by the current leadership of the Democratic Party, including on issues most salient to them, they may not vote for Joe Biden in the fall. Young Black women are especially frustrated and dissatisfied with the current administration, which may tip the scales in favor of a Trump presidency.

  1. 94% of Black women voters voted for Hilary Clinton in the 2016 Presidential Election; 96% of Black women voted for Barack Obama in 2008 and 2012; 90% of Black women voted for Joe Biden in 2020. ↩︎

Key Facts About Medicare Part D Enrollment, Premiums, and Cost Sharing in 2024

Authors: Juliette Cubanski and Anthony Damico
Published: Jul 2, 2024

The Medicare Part D program provides an outpatient prescription drug benefit to more than 50 million older adults and people with long-term disabilities in Medicare who enroll in private plans, including stand-alone prescription drug plans (PDPs) to supplement traditional Medicare and Medicare Advantage prescription drug plans (MA-PDs) that include drug coverage and other Medicare-covered benefits. This brief analyzes Medicare Part D enrollment and costs in 2024 and trends over time, based on data from the Centers for Medicare & Medicaid Services (CMS).

This analysis highlights the continuing growth of Medicare Advantage drug plans as a source of Part D drug coverage, with enrollment overall concentrated in a handful of large plan sponsors. Average premiums for drug coverage are much lower in MA-PDs than in stand-alone PDPs, mainly because most MA-PD enrollees are in zero-premium plans, which is in turn related to the ability of Medicare Advantage plan sponsors to use rebates to buy down the Part D premium. Median cost-sharing amounts for drugs covered on some formulary tiers are the same or similar in PDPs and MA-PDs, but PDP enrollees are more likely than MA-PD enrollees to face coinsurance for preferred brands and non-preferred drugs, while MA-PD enrollees face higher median coinsurance for specialty tier drugs.

These trends in Medicare Part D drug coverage and the costs that people with Medicare pay for drug plans and for their prescriptions are worth watching as provisions of the Inflation Reduction Act to improve the Part D benefit roll out, including a $35 insulin copay cap and a new out-of-pocket drug spending cap (set at $2,000 in 2025). Such changes will help to lower out-of-pocket costs for Part D enrollees but could also make it harder for some Part D plan sponsors to offer low-priced coverage, particularly sponsors of stand-alone drug plans. This could mean fewer affordable PDP plan choices for Medicare beneficiaries in traditional Medicare and further tilt Medicare enrollment towards Medicare Advantage, which has broader implications for Medicare program spending.

Medicare Advantage drug plans continue to attract more enrollees compared to stand-alone drug plans

Well over half (57%) of Part D enrollees in 2024 are in Medicare Advantage drug plans, continuing a trend of increasing enrollment in Medicare Advantage plans and declining or relatively static enrollment in stand-alone prescription drug plans (Figure 1).

More Medicare Part D Enrollees Are in Medicare Advantage Drug Plans Than in Stand-alone Prescription Drug Plans

Low-Income Subsidy enrollment is tilted even more towards Medicare Advantage drug plans than overall Part D enrollment

Two-thirds of LIS enrollees – 9 million out of 13.7 million – are enrolled in Medicare Advantage drug plans in 2024 (Figure 2). Nearly 6 million LIS enrollees are in Medicare Advantage Special Needs Plans (SNPs), nearly all of which (95%) are in plans designed specifically for dual-eligible individuals (Table 1). On average, LIS enrollees can choose from substantially more MA-PDs than PDPs in their area that have drug premiums below the regional low-income subsidy premium benchmark amount – 15 MA-PDs versus 3 PDPs – meaning they can enroll in these plans for zero premium.

Two-Thirds of Beneficiaries Receiving the Part D Low-Income Subsidy Are Enrolled in Medicare Advantage Drug Plans

The top 5 firms cover more than three-fourths of Part D enrollees in 2024

Part D enrollment is concentrated in a handful of top plan sponsors, with 5 firms covering 77% of all Part D enrollees in 2024, or 40.1 million out of 53.1 million enrollees (Figure 3). Nearly 1 in 4 enrollees (12.4 million) are in Part D plans sponsored by UnitedHealth, including both stand-alone PDPs and MA-PDs. CVS, Humana, and Centene each have around 15% of the Part D market, with enrollees in both types of Part D plans.

The Top 5 Firms Cover More than Three-Fourths of Part D Enrollees in 2024

Enrollment among beneficiaries without low-income subsidies declined in 11 of the 14 national PDPs in 2024

Most of the national PDPs available in 2024 lost enrollment among beneficiaries without low-income subsidies (Figure 4). Only Wellcare Value Script saw substantial enrollment gains among enrollees without LIS – from 2.6 million to 3.7 million – likely due to having a median monthly premium of less than $1, substantially lower than all other national PDPs.

11 of the 14 National PDPs Lost Enrollees Without Low-Income Subsidies in 2024

The average monthly premium for Part D coverage is nearly 5 times larger for PDPs than for MA-PDs

On average, PDP enrollees pay substantially more each month for their Part D drug coverage than enrollees in Medicare Advantage drug plans. The average monthly PDP premium is $43, nearly 5 times higher than the $9 average monthly premium for drug coverage in MA-PDs (weighted by enrollment) (Figure 5; Table 2). (The total average premium for MA-PDs, including all Medicare-covered benefits, is $14 per month in 2024.)

The difference between average monthly premiums for drug coverage offered by PDPs and MA-PDs has been growing larger, with the PDP average rising and the MA-PD average falling. The average premium for drug coverage in MA-PDs is heavily weighted by zero-premium plans because MA-PD sponsors can use rebate dollars from Medicare payments to lower or eliminate their Part D premiums. Rebates to Medicare Advantage plans have more than doubled since 2018 and now exceed $2,000 per year per beneficiary.

The $43 weighted average PDP premium, based on current enrollment after the end of the open enrollment season for 2024, is lower than the estimated $48 monthly PDP premium for 2024, which was based on enrollment in June 2023 and did not account for plan switching by current enrollees or plan choices by new enrollees during the open enrollment period. Taking into account plan switching and new enrollment into lower premium plans resulted in the lower enrollment-weighted average monthly premium for 2024. Rather than an estimated increase of 21% over the 2023 average premium (from $40 to $48), the actual increase is 5% (from $40 to $43).

The Average Monthly Premium for Part D Drug Coverage is Nearly 5 Times Larger for Stand-Alone Drug Plans Than for Medicare Advantage Drug Plans in 2024

Most Medicare Advantage drug plan enrollees pay no premium for their drug coverage, while more than half of PDP enrollees pay $30 per month or more

Three-fourths of MA-PD enrollees without low-income subsidies pay no monthly premium for Part D coverage in 2024, while more than half of PDP enrollees without LIS (56%) pay $30 or more – including 1 in 7 PDP enrollees without the LIS who pay at least $100 per month for their Part D plan (Figure 6). For 2024, all Medicare beneficiaries had access to zero-premium MA-PD plans – 27 on average – whereas only 1 PDP was available for zero premium for non-LIS enrollees in only 14 out of 34 PDP regions.

Three-Fourths of MA-PD Enrollees Pay No Monthly Premium for Part D Coverage, While More Than Half of PDP Enrollees Pay $30 or More

PDP enrollees are more likely than MA-PD enrollees to face coinsurance for preferred brands and non-preferred drugs, while MA-PD enrollees face higher median coinsurance for specialty tier drugs

As in previous years, Part D enrollees face low copayments for generic drugs and higher cost-sharing amounts for preferred brands, non-preferred drugs, and specialty drugs, regardless of whether they are in PDPs or MA-PDs (Figure 7). Median cost-sharing amounts for drugs covered on some formulary tiers are the same or similar in PDPs and MA-PDs, but PDP enrollees are much more likely than MA-PD enrollees to pay coinsurance, or a percentage of a drug’s price, for preferred brands and non-preferred drugs. Whereas nearly all MA-PD enrollees face a median copay of $47 for preferred brands, most PDP enrollees face median coinsurance of 22%; for non-preferred drugs, MA-PD enrollees face a median copay of $100 while PDP enrollees face coinsurance of 47%.

Median coinsurance for specialty tier drugs (those that cost over $950 in 2024) is higher for MA-PD enrollees than PDP enrollees – 33% vs. 25%. Plans that waive some or all of the standard deductible – which is the case for most MA-PDs – are permitted to set the specialty tier coinsurance rate above 25%.

These cost-sharing amounts apply when beneficiaries fill prescriptions in the initial coverage phase of the Part D benefit. As of 2024, through a provision in the Inflation Reduction Act, beneficiaries no longer face cost sharing in the catastrophic coverage phase of the Part D benefit, which translates to a cap of about $3,300 out of pocket for brand-name drugs. In 2025, Medicare beneficiaries will pay no more than $2,000 out of pocket for prescription drugs covered under Part D.

Part D Enrollees Face Similar Cost-Sharing Amounts for Some Covered Drugs in PDPs and MA-PDs in 2024, But a Larger Share of PDP Enrollees Face Coinsurance for Preferred Brands and Non-Preferred Drugs

Juliette Cubanski is with KFF. Anthony Damico is an independent consultant.

Medicare Part D and Part D Low-Income Subsidy Program Enrollment, by Plan Type, 2006-2024
Weighted Average Medicare Part D Monthly Premiums, by Plan Type, 2006-2024

In 2024, A Majority of States Offer Medicare Advantage Plans to Their State Retirees, with 13 Offering Medicare Advantage Exclusively

Published: Jul 2, 2024

This analysis, originally published on May 22, 2024, has been updated based on a review of Michigan’s retiree health benefits.

The share of large employers offering health benefits to retirees has been declining over time, dropping to 21 percent in 2023 according to KFF’s Employer Health Benefits Survey, though with substantially higher offer rates among public employers, such as state and municipal governments, than among private employers. In 2024, nearly all states and the District of Columbia (DC) provide some health benefits to their Medicare-age retirees.

Until fairly recently, employer-sponsored health benefits for Medicare-age retirees were typically designed to supplement, wrap around or coordinate with traditional Medicare. These plans often cover some or all of Medicare’s coinsurance and deductibles, and sometimes cover other benefits not covered by Medicare, such as dental and vision. Over the past few years, many states have shifted their approach and are now fulfilling their retiree health obligations by offering coverage through Medicare Advantage plans, mirroring a similar trend observed among large employers who have been shifting their retiree coverage to Medicare Advantage. Medicare Advantage plans are private plans – such as PPOs or HMOs – that provide all Medicare-covered benefits, typically include extra benefits such as dental, vision, hearing, and Part D drug coverage, and often provide all benefits for no additional premium (other than the Part B premium).

Under this approach, states typically contract with a Medicare Advantage private insurer to provide all Medicare-covered benefits as well as extra benefits for their Medicare-eligible retirees (and often spouses). The federal government (Medicare) provides a payment per retiree to cover all Medicare benefits, along with a package of extra benefits for retirees in the group. The extra benefits may also be subsidized by the employer or employee premiums. While some states offer their Medicare-age retirees a choice between a Medicare Advantage plan and a plan that supplements traditional Medicare, others exclusively offer Medicare Advantage. This shift to Medicare Advantage may help states reduce their retiree health liability and simplify administration, but presents tradeoffs for beneficiaries, particularly those who prefer coverage under traditional Medicare.

This data note examines the extent to which states are providing health benefits to their Medicare-eligible retirees through Medicare Advantage arrangements in 2024, based on KFF’s review of states’ employee retirement system websites (Figure 1, Table 1). This analysis does not focus on health benefits for pre-65 retirees, active employees, municipal- or county-granted retiree health benefits, groups of retirees that have separate retirement systems in some states, such as law enforcement or teachers, nor does it include Puerto Rico or the territories. Key findings for 2024 include:

Most States (34 + DC) Offer Medicare Advantage Coverage to Their Medicare-Age Retirees, and in 13 States Medicare Advantage is the Only Option for State Retirees in 2024
  • Almost all states, 48 states and DC, offer retiree health benefits to their Medicare-age retirees. Just two states, Idaho and Nebraska, offer no retiree health benefits to state retirees ages 65 or older.
  • In 13 states, Medicare Advantage is the only option for retiree health coverage for Medicare-age retirees. This is an increase from eight states in 2016, as noted in a prior Pew report. In some of these states, retirees forfeit their retiree health benefits in perpetuity if they choose coverage under traditional Medicare. Moreover, in all of these states except for Connecticut and Maine, which have continuous or annual guaranteed issue rights to purchase a Medigap policy (meaning they can purchase a Medigap policy without a review of their medical conditions), retirees in other states who switch to traditional Medicare may be denied a Medigap policy due to pre-existing conditions.
  • In 21 states and DC, Medicare-age retirees are offered both Medicare Advantage plans and supplemental plans that wrap around traditional Medicare, an increase from 13 states in 2016. Among these states, 17 states and DC offer Medicare Advantage and supplemental plan options directly to their retirees while 3 of these states offer retiree health benefits through a private exchange, giving their retirees the option to purchase either a Medicare Advantage plan or a plan that supplements Medicare – typically Medigap. In Louisiana, Medicare-age retirees have the option of getting coverage through a private exchange or directly from the state, including both Medicare Advantage plans and supplements to traditional Medicare.
  • In 14 states, Medicare-age retirees are offered coverage through plans that supplement traditional Medicare, but are not offered coverage through a Medicare Advantage plan, a decrease from 25 states in 2016.

For states, as with employers and unions that offer retiree health benefits, this shift towards Medicare Advantage may be an effective strategy to maintain benefits while reducing spending on retiree health costs. For example, in 2022, Connecticut estimated the state would save $400 million over the following three years by switching retirees to a different Medicare Advantage administrator, which would also reduce the state’s unfunded liability by about $7.5 billion. Similarly, in 2023, New York City estimated that it would save $600 million annually by switching its city retirees to Medicare Advantage.

Shifting retiree benefits to Medicare Advantage from other coverage arrangements may present tradeoffs for retirees. On the one hand, Medicare Advantage may offer lower premiums and more comprehensive benefits than other retiree coverage options. On the other hand, Medicare Advantage plans may have a more limited network of hospitals, physicians and other providers, which could require retirees to pay more out-of-pocket or pay the entire cost of their care if they go out-of-network. (Some states with Medicare Advantage contracts stipulate that retirees will not be required to pay more for out-of-network care; however, retirees in these states may need to cover the full cost of their out-of-network care upfront if the provider does not take their Medicare Advantage plan, and submit a claim for reimbursement to cover their costs.) Retirees with traditional Medicare and supplemental retiree benefits can see any provider who accepts Medicare, but supplemental plans vary on the extent to which they cover cost sharing.

In addition to often having a more limited network of providers, Medicare Advantage plans typically employ utilization management tools, such as prior authorization. These limitations are, in part, why public sector retirees in both Delaware and New York City sued to stop being moved into a Medicare Advantage plan. In New York City, a Manhattan Supreme Court Judge prohibited the implementation of this plan (though it is still possible that the mayoral Administration may try to appeal the ruling). In Delaware, the Supreme Court recently overruled the lower court’s decision, stating that it incorrectly halted the state’s move to a Medicare Advantage plan.

Of the 13 states that provide health benefits to Medicare-age retirees exclusively through Medicare Advantage plans, just four offer plans with $0 (or fully-subsidized) plan premiums. While many states offer premium subsidies or reductions based on individual factors such as household income, years of employment, or work in hazardous roles, premiums may still be costly. In Missouri, for instance, a retiree with no dependents receiving the maximum state contribution of 65% still pays a premium of $82 per month, raising questions about whether some retirees are paying more for their coverage than they would if they enrolled in another Medicare Advantage plan offered to enrollees in their area. Nearly all Medicare beneficiaries (99%) have access to a Medicare Advantage plan with drug coverage for no additional monthly premium in 2024 (other than the Part B premium), including 100% of beneficiaries in the state of Missouri.

It is possible that employer-sponsored Medicare Advantage plans charge additional premiums because they offer more generous benefits and broader provider networks than plans offered to other Medicare beneficiaries in the same area, but benefit, network, and cost-sharing information for employer plans are not required to be reported to the Centers for Medicare and Medicaid Services (CMS), making it difficult to compare the generosity of benefits in these state retiree plans to plans available to all Medicare beneficiaries.

For Medicare, the move to Medicare Advantage raises questions about whether states are shifting liabilities to the Medicare program. On average, Medicare pays more for enrollees in Medicare Advantage plans than for enrollees in traditional Medicare, including for group plans. In 2024, MedPAC estimates that the Medicare program will spend 22% more per Medicare Advantage enrollee ($83 billion) than for similar beneficiaries in traditional Medicare, including employer plans. In addition, employer plans (which include states) can also receive bonuses under the Medicare Advantage program. These bonus payments to employer and union-sponsored plans reached $2.5 billion in 2023, or nearly $10 billion over the last 5 years (2019-2023).

This work was supported in part by Arnold Ventures. KFF maintains full editorial control over all of its policy analysis, polling, and journalism activities.

State Retiree Health Benefits by State, 2024

Health Insurer Financial Performance in 2023

Published: Jul 2, 2024

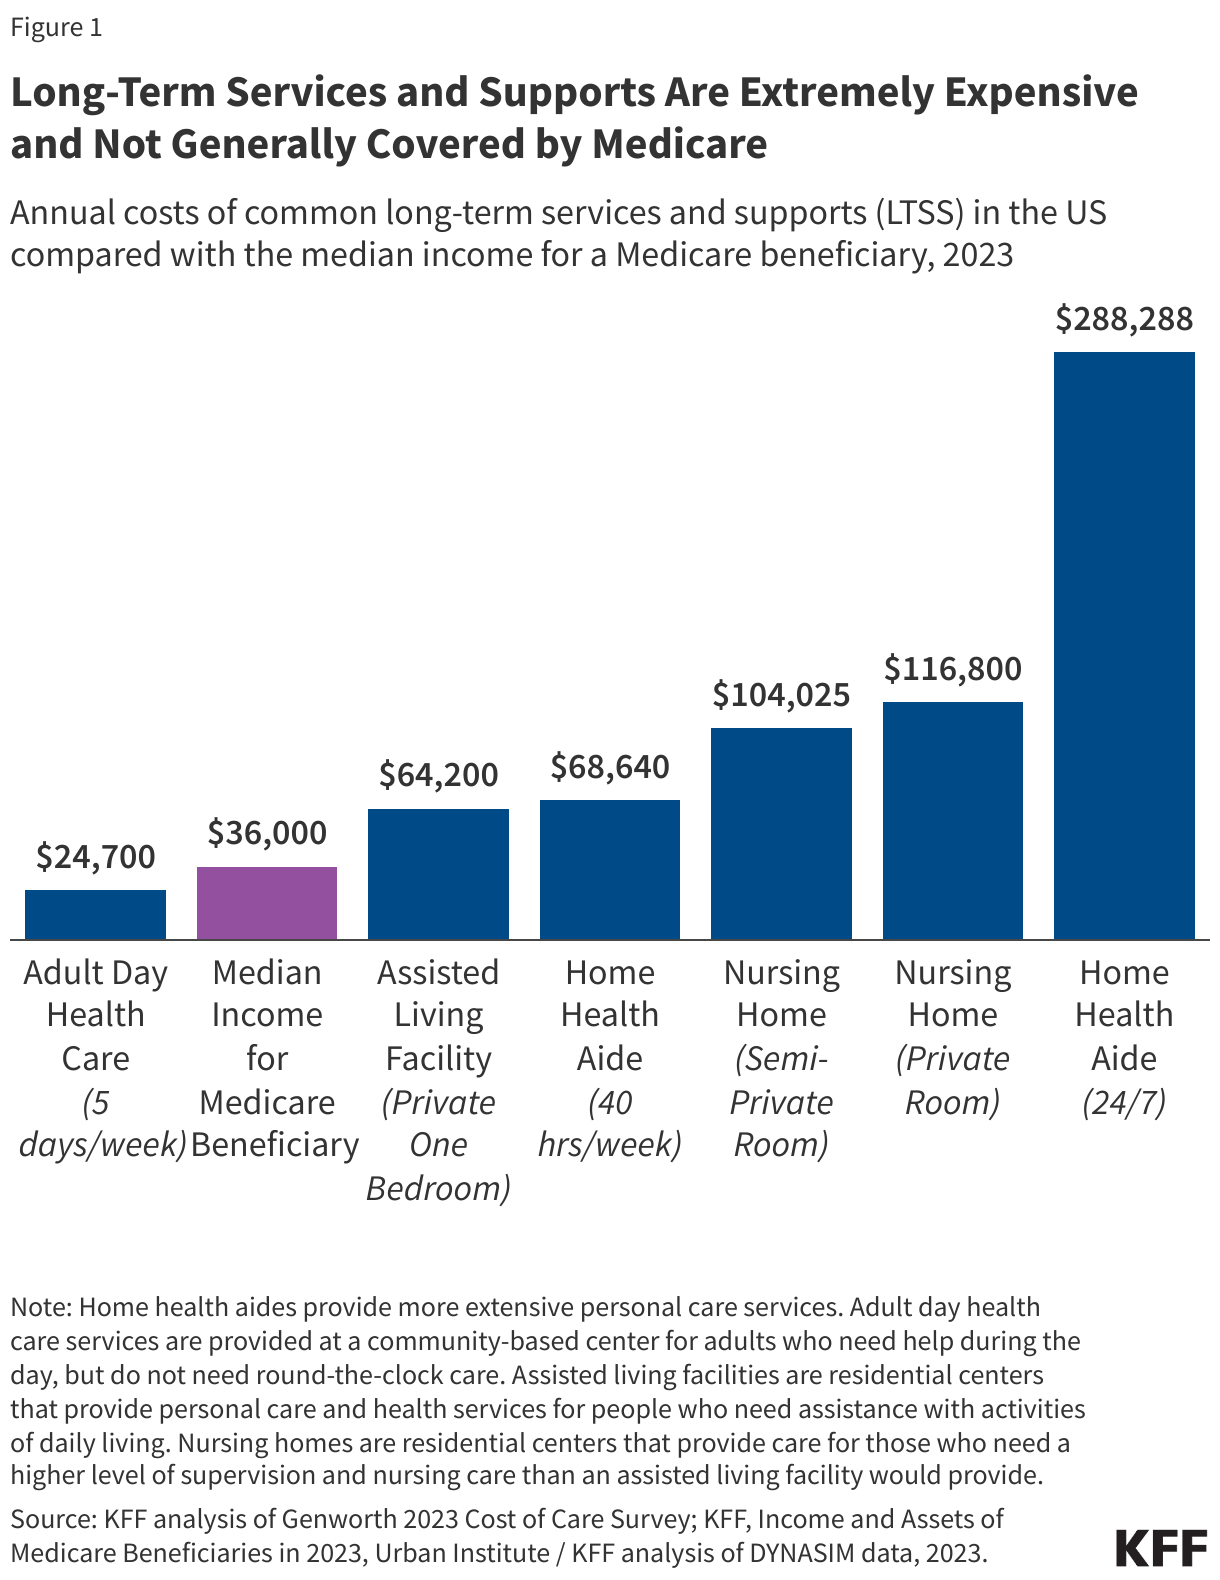
The largest private health insurance companies often offer plans in multiple markets, including the Medicare Advantage, Medicaid managed care, individual (non-group), and fully insured group (employer) health insurance markets. Each market has unique features, including eligibility, payment, and coverage rules, which affect insurers’ overhead and potential profit. In recent years, private insurers are playing a growing role in public insurance programs, with more than half of eligible Medicare beneficiaries enrolled in a private Medicare Advantage plan and nearly three-quarters of Medicaid enrollees obtaining coverage through a managed care plan (typically a private insurer).

This brief examines two measures of financial performance – gross margins and medical loss ratios – in the Medicare Advantage, Medicaid managed care, individual, and fully insured group health insurance markets using data reported by insurance companies to the National Association of Insurance Commissioners (NAIC) and compiled by Mark Farrah Associates, through the end 2023 (the most recent year of annual data).

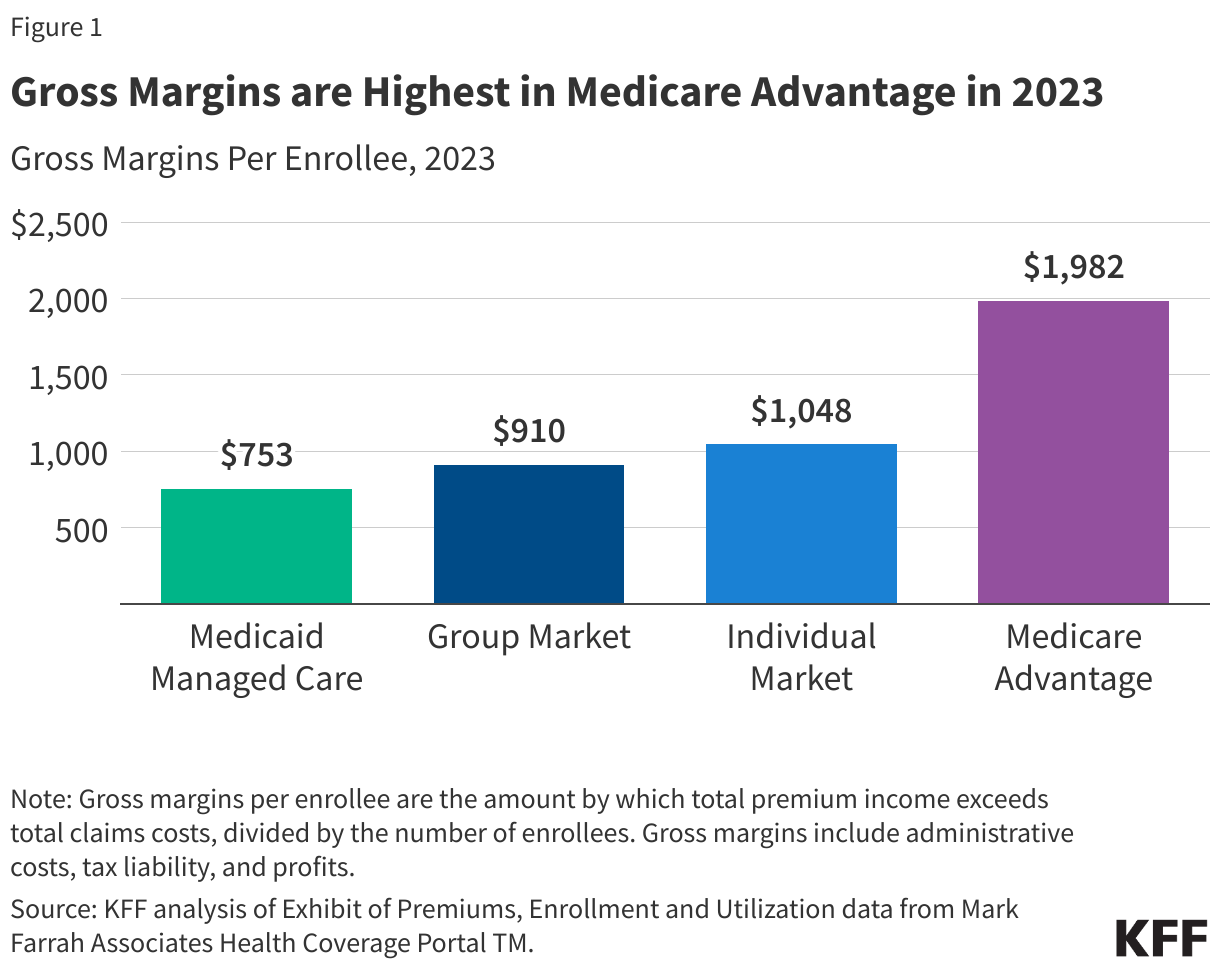
In 2023, per enrollee gross margins were highest in the Medicare Advantage market, and medical loss ratios were lowest in the individual insurance market. While both gross margins and medical loss ratios are indicators of financial performance, higher margins and lower loss ratios do not necessarily translate into greater profitability since they do not account for administrative expenses or tax liabilities. Additionally, the increasingly complex structure of insurance companies, including the rise in consolidation and vertical integration, and role of subsidiaries, make it difficult to isolate the revenues and expenses associated with a particular insurance market. (A detailed description of each market is included in the Appendix).

Measures of Financial Performance in 2023

Gross margins

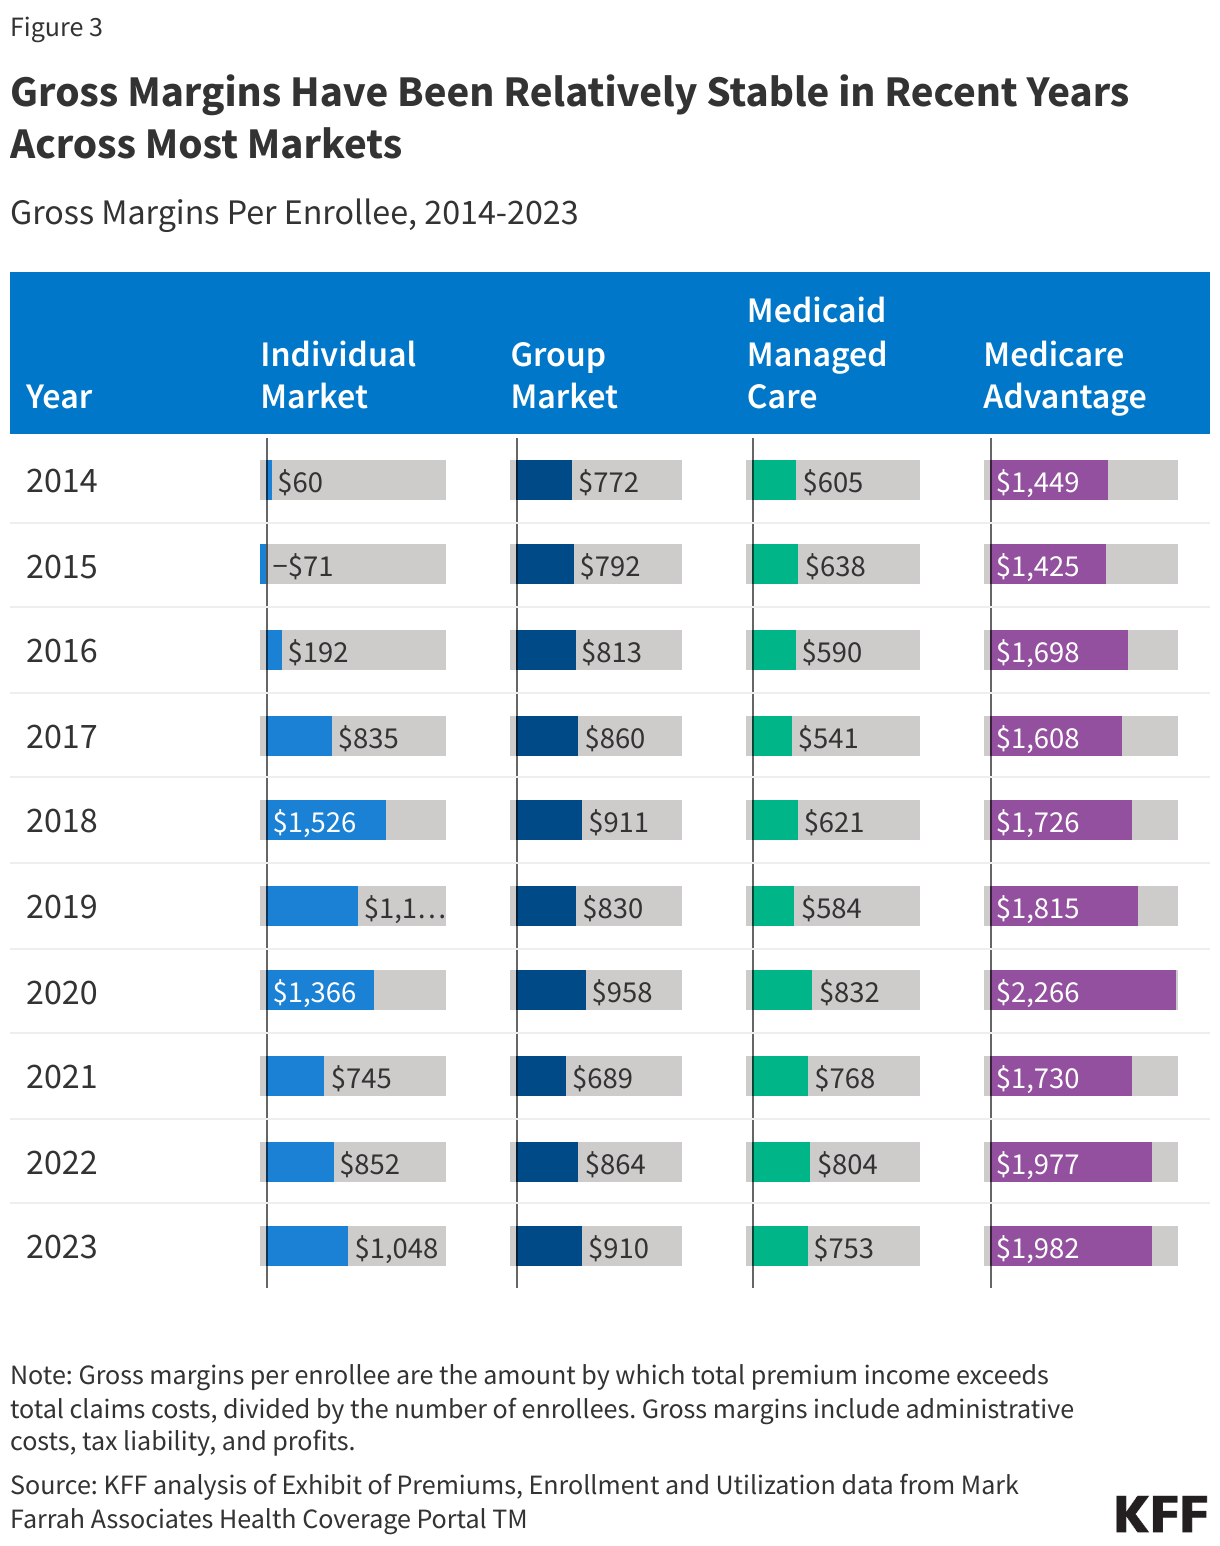
The gross margin per enrollee is the amount by which total premium income exceeds total claims costs per person over a specified time period (i.e., per year).

At the end of 2023, gross margins per enrollee ranged from $753 in the Medicaid managed care market to $1,982 in the Medicare Advantage market. Gross margins per enrollee in the group and individual markets were $910 and $1,048, respectively, roughly half the level observed among Medicare Advantage plans on average. The level of margins reflect, in part, the overall health needs and spending in a market segment. A similar margin in percentage terms will translate to a higher margin in dollars per enrollee when average health expenses are higher.

Gross Margins are Highest in Medicare Advantage in 2023

Medical loss ratios

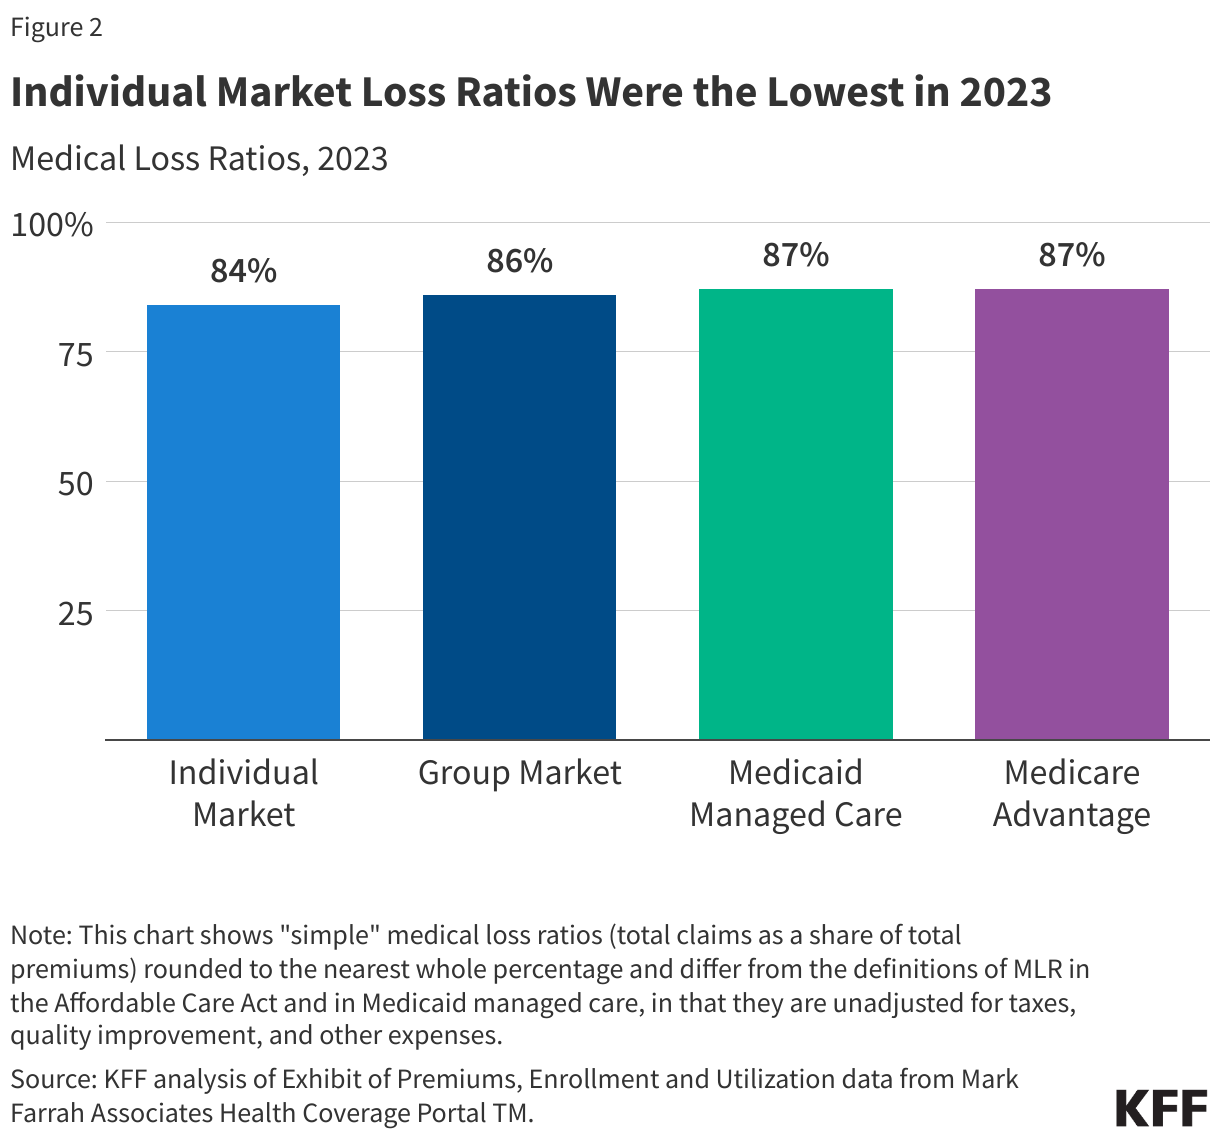
Another way to assess insurer financial performance is to look at medical loss ratios (MLRs), or the percent of premium income that insurers pay out in the form of medical claims. Generally, lower MLRs mean that insurers have a higher share of income remaining after paying medical costs to use for administrative costs or keep as profits. Each health insurance market has different administrative needs and costs, so a lower MLR in one market does not necessarily mean that market is more profitable than another market.

MLRs are used in state and federal insurance regulation in a variety of ways. In the commercial insurance (individual and group) markets, insurers must issue rebates to individuals and businesses if their MLRs fail to reach minimum standards set by the ACA. Medicare Advantage insurers are required to report MLRs at the contract level (which typically combines multiple plans) and are required to issue rebates to the federal government if their MLRs fall short of required levels and are subject to additional penalties if they fail to meet MLR requirements for multiple consecutive years. For Medicaid managed care organizations (MCOs), CMS requires states to develop capitation rates for Medicaid to achieve an MLR of at least 85%. There is no federal requirement for Medicaid plans to pay remittances if they fail to meet their MLR threshold, but a majority of states that contract with MCOs require remittances in at least some cases. The 2024 Consolidated Appropriations Act includes a financial incentive to encourage certain states to collect remittances from Medicaid MCOs that do not meet minimum MLR requirements.

The MLRs shown in this issue brief are simple loss ratios (claims as a share of premium income) and differ from the definition of MLR in the ACA and in Medicaid managed care, which makes some adjustments for quality improvement and taxes, and do not account for reinsurance, risk corridors, or risk adjustment payments.

In 2023, MLRs were similar across the group, Medicare Advantage, and Medicaid managed care markets and somewhat lower in the individual market. Simple loss ratios were around 84% in individual market, 86% in the fully insured (group) market, and 87% in the Medicaid managed care and Medicare Advantage markets.

Individual Market Loss Ratios Were the Lowest in 2023

While gross margins are not equivalent to profitability, changes in gross margins can be indicative of changes in profitability (assuming administrative costs and tax liability are stable). Across most markets, gross margins have been relatively stable in recent years, though they have declined somewhat from spikes that occurred in 2020 during the initial phase of the COVID-19 pandemic.

Medicare Advantage: Through the end of 2023, gross margins in the Medicare Advantage market averaged $1,982 per enrollee, which was similar to 2022 ($1,977), despite reports by the largest Medicare Advantage insurers of higher-than-expected utilization at the end of 2023. Potentially spurred by the prospect of strong financial returns, the Medicare Advantage market has grown substantially in the last decade, with more than 50% of eligible beneficiaries enrolled in a Medicare Advantage plan in 2023.

Group Market: Gross margins for fully insured group plans declined significantly from 2020 to 2021 (the lowest in the past decade) but have been increasing in subsequent years. In 2023, per enrollee gross margins in the group market were nearly the same as those in 2018.

Individual Market: Individual market gross margins were about 31% and 10% lower in 2023 than in 2018 and 2019, respectively. In 2018, following efforts to repeal the ACA and defunding of Cost Sharing Reduction subsidies, insurers raised individual market premiums substantially. These premium increases resulted in significantly higher margins than in earlier years (Figure 3).

Medicaid Managed Care: Per enrollee gross margins in the Medicaid managed care market decreased by 6% from 2022 to 2023 but remained higher than pre-pandemic levels. Starting in April 2023, pandemic-era policies that allowed for “continuous enrollment” in Medicaid ended and states began reviewing eligibility and disenrolling individuals who were no longer eligible or who did not complete the renewal process. National data show total Medicaid/CHIP enrollment declined by more than 9% (about 9 million people) from March 2023 to December 2023. Medicaid managed care plans expected the overall risk profile (or “acuity”) of its members to worsen during unwinding, as they anticipated “stayers” would be sicker than “leavers,” which may have contributed to the decrease in per enrollee gross margins seen from 2022 to 2023. States may use a variety of risk mitigation strategies to provide financial protection and limits on financial risk for states and plans that may not be accounted for in the data used in this analysis. Many states implemented COVID-19 related risk corridors (where states and health plans agree to share profit or losses) allowing for the recoupment of payments made for 2020, 2021, and 2022. Gross margins reported may not reflect recoupments of funds that may occur after the reporting period.

Gross Margins Have Been Relatively Stable in Recent Years Across Most Markets

Each health insurance market has different administrative needs and costs, so similar MLRs do not imply that the markets are similar to each other in profitability. Additionally, simple MLRs examined in this brief do not incorporate the effects of changes in tax law, such as the health insurer tax, which has been permanently repealed starting in 2021, was in effect in 2018 and 2020, but was not in 2019. While MLRs alone cannot convey whether a market is profitable in a particular year, if administrative costs hold mostly constant from one year to the next, a change in the MLR could imply a change in profitability.

Medical Loss Ratios Have Been Relatively Stable in the Group, Medicaid Managed Care, and Medicare Advantage Markets

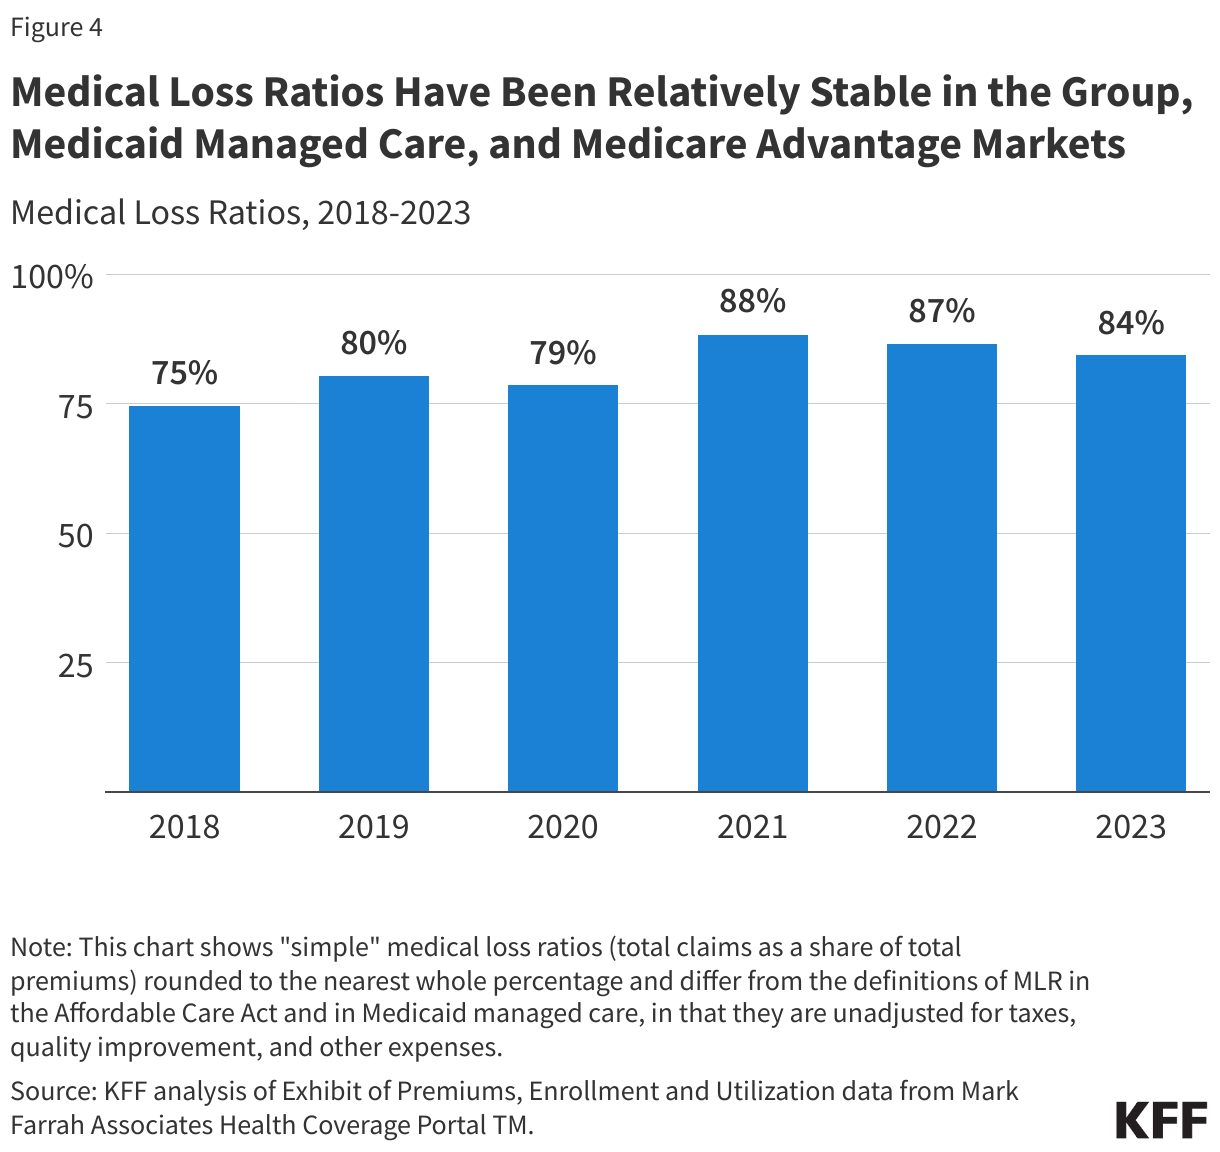
Individual Market: The average individual market MLR in 2023 was lower than in 2021 and 2022 but higher than those seen in the years leading up to the pandemic. As mentioned earlier, 2018 and 2019 were exceptionally lucrative years for the individual market. Many plans fell short of the ACA’s MLR requirements and were therefore required to issue large rebates to consumers based on their 2018 and 2019 experience.

Group Market: The average MLR for group plans was stable between 2022 and 2023 at 86%, and slightly below the average of 88% in 2021. These are all higher than previous years, when MLRs ranged from 83% in 2018 and 2020 to 85% in 2019.

Medicaid Managed Care: Relative to 2022, the average MLR in 2023 for the Medicaid managed care market increased slightly from 86% to 87% (implying a potential decrease in profitability) but remained lower than in 2018 and 2019. State Medicaid programs and managed care plans continue to be in a period of heightened uncertainty as unwinding continues. States and plans will be closely monitoring disenrollments and “churn” (off and on the program) as well as new utilization and acuity trends.

Medicare Advantage: Average MLRs in the Medicare Advantage market have been relatively stable over the last few years, averaging 87% in 2021 and 2023 and 86% in 2022. That is somewhat higher than before and during the onset of the COVID-19 pandemic. The slight increase of the MLR in the Medicare Advantage market could imply decreased profitability. It is also possible that some Medicare Advantage insurers opted to offer new or more generous extra benefits, such as over-the-counter allowances, meals following hospital stays, or transportation, in addition to gym memberships, dental, vision and hearing benefits that are offered nearly universally to help retain and attract new enrollees, while also ensuring that those at risk of falling below the required thresholds would have sufficient costs to avoid triggering any rebates to the federal government. At the same time, it may be difficult to interpret changes in MLRs with increasing consolidation, driven in part by insurers purchasing related businesses, such as pharmacy benefit managers, physician groups, and post-acute care providers, because it is not entirely clear how insurers allocate expenses across different lines of business.

Medicare Advantage plans have both higher average costs and higher premiums (largely paid by the federal government), because Medicare covers an older, sicker population. So, while Medicare Advantage insurers spend a similar share of their premiums on benefits as other insurers in other markets, the gross margins described above—which include profits and administrative costs—tend to be higher in Medicare Advantage plans.

This work was supported in part by Arnold Ventures. KFF maintains full editorial control over all of its policy analysis, polling, and journalism activities.

Methods

We analyzed insurer-reported financial data from Health Coverage PortalTM, a market database maintained by Mark Farrah Associates, which includes information from the National Association of Insurance Commissioners (NAIC). We used the “Exhibit of Premiums, Enrollment, and Utilization” report (accessed May 28, 2024) for this analysis. The dataset analyzed in this report does not include California HMOs regulated by California’s Department of Managed Health Care. Additionally, for Medicaid, there are five states (Arizona, California, Delaware, New York, and Oregon) that have different reporting practices and therefore consistently only have partial or no NAIC data available.

We excluded plans that were not present in the NAIC demographics file, filed negative values in any of the segments of interest, or have negative or zero dollars in premiums or claims. We also excluded plans reporting at least 1,000 hospital patient days incurred per 1,000 member months. We only included plans that were categorized as having a “medical” focus in our analysis and exclude “specialty” plans which are categorized as “ancillary or supplemental benefit plans.” We also excluded any plans from the U.S. territories. We corrected for plans that did not file “member months” or filed a zero “member month” value in the annual statement but did file current year membership by imputing these values. If, after imputing, plans still did not have “member months,” they were excluded.

The group market in this analysis only includes fully insured plans. NAIC defines “Medicaid” as “business where the reporting entity charges a premium and agrees to cover the full medical costs of Medicaid subscribers.” This explicitly excludes Administrative Services Only (ASO) plans. We only use “medical” focused plans to help exclude any specialty plans; however, prepaid ambulatory health plans (PAHPs), prepaid inpatient health plans (PIHPs), or Programs of All-Inclusive Care for the Elderly (PACE) plans may be included in the analysis due to NAIC’s definition of Medicaid.

Gross margins per enrollee were calculated by subtracting the sum of total incurred claims from the sum of unadjusted health premiums earned and dividing by the total number of members.

Premiums for Medicare Advantage plans primarily consist of federal payments made to plans and any additional amounts plans may choose to charge their enrollees. Premiums for Medicare Advantage plans do not include payments for Medicare Part D benefits. Premiums for Medicaid do not reflect contractual adjustments related to risk corridors or other risk-sharing adjustments.

To calculate medical loss ratios, we divided the market-wide sum of total incurred claims by the sum of all unadjusted health premiums earned. MLRs in this analysis are simple loss ratios and do not adjust for quality improvement expenses, taxes, or risk program payments. It should be noted that other organizations and agencies use claims and premiums reported in the “Statement of Revenues & Expenses” for their medical loss ratio calculations.

Appendix

Individual Market:The individual market, which accounted for about 18 million people in the first quarter of 2023, includes coverage purchased by individuals and families through the Affordable Care Act’s exchanges (Marketplaces) as well as coverage purchased directly off-exchange, which includes both plans complying with the ACA’s rules and non-compliant coverage (e.g., grandfathered policies purchased before the ACA went into effect and some short-term plans). The federal government provides subsidies for low and middle-income people in the Marketplace and includes measures, such as risk adjustment, to help limit the financial liability of insurers. Insurers in the individual market receive premium payments from enrollees, plus any federal subsidies for people in the Marketplaces.

Some plans submitting data on the Exhibit of Premiums Enrollment and Utilization appear to be including some Children’s Health Insurance Program (CHIP) data in their Individual market filings. In a previous version of this analysis, we used the Supplemental Health Care Exhibit to address this. However, in this analysis, we opted to use the EPEU to ensure comparability.

Group Market:The fully insured group market serves employers, their employees and dependents who are enrolled in fully insured health plans. This market includes both small and large group plans but excludes employer-sponsored insurance plans that are self-funded, which account for 65% of workers with employer-sponsored insurance in 2023. Roughly 30 million people were enrolled in fully insured group market plans in 2023. Plans typically receive premium payments from both employers and their employees.

Medicaid Managed Care:The Medicaid managed care market includes managed care organizations (MCOs) that contract with state Medicaid programs to deliver comprehensive acute care (i.e., most physician and hospital services) to enrollees. As of July 2021, about three-fourths (just over 66 million people) of all Medicaid beneficiaries nationally received most or all of their care from comprehensive risk-based MCOs. There is significant variation across states with respect to services that are covered by MCOs.

In this analysis, the NAIC data we use defines “Medicaid” as “business where the reporting entity charges a premium and agrees to cover the full medical costs of Medicaid subscribers” and only explicitly excludes Administrative Services Only (ASO) plans from their reporting. While we only use “medically” focused plans to help exclude any specialty plans, PAHPs, PIHPs and PACE plans may not be excluded due to NAIC’s definition of Medicaid. Additionally, for Medicaid, there are five states (Arizona, California, Delaware, New York, and Oregon) that have different reporting practices and therefore consistently only have partial or no NAIC data available. In other work, KFF defines comprehensive MCOs as managed care plans that provide comprehensive Medicaid acute care services and, in some cases, long-term services and supports as well. This excludes “limited benefit plans” including prepaid ambulatory health plans (PAHPs), prepaid inpatient health plans (PIHPs), and Programs of All-Inclusive Care for the Elderly (PACE) that may be included in this analysis.

Mark Farrah Associates Health Coverage PortalTM includes data from fully capitated risk-based MCOs as well as non-comprehensive Primary Care Case Management (PCCM) plans and some specialty plans. PCCM plans have lower capitated payments than comprehensive MCO agreements because a primary care physician is paid a smaller flat fee for case management and care coordination responsibilities, but the remainder of services an enrollee receives are delivered on a Fee-For-Service agreement.

Medicare Advantage:The Medicare Advantage market provides Medicare-covered benefits through private plans to more than 30 million Medicare beneficiaries in 2023, which is just over half of all Medicare beneficiaries in 2023. The federal government makes risk-adjusted payments (higher payments for sicker enrollees and lower payments for healthier enrollees) to plans (averaging nearly $14,380 per enrollee in 2023) to cover the cost of benefits covered under Medicare Parts A and B and supplemental benefits, such as dental, vision, hearing, and others, with additional payments for costs associated with prescription drug coverage. Some plans charge enrollees an additional premium.

Supreme Court Decision Limiting the Authority of Federal Agencies Could Have Far-Reaching Impacts for Health Policy

Published: Jul 1, 2024

The US Supreme Court has again overturned longstanding precedent, this time getting rid of a 40-year- old standard for decision making that required federal courts to defer to reasonable agency decisions where federal law is silent or unclear. This “Chevron deference” standard is now gone, ushering in a new era where courts will not have to accept agency expertise in their review of challenged regulations. While the details of the rules that define administrative law often garner little attention, this decision, like the decision that overturned Roe v. Wade, will have profound effects for health care. This issue brief examines the decision and assesses what is ahead.

What the Court Said

As explained in the KFF brief Upcoming SCOTUS Case Could Weaken the Impact of Regulation on Key Patient and Consumer Protection, the Supreme Court took up two cases to review the question of whether Chevron deference should be overruled or changed. The two cases, Loper Bright Enterprises v. Raimondo and Relentless, Inc. v. Department of Commerce, decided jointly, relate to federal regulations affecting the fishing industry, but the decision will shape how courts review legal challenges to all regulations that interpret issues where a federal law is ambiguous or silent, including health care.

In a 6-3 decision, with Justice Roberts writing for the majority, the Court concluded that Chevron deference should never have been used to begin with, overturning the Chevron decision. The Court made the following major points:

  • Courts must use independent judgment to determine the meaning of federal statutes. It cannot defer to agency regulation just because the issue is not clear in a statute. According to the majority opinion the Chevron decision runs counter to the Administrative Procedure Act (APA) which incorporated prior practice that “courts decide legal questions by applying their own judgement.” The APA is a 1946 law that sets parameters for how agencies function.
  • On the question of deferring to agency expertise to resolve an issue, the Court said that “…agencies have no special competence in resolving statutory ambiguities. Courts do.” While courts can “respect” agency regulation and expertise and look to it to inform them on technical issues, “Congress expects courts to handle technical statutory questions.”
  • While federal courts must generally follow prior Supreme Court decisions (a legal concept called stare decisis), the majority opinion said that the 1984 Chevron decision is flawed and “unworkable,” because there can be different interpretations of what makes a statute ambiguous. As a result, the Court concludes that there is not “any reason to wait helplessly for Congress to correct our mistake.”
  • The opinion notes that it does not implicate prior cases that relied on Chevron to uphold agency actions because those decisions are still subject to “statutory stare decisis” and can still be upheld even though the deference standard has changed.

Of note is a 33-page dissent by Justice Kagan (joined by Justices Sotomayor and Jackson) stating that, contrary to the majority, the APA includes no reference to how courts should review agency regulations—with or without deference to agency decisions—when courts use their authority to interpret the law. In addition, she rebukes the majority for disrupting use of a method of review (Chevron deference) that is the “cornerstone of administrative law” and “subverting every known principle of stare decisis,” with no particularly significant reason “above and beyond thinking it wrong.” She questions the majority’s conclusion that the decision will not implicate prior cases that have upheld agency regulations based on Chevron deference, questioning why courts would respect those prior decisions when this Court is not respecting precedent in this case. She predicts that some existing federal regulations never challenged under Chevron before will now be challenged. One quote from Justice Kagan’s dissent best sums up her opinion:

“In one fell swoop, the majority today gives itself exclusive power over every open issue—no matter how expertise-driven or policy-laden—involving the meaning of regulatory law. As if it did not have enough on its plate, the majority turns itself into the country’s administrative czar.”

Implications for Health Policy

Criticism of the authority of administrative agencies has been an ongoing theme of commentary from some organizations concerned with overregulation of industry. Some have encouraged changes to “dismantle the administrative state,” with a particular focus on the US Department of Health and Human Services—the agency with most of the administrative authority over Medicare, Medicaid, the Affordable Care Act and other health statutes, and that houses key public health organizations such as the Centers for Disease Control and Prevention and the National Institutes of Health.

The decision will likely impede the ability of executive agencies to implement laws passed by Congress. As explained in the previous KFF brief, while agency final rules will still have the force of law, there will be more of an incentive to challenge these rules in a court that now will not have to give any weight to agency decisions and expertise where statutes are not clear. More regulations will be overturned, placing a real barrier on implementing key health care protections such as prescription drug affordability in Medicare, eligibility rules for Medicaid beneficiaries, infectious disease control and public safety standards, as well as consumer protections for those in self-insured private employer-sponsored plans.

A natural result will mean less agency regulation. No law passed by Congress can include every possible nuance needed to implement the law. Limitation on the ability of regulators to fill in those gaps could result in impacts to health care consumer and patient protections. Technical requirements for how plans and providers bill and code for patient service, for example, are important in executing new health care standards, from free preventive care to surprise billing protections. Without regulations to fill in technical gaps, it will be more difficult to operationalize requirements to carry out the intent of Congress.

The executive branch will not necessarily be the only place where there are implications. Congress will be challenged to be more specific in its legislation, making it more difficult to reach consensus on a range of matters. This may be a particular concern where the issue being addressed in legislation is itself a black box—such as prescription drug pricing and the role of pharmacy benefit managers—where Congress itself and the public may lack access to reliable information about a highly technical subject.

Those seeking to access the judicial branch could see barriers as lower federal courts become more crowded or backlogged with administrative actions. Also, the decision-making itself will require more technical and scientific knowledge from judges, perhaps expanding the time it takes to resolve disputes.

What Happens Now

The decision does not immediately change any specific health care policy, but over time all health care stakeholders will see the impact of the reduced significance of notice-and-comment rulemaking in areas where federal law is silent or unclear. Some argue that the rulemaking process is already “captured” by industry in some areas, such that industry players can influence regulation to their advantage. This will affect these stakeholders as they may no longer have an easy avenue to get their concerns heard and addressed. The decision could also impede reforms meant to help health care consumers navigate an increasingly complex and unaffordable health system, particularly in cases where agencies stretch their regulatory authority beyond the specifics in a statute.

The decision does not affect agency ability to enforce health care statutes using existing tools including audit, data collection, and administrative agency proceedings where those are available. It could mean a shift in agency resources from drafting and defending regulations to enforcement actions based on the text of a statute or a renewed focus on helping consumers recognize and act on activity that violates federal law. This could mean more informal guidance from agencies on best practices to inform consumers and monitor stakeholder activity instead of courting industry and setting new standards. Whether these actions take place, however, will be largely dependent on the priorities of the President.

Congress will still have the ability to specifically delegate to administrative agencies in legislation the task of developing regulations in certain areas. Chevron deference does not implicate this scenario. However, regulations resulting from this delegation can still be reviewed by courts without deference to the agency or could be subject to constitutional challenges claiming that Congress does not have the authority to delegate (nondelegation doctrine). The “major questions doctrine” is another legal framework courts have increasingly applied in recent years to invalidate agency regulation.

Short of unlikely Congressional action to restore Chevron deference, the Supreme Court in a single decision has shifted many policy decisions from agency technical experts to federal judges, with implications for health policy that will reverberate for years to come.