How Much and Why ACA Marketplace Premiums Are Going Up in 2026

Published: Aug 6, 2025

A new analysis of initial rate filings for Affordable Care Act (ACA) Marketplace plans submitted by 312 insurers in all 50 states and the District of Columbia finds the median proposed increase for 2026 is 18%, more than double last year’s 7% median proposed increase. The proposed rates are preliminary and could change before being finalized in late summer.

In addition to rising cost and utilization of services, insurers cited the expiration of enhanced premium tax credits as a significant factor in their rate hikes for next year. The analysis includes a data table showing proposed premium increases by state and by insurers.

The full analysis and other data on health costs are available on the Peterson-KFF Health System Tracker, an online information hub dedicated to monitoring and assessing the performance of the U.S. health system.

Kindergarten Routine Vaccination Rates Continue to Decline

Published: Aug 5, 2025

Editorial Note

This brief was updated on September 3, 2025 to correct the title of Figure 2.

Routine vaccination rates for kindergarten children continue to decline in the U.S., while exemptions from school vaccination requirements, particularly non-medical exemptions, have increased. These trends began during the COVID-19 pandemic and have continued over time (Figure 1). Recent trends appear to be related to increasing vaccine hesitancy, fueled in part by vaccine misinformation. The past few years have seen more skepticism among the public about the safety and effectiveness of measles vaccines, a decline in trust of health authorities in general, and increasingly partisan views on vaccine requirements. This issue brief provides an update on the latest trends in children’s routine vaccination and exemption rates.

States Have Experienced Declines in Vaccination Rates and Increases in Exemption Rates Since the Pandemic Began

While states and local jurisdictions, not the federal government, set vaccine requirements for school children, the federal government has a long-standing, evidence-based system for approving and recommending vaccines for the public, including the childhood vaccination schedule, which is used by states, pediatricians, and parents. Department of Health and Human Services (HHS) Secretary Robert F. Kennedy Jr. has led recent efforts to re-examine the federal childhood vaccine schedule and replace members of the Centers for Disease Control and Prevention’s (CDC) vaccine advisory committee (ACIP). KFF polling from August 2025 found there is confusion among the public about U.S. vaccine policy, with half of the public thinking RFK Jr. has made “major” (26%) or “minor” (26%) changes to vaccine policy while the other half either say they “don’t know enough to say” (40%) or say no changes have been made (7%). In addition, half (48%) of parents are not sure if federal health agencies are currently recommending that healthy children receive a COVID-19 vaccine this fall or not. While there have not been changes to other routine childhood vaccinations, the CDC is no longer formally recommending the COVID-19 vaccine for healthy children, and COVID-19 vaccination rates among children are low. Changes (and confusion about those changes) at the federal level coupled with reduced support from the federal government for state and local health departments could further drive down vaccination rates among children.

The share of kindergarten children up to date on their vaccinations continues to decline. Data collected and aggregated annually by the CDC from state and local immunization programs found that 92.5% of kindergarteners had been vaccinated against measles, mumps, rubella (MMR) and polio and 92.1% against DTaP (diphtheria, tetanus, and acellular pertussis) for the 2024-2025 school year. This is down from 95% across all three vaccines for the 2019-2020 (pre-pandemic) school year and below coverage levels of the past decade. In every school year since the pandemic began, the MMR vaccination rate has fallen below the Healthy People 2030 “target” rate of 95%, the level needed to prevent community transmission of measles, a highly contagious and life-threatening virus. This means approximately 286,000 kindergarteners were unvaccinated and unprotected against measles, and research shows the more unvaccinated children in a school, the larger risk of an outbreak becomes. While measles has been officially “eliminated” from the U.S. since 2000, the U.S. has reported more cases of measles in just the first half of 2025 than in any year since 1992, putting the U.S.’s elimination status potentially at risk.

Over three-quarters (39) of states had MMR vaccination rates below the “target” rate of 95% for the 2024-2025 school year, an increase from 28 states during the 2019-2020 (pre-pandemic) school year (Figure 2). Further, 16 states reported rates below 90% for the 2024-2025 school year, compared to only three states in the 2019-2020 school year. In the last year alone, over half of states experienced declines in vaccination rates across all state required vaccines, including MMR, DTaP, polio, and varicella. There is also substantial variation in vaccination rates across states, with MMR coverage rates among kindergarteners for the latest school year ranged from a low of 78.5% in Idaho to a high of 98.2% in Connecticut. There can also be variation in vaccination coverage within states, and, when there are clusters of unvaccinated people within a specific community, the risk of an outbreak is higher.

Over Three-Quarters of States Had MMR Vaccination Coverage Rates For Kindergarteners Below the Healthy People Target of 95% During the 2023-2024 School Year

At the same time, the share of kindergarten children with an exemption from one or more required vaccinations increased. The share of children claiming an exemption from one or more vaccinations rose from 2.5% in the 2019-2020 school year to 3.6% in the 2024-2025 school year, the highest national exemption rate to date. Increases in non-medical exemptions accounted for the recent increases; non-medical exemptions increased from 2.2% to 3.4% while medical exemptions actually declined slightly from 0.3% to 0.2% from 2019-2020 to 2024-2025. While a seemingly small increase in non-medical exemptions, any increases limit the overall share of children able to be vaccinated and make it more difficult to reach vaccination rate goals. Studies have shown that higher exemption rates are associated with lower vaccination coverage rates and increased risk for disease outbreaks.

Seventeen states in the 2024-2025 school year had vaccine exemption rates over 5% compared with nine states during the pre-pandemic school year (Figure 3). Those states could not reach vaccination coverage rates at or above 95% even if all non-exempt children were vaccinated (rates shown here are for exemptions to one or more vaccines, so potentially achievable coverage rates could vary by vaccine type). In the last year alone, 37 states (including D.C.) experienced an increase in the share of kindergarteners claiming an exemption for one or more vaccines. As of 2025, all states and DC require children to be vaccinated against certain diseases, including MMR, in order to attend public schools, though exemptions are allowed in certain circumstances. All states allow a medical exemption, and 47 states (including D.C.) allow for a religious or personal belief exemption (or both). In recent years, some groups and state leaders have pushed to relax requirements and expand non-medical exemptions for school children while others have proposed the elimination of non-medical exemptions.

17 States Had More Than 5% of Kindergarteners Claiming A Vaccine Exemption During the 2024-2025 School Year

A Spotlight on Vasectomy

Published: Aug 5, 2025

While the Affordable Care Act requires most private health plans to provide coverage with no cost-sharing for a range of recommended preventive services, including female contraceptives and female sterilization, because male condoms and vasectomy procedures are considered to be services for men, they are not required to be covered under the law.  Vasectomies, considered permanent sterilization methods for men, are typically out-patient procedures and can cost $1,000 or more without insurance.  These procedures are generally much simpler and have fewer risks that tubal ligations which is the procedure that women who seek permanent contraception typically get. As part of the 2024 KFF Women’s Health Survey, a nationally representative sample of 1,191 men ages 18 to 64 were surveyed on a broad range of health issues. This data note highlights their responses to their experiences, knowledge, and perspectives about vasectomy services.

Just over one in ten men ages 18 to 64 (11%) say they have had a procedure that resulted in sterilization, such as a vasectomy (Figure 1). This rate is half of that reported by women, where 25% of those in the same age range report sterilization as their contraceptive method. Larger shares of older men say they have been sterilized compared to younger men, but 5% of men ages 18 to 25 report they have been sterilized. Over one in ten White men (13%) report having been sterilized compared to just 3% of Black men. Smaller shares of men with low incomes have had a sterilization procedure compared to men with higher incomes (7% vs.13%).

Larger Shares of White Men and Those with Higher Incomes Say They Have Been Sterilized or Considered Getting a Vasectomy

Among men who have not had a sterilization procedure, one in five (21%) say they would consider getting a vasectomy. The largest shares of men who would consider getting a vasectomy include men ages 26 to 35 (31%) and men ages 36 to 49 (25%), White men (25%), and men with higher incomes (24%).

Among men ages 18 to 64 who have considered getting a vasectomy but have not had one, reasons for not seeking the procedure included: worry about pain and/or complications from the procedure (39%), the cost of the procedure (31%), not having the time (23%), wanting the ability to have children in the future (21%), and relying on a different birth control method with their partner (20%) (Table 1). Among those who have never considered getting a vasectomy, six in ten (59%) say they do not need a vasectomy, or the question does not apply to them.

Among Men Who Have Considered Getting a Vasectomy, Their Top Reasons For Not Getting One Are Worry About Pain and/or Complications and Cost

Regarding the perspectives about cost, most men aren’t sure whether insurance plans are required to pay the full cost of vasectomy procedures, which they are not required to cover. Plans may cover the procedure, but typically it is with cost-sharing, and the out-of-pocket costs are determined by plan coverage policy and deductibles. There are considerable gaps in understanding of coverage policy. A third (34%) of men ages 18 to 64 were aware that this was not a coverage requirement, but over half did not know (Figure 2).

The Majority of Men Aren't Sure Whether Insurance Plans Are Required to Pay the Full Cost of Vasectomy Procedures

There have been recent state-level policy changes to cover vasectomy procedures at no-cost similar to how sterilization procedures for women are required to be covered by federal law. As of June 2025, nine states require state-related health insurance plans to cover vasectomies at no cost to the patient: California, Illinois, Maryland, New Jersey, New Mexico, New York, Oregon, Vermont, and Washington. However, state-regulated benefit requirements do not apply to self-insured employer plans, which covered about two-thirds (63%) of covered workers in 2024.

Sterilization or Permanent Contraception as a Family Planning Method

Published: Aug 5, 2025

Sterilization or permanent contraception is the most commonly used form of family planning in the United States. There are two main methods of sterilization: tubal ligations and vasectomies. Both are safe and nearly 100% effective in preventing pregnancy. The Affordable Care Act’s (ACA) contraceptive coverage requirement applies to sterilization procedures for women, but not for men. Some states, however, have passed laws that require male procedures to be covered by state-regulated insurance plans. Permanent contraception services, however, are not available in all health care settings due to policies followed by faith-based health providers that have religious objections to the procedures. This fact sheet explains the types of permanent contraception or sterilization procedures available, reviews private insurance and Medicaid coverage policy, and discusses issues that affect availability in the U.S.

Types of Sterilization

Tubal Ligation

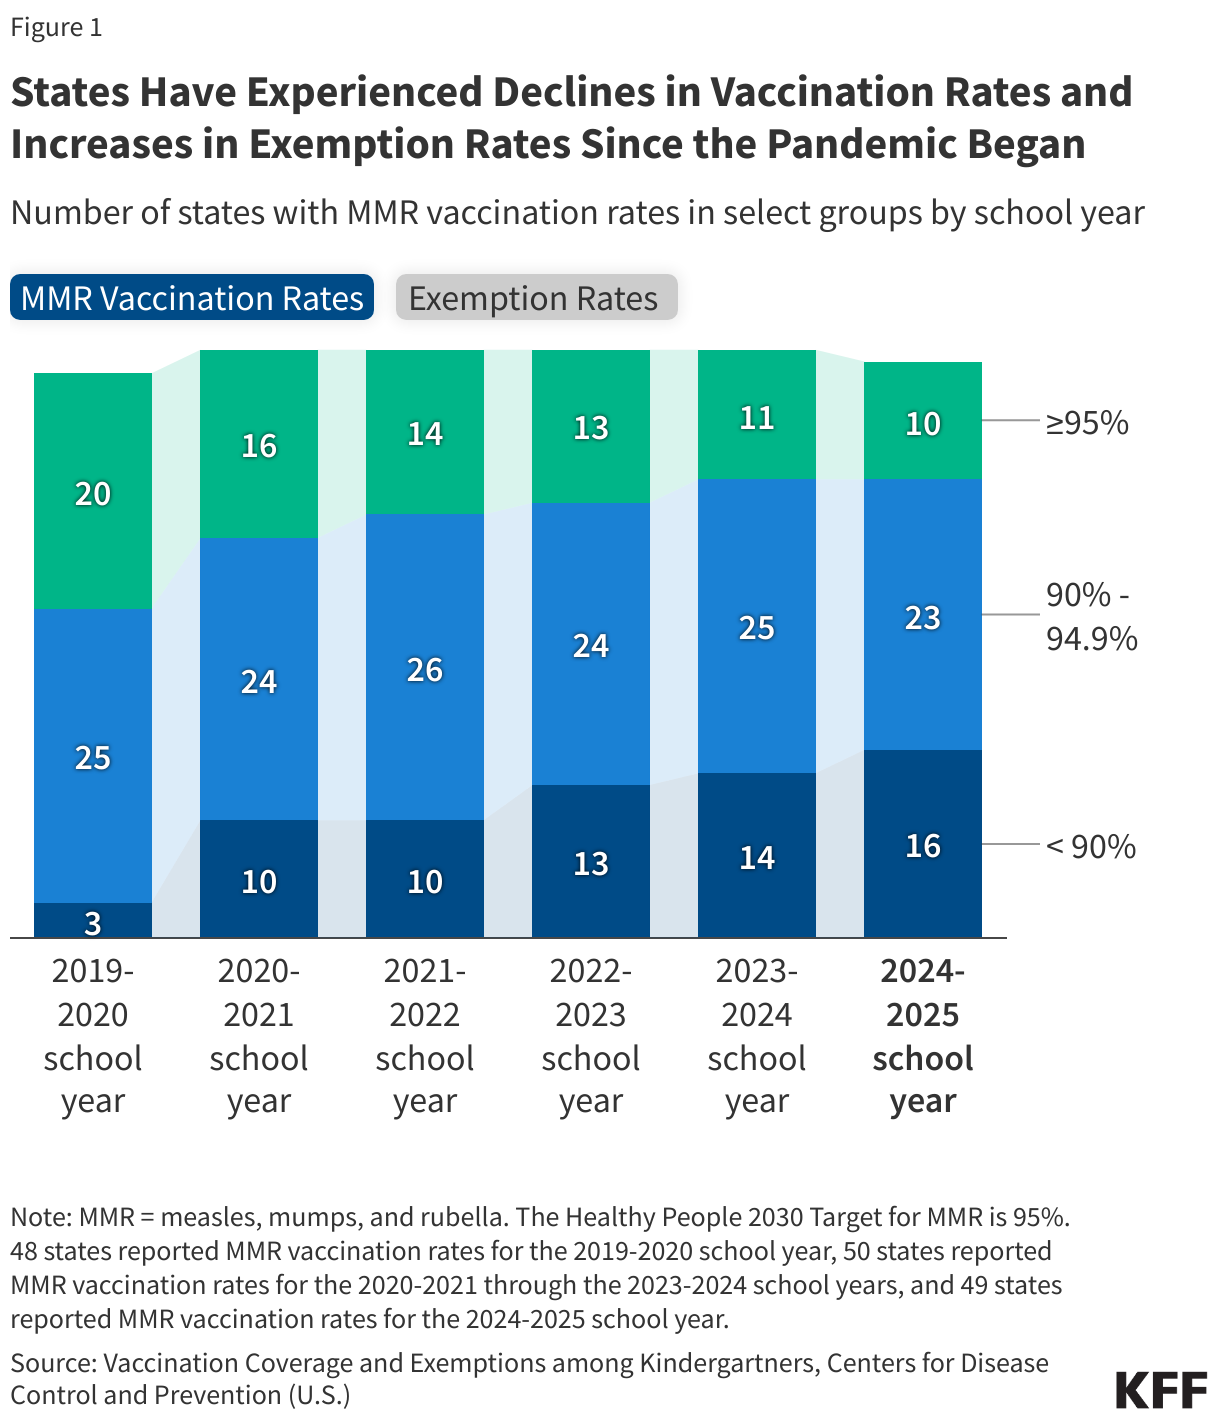
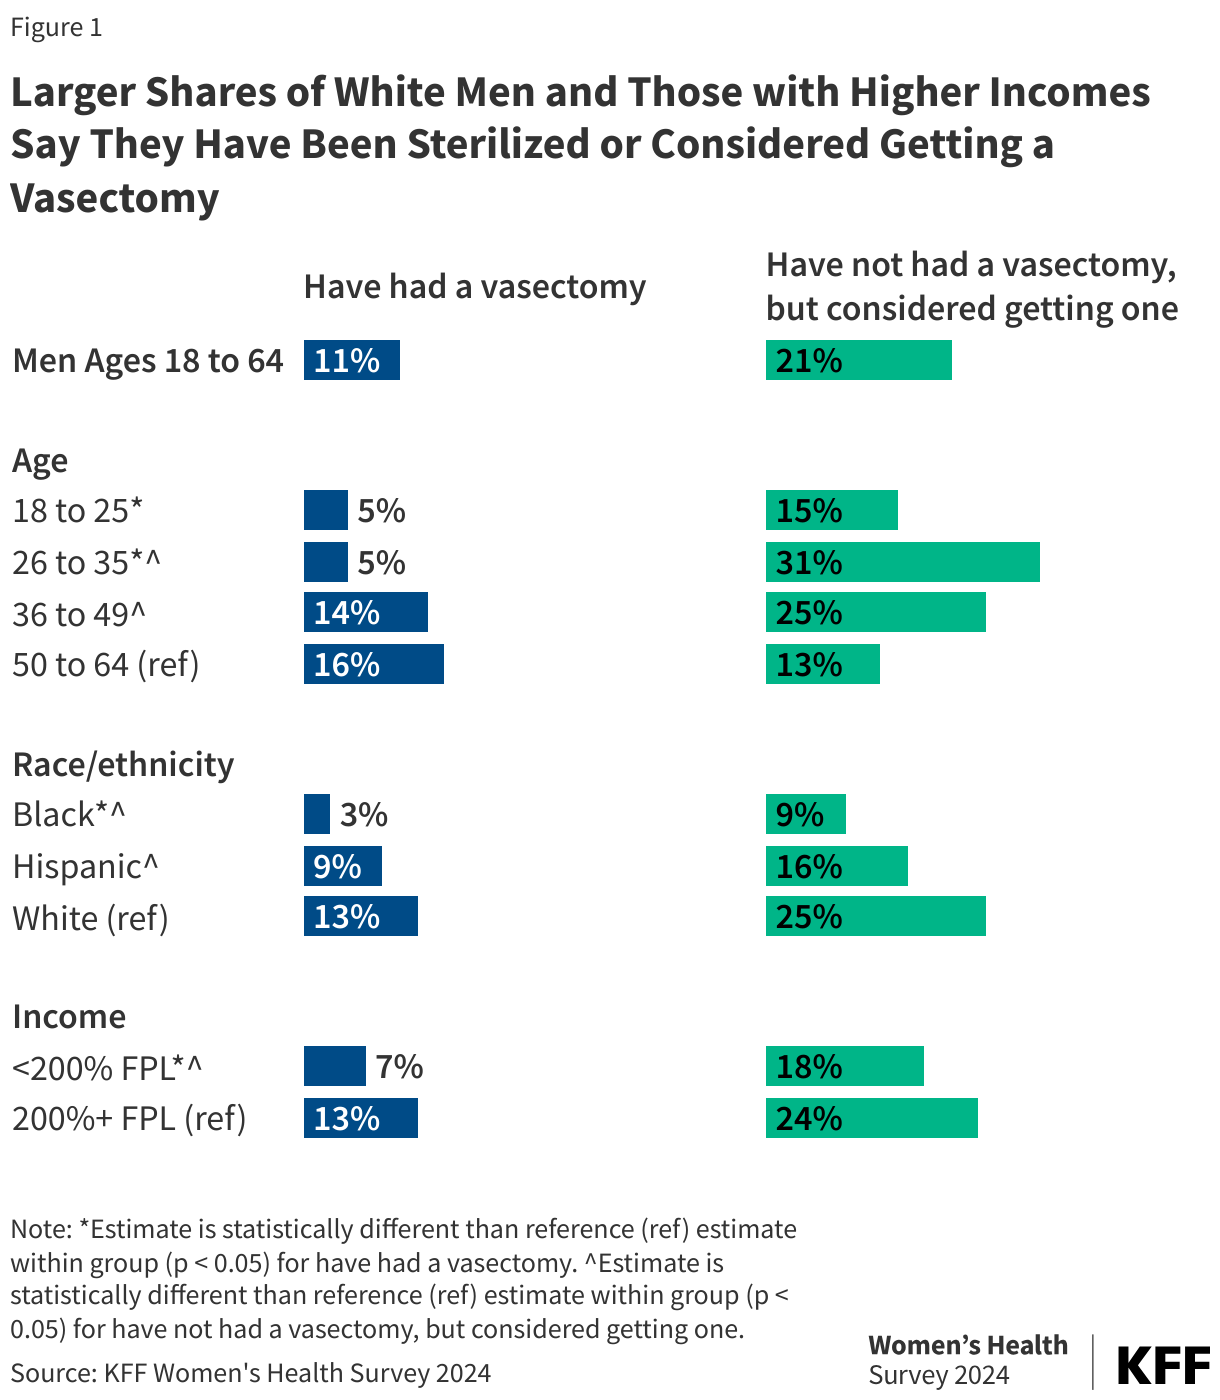
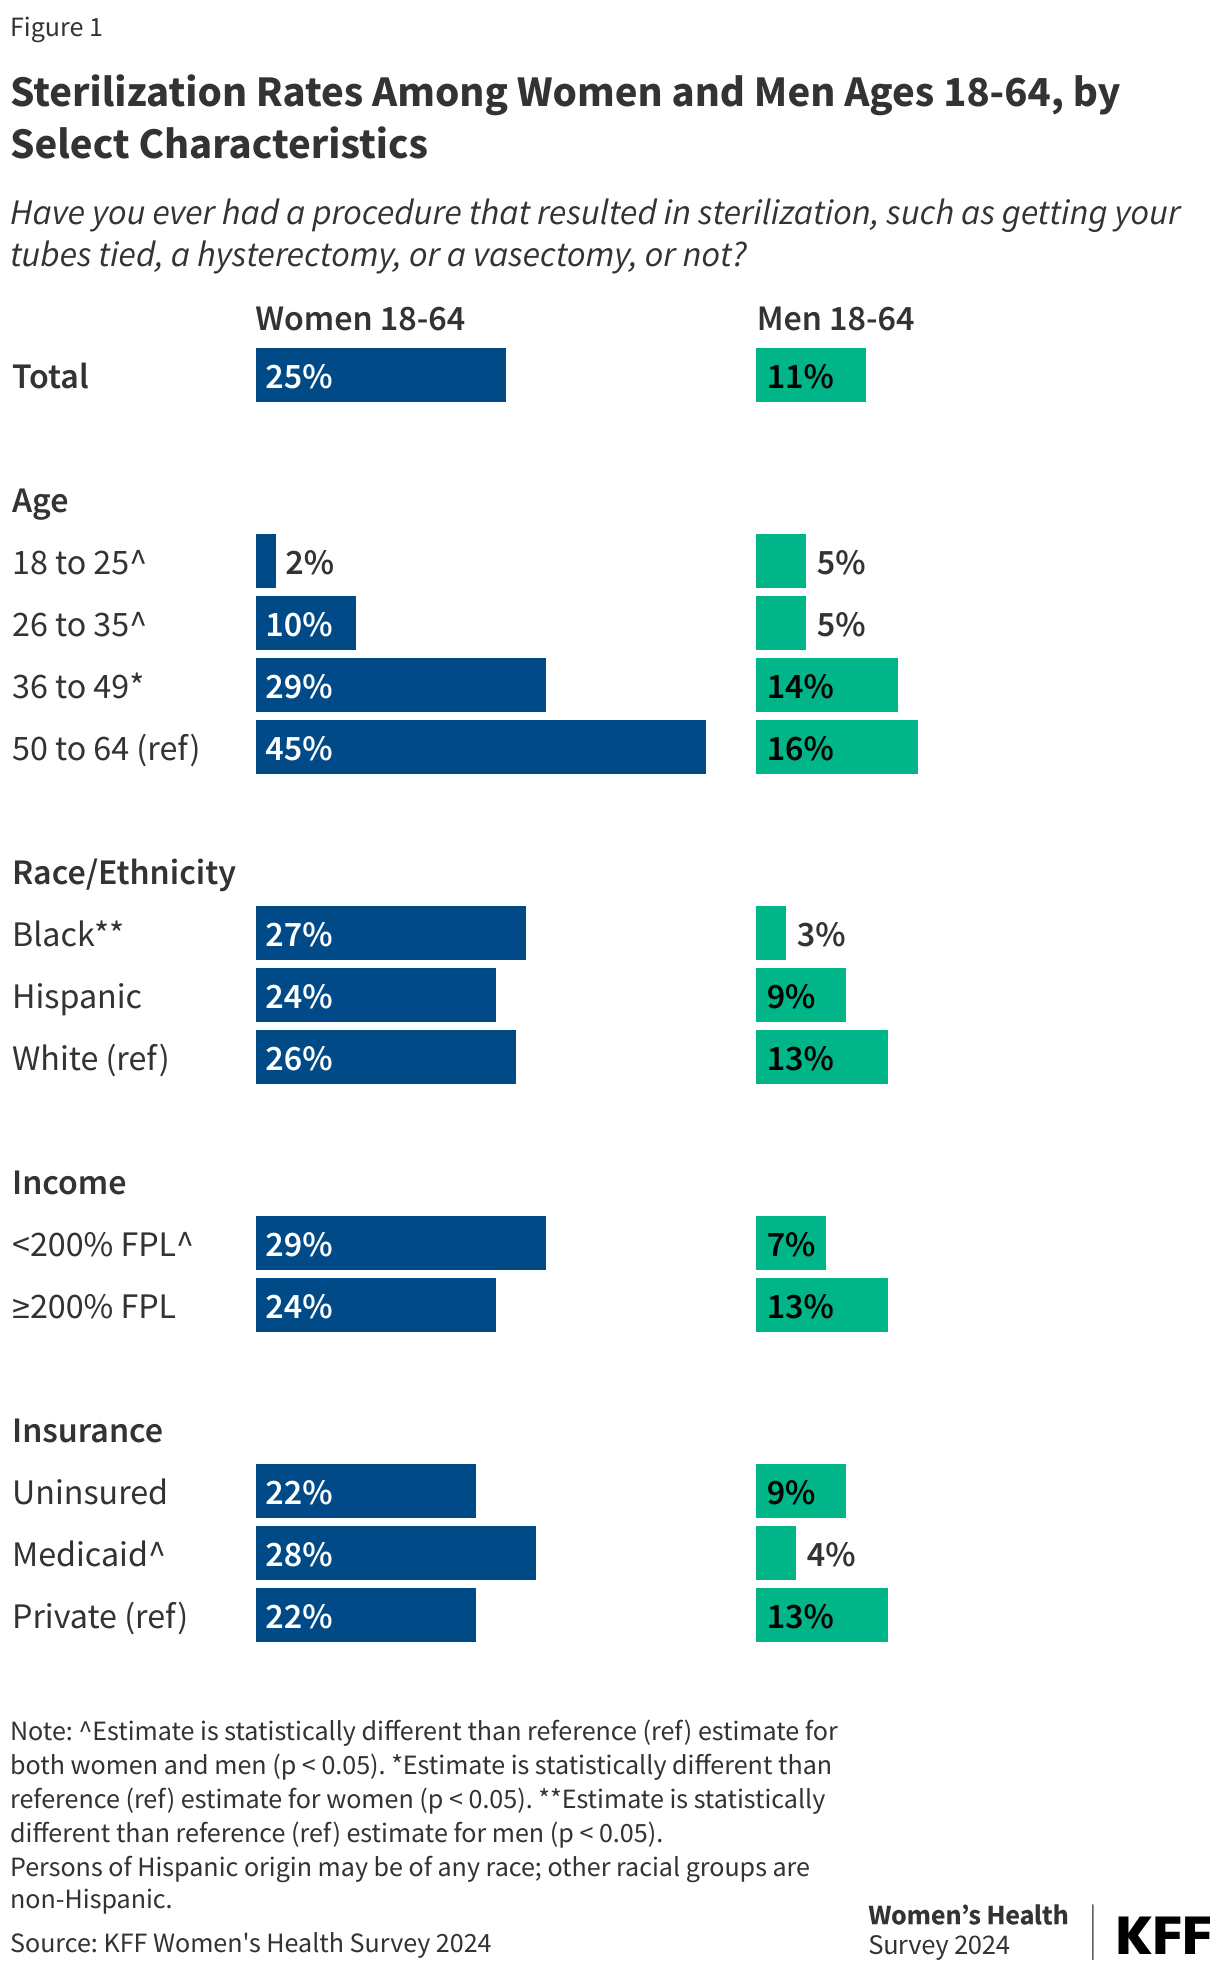
Tubal ligation is an outpatient surgical procedure conducted on people with female reproductive organs in which the fallopian tubes are either removed or blocked to prevent eggs from travelling to the uterus and sperm from fertilizing eggs. Data from the 2024 KFF Women’s Health Survey show that one in four women between the ages of 18 and 64 report they have had a sterilization procedure. Larger shares of women 50 years old and older, women with lower incomes, and women with Medicaid have had a sterilization procedure (Figure 1).

Sterilization Rates Among Women and Men Ages 18-64, by Select Characteristics

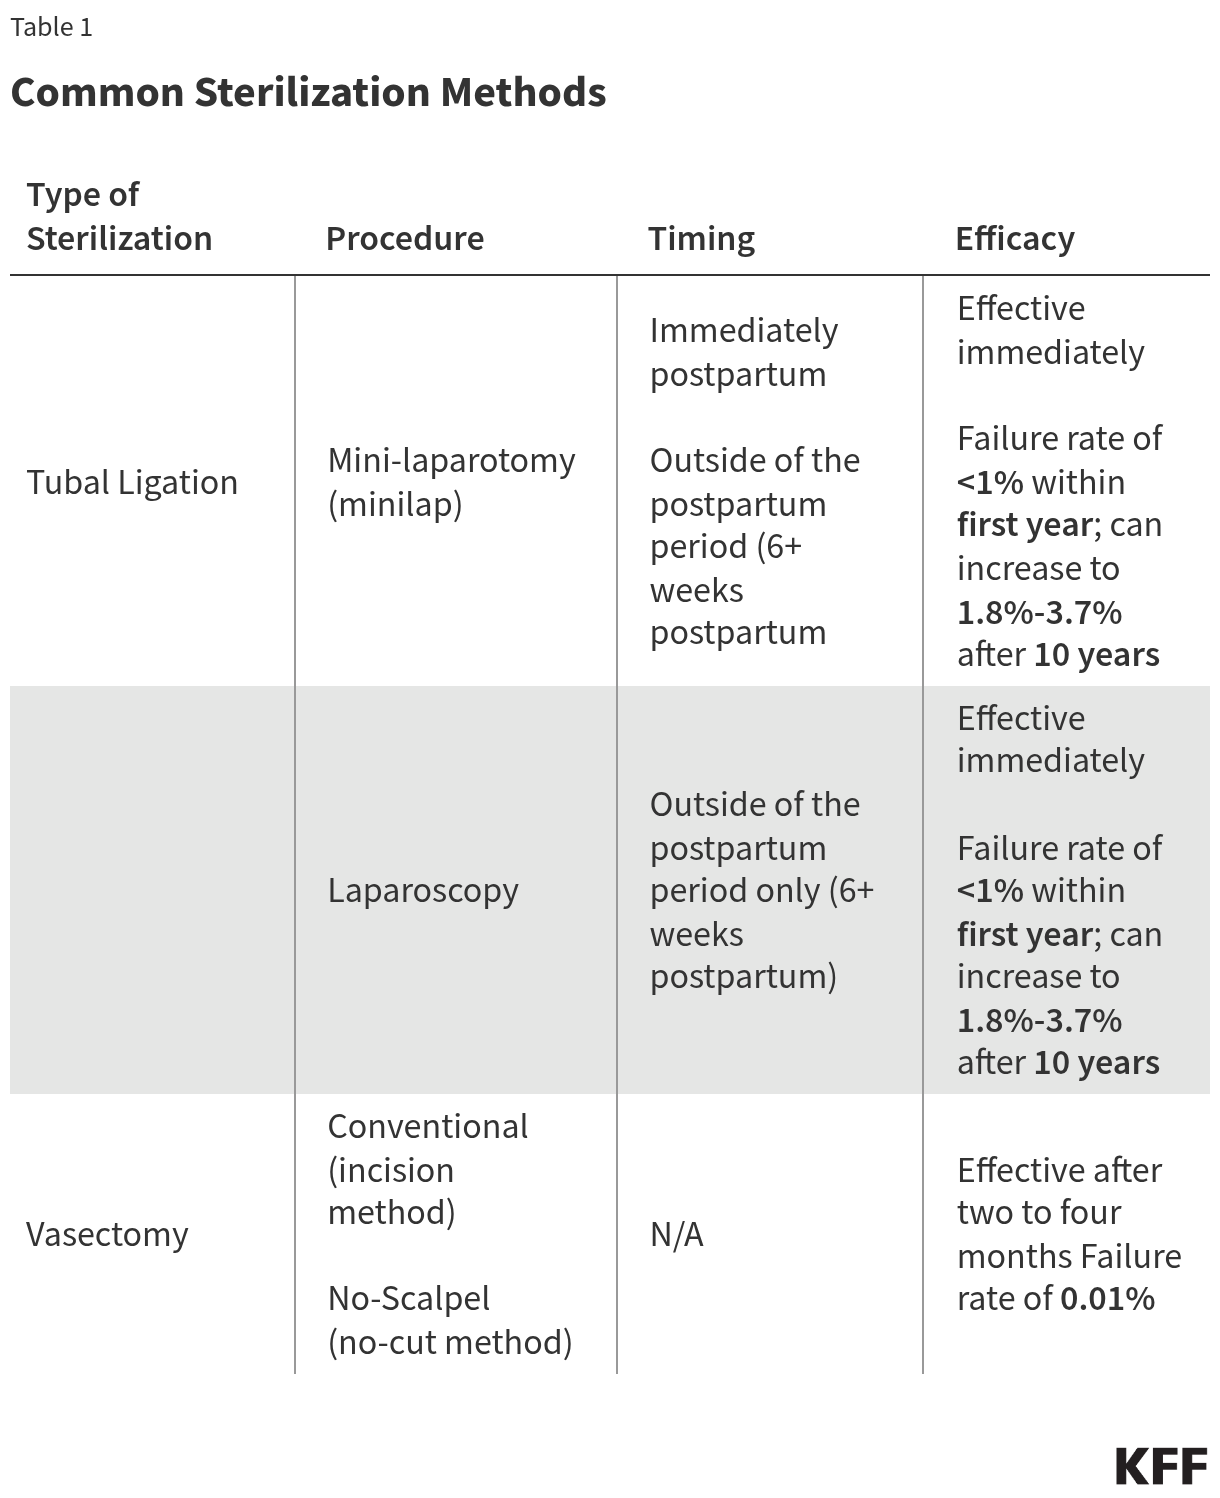
There are two main methods of surgical tubal ligation: mini-laparotomy (or a minilap) and laparoscopic sterilization (Table 1). The minilap can be performed immediately postpartum, right after childbirth, while the laparoscopic procedure cannot. Tubal ligation procedures are effective immediately and have a failure rate of less than 1% within the first year of having the surgery. After 10 years, the failure rate can increase to 18 to 37 pregnancies out of 1,000 women depending on how the fallopian tubes are closed. Complications are rare, but they can include bleeding, infection, and ectopic pregnancy. While the procedure sometimes can be reversed, the process is costly, invasive, typically not covered by insurance, and not guaranteed to work. Sterilization does not protect against sexually transmitted infections (STIs).

Vasectomies

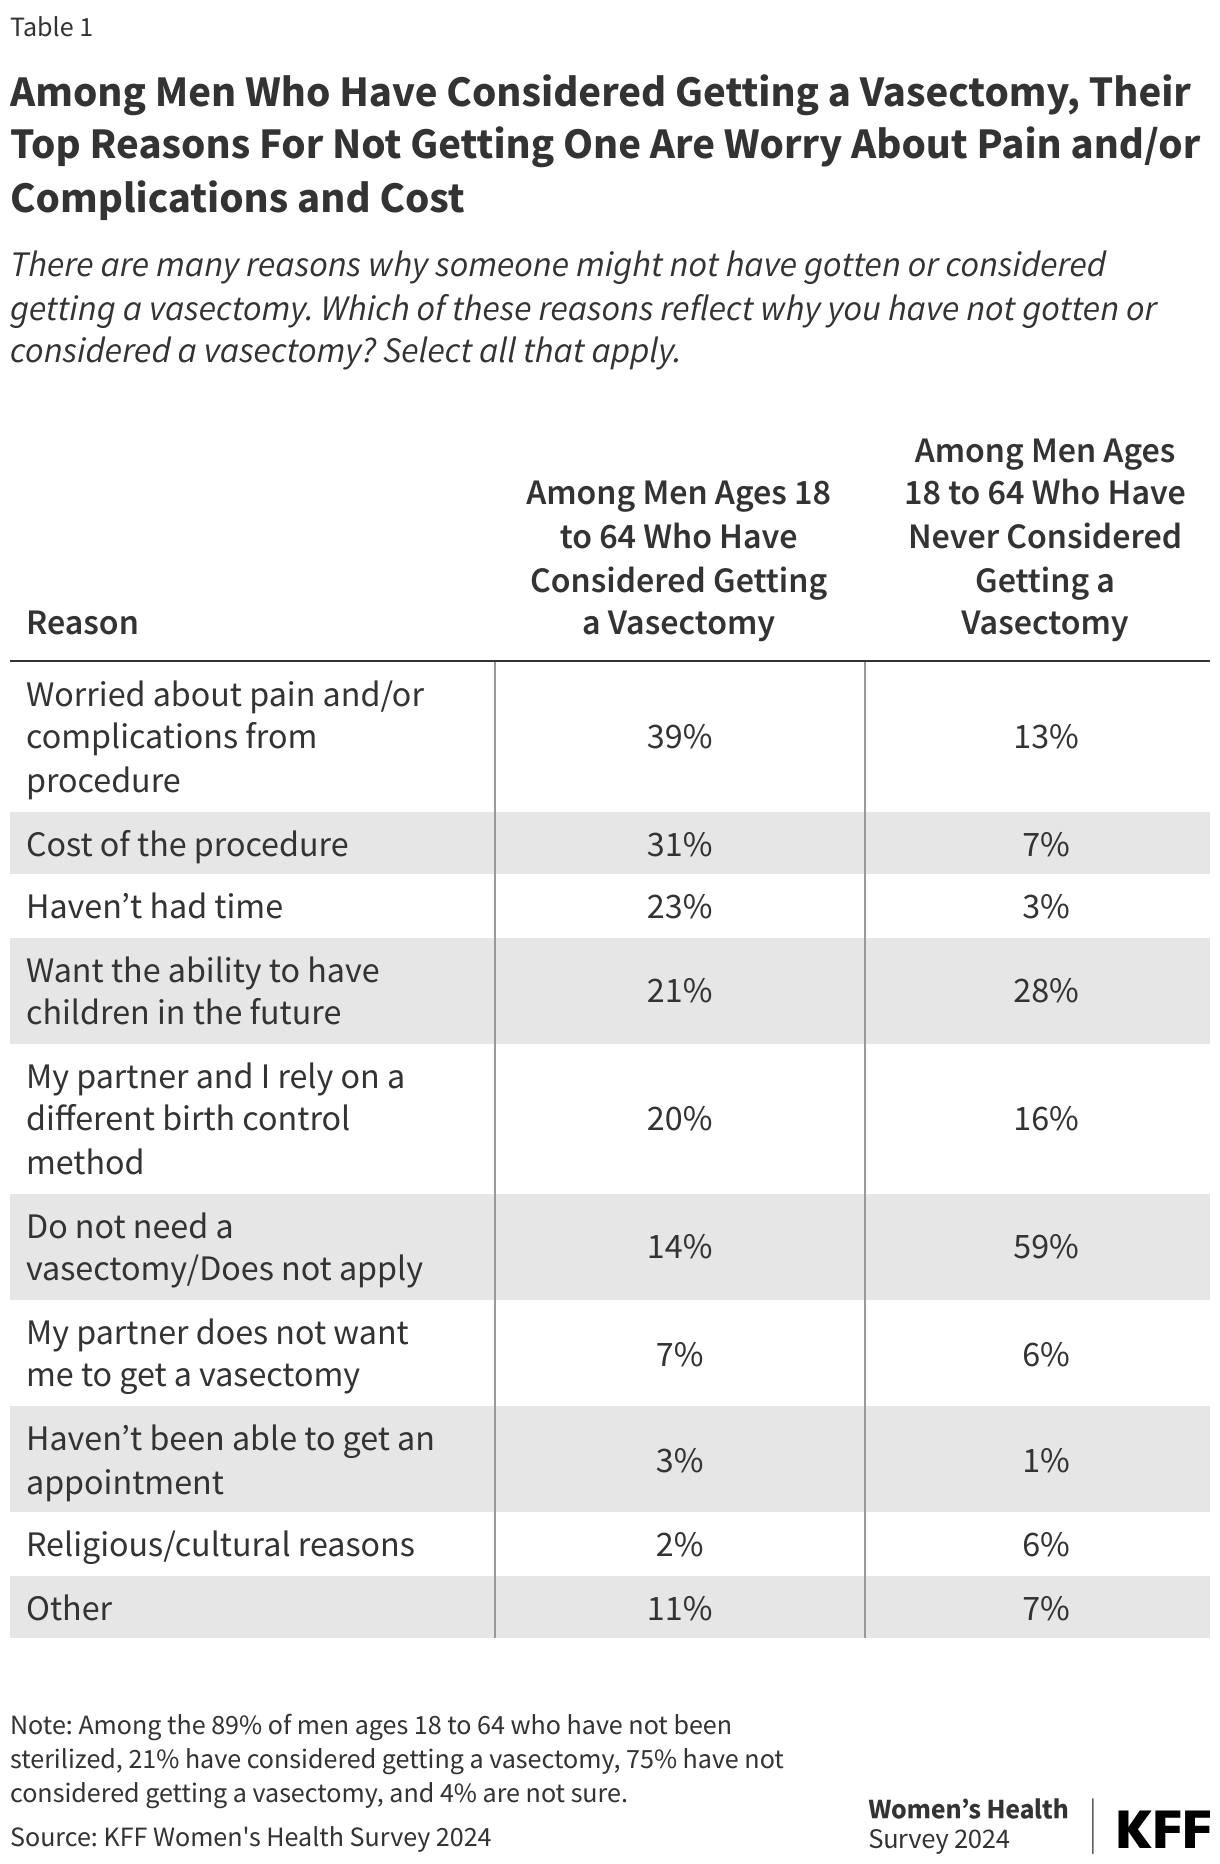
A vasectomy is an outpatient procedure done on people with male reproductive organs and is typically done under local anesthesia. In the traditional procedure, a doctor will clip, cut and tie, or cauterize the vas deferens. There is also a newer “no-scalpel” technique which is less invasive, reducing complications and recovery time (Table 1). Despite lower frequency of use compared to tubal ligations, vasectomies are safer, cheaper, and even more effective. Only one out of every 10,000 women will become pregnant using this contraceptive method; however, vasectomies are not effective immediately. It can take two to four months for sperm to be reabsorbed or ejaculated, so an alternate form of contraception should be used to prevent pregnancy. Vasectomies also do not protect against STIs.

Common Sterilization Methods

The 2024 KFF Women’s Health Survey, found that one in ten (11%) men ages 18 to 64 say they have undergone a sterilization procedure. The share who have been sterilized is higher among white men, men with higher incomes, and men with private insurance (Figure 1).

Insurance Coverage

Sterilization is a highly cost-effective method of contraception. Although it can have high upfront costs, it typically requires no long-term follow-up care and therefore can be cheaper in the long run than other methods. Depending on location, insurance, and procedure type, the out-of-pocket cost of tubal ligation procedures may range from $0 to $6,000, whereas a vasectomy may cost between $0 and $1,000.

Private Insurance and Affordable Care Act

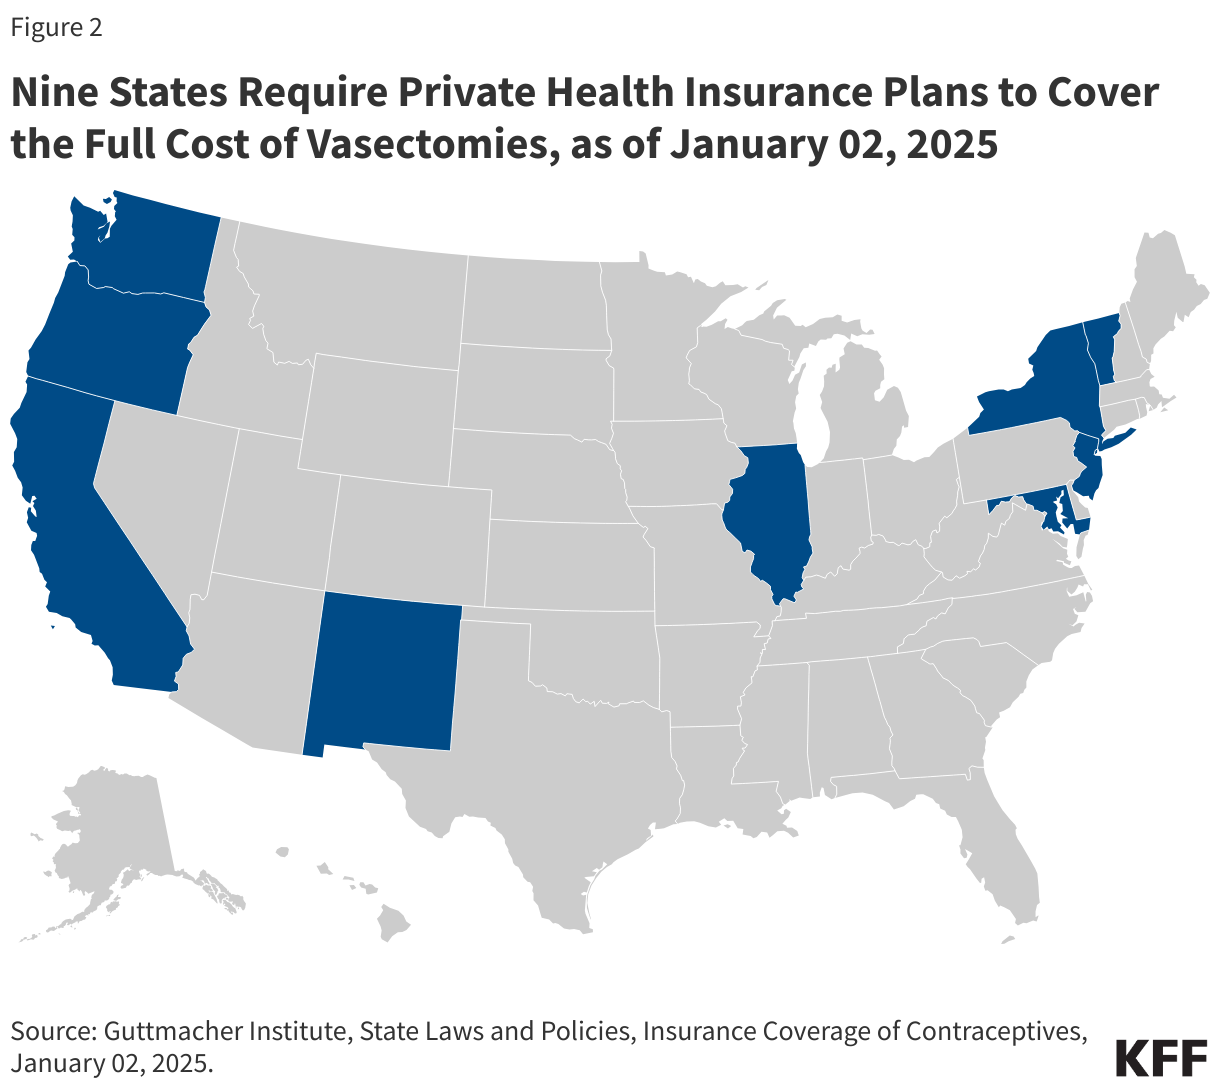
The ACA requires private health insurance plans to cover at least one form of all 18 FDA-approved contraceptive methods for women without cost sharing, meaning tubal ligation procedures must be fully covered by most private health insurance plans. This federal policy does not include vasectomies; however, nine states—California, Illinois, Maryland, New Jersey, New Mexico, New York, Oregon, Vermont, and Washington—require state-regulated private health insurance plans to cover vasectomies at no additional cost to the patient (Figure 2). State-regulated benefit requirements do not apply to self-insured employer plans, though, which covered 63% of covered workers in 2024.

Nine States Require Private Health Insurance Plans to Cover the Full Cost of Vasectomies, as of January 02, 2025

Medicaid

Medicaid, the national health coverage program for low-income individuals, is financed and operated jointly by the federal and state governments. Under Medicaid, it is mandatory for states to cover family planning, including sterilization procedures for women. Vasectomies are not federally required to be covered under any of the Medicaid pathways, but a KFF state survey found that most states report they cover the procedure.

Regulations prohibit federal funds from being used for sterilization procedures on women younger than 21 years old. They also require patients to sign an informed consent form at least 30 days prior to the procedure, with some exceptions. In the event of a premature delivery, consent must have been obtained at least 30 days prior to the due date. However, if a premature delivery or emergency abdominal surgery occurs within the 30-day waiting period, the physician must certify that consent was obtained at least 72 hours after the date on the patient’s signed consent form. This provision was implemented to guard against coercive practices and abuses that were historically directed towards women with low incomes, women with disabilities, women of color, and incarcerated women. However, some advocates suggest that this requirement places a burden on publicly insured women seeking sterilization services that women with private insurance do not face.

Uninsured

Some states have extended access to family planning services to uninsured populations through the Medicaid family planning expansion program that provides Medicaid coverage solely for family planning services to women and men who do not qualify for full Medicaid benefits. These programs are available in 32 states as of January 2025, and most report that they cover tubal ligations and vasectomies.

Although most public funding for sterilization comes from Medicaid, a share is provided by the federal Title X National Family Planning Program and the Maternal and Child Health and Social Services block grants. Changes to federal funding for clinics providing family planning programs may impede access to sterilization services for those who rely on these programs for reproductive health coverage.

Religious Providers

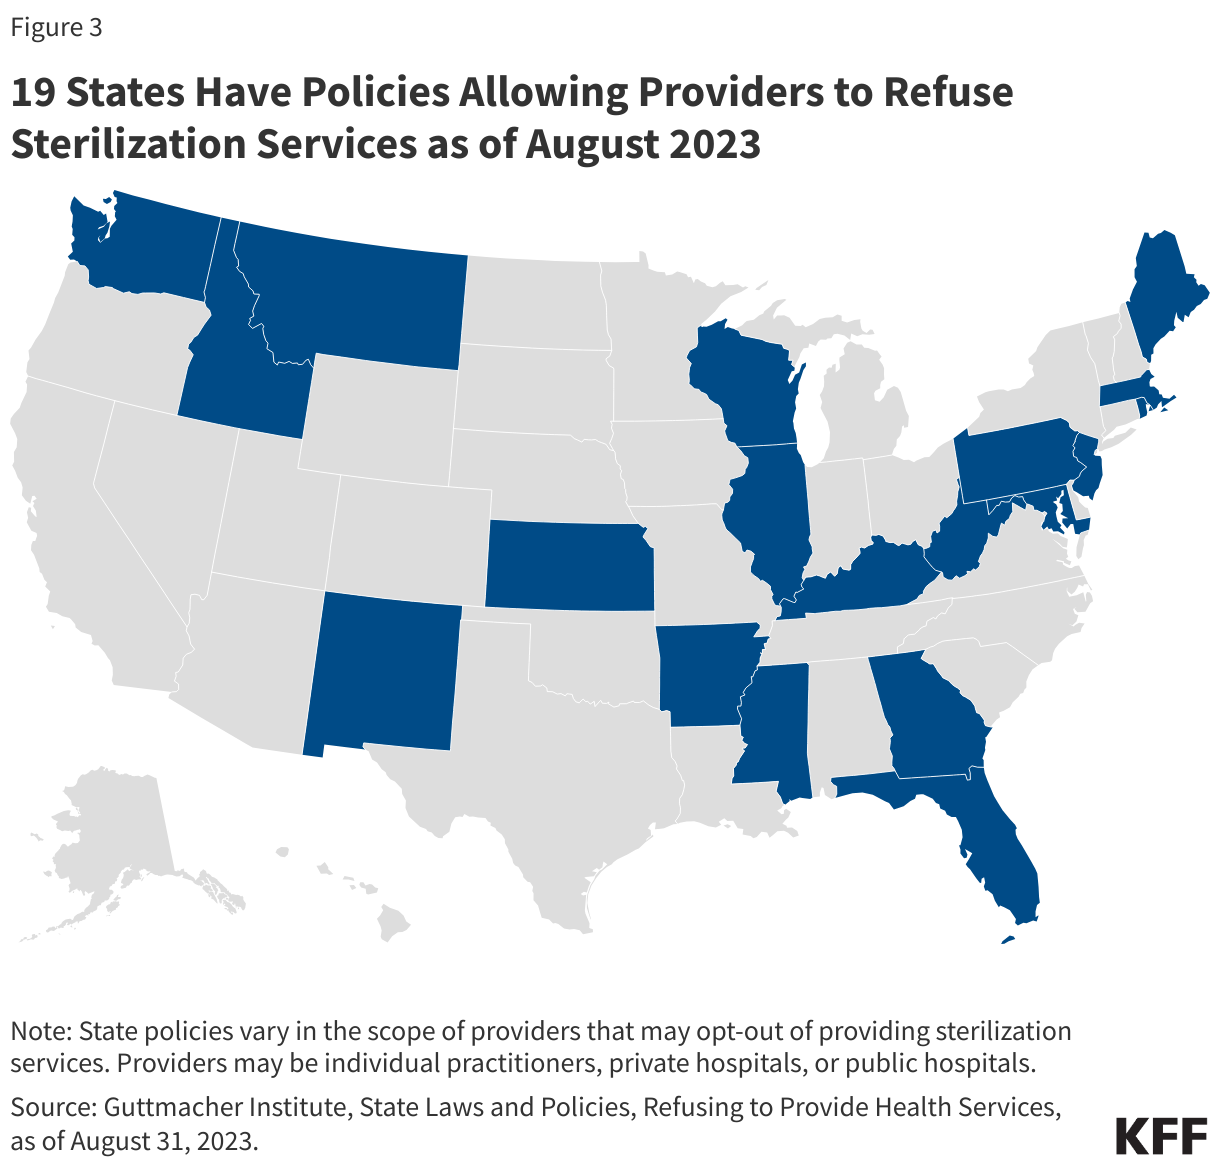
Currently, federal and state laws allow providers with religious objections to refuse sterilization services to patients. The Church Amendments prohibit the federal government from requiring a provider to assist in abortion or sterilization services if they violate the provider’s religious beliefs. As of 2023, 19 states have laws that allow some health care providers to refuse to provide sterilization services for religious reasons (Figure 3). In areas with a limited choice of health care providers, refusal policies could limit the availability of sterilization services.

19 States Have Policies Allowing Providers to Refuse Sterilization Services as of August 2023

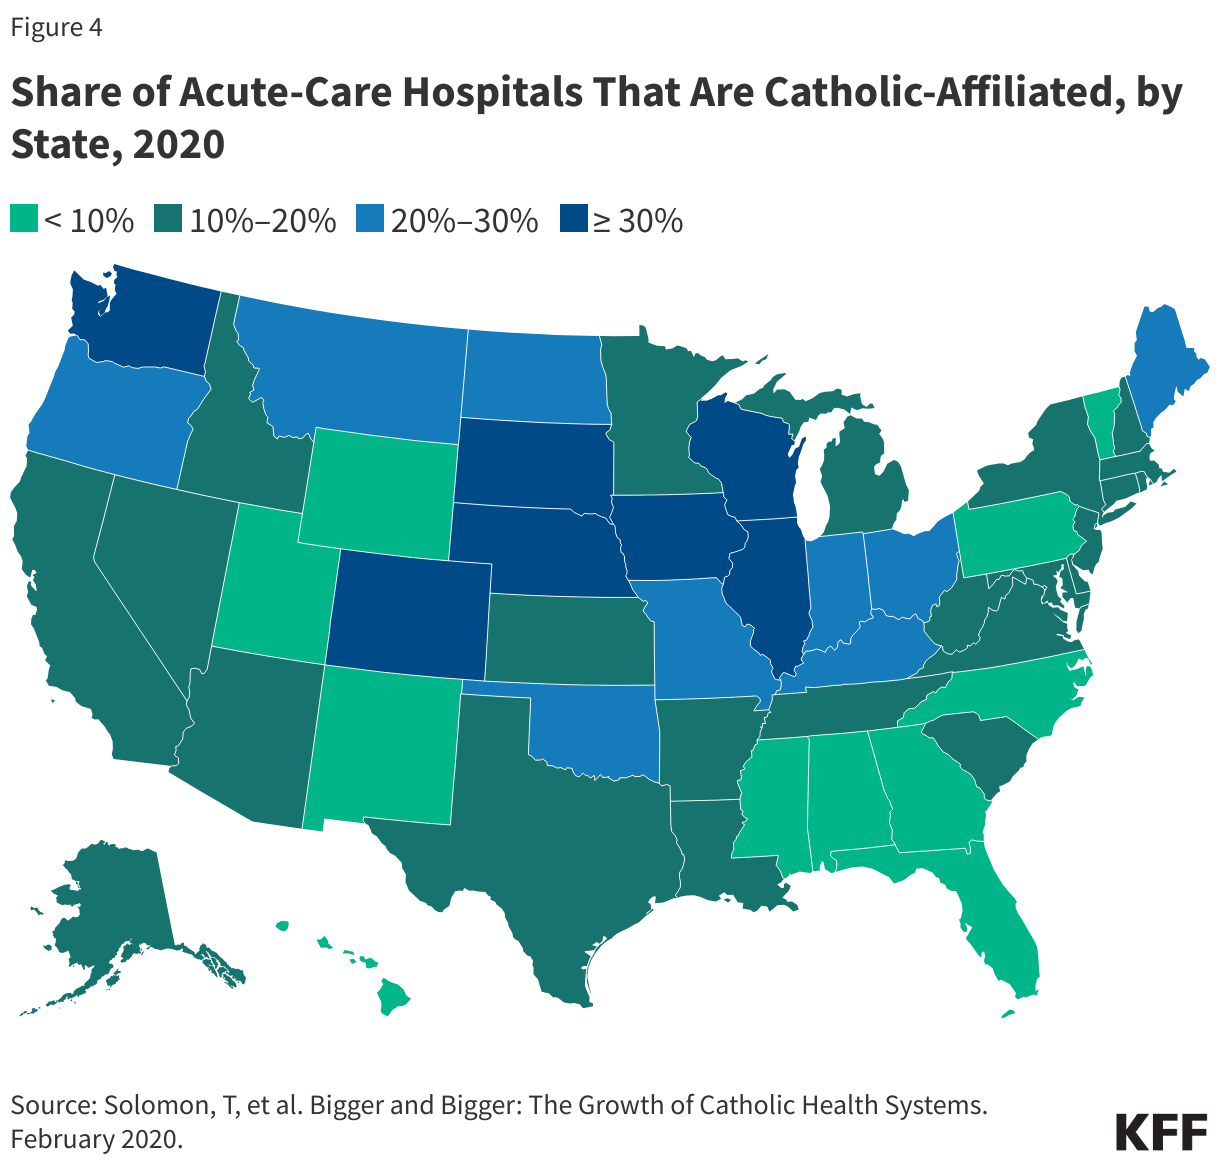
Another challenge to the availability of sterilization services is the growing number of acute care hospitals that are affiliated with the Catholic Church. These hospitals usually adhere to the religious restrictions required by the U.S. Conference of Catholic Bishops, which prohibit the use of sterilization. These directives also prohibit referrals for contraception, abortion, and sterilization services. As of 2020, 7 of the 25 largest health systems nationwide are Catholic-affiliated. There is concern that the growing dominance of Catholic hospitals in some areas may limit access to tubal ligations and post-delivery sterilization procedures. The lack of a postpartum sterilization option could pose a particular challenge for women in communities where the only hospital available to them is part of a Catholic health system (Figure 4). Catholic-affiliated hospitals receive a share of their revenue from public sources, such as Medicaid and Medicare, and serve diverse populations who may not be aware of the limits placed on their care, nor follow the hospital’s religious tenets.

Share of Acute-Care Hospitals That Are Catholic-Affiliated, by State, 2020

Impact of the Dobbs Ruling

The reproductive health landscape in the United States has drastically changed since the Supreme Court’s decision to overturn Roe v. Wade in Dobbs v. Jackson Women’s Health Organization in 2022 and contraceptive choices have also changed in response to the ruling. A KFF survey found that in 2023, four in ten (43%) OBGYNs reported an increase in the number of patients who sought sterilization since Dobbs. A little over half (51%) of OBGYNs in states with abortion bans or restrictions reported the same, compared to 36% of OBGYNs in states where abortion is legal. Research suggests that the demographics of individuals seeking sterilization may have changed since the Dobbs decision, though it is important to note that the research is limited, and long-term trends continue to be studied. Although sterilization is most common in individuals over 35 years old, a limited number of studies found that the number of sterilization procedures performed on adults under 35 years old increased post-Dobbs. In addition to being younger, similar research has found that a higher share of men who underwent vasectomies or sought consultations since Dobbs are childless and single.

How Much is Health Spending Expected to Grow?

Published: Aug 5, 2025

This updated chart collection explores how health spending is expected to grow in coming years, based on National Health Expenditure (NHE) projections from federal actuaries.

Health spending is projected to reach $5.6 trillion in 2025, with hospitals making up the largest share of spending ($1.8 trillion). By 2033, health spending is expected to hit $8.6 trillion.

These projections do not account for recent regulatory changes under the Trump Administration, nor do they account for recent legislative changes in the tax and budget law (formerly “the One Big, Beautiful Bill Act”), which the Congressional Budget Office (CBO) expects to decrease spending on Medicaid and the Affordable Care Act (ACA) Marketplaces by over a trillion dollars through 2034.

The analysis can be found on the Peterson-KFF Health System Tracker, an information hub dedicated to monitoring and assessing the performance of the U.S. health system.

A Closer Look at the $50 Billion Rural Health Fund in the New Reconciliation Law

Published: Aug 4, 2025

Editorial Note: Originally published on July 16, this brief is being updated regularly as new information becomes available.

On July 4, 2025, President Trump signed a budget reconciliation bill into law that includes significant reductions in federal health care spending, large tax cuts, and other changes. The new law will reduce federal Medicaid spending alone by $911 billion over ten years and lead to 10 million more people becoming uninsured by 2034 based on Congressional Budget Office (CBO) estimates. While this legislation was being debated, Members of Congress from both parties raised concerns about the potential impact on rural hospitals, particularly given the ongoing trend of rural hospital closures. In response, and just prior to passage, the Senate added $50 billion in funding for a new “rural health transformation program,” referred to here as the “rural health fund.”

This brief describes the rural health fund, explains what the law says about the allocation of funds, and highlights outstanding questions about how the funds will be distributed across and within states to pay rural hospitals and for other purposes. Based on the statutory language, it is not yet clear what specific criteria the Centers for Medicare and Medicaid Services (CMS) will ultimately use to approve or deny state applications and distribute funds across states; what share of the $50 billion fund will go to rural areas; what share will go to the nearly 1,800 hospitals in rural areas or be used for other providers or purposes; whether funds will be targeted to certain types of rural hospitals, such as the 44% of rural hospitals with negative margins; and to what extent the CMS Administrator will be able to influence how states use their funds prior to approving an application. Further, the law does not require CMS to publish information about the distribution of funds so that the allocation decisions are transparent. Similar questions were raised during the COVID-19 pandemic about how well provider relief funds were targeted to hospitals with the greatest need.

The rural health fund includes $50 billion, which is a little over one third (37%) of the estimated loss of federal Medicaid funding in rural areas

The fund provides $50 billion for state grants (DC and the U.S. territories cannot apply). Half ($25 billion) will be distributed by CMS “equally among all states with an approved application,” which appears to suggest that each state with an approved application would receive the same amount from this pool regardless of the size of its rural population, the number of rural hospitals or other providers in the state, the financial standing of its rural hospitals, or other factors. For example, Connecticut (which has 3 rural hospitals based on one definition) could receive the same amount as Kansas (which has 90 rural hospitals) if both are approved for funding. CMS will have some discretion in determining how to allocate the remaining half ($25 billion) (see Figure 1 and more details below).

The Rural Health Fund Includes $50 Billion, With Half Distributed Equally Among States With Approved Applications and Half Distributed Based on an Approach Determined by CMS Within Broad Requirements

States can apply to use the funds in a variety of ways, such as for promoting care interventions, paying for health care services, expanding the rural health workforce, and providing technical assistance with system transformation.

The $50 billion in new funding could offset a little over a third (37%) of the estimated cuts to federal Medicaid spending in rural areas ($137 billion over ten years) based on KFF analysis of CBO’s estimates, or about 5% of the total estimated cuts to federal Medicaid spending ($911 billion over ten years). This does not account for other revenue losses related to the bill, including cuts to federal spending for the ACA Marketplaces, or the revenue losses stemming from the increased number of people who will be uninsured because of the expiration of the enhanced ACA premium tax credits and the implementation of final Marketplace integrity rules. The impact of these changes on rural areas, and the extent to which the rural health fund offsets losses, will vary across the country.

The rural health fund will be temporary, while many of the cuts in health spending are not time limited

While many of the major cuts related to Medicaid and the ACA Marketplaces under the law are not time limited, the rural health fund is temporary. The law provides $10 billion per year through the rural health fund for fiscal years 2026 through 2030, a five-year period. According to statements made by the CMS Administrator, CMS will distribute applications to states in early September 2025, states will submit applications to CMS in that month, and CMS will process their applications in November and send out the first batch of funds at the end of the year. States will be allowed to spend funds that they receive at a given point through the end of the following fiscal year, and CMS may be able to redistribute some unused funds over time, but all funds must be spent before October 1, 2032. New legislation would be required to provide additional support to rural areas after the funds dry up.

The distribution of dollars from the rural health fund will occur before many of the health care spending cuts under the law are fully realized. The rural health fund was put in place, and doubled in size, to address concerns of lawmakers from rural states, and front loading these dollars could allow systems to absorb forthcoming cuts. As described above, the law specifies that rural health fund dollars will first be available for fiscal year 2026, with $10 billion dollars available per year over five years through fiscal year 2030, and all funds must be spent before October 1, 2032. Yet most of the health care spending reductions are backloaded and occur after fiscal year 2030. For example, based on KFF’s analysis of CBO estimates, nearly two thirds (64%) of the ten-year reductions in federal Medicaid spending would occur after fiscal year 2030.

CMS will have broad leeway in how it distributes funds across states

The law grants CMS broad discretion over the distribution of funds and confirms that these decisions are not subject to administrative or judicial review. The law gives CMS authority to determine which state applications to approve or deny, without specifying the criteria CMS should use to make these decisions, though it does specify certain items that states must include in their applications.

As noted above, half of the funds ($25 billion) will be distributed equally among states with approved applications. For the second half of the funds ($25 billion), CMS has more flexibility. The law requires that CMS considers certain factors when distributing these funds (the share of the state population that lives in a rural part of a metropolitan area, the share of rural health facilities in the state as a share of all rural health facilities nationwide, and the situation of hospitals that serve a disproportionate number of low-income patients with special needs). It also allows the CMS Administrator to consider “any other factors that [it] determines appropriate.”  CMS could choose to restrict this $25 billion pool of funds to a subset of states, though the law specifies that it must distribute these funds to at least a quarter of states with approved applications.

States will have discretion in how they distribute funds among hospitals, and other providers, and may be able to steer some dollars to nonrural areas, subject to CMS approval

Just as the law grants CMS broad discretion over the distribution of funds across states, it also permits states to use the funds for a wide variety of purposes, subject to CMS approval. States must use the funds for at least three of the following purposes:

  • Promoting evidence-based, measurable interventions to improve prevention and chronic disease management.
  • Providing payments to health care providers for the provision of health care items or services, as specified by the CMS Administrator.
  • Promoting consumer-facing, technology-driven solutions for the prevention and management of chronic diseases.
  • Providing training and technical assistance for the development and adoption of technology-enabled solutions that improve care delivery in rural hospitals, including remote monitoring, robotics, artificial intelligence, and other advanced technologies.
  • Recruiting and retaining clinical workforce talent to rural areas, with commitments to serve rural communities for a minimum of 5 years.
  • Providing technical assistance, software, and hardware for significant information technology advances designed to improve efficiency, enhance cybersecurity capability development, and improve patient health outcomes.
  • Assisting rural communities to right size their health care delivery systems by identifying needed preventative, ambulatory, pre-hospital, emergency, acute inpatient care, outpatient care, and post-acute care service lines.
  • Supporting access to opioid use disorder treatment services, other substance use disorder treatment services, and mental health services.
  • Developing projects that support innovative models of care that include value-based care arrangements and  alternative payment models, as appropriate.
  • Additional uses designed to promote sustainable access to high quality rural health care services, as determined by the CMS Administrator.

Within the contours of this list, states could restrict the funds to rural hospitals or specific types of rural hospitals (such as those that are isolated and in financial distress) or they could use them for additional or different purposes, such as paying nursing facilities or recruiting clinical workers to rural areas.

While the fund is described as a “rural” program, the law appears to give states some ability to direct some of the dollars to urban and suburban areas, pending CMS approval. For example, most of the permitted uses in the list above do not specify that the funds would need to go to rural areas, such as the description of payments to hospitals and other providers and of support for opioid use treatment services, other substance use disorder treatment services, and mental health services. The current CMS Administrator indicated that nonrural areas could potentially receive money from the fund. The law also does not define “rural” when describing the scope of the program, meaning that states or the administration could do so broadly.

The law does not direct CMS or states to be transparent about the allocation and use of funds

CMS is not required to publish information about how the funds are distributed—such as by posting the amount sent to each state or why certain state applications were approved or denied—though it could choose to do so. States are required to submit annual reports to CMS on the use of the allotments. CMS could require states to disclose information about the amount they receive or the use of funds to the public.

This work was supported in part by Arnold Ventures. KFF maintains full editorial control over all of its policy analysis, polling, and journalism activities.

What Role Do Immigrants Play in the Rural Workforce?

Published: Aug 4, 2025

As of 2023, there were over 47 million immigrants residing in the country, accounting for 14% of the total population, including roughly 1.8 million living in rural America. The Trump administration has undertaken a range of actions aimed at restricting immigration; increasing interior immigration enforcement efforts, including among lawfully present immigrants; and eliminating access to health coverage and care for lawfully present and undocumented immigrants. Research shows that immigrants make significant contributions to the U.S. workforce. Efforts to limit immigration may have negative ramifications for the country’s labor supply and economy, particularly in key occupations such as health care that are already experiencing worker shortages. Research further shows that health care workforce shortages are particularly stark in rural areas, which are also home to larger shares of older residents as well as residents who have worse health conditions as compared to their urban counterparts.

This data note examines the role that immigrants play in the rural workforce, particularly in industries disproportionately filled by immigrants, including health care, agriculture, construction, and service. It is based on KFF analysis of the 2023 American Community Survey 1-year Public Use Microdata Sample (see Methods for more details). It also highlights the socioeconomic and health coverage barriers that immigrant workers in rural areas face. For the purposes of this analysis, rural areas (non-metropolitan) are defined as counties or a group of counties that have a population of at least 10,000 but less than 50,000.

This analysis shows that although immigrants account for a small share of the rural adult population (5%) and rural adult workforce (5%), they play an outsized role in certain occupations in rural areas, including as physicians and surgeons (14%), agriculture workers (28%), and construction workers (10%). Despite having similar rates of employment as their citizen counterparts, noncitizen immigrant workers in rural areas are somewhat more likely to have lower incomes (annual incomes below $20,000) (22% vs. 18% among U.S.-born workers) and to be uninsured (40% vs. 8% among U.S.-born workers).

Immigrant adults make up 5% of the rural workforce nationwide, with the share varying from 1% to 17% across states.

Overall, immigrants account for 5% of rural adults and the rural adult workforce. However, their share of the rural workforce ranges from 1% to 17% across the 40 states with sufficient data to examine immigrant workers in rural areas. In nine states (HI, FL, CT, DE, NM, AK, WA, TX, and CA), immigrants account for at least one in ten or more of rural adult workers, including 17% in Hawaii, 15% in Florida, and 14% in Connecticut, reflecting these states generally having higher shares of immigrant adults residing in rural areas and immigrants overall.

Immigrants Account for 5% of the Rural Workforce, With the Share Varying from 1% to 17% Across States

Immigrant adults make up nearly three times the share of physicians and surgeons in rural America than their share of the overall rural workforce (14% vs. 5%).

Immigrant adults account for similar shares of the total rural workforce (5%) and the total rural health care workforce (3%) but make up nearly three times (14%) the share of physicians and surgeons in rural America (Figure 2). These physicians and surgeons include one in ten naturalized citizens and 4% noncitizen immigrants. In addition, immigrant adults account for 6% of nursing assistants, 3% of nurses, 2% of therapists, 1% of physician assistants, and 4% of other clinical workers in rural America.

Immigrants Make Up Nearly Three Times the Share of Physicians and Surgeons in Rural America Than Their Share of the Total Workforce

Immigrant adults also play an outsized role in the agriculture, construction, and service workforces in rural America.

In addition to their role as physicians and surgeons, immigrant adults make up significantly higher shares of the agriculture, construction, and service (including restaurant and cleaning) workforces in rural America compared to their share of the total rural workforce (Figure 3). These patterns are similar to the outsized role immigrant adults play in these workforces nationwide. In rural areas, immigrant adults account for nearly three in ten (28%) agricultural workers, including nearly a quarter (24%) who are noncitizen immigrants. Immigrant adults also make up about one in ten construction (10%) and service (9%) workers in rural America, again driven by larger shares of noncitizen immigrants who account for these workers.

Immigrant Adults Play an Outsized Role in the Agriculture, Construction, and Service Workforces in Rural America

More than one in five noncitizen immigrant workers in rural America earn less than $20,000 a year.

Despite their workforce contributions, noncitizen immigrant workers in rural America are somewhat more likely than their citizen counterparts to earn less than $20,000 a year (Figure 4). More than one in five (22%) of noncitizen immigrant workers earn less than $20,000 a year compared to 18% of U.S.-born citizen and 16% of naturalized citizen workers in rural America. In contrast, about one in six (17%) U.S.-born and one in five (21%) naturalized citizen workers in rural America report earning $80,000 or more per year compared to one in ten noncitizen immigrant workers. This pattern likely reflects noncitizen immigrants’ disproportionate employment in lower-wage jobs such as agriculture, construction, food services, and cleaning services.

Noncitizen Immigrant Workers in Rural America are More Likely to Have Lower Incomes Than Their Citizen Counterparts

Four in ten noncitizen immigrant workers in rural America are uninsured.

Roughly six in ten of naturalized citizen (60%) and U.S.-born citizen (57%) adults, as well as two in three noncitizen immigrant adults (66%) 18 years and older in rural America are employed. However, noncitizen immigrant workers in rural America are roughly four times more likely to lack health insurance coverage (40%) than their naturalized citizen (11%) and U.S.-born citizen (8%) counterparts (Figure 5). Roughly three in four U.S.-born (74%) and naturalized citizen (72%) workers have private coverage compared to half (51%) of noncitizen immigrant workers. U.S.-born and naturalized citizen (18%) workers also are twice as likely to be covered by Medicaid compared to noncitizen immigrant workers (9%). These patterns reflect noncitizen immigrants’ disproportionate employment in jobs that are less likely to offer employer-sponsored health coverage as well as their limited access to federally funded health coverage. Provisions in the recently passed tax and spending law will further limit access to health coverage for noncitizen immigrants, which could further increase their uninsured rates and result in workforce productivity losses as well as an exacerbation of worker shortages in rural areas.

Four in Ten Noncitizen Immigrant Workers Lack Health Insurance Coverage in Rural America

Methods

Data: These findings are based on KFF analysis of the 2023 American Community Survey 1-year Public Use Microdata Sample (ACS PUMS). The ACS PUMS includes a 1% sample of the U.S. population.

Classification of Rural and Urban Areas: A Public Use Microdata Area (PUMA)-to-county crosswalk was conducted in the 2023 ACS PUMS file after which counties were classified as one of the following: rural (remote) – a non-metro area not adjacent to any large or small metro area; rural (other) – a non-metro area adjacent to a large or small metro area; and urban – a large or small metro area. For the purposes of this analysis, rural (remote) and rural (other) were combined into a single rural category. Non-metro areas are defined as a county or group of counties with a population of at least 10,000 but less than 50,000 people; metro areas are defined as a county or group of counties with a population of 50,000 or more people. For more details on the definition of rural and urban areas, please refer to this Methods section.

Identification of Immigrants: Immigrants are identified as those who report their citizenship status in ACS as a “U.S. citizen by naturalization” or as “not a citizen of the U.S.”. The former are referred to as “naturalized citizens” and the latter as “noncitizen immigrants” in this analysis.

Identification of Health Care Workers: Health care workers are identified as those who have an occupational code (OCCP) in ACS between 3000 and 3655. This group is further broken out into physicians and surgeons (3090, 3100); nurses (3255, 3256, 3258, or 3500); nursing assistants (3603); physician assistants (3110); therapists (3150, 3160, 3200, 3210, 3220, 3230, or 3245); and other clinical workers (all other occupation codes between 3000 and 3655).

Identification of Agricultural Workers: Agricultural workers are identified as those who have an occupational code (OCCP) in ACS of 6005, 6010, 6040, or 6050.

Identification of Construction Workers: Construction workers are identified as those who have an occupational code (OCCP) in ACS between 6200 and 6765.

Identification of Service Workers: Service workers are identified as those who have an occupational code (OCCP) in ACS between 4000 and 4255.

Implementation Dates for 2025 Budget Reconciliation Law

On July 4, President Trump signed the budget reconciliation bill, previously known as “One Big Beautiful Bill Act,” into law. The bill includes significant health care policy changes. This timeline provides a brief overview of the specific provisions and their effective dates. You can view all health provisions in the order they are implemented or can filter them by the following categories: Medicaid, Medicare, Affordable Care Act and Health Savings Accounts. You can read a detailed summary of the health provisions of the law.

Implementation Dates for Health Provisions in the 2025 Republican Tax and Spending Cut Legislation

Senate Committee on Appropriations Approves FY 2026 Labor, Health and Human Services, Education, and Related Agencies (Labor HHS) Appropriations Bill & Accompanying Report

Published: Aug 4, 2025

The Senate Committee on Appropriations approved its FY 2026 Labor, Health and Human Services, Education, and Related Agencies (Labor HHS) appropriations bill, accompanying report, and amendments on July 31, 2025.

While most U.S. global health funding is provided to the State Department through a separate appropriations bill, the Labor HHS appropriations bill includes funding for global health programs at the Centers for Disease Control and Prevention (CDC) as well as funding for global health research activities at the National Institutes of Health (NIH). Total global health funding at CDC and NIH through the Labor HHS bill is not yet known, as funding for some programs (i.e. global HIV/AIDS and malaria research) at NIH is determined at the agency level rather than specified by Congress in annual appropriations bills. Funding for global health programs at CDC totals $693 million in the bill and funding for global health research activities at the Fogarty International Center (FIC) at NIH totals $95 million; these are the same levels as the FY 2025 enacted amounts.[i],[ii]

See the table below for additional details on global health funding (downloadable table here). See other budget summaries and the KFF budget tracker for details on historical annual appropriations for global health programs.

KFF Analysis of Global Health Funding in the FY 2026 Senate Labor, Health and Human Services, Education, and Related Agencies (Labor HHS) Appropriations Bill

[i] Funding for FY25 was provided in a full-year Continuing Resolution (CR), which maintained FY24 levels. All FY25 amounts and associated notes are based on those specified in relevant FY24 appropriations bills.

[ii] The FY26 Request eliminates CDC’s Global Health Center and most of its bilateral programs, except funding for “Global Disease Detection & Emergency Response”, which is transferred to “Crosscutting Activities and Program Support”, and “Parasitic Diseases and Malaria”, which is transferred to “Emerging and Zoonotic Infectious Diseases”.

Medicaid Waiver Tracker: Approved and Pending Section 1115 Waivers by State

Published: Aug 1, 2025

Tracker

Section 1115 Medicaid demonstration waivers offer states an avenue to test new approaches in Medicaid that differ from what is required by federal statute, if [in the HHS Secretary’s view] the approach is likely to “promote the objectives of the Medicaid program.” They can provide states additional flexibility in how they operate their programs, beyond the considerable flexibility that is available under current law. Waivers generally reflect priorities identified by states as well as changing priorities from one presidential administration to another. Nearly all states have at least one active Section 1115 waiver and some states have multiple 1115 waivers. See the “Key Themes Maps” tab for a discussion of recent waiver trends.

This page tracks approved and pending Section 1115 waiver provisions (including expansions and restrictions) related to eligibility, benefits, and social determinants of health and other delivery system reforms, once such waivers are posted to the state waivers list on Medicaid.gov. For more information on inclusion criteria and on each provision, as well as a list of acronyms, see the Definitions tab.

Medicaid Watch

Policy research, polling and news about the Medicaid financing debate.

Landscape of Approved and Pending Section 1115 Waivers


Waivers with Eligibility Changes

(back to top)

Section 1115 Eligibility Changes - Expanded Eligibility Groups

Waivers with Benefit Changes

(back to top)

Section 1115 Benefit Changes - Expansions

Waivers with SDOH & Other DSR Changes

(back to top)

Section 1115 SDOH Provisions

All Approved Waivers by Topic

(back to top)

Approved Section 1115 Medicaid Waivers

All Pending Waivers by Topic

(back to top)

Pending Section 1115 Medicaid Waivers

Work Requirements

The 2025 budget reconciliation legislation, signed into law on July 4, requires states to condition Medicaid eligibility for adults in the ACA Medicaid expansion group on meeting work requirements starting January 1, 2027, with the option for states to implement requirements sooner.

Prior to the passage of the federal reconciliation legislation and since January 2025, some states have shown renewed interest in pursuing work requirement policies through 1115 waivers. The first Trump administration encouraged and approved 1115 demonstration waivers that conditioned Medicaid coverage on meeting work requirements which were subsequently rescinded by the Biden administration or withdrawn by states. Currently, Georgia is the only state with a Medicaid work requirement waiver in place following litigation over the Biden administration’s attempt to stop it. Pending work requirement waivers may need to be altered to conform with the budget reconciliation legislation framework.

The map below identifies approved (Georgia) and pending work requirement waivers (submitted to CMS since January 2025) as well as states with proposals that have been released at the state-level for “public comment.” The table below the map provides more detailed state waiver information and a summary of recent state legislative activity involving work requirements.

For more information on Medicaid work requirements, see additional KFF resources:

  • An overview of the work requirement provisions in the 2025 budget reconciliation legislation, including key operational & implementation questions (2025)
  • Analyses of the work status and characteristics of Medicaid enrollees (2025)
  • A short brief highlighting five key facts about Medicaid work requirements, including what the research shows about the impact of work requirements (2025)
  • A detailed history of Medicaid work requirements (2022)
Section 1115 Approved and Pending Work Requirement Waivers

The table below provides more detailed state waiver information for waivers that are approved and pending at the federal level, as well as activity at the state-level once a waiver proposal has been released for state-level “public comment.” This table also lists states with legislative activity involving work requirements, once a bill has passed out of committee (typically the first step of the legislative process). Some states require state legislative action before Section 1115 waiver requests can be submitted by the state Medicaid agency to CMS for federal approval and others do not.

Key States with Work Requirement Waiver Activity

Key Themes Maps

Section 1115 waivers generally reflect priorities identified by states as well as changing priorities from one presidential administration to another.  Key Biden administration 1115 initiatives included waivers addressing enrollee health-related social needs (HRSN), pre-release coverage for individuals who are incarcerated, and multi-year continuous eligibility for children.

In March 2025, the Trump administration rescinded HRSN guidance issued by the Biden administration. CMS indicates this does not nullify existing HRSN 1115 approvals but going forward they will consider HRSN / SDOH requests on a case-by-case basis. In April 2025, the Trump administration announced it would be phasing out federal funding for “Designated State Health Programs” (DSHP) in waivers. In July 2025, the Trump administration released guidance indicating it will not approve (new) or extend (existing) continuous eligibility waivers for children or adults. CMS also announced in July it would be phasing out initiatives to strengthen the Medicaid workforce for primary care, behavioral health, dental, and home and community based services (not depicted in maps below).

This page tracks pending and approved waivers in key areas of recent state activity and will track Trump administration action in these areas going forward. Hover over individual states to display waiver expiration dates.

Social Determinants of Health

Social determinants of health (SDOH) are the conditions in which people are born, grow, live, work and age. SDOH include but are not limited to housing, food, education, employment, healthy behaviors, transportation, and personal safety. In 2022, CMS (under the Biden administration) announced a demonstration waiver opportunity to expand the tools available to states to address enrollee “health-related social needs” (or “HRSN”) including housing instability, homelessness, and nutrition insecurity, building on CMS’s 2021 guidance. In 2023, CMS issued a detailed Medicaid and CHIP HRSN Framework accompanied by an Informational Bulletin, which were updated in 2024.

In March 2025, the Trump administration rescinded the Biden administration HRSN guidance. CMS indicates this does not nullify existing HRSN approvals but going forward they will consider HRSN / SDOH requests on a case-by-case basis.

The “HRSN Waivers” map below identifies states with approval under the Biden administration HRSN framework. The “All SDOH Waivers” map identifies SDOH-related 1115 waivers more broadly, including those that pre-date or were approved outside of the HRSN framework. For more detailed waiver information, refer to KFF’s Medicaid Waiver Tracker (“SDOH” table) and HRSN waiver watch  (March 2024).

Section 1115 Waivers: Social Determinants of Health (SDOH)

Medicaid Pre-release Coverage for Individuals Who Are Incarcerated

In April 2023, the Biden administration released guidance encouraging states to apply for a new Section 1115 demonstration opportunity to test transition-related strategies to support community reentry for people who are incarcerated. This demonstration allows states a partial waiver of the inmate exclusion policy, which prohibits Medicaid from paying for services provided during incarceration (except for inpatient services). Reentry services aim to improve care transitions and increase continuity of health coverage, reduce disruptions in care, improve health outcomes, and reduce recidivism rates. The Biden administration approved 19 state waivers to facilitate reentry for individuals who are incarcerated. The map below identifies states with approved and pending waivers to provide pre-release services to Medicaid-eligible individuals who are incarcerated.  Medicaid pre-release waivers have been pursued by both Republican and Democratic governors. For more information, refer to KFF’s Medicaid Waiver Tracker (“Eligibility Changes” table) and related pre-release waiver watch (August 2024).

Section 1115 Waivers: Medicaid Pre-release Coverage for Individuals Who Are Incarcerated

Multi-year Continuous Eligibility for Children

The Consolidated Appropriations Act, 2023 required all states to implement 12-month continuous eligibility for children beginning on January 1, 2024. The Biden administration approved 9 waivers that allow states to provide multi-year continuous eligibility for children (e.g., from birth to age six). Continuous eligibility has been shown to reduce Medicaid disenrollment and “churn” rates (rates of individuals temporarily losing Medicaid coverage and then re-enrolling within a short period of time).

In July 2025, the Trump administration released guidance indicating it will not approve (new) or extend (existing) continuous eligibility waivers for children or adults. The map below displays states with waiver approval to provide multi-year continuous eligibility for children.  For more information, refer to KFF’s Medicaid Waiver Tracker (“Eligibility Changes” table) and related continuous eligibility waiver watch (February 2024).

Section 1115 Waivers: Multi-year Continuous Eligibility for Children

Definitions

Section 1115 Waiver Tracker: Key Definitions and Notes

Related Resources

Recent Developments

General/Overview Resource

Eligibility and Enrollment Expansions

Eligibility and Enrollment Restrictions

Work Requirements:

Other:

Benefit Expansions

Benefit Restrictions, Copays, and Healthy Behaviors

Social Determinants of Health

Delivery System Reform