Distribution of CARES Act Funding Among Hospitals
The Department of Health and Human Services (HHS) has now begun distributing $72.4 billion of the $175 billion allocated for grants to health care providers in the Coronavirus Aid, Relief, and Economic Security (CARES) Act and the Paycheck Protection Program and Health Care Enhancement Act. This relief fund is designed to provide an influx of money to hospitals and other health care entities to help them respond to the coronavirus pandemic. Congress stated the money can be used either for costs related to treating COVID patients or to reimburse for lost revenue due to the pandemic. The largest share of that $72.4 billion is the $50 billion that the Department of Health and Human Services allocated to providers who participate in Medicare based on their total net patient revenue from all sources.
This brief examines the implications of the decision to allocate funding based on total net patient revenue, which is total patient revenue minus contractual allowances and discounts. The brief focuses specifically on hospitals using data that hospitals report to the Centers for Medicare & Medicaid Services as part of the Healthcare Cost Report Information System (HCRIS). Hospital revenue is mainly a factor of volume and payment rates per service or patient diagnosis. Reimbursement rates vary widely by payer. Hospitals typically command rates from private insurers that average twice Medicare rates per patient, and some are paid substantially higher rates from private insurers in highly concentrated markets. We focused our analysis on hospitals with the highest and lowest shares of revenue from private payers to inform policy decisions regarding how to allocate any remaining grants to providers as well as any potential new funding from Congress.
Findings
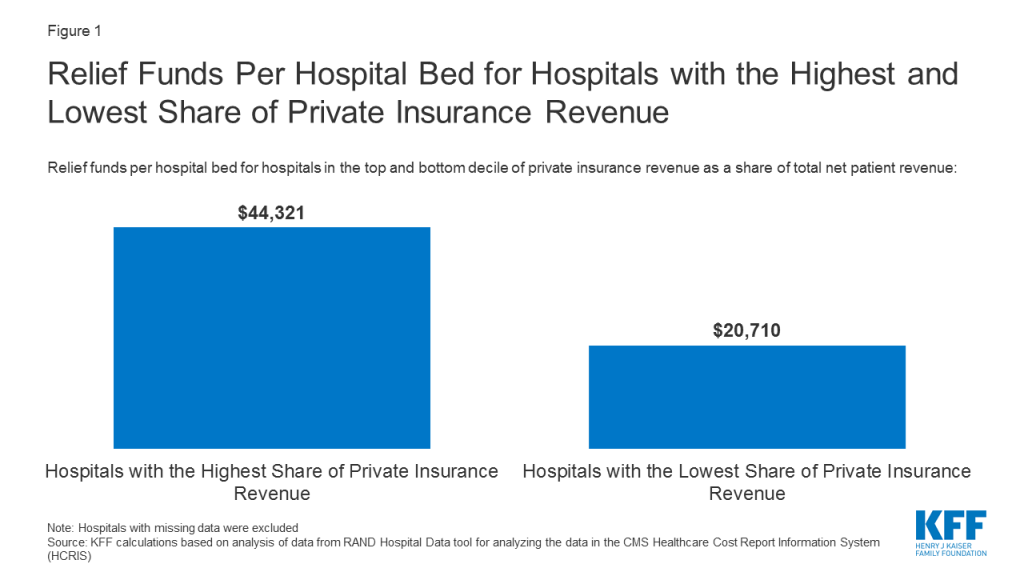
The formula used to allocate the $50 billion in funding favored hospitals with the highest share of private insurance revenue as a percent of total net patient revenue. The hospitals in the top 10% based on share of private insurance revenue received $44,321 per hospital bed, more than double the $20,710 per hospital bed for those in the bottom 10% of private insurance revenue (Figure 1).
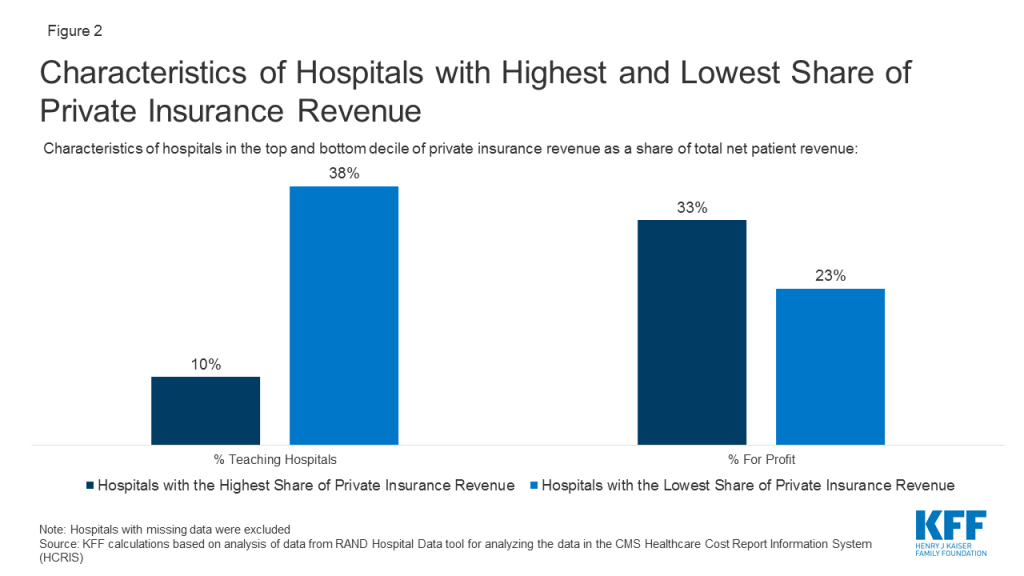
When compared to the 457 hospitals with the lowest share of private insurance revenue, the 457 hospitals with the highest share of private insurance revenue are less likely to be teaching hospitals (10% vs 38%) and more likely to be for-profit (33% vs 23%) (Figure 2). The hospitals with the highest share of private insurance revenue also had higher operating margins (4.2% vs -9.0%) and provided less uncompensated care as a share of operating expenses (7.0% vs. 9.1%). Uncompensated care includes bad debt, charity care and unreimbursed Medicaid and children’s health insurance program expenses.
Discussion
Our analysis shows that the size of the relief fund grants varies dramatically per hospital bed based on a hospital’s payor mix. Hospitals with the lowest share of private insurance revenue received less than half as much funding for each hospital bed compared to the hospitals with the greatest share of revenue from private insurance. These hospitals’ large share of private reimbursement may be due either to having more patients with private insurance or charging relatively high rates to private insurers or a combination of those two factors. All things being equal, hospitals with more market power can command higher reimbursement rates from private insurers and therefore received a larger share of the grant funds under the formula HHS used. An alternative methodology for distributing the funds based on patient volume or that increased the size of the grant for providers that are more reliant on public payors such as Medicaid would have distributed the funding more evenly and less skewed by higher revenues from private insurers.
Our analysis focused on hospitals, but all entities that receive Medicare reimbursement were eligible for the $50 billion in relief funds. Those entities include hospice providers, skilled nursing facilities and individual physicians. Importantly, providers who did not have any Medicare reimbursement in 2019 were not eligible for grants from the $50 billion allocation. Some of these providers are pediatricians and obstetricians who do not serve Medicare patients. Others are providers who specialize in serving Medicaid patients and provide crucial services such as non-emergency medical transit, substance use disorder treatment, home-and community-based services, behavioral health services and dental care. HHS has stated that Medicaid-only providers will receive a separate allocation of funding, as will skilled nursing facilities and dentists.
Our analysis shows that hospitals with the highest share of private insurance revenue received a disproportionately high share of total funds. We would expect to see similar patterns for physicians and other entities that receive private insurance reimbursement. For example, community health centers that often see a relatively small share of patients with private insurance would have received less money than a private physician’s office that sees the same total patient volume but has more patients with private insurance. With HHS expected to release additional relief fund grants and Congress considering additional stimulus, this analysis demonstrates that the formula used to distribute funding has significant consequences for how funding is allocated among providers.
Methods and Data Limitations
We used the RAND Hospital Data tool to analyze data that hospitals report to the Centers for Medicare & Medicaid Services as part of the Healthcare Cost Report Information System (HCRIS). The HCRIS data was used because it provides the most complete set of data for all hospitals. The actual payments from the relief fund are based on data hospitals are submitting from their most recent tax filings or audited annual financial statements, which are not always publicly available. The individual hospitals in some hospital systems submit separate HCRIS data but may have applied for a relief fund grant as part of a larger hospital system. In those cases, our calculations of the hospital’s total revenues and the amount received from the relief fund would be based on that individual’s hospitals data and not the data for the larger system.
We used the total net patient revenue reported by each hospital to determine the amount of the $50 billion fund that will go to each hospital, using the formula provided by HHS and using a patient revenue denominator of $2.5 Trillion dollars. To analyze revenue from patients with private insurance, we used RAND’s calculation of private insurance revenues, which are not directly reported in the HCRIS data. Private insurance revenue is calculated by starting with total net patient revenues and then subtracting revenues from traditional (fee-for-service) Medicare, Medicare Advantage, Medicaid, SCHIP and state and local and privately funded indigent care programs, and amounts paid by insured patients who qualify for a hospital’s charity care program. Our definition of private insurance revenue therefore includes patient cost sharing from those with private insurance, including balance billing. The formula that HHS used would have included those amounts as part of total net patient revenue and thus they would have been factored into the amount that each provider received.
We used 2017 data because that was the most recent year when relatively complete data was available. Data were not adjusted for inflation, and some hospitals included in the dataset may no longer be operating or may have merged.
Our analysis includes 4,564 hospitals, 3,242 of which are short-term acute care hospitals paid on the inpatient prospective payment system and 1,322 are critical access hospitals. The data excluded other hospitals, such as children’s hospitals, cancer hospitals, psychiatric hospitals, long-term care hospitals, and Veterans Health Administration facilities. Our analysis used data as reported by hospitals, with some corrections from RAND for data that falls far outside the normal range of variation.
We also assumed that the $50 billion was allocated based on total net patient revenue. In fact, that money was allocated through two separate disbursements. The first $30 billion was distributed based on Medicare fee-for-service revenue and the remaining $20 billion was allocated with the intention of having the total $50 billion be distributed based on total net patient revenue. However, it has been reported that some providers have such a high share of Medicare fee-for-service payments that, in order for the $50 billion to be allocated based on total net patient revenue, those providers would have to give back some of the $30 billion based on Medicare fee-for-service. On May 6, HHS updated its Frequently Asked Questions document to clarify that it “does not intend to recoup funds as long as a provider’s lost revenue and increased expenses exceed the amount of Provider Relief funding a provider has received.” We did not account for that lack of recoupment in our analysis.
This work was supported in part by Arnold Ventures. We value our funders. KFF maintains full editorial control over all of its policy analysis, polling, and journalism activities.