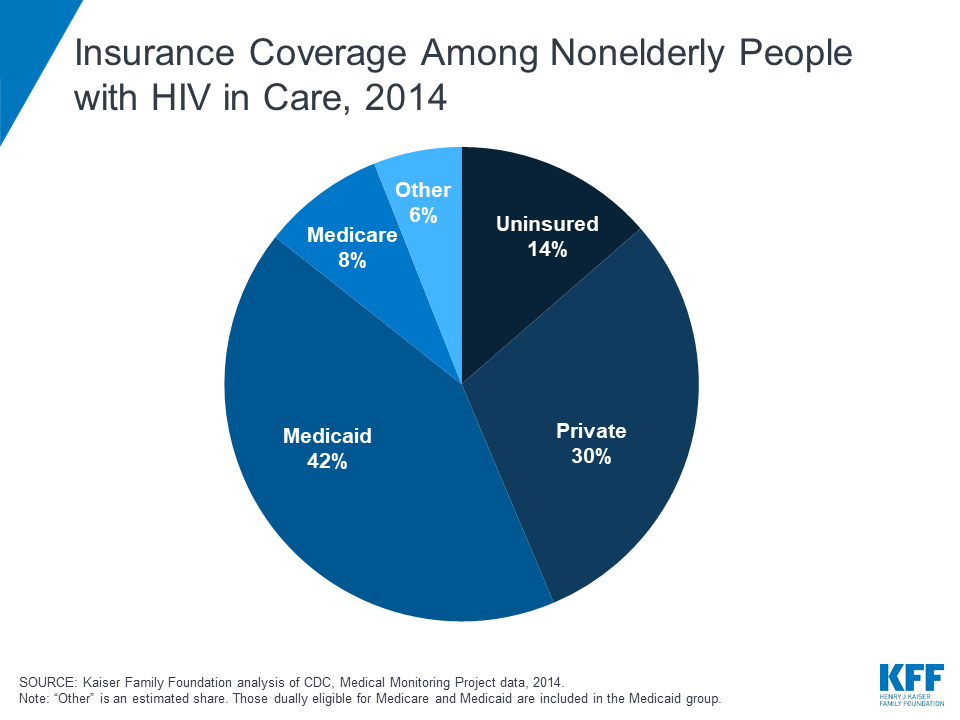
Insurance Coverage Among People with HIV in Care, 2014
The independent source for health policy research, polling, and news.
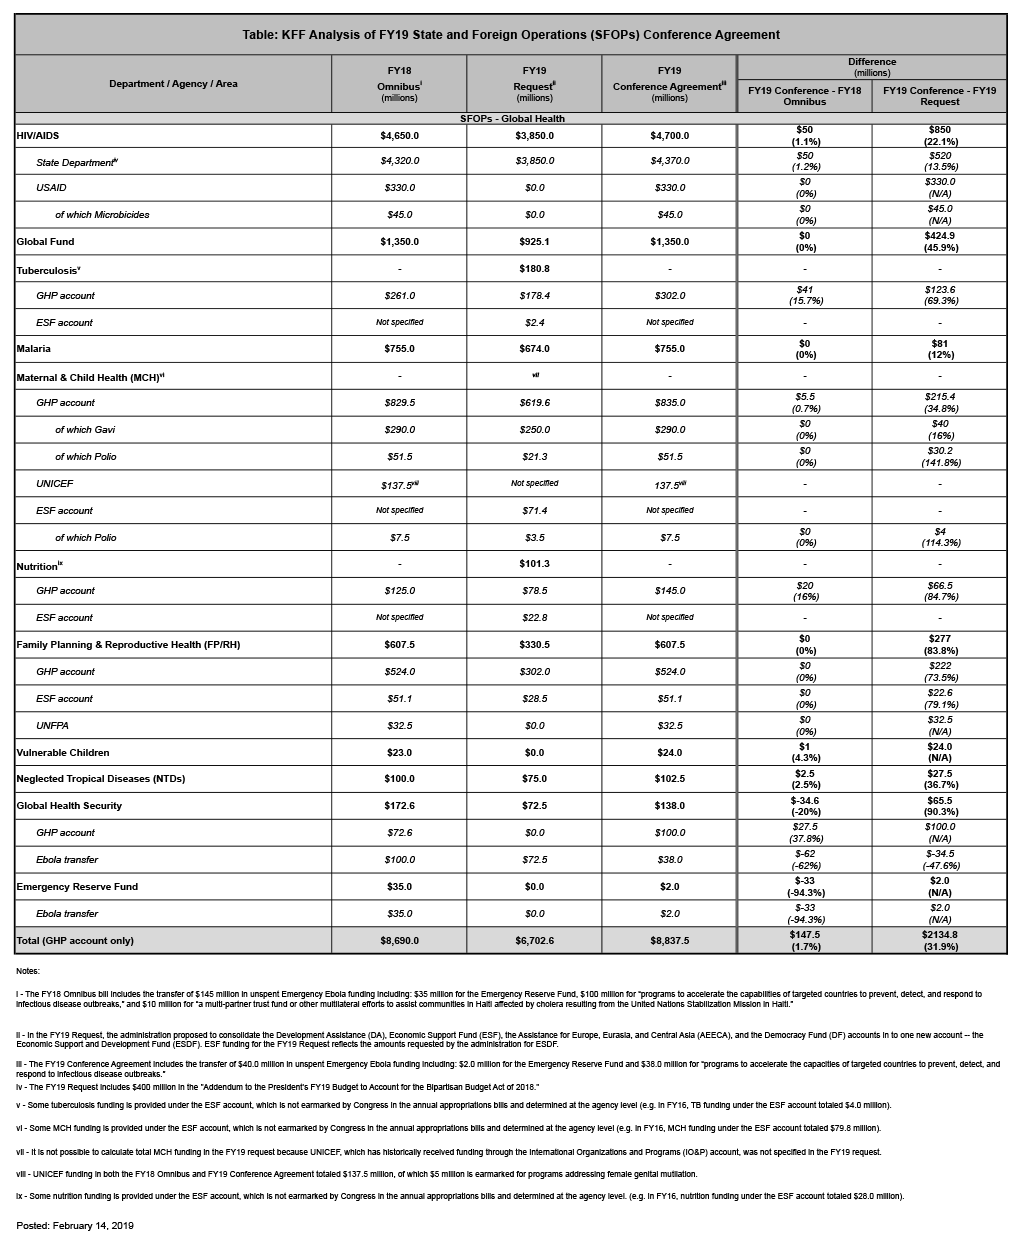
The FY19 Conference Agreement, which includes funding for State & Foreign Operations (SFOPs), was released on February 13, 2019. The SFOPs section of the bill includes funding for U.S. global health programs at the State Department and the U.S. Agency for International Development (USAID).
Key highlights are as follows (see table for additional detail):
Note: Total funding for global health is not currently available as some funding provided through USAID is not yet available.
Resources:
The table (.xls) below compares the FY19 SFOPs conference report to the FY18 funding amounts as outlined in the “Consolidated Appropriations Act, 2018” (P.L. 115-141; KFF summary here) and the FY19 funding amounts in the President’s FY19 request (KFF summary here).
ST. LOUIS, Mo. & SAN FRANCISCO, Calif. — Missouri Foundation for Health (MFH) and KFF (the Henry J. Kaiser Family Foundation) have entered into a new long-term partnership to establish a KHN (Kaiser Health News) Midwest Bureau, based in St. Louis, Missouri. KFF – the trusted source of health policy information – produces health policy analysis, polling, and journalism, and KHN is its national health and health policy newsroom, producing in-depth news coverage of health care policy and politics. An editorially independent program of KFF, KHN’s more than 50 journalists are mostly based in KFF’s Washington, D.C. offices or in California.
With support from MFH, KHN will expand its editorial staff and build a team of journalists based in St. Louis who, working with freelancers, will produce coverage throughout the region. The goal is to bring the same high-quality health and health policy journalism that KHN produces nationally to the region and to bring important stories from the Midwest Bureau to the nation. As with all its journalism, KHN stories produced from the Midwest Bureau will be made freely available for publication by media outlets throughout the region and the country and will be published on kffhealthnews.org and distributed through KHN’s social media platforms.
“This partnership continues and expands Missouri Foundation for Health’s commitment to health journalism,” said Robert Hughes, president and CEO of Missouri Foundation for Health. “This exciting new venture will provide the local health journalism Missourians need to understand and navigate the changing landscape of health, the health industry, and health politics. I’m looking forward to seeing more stories reported out of the Midwest Bureau receive the national attention they deserve.”
“We are thrilled that Missouri Foundation for Health is making it possible for us to bring KHN to the Midwest and to create a new engine for health journalism based in St. Louis,” said KFF president and CEO Drew Altman, who is also KHN’s founding publisher. “Next we hope to expand in other important regions such as the South and the Mountain states,” Altman added.
“The ongoing crisis in local journalism’s business model has left many communities with few or no trusted sources of news about a wide range of issues, including health,” said KFF vice president and executive director of Media and Technology, David Rousseau, KHN’s Publisher. “We are excited to be working with Missouri Foundation for Health to extend the KHN model of nonprofit journalism to the Midwest and are confident that both the region and the nation will benefit from this increased coverage.”
Media organizations interested in working with KHN should contact KHN at KHNPartnerships@kff.org and those interested in joining our efforts to expand and improve health journalism in the Midwest and beyond should contact KFF at healthjournalism@kff.org. Employment opportunities for the Midwest Bureau will be posted soon at https://www.kff.org/employment-opportunities/.
For more on the partners, visit Missouri Foundation for Health at www.mffh.org, Kaiser Family Foundation at www.kff.org, and Kaiser Health News at www.kffhealthnews.org.
ABOUT MISSOURI FOUNDATION FOR HEALTH
Missouri Foundation for Health is a resource for the region, working with communities and nonprofits to generate and accelerate positive changes in health. As a catalyst for change, the Foundation improves the health of Missourians through partnership, experience, knowledge, and funding. To learn more please visit mffh.org.
Medicare is the federal health insurance program created in 1965 for people ages 65 and over, regardless of income, medical history, or health status. The program was expanded in 1972 to cover certain people under age 65 who have a long-term disability. Today, Medicare plays a key role in providing health and financial security to 60 million older people and younger people with disabilities. The program helps to pay for many medical care services, including hospitalizations, physician visits, prescription drugs, preventive services, skilled nursing facility and home health care, and hospice care. In 2017, Medicare spending accounted for 15 percent of total federal spending and 20 percent of total national health spending.
Most people ages 65 and over are entitled to Medicare Part A if they or their spouse are eligible for Social Security payments, and do not have to pay a premium for Part A if they paid payroll taxes for 10 or more years. People under age 65 who receive Social Security Disability Insurance (SSDI) payments generally become eligible for Medicare after a two-year waiting period, while those diagnosed with end-stage renal disease (ESRD) and amyotrophic lateral sclerosis (ALS) become eligible for Medicare with no waiting period.
#Medicare plays a key role in providing health and financial security to 60 million older people and younger people with disabilities. It covers many basic health services, including hospital stays, physician services, and prescription drugs.
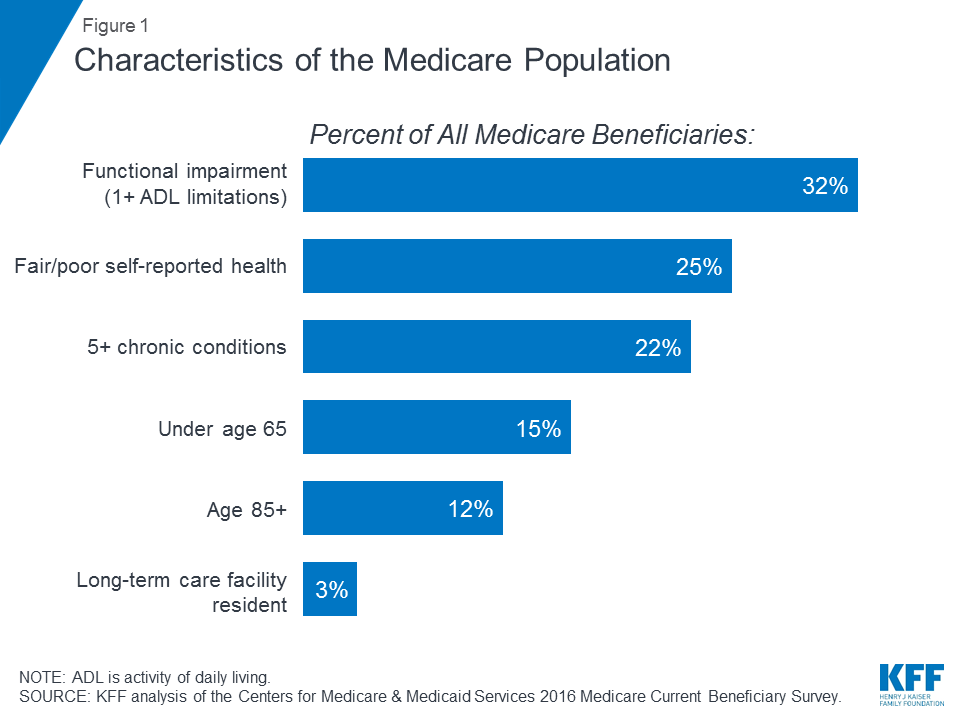
Many people on Medicare live with health problems, including multiple chronic conditions and limitations in their activities of daily living, and many beneficiaries live on modest incomes. In 2016, nearly one third (32%) had a functional impairment; one quarter (25%) reported being in fair or poor health; and more than one in five (22%) had five or more chronic conditions, (Figure 1). More than one in seven beneficiaries (15%) were under age 65 and living with a long-term disability, and 12 percent were ages 85 and over. Nearly two million beneficiaries (3%) lived in a long-term care facility. In 2016, half of all people on Medicare had incomes below $26,200 per person and savings below $74,450.
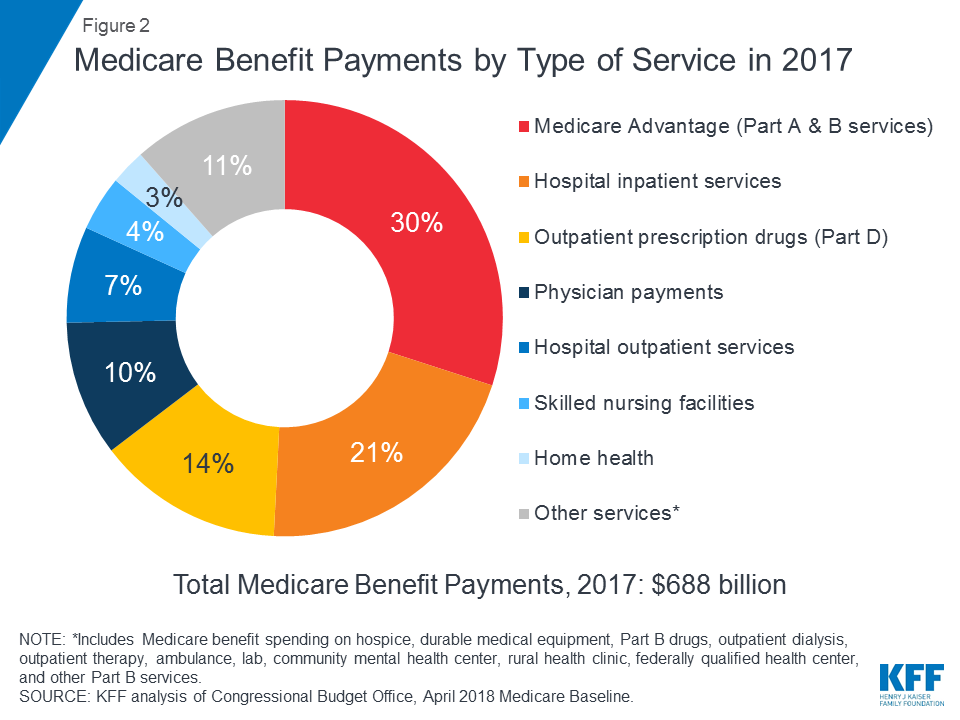
Medicare covers many health services, including inpatient and outpatient hospital care, physician services, and prescription drugs (Figure 2). Medicare benefits are organized and paid for in different ways:
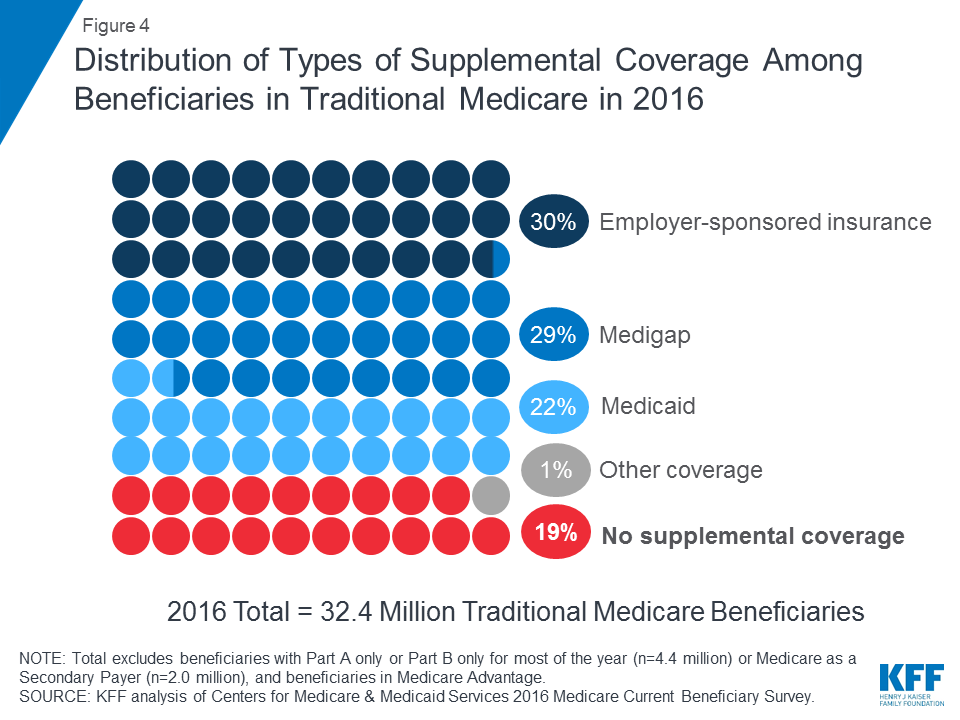
Medicare provides protection against the costs of many health care services, but traditional Medicare has relatively high deductibles and cost-sharing requirements and places no limit on beneficiaries’ out-of-pocket spending for services covered under Parts A and B. Moreover, traditional Medicare does not pay for some services that are important for older people and people with disabilities, including long-term services and supports, dental services, eyeglasses, and hearing aids. In light of Medicare’s benefit gaps, cost-sharing requirements, and lack of an annual out-of-pocket spending limit, most beneficiaries covered under traditional Medicare have some type of supplemental coverage that helps to cover beneficiaries’ costs and fill the benefit gaps (Figure 4).
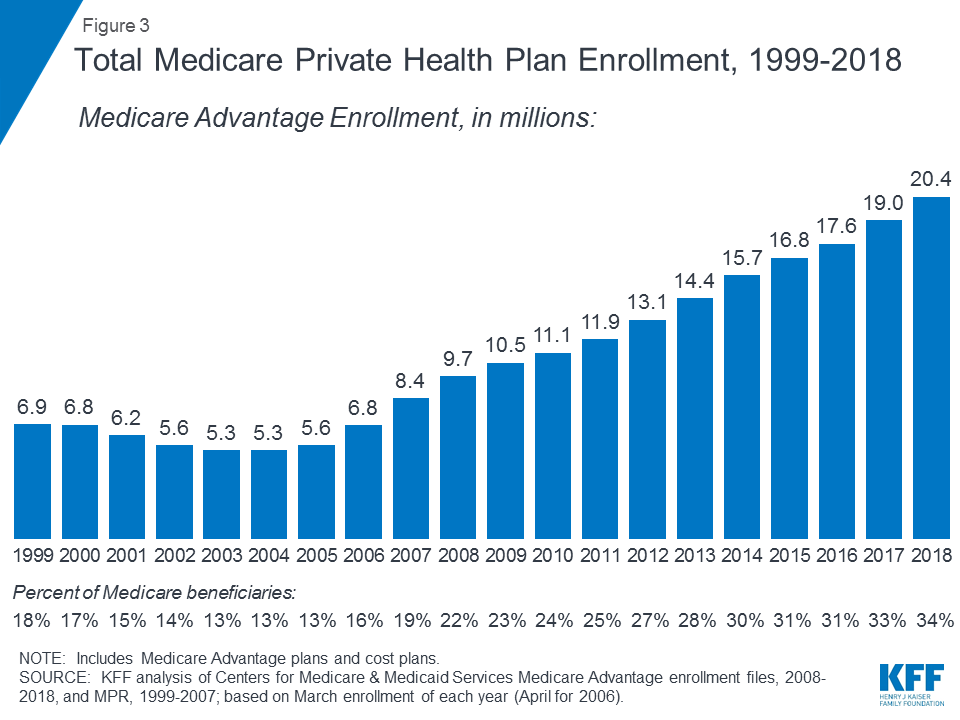
In 2018, one-third of all beneficiaries were enrolled in Medicare Advantage plans rather than traditional Medicare, some of whom also have coverage from a former employer/union or Medicaid. Medicare Advantage plans are required to limit beneficiaries’ out-of-pocket spending for in-network services covered under Medicare Parts A and B to no more than $6,700, and may also cover supplemental benefits not covered by Medicare, such as eyeglasses, dental services, and hearing aids.
In 2016, beneficiaries in traditional Medicare and enrolled in both Part A and Part B spent $5,806 out of their own pockets for health care spending, on average (Figure 5). Nearly half (45%) of beneficiaries’ average total spending was for premiums for Medicare and other types of supplemental insurance, and 55 percent was for medical and long-term care services.

Among different types of services, average per capita spending was highest for long-term care facility services, followed by medical providers and supplies, prescription drugs, and dental services. Out-of-pocket spending rises with age among beneficiaries ages 65 and over and is higher for women than men. Not surprisingly, Medicare beneficiaries with poorer self-reported health status spend more than those who rate themselves in better health.
In 2017, Medicare benefit payments totaled $688 billion; 21 percent was for hospital inpatient services, 14 percent for outpatient prescription drugs, and 10 percent for physician services; 30 percent was for payments to Medicare Advantage plans for services covered by Part A and Part B (see Figure 2).
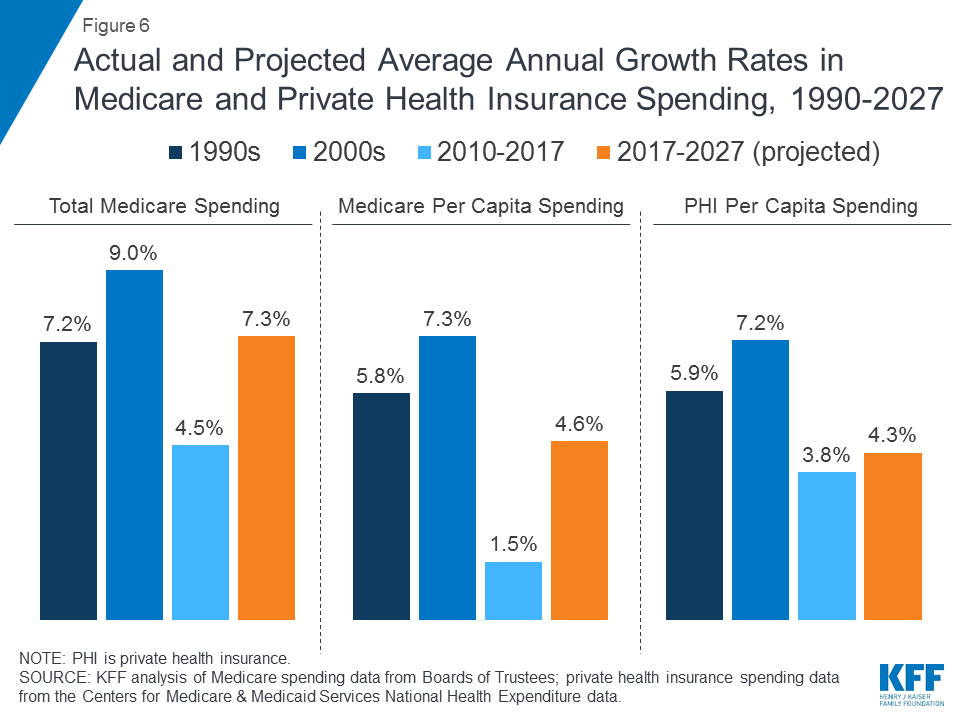
Medicare spending is affected by a number of factors, including the number of beneficiaries, how care is delivered, the use of services (including prescription drugs), and health care prices. Both in the aggregate and on a per capita basis, Medicare spending growth has slowed in recent years, but is expected to grow at a faster rate in the next decade than since 2010 (Figure 6). Looking ahead, Medicare spending (net of income from premiums and other offsetting receipts) is projected to grow from $583 billion in 2018 to $1,260 billion in 2028. The aging of the population, growth in Medicare enrollment due to the baby boom generating reaching the age of eligibility, and increases in per capita health care costs are leading to growth in overall Medicare spending.
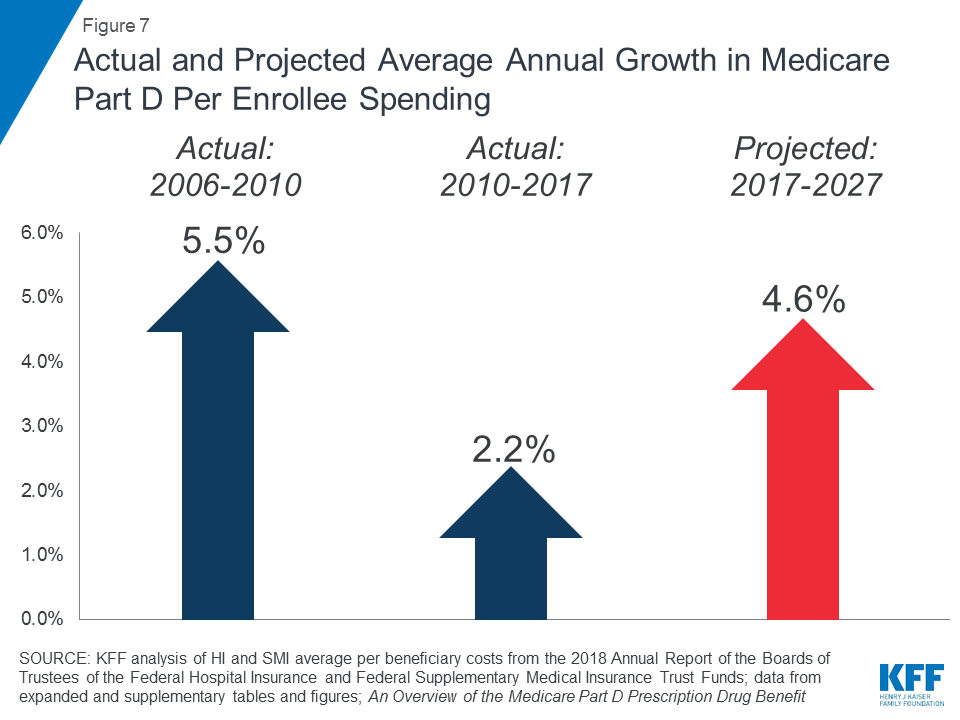
Rising prescription drug costs are a particular concern in relation to Medicare spending. The average annual growth rate in per beneficiary costs for the Part D prescription drug benefit is projected to be higher in the coming decade (4.6%) than between 2010 and 2017 (2.2%) (Figure 7). This is due in part to projected higher Part D program costs associated with expensive specialty drugs.
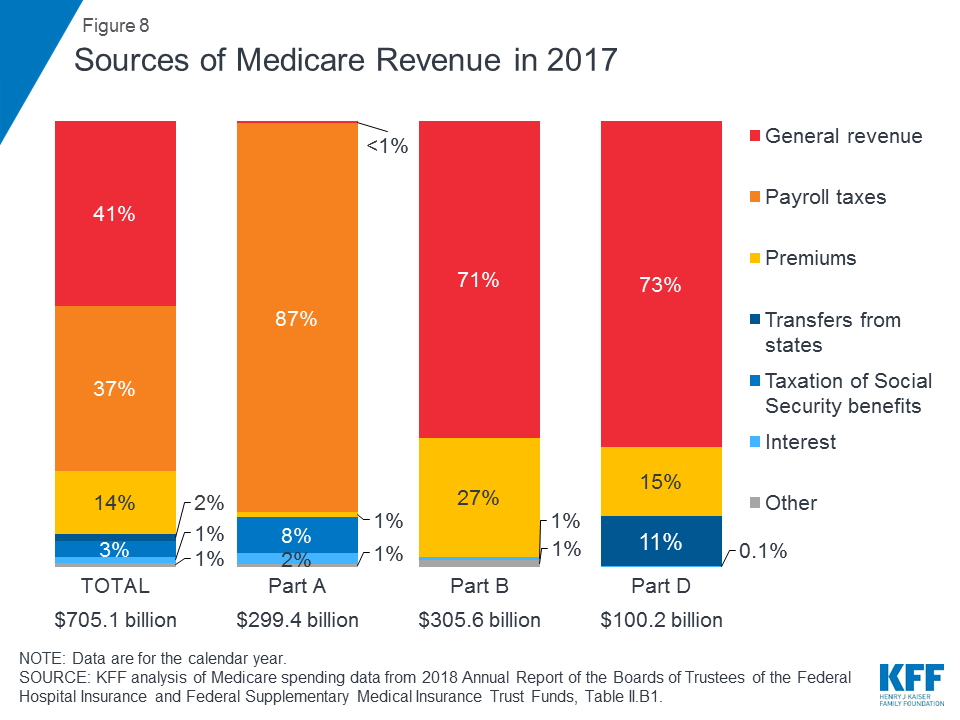
Medicare is financed by general revenues (41% in 2017), payroll tax contributions (37%), beneficiary premiums (14%), and other sources (Figure 8).
Policymakers, health care providers, insurers, and researchers continue to debate how best to introduce payment and delivery system reforms into the health care system to tackle rising costs, quality of care, and inefficient spending. Medicare has taken a lead in testing a variety of new models that include financial incentives for providers, such as doctors and hospitals, to work together to lower spending and improve care for patients in traditional Medicare. The goals of these financial incentives generally link a portion of Medicare’s payments for services to “value” as determined by providers’ performance on spending and quality targets.
Accountable Care Organizations (ACOs) are one example of a delivery system reform model currently being tested within Medicare. With over 10 million assigned beneficiaries in 2018, ACO models allow groups of providers to accept responsibility for the overall care of Medicare beneficiaries and share in financial savings or losses depending on their performance in meeting spending and care quality targets. Other new models include medical homes, bundled payments (models that combine Medicare payments to multiple providers across a single episode rather than pay for each service separately), and initiatives aimed to reduce hospital readmissions.
Many of these Medicare payment models are managed through the Center for Medicare and Medicaid Innovation (CMMI), which was created by the Affordable Care Act (ACA). These models are being evaluated to determine their effect on Medicare spending and the quality of care provided to beneficiaries. The Secretary of Health and Human Services (HHS) is authorized to expand or extend models that demonstrate quality improvement without an increase in spending, or spending reduction without a decline in quality.
Medicare faces a number of critical issues and challenges, perhaps none greater than providing affordable, quality care to an aging population while keeping the program financially secure for future generations. While Medicare spending is on a slower upward trajectory now than in past decades, total and per capita annual growth rates appear to be edging away from their historically low levels of the past few years. Medicare prescription drug spending is also a growing concern, with the Medicare Trustees projecting a comparatively higher per capita growth rate for Part D in the coming years than in the program’s earlier years due to higher costs associated with expensive specialty drugs.
To address the health care financing challenges posed by the aging of the population, a number of changes to Medicare have been proposed, including restructuring Medicare benefits and cost sharing; raising the Medicare eligibility age; shifting Medicare from a defined benefit structure to a “premium support” system; and allowing people under age 65 to buy in to Medicare. As policymakers consider possible changes to Medicare, it will be important to evaluate the potential effect of these changes on total health care spending and Medicare spending, as well as on beneficiaries’ access to quality care and affordable coverage and their out-of-pocket health care costs.
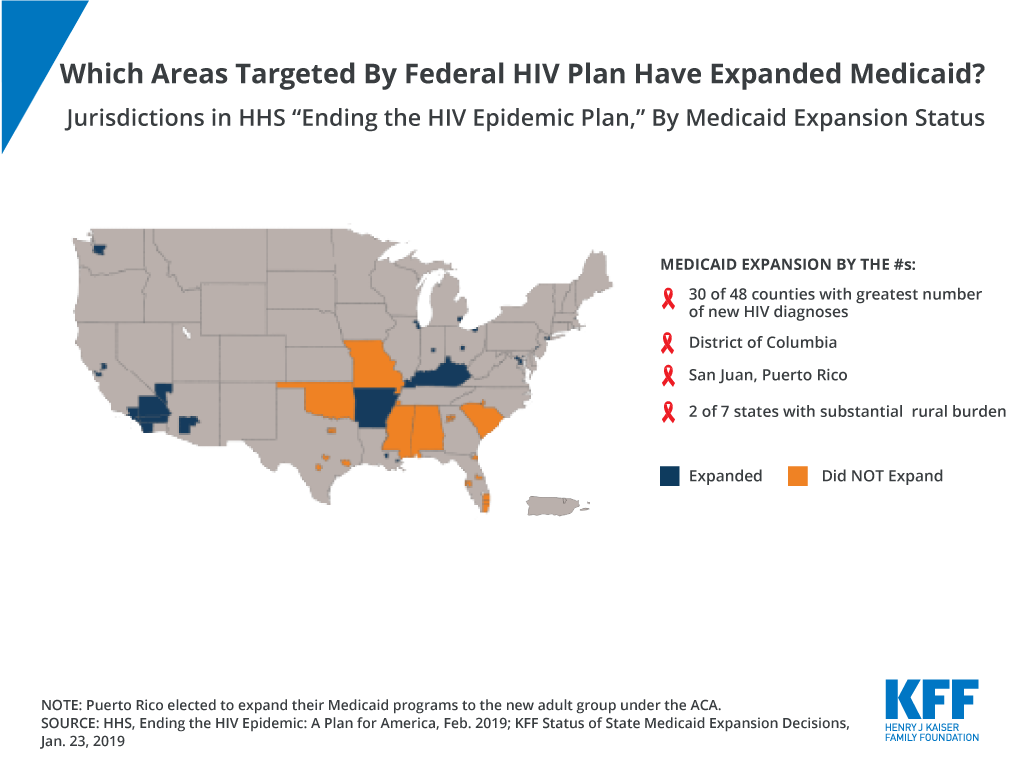
President Trump announced a commitment last week in his second State of the Union speech to end HIV in the United States by 2030. While details are still forthcoming, materials distributed by the Department of Health and Human Services say the multi-year program will focus on 48 counties, Washington, DC, and San Juan, Puerto Rico — which represent more than half of new HIV diagnoses — as well as seven states that have a substantial rural HIV burden.
Greater Than AIDS is a public information campaign, operated by KFF, focused on the domestic epidemic, in particular communities and people most affected. Launched in 2009, Greater Than AIDS builds on KFF’s more than two decades of experience developing and running large-scale HIV media campaigns in the U.S. and abroad, earning multiple Emmy and Peabody awards. Through targeted media messages and community outreach, we work to increase knowledge and understanding of HIV and confront stigma, while promoting actions to stem its spread. Tina Hoff, Senior Vice President for KFF and Director of the Health Communication and Media Partnerships Program that runs Greater Than AIDS, answers three questions about HIV in America today:
Hoff: We have found that public knowledge and attitudes have not always kept pace with the scientific advances, and each new generation must be educated. A 2017 KFF survey of young people ages 18-30 found that only 13 percent knew about PrEP, an FDA approved pill to prevent HIV. Most also understate the benefits of HIV treatment as prevention. According to the Centers for Disease Control and Prevention, people living with HIV who take their antiretroviral medications every day, as prescribed, and maintain a suppressed viral load, have effectively no risk of transmitting HIV to their sexual partners. Misinformation persists even about the basics. About a third of those surveyed mistakenly believe HIV can be spread by sharing dishes or glasses.
The stigma associated with HIV also remains an ongoing challenge. Whether it is getting tested, keeping up with care and treatment, or having the support of loved ones, stigma can present as one of the most significant barriers to ending HIV.
Hoff: Through digital media we reach people no matter where they are with vital health information, as well as provide a sense of community. As one of the largest social media groups focused on the domestic HIV epidemic, Greater Than AIDS is a go-to for those looking to find and offer advice and support.
Video content is increasingly the preferred format, especially for younger generations, and it has the advantage of working across education and reading levels. The hundreds of stories of real people sharing openly and honestly about their experiences through Greater Than AIDS help others living with HIV feel less alone. One young man, after seeing our campaign, for example, said it helped him open up a dialogue with his family about his HIV status. The videos also offer tools and knowledge to stay healthy regardless of status.
Hoff: A focus for our work is in the South, which accounts for a disproportionate share of the U.S. epidemic and where health outcomes of HIV are often worse. We partner with state and local health departments and other community allies to develop and place targeted, cross-media public information campaigns in parts of the country most affected by HIV.
Through localized responses, i.e. GEORGIA>AIDS and HOUSTON>AIDS, we provide media messages and informational materials that can be tailored to the needs of specific communities and executed quickly. By working across regions, we facilitate sharing of strategies and best practices among health departments.
Our partnership with Walgreens also works with health departments and local AIDS service organizations to bring free HIV testing and information to more than 300 stores across the nation around National HIV Testing Day in June.
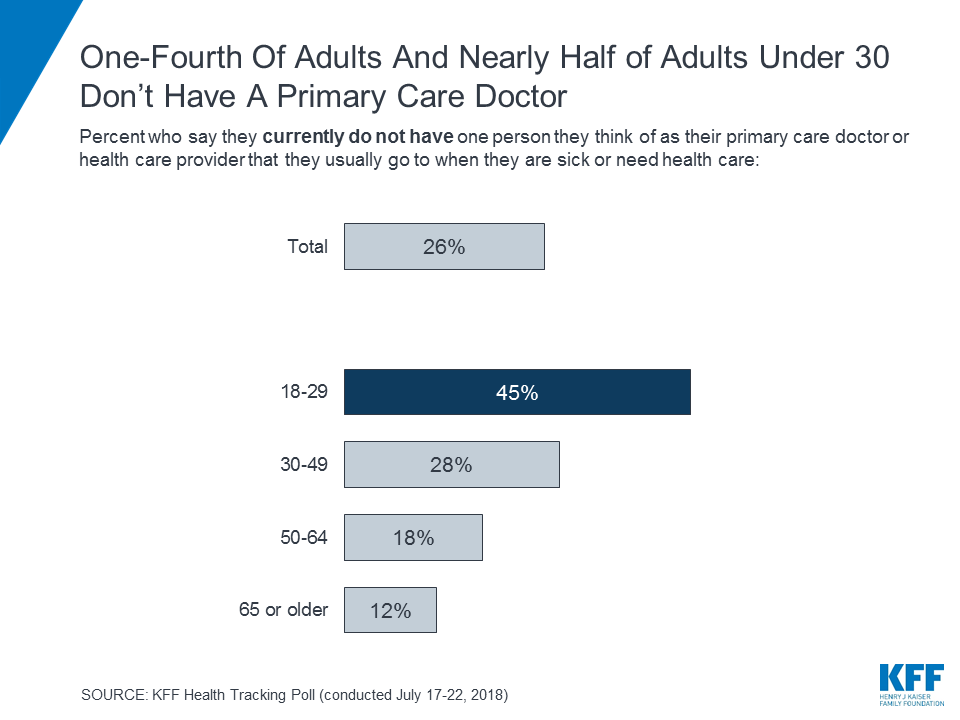
KFF Health Tracking Poll (conducted July 17-22, 2018)
Attention to global health by governments, policymakers, media, business leaders, and other institutions has increased markedly in recent decades, with a particular focus on health challenges facing low- and middle-income countries. This has led to growing funding, the establishment of new institutions and global goals, and a burgeoning community of stakeholders.
The U.S. government has long supported health programs as an element of foreign aid and development assistance, and is the largest donor to global health. These programs have grown in size and prominence over time, most notably with the launch of the President’s Emergency Plan for AIDS Relief (PEPFAR) and the President’s Malaria Initiative (PMI), and the U.S. government support of the creation of the multilateral organization, the Global Fund to Fight AIDS, Tuberculosis and Malaria (the Global Fund), in the early 2000s. Today, the U.S. government remains the largest funder and implementer of global health programs worldwide, and global health remains the largest component of U.S. foreign assistance, although funding has leveled in recent years. In addition, the current Administration has proposed to reduce the U.S. global health budget and pull back from multilateral engagement, creating questions about the future of U.S. support.
This @KaiserFamFound primer examines how the U.S. government engages on #globalhealth issues, including the agencies, programs and budgets that support this work.
The U.S. global health response is complex, a multi-pronged, multi-billion dollar investment involving many different U.S. government departments and agencies, congressional committees, initiatives, and funding streams and targeting a myriad of global health challenges and countries.1 This primer provides basic information about global health and the U.S. government’s response in low- and middle-income countries. Although it focuses primarily on the U.S. government, it is important to acknowledge the role played by other countries, multilateral organizations, and private sector actors, such as non-governmental organizations (NGOs), foundations, corporations, and others, in the global health response.
The first several sections of this primer provide an overview of the field of global health and describe current global health issues. Subsequent sections describe U.S. government support for global health, including the programs addressing global health challenges, the organization of the U.S. response, the budgets and financing of U.S. global health programs, and the U.S. government’s relationship with multilateral institutions and international partners. More global health policy resources, information, and analysis from KFF are available online.
Despite a growing emphasis on the importance of addressing global health by the international community and the U.S., there is currently no standard, agreed-upon definition for global health, and several different definitions exist. The Institute of Medicine has defined global health as having “the goal of improving health for all people in all nations by promoting wellness and eliminating avoidable diseases, disabilities, and deaths.”2 It has also been defined as “public health for the world”, focusing on the health of populations rather than the health of individuals, and as emphasizing “transnational health issues, determinants, and solutions…a synthesis of population based prevention with individual-level clinical care.”3 ,4
Box 1: Definitions of Key Global Health Measures
Prevalence – the number of people with a particular condition at any given time (e.g., the number of people who are HIV positive).
Incidence – the number of new cases of a disease or condition in a population within a period of time (e.g., the number of people who became newly infected with HIV in a year).
Mortality – deaths; can reference overall mortality (i.e. from all causes) or deaths due to a particular disease or condition (e.g. deaths from HIV/AIDS) or deaths in a particular population (e.g. child deaths).
The field of global health has evolved out of the historical disciplines of “tropical medicine” and “international health,” but what sets global health apart from these prior eras is a recognition that the health of people around the world is highly interconnected, with domestic and foreign health inextricably linked.5 ,6 A key dimension of global health is an emphasis on addressing inequities in health status between rich and poor populations. Persons in low- and middle-income countries face lower life expectancies and higher burdens of disease, and are disproportionately affected by certain highly preventable causes of disease and mortality compared to persons in high-income countries. In low-income countries, preventable deaths from infectious diseases (such as respiratory infections, diarrheal diseases, HIV/AIDS, and malaria) are among the most common killers. In contrast, the most common causes of deaths in high-income countries are from chronic, non-communicable diseases (such as heart disease, stroke, cancer, and diabetes), although the burden of chronic, non-communicable conditions is growing in low- and middle-income countries.
There are many factors that contribute to inequities in health, and persons in low- and middle-income countries face many different kinds of health challenges. Some of the broader conditions that lead to poor health, or the “social determinants of health,” include poverty; lack of education; lack of access to clean water, sanitation, and food; environmental conditions; and weak health systems. While many global health efforts seek to address and impact these larger determinants of health, more commonly they are directed toward more specific issues or causes of disease. Some of the most prominent issues and diseases targeted by global health efforts include:
HIV/AIDS – Human immunodeficiency virus (HIV) is the virus that causes acquired immunodeficiency syndrome (AIDS), the most advanced stage of HIV infection. People become infected with HIV primarily through sexual contact with an infected person, though it can also be transmitted through blood (e.g., by using a syringe that has been previously used by someone who is infected) or from a mother to a baby during pregnancy, delivery, or breastfeeding. HIV weakens the immune system, leaving those affected vulnerable to opportunistic infections and potentially death. Although there is no cure or vaccine, HIV can be effectively treated with antiretroviral therapy. In addition, numerous prevention interventions exist to combat HIV, such as behavior change programs, condoms, blood supply safety, harm reduction efforts for injecting drug users, PrEP (pre-exposure prophylaxis with antiretrovirals), and male circumcision. Further, research shows that HIV treatment not only improves individual health outcomes, but also significantly reduces the risk of transmission.7 – those with undetectable viral loads (known as being virally suppressed) have effectively no risk of transmitting HIV sexually.8 Access to prevention and treatment programs, however, remains limited in many areas. Sub-Saharan Africa, where it is estimated that approximately 70% of all people living with HIV are, faces the highest burden of disease from HIV. Additionally,70% of all AIDS deaths occur in this region.9
Box 2: HIV/AIDS
Tuberculosis – Tuberculosis (TB) is an airborne infectious disease caused by bacteria that primarily affects the lungs. While active TB can be spread from person to person and is a major cause of illness and death around the world, TB can remain latent in otherwise healthy people, who exhibit no symptoms and cannot transmit the bacteria to others. In addition, it is a common and serious threat to people with compromised immune systems, such as those living with HIV. No effective vaccine currently exists to prevent transmission of TB, although the BCG (Bacillus Calmette-Guérin) vaccine is partially effective in preventing some serious TB complications in children; other vaccines are currently being developed.10 TB control programs around the world commonly use a method called DOTS, or “directly observed treatment, short-course” to treat and prevent TB using a combination of drugs. As a result of inconsistent or partial treatment, incorrect prescribing, or interruptions in the drug supply, TB that is resistant to commonly used drugs has emerged as a major challenge for TB control efforts. Thirty countries, all of which are low- and middle-income, are considered “high-burden countries (HBCs),” accounting for approximately 87% of new TB cases each year.11
Box 3: Tuberculosis
Malaria – Malaria is a parasitic disease that is spread to people through the bite of a particular mosquito species, known as Anopheles, which thrive in warm tropical and sub-tropical climates. Symptoms of malaria include fever, vomiting, and diarrhea, and in severe cases it leads to death. Malaria control efforts involve a combination of prevention and treatment strategies and tools. Prevention strategies include use of insecticide-treated bed nets and indoor residual spraying for mosquito control, and the use of drugs to prevent infection. A malaria vaccine is not yet available, although clinical trials are underway. Drugs for treating malaria include: chloroquine, primaquine, and artemisinin-based combination therapies (ACTs). Drug resistance is an important issue in malaria, as the parasite has developed resistance to common anti-malarial drugs in some areas. While access to malaria prevention and treatment services in affected areas has grown over time, gaps remain. Sub-Saharan Africa is the hardest hit region in the world.12 ,13
Box 4: Malaria
Neglected Tropical Diseases – Neglected tropical diseases (NTDs) are a group of parasitic, bacterial, and viral infections that primarily affect the most impoverished and vulnerable populations in the world. They are called NTDs because until recently they had received only scant attention in global health efforts. More than one billion people, almost all of whom live in low- and middle-income countries, are infected with one or more NTDs, and another 2 billion people are at risk.14 The U.S. targets several NTDs, including worm infections such as roundworm and hookworm, lymphatic filariasis (a parasitic infection transmitted by mosquitos), schistosomiasis (a parasitic infection transmitted by fresh water snails), onchocerciasis (also known as river blindness), and trachoma (a bacterial infection that can cause blindness), as highly cost-effective treatment and prevention tools, including mass drug administration, are currently available to address them.15
Family Planning and Reproductive Health – Family planning is the ability of a person or family to plan for and attain the desired number of children as well as the desired spacing and timing of births. Reproductive health is the state of complete physical, mental, and social well-being in all matters relating to the reproductive processes, functions, and system at all stages of life.16 Access to family planning and reproductive health (FP/RH) services is critical to the health of women and children worldwide because these services are effective in decreasing the risk of unintended pregnancies, maternal and child mortality, and other complications.17 ,18 FP/RH education and services support birth spacing, contraception, counseling, post-abortion care, screening/testing for HIV and other sexually transmitted infections (STIs), repair of obstetric fistula, antenatal and postnatal care, and human papillomavirus (HPV) vaccines to prevent cervical cancer and genital warts. Novel FP/RH tools, such as microbicides (compounds that can be inserted into the vagina or rectum to protect against STIs), are also being pursued. Approximately 12% of women developing countries have an unmet need for family planning.19
Box 5: FPRH
Maternal and Child Health – Maternal and child health (MCH) programs address the health needs of mothers before and during pregnancy and childbirth, as well as the health of newborns and young children. Ninety-nine percent of maternal deaths and deaths in children under 5 occur in the developing world.20 ,21 ,22 ,23 According to the World Health Organization (WHO), most maternal deaths are preventable through “quality family planning services, skilled care during pregnancy, childbirth and the first month after delivery, or post-abortion care services and where permissible, safe abortion services.” Addressing health care for newborns and young children focuses on care during pregnancy, safe delivery, neonatal care, and breastfeeding, as well as prevention and treatment of diseases and conditions such as pneumonia, diarrhea, malaria, HIV/AIDS, and malnutrition. There are many low-cost prevention and treatment measures – such as immunization, antibiotics, insecticide treated bed nets, zinc supplements, and oral rehydration therapy – that can reduce infant and child mortality and improve their health.
Box 6: MCH
Polio – Poliomyelitis, or polio, is a crippling and sometimes fatal viral disease. Polio is transmitted through the fecal-oral route, and enters the body through the mouth when people eat food or drink water contaminated with excreta. The virus is easily spread in areas with poor hygiene and mainly affects children under five years of age. Polio cannot be cured, but is preventable through vaccination. A global effort to completely eradicate the disease began in 1988, and since then the number of polio cases has dropped over 99% worldwide. The eradication effort continues today, but three countries – Nigeria, Pakistan, and Afghanistan – have not been able to interrupt polio transmission and remain endemic for the disease, and outbreaks of the disease continue to occur in other low-income countries.24 ,25 Polio could surge again if eradication is not completed and control measures are scaled back.
Box 7: Polio
Nutrition – Poor nutrition comes in various forms and is typically characterized by inadequate or excess intake of protein, energy, and micronutrients such as vitamins. Undernutrition, a lack of the nutrients needed by the body for appropriate growth and development, can result from an inadequate food supply or from insufficient intake of certain types of food (e.g., protein and micronutrients), and is especially prevalent in populations in low- and middle-income countries. Undernutrition increases the risk of certain diseases and can lead to premature death, especially in infants and children. Nutrition interventions include breastfeeding promotion, infant and young child feeding programs, micronutrient supplementation (e.g., vitamin A), food fortification, and improving food security.26 Almost all of the approximately 815 million undernourished people in the world live in developing countries.27 ,28
Box 8: Nutrition
Water and Sanitation – Lack of clean water and sanitation access can lead to exposure to a variety of pathogens that can cause illnesses, especially diarrhea. Children – in particular those with already poor health and nutritional status – are very susceptible to dehydration from diarrhea. Treatment of diarrhea centers around fluid replacement to prevent dehydration (e.g., using a solution of oral rehydration salts). In addition, zinc may be provided, since episodes of diarrhea may create a deficiency of the mineral in the body that is associated with higher rates of infectious diseases and mortality. Prevention involves improved access to water and sanitation, exclusive breastfeeding for the first six months of life, and promotion of hand-washing with soap. Only 62% of people living in developing countries have access to improved sanitation facilities compared to 96% of developed countries.29 ,30
Box 9: Water and Sanitation
Other Challenges in Global Health – A number of other issues are receiving increasing attention within global health. Non-communicable diseases (NCDs), particularly cardiovascular disease, cancer, chronic lung disease, and diabetes, which have historically been seen as primarily health problems of the developed world, are now seen as increasingly important contributors to the burden of disease of developing countries that should receive greater attention from global health efforts. Similarly, mental health conditions, such as depression, are increasingly being seen as an important health issues for developing countries.31 ,32 ,33 Finally, recent infectious disease threats, like Zika, Ebola,34 ,35 and antimicrobial resistance, have contributed to global health security gaining traction as a key issue in global health.
Box 10: Impacts of the 2014-2015 Ebola Outbreak
There is a long history of international efforts to tackle health issues. In the mid-1800s, for example, a group of countries began to negotiate international agreements on how to combat cross-border outbreaks of infectious diseases such as cholera and yellow fever.36 After World War II, international efforts expanded with the establishment of the United Nations and its health-focused agencies such as WHO and the United Nations Children’s Fund (UNICEF), and with new challenges, new agencies have formed, such as the Joint United Nations Programme on HIV/AIDS (UNAIDS). Cooperative efforts in global health have grown significantly since the early 2000s, as new international goals and targets for addressing health challenges have been established, new global health funding vehicles and initiatives created, and the amount of funding increased.37
There are a diverse set of stakeholders involved in efforts to improve global health. These include multilateral and international organizations, donor and partner governments, the private sector, research organizations, civil society, academia, and individuals.38 Donor governments channel support for global health programs either bilaterally (i.e., giving their support directly to or on behalf of another country) or multilaterally (i.e., giving their support to a multilateral organization, which channels the funds to support global health programs in recipient countries). The private sector, civil society, academia, and research organizations are other important partners in global health programs. Low-and middle-income country governments (typically recipients of donor support but increasingly providing their own support for the health of their populations), local organizations, and individuals are also key stakeholders in determining how global health programs are funded and implemented. With these numerous stakeholders and multiple initiatives in the field of global health, coordination between actors remains a key challenge in the international response.
While there are several historical markers and milestones in global health, including the International Sanitary Conventions beginning in the 1800s, the founding of WHO in 1948, and the Alma-Ata Declaration of 1978 focused on primary health care, there has been a notable increase beginning in the twenty-first century.39 Since 2000, a number of treaties, commitments, partnerships, and other multilateral agreements addressing health have been supported by the international community, some of which have turned out to be important and durable milestones, while others have been less so. Figure 1 highlights some of the more important developments in international cooperation on global health.

Donor government funding, including both the bilateral funding given directly to other countries (which may be given to a country government or provided to NGOs and other organizations to carry out work in recipient countries) and the multilateral funding given indirectly through contributions to multilateral organizations, accounts for most external health aid channeled to the developing world. As such, this donor support constitutes a major component of the global health response.
Donor government funding for global health has risen significantly since 2002, growing from $4.4 billion to a peak of $22.8 billion in 2013 (see Figure 2). However, funding declined for the first time in 2014 to $21.5 billion and has since remained relatively flat.

In addition, donor government funding for health has generally increased as a share of official development assistance (ODA), particularly over the last decade. These increases were largely spurred on by the creation of several new funding initiatives and mechanisms such as the Global Fund and PEPFAR. However, this share has remained essentially flat in more recent years and declined in 2014 and 2015. This flattening and recent decline has raised concerns about the ability of countries to meet global health goals and targets, such as those of the Sustainable Development Goals (SDGs).”42 ,43
The U.S. has been the largest donor to health in each year over the entire period between 2002 and 2016, and has dedicated the greatest share of its ODA to health.44 The donor mix has shifted over this time, in part due to the entrance of new donors, particularly the Global Fund, which became the second largest donor to health after the U.S. in 2006 (and remains so today). The U.S. and the Global Fund combined accounted for more than half of total donor funding for health in 2016 (see Figure 3).

U.S. global health efforts aim to help improve the health of people in developing countries while also contributing to broader U.S. global development goals (e.g., advancing a free, peaceful, and prosperous world), foreign policy priorities (e.g., promoting democratic institutions, protecting U.S. diplomatic interests), and national security concerns (e.g., protecting Americans from external threats, promoting stability).45
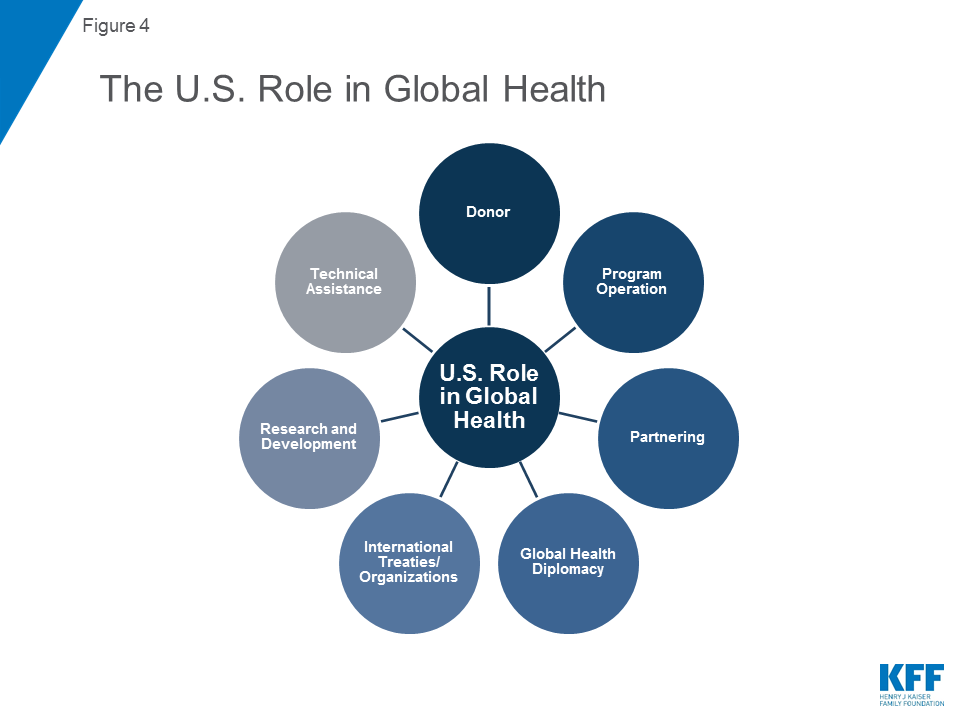
Components of the U.S. engagement on global health include policies (such as legislation, regulations, executive orders, guidance, and other relevant issuances that address global health) and a broad range of initiatives and programs that are meant to improve health in low- and middle-income countries. The U.S. role is multifaceted (Figure 4), and includes such activities as:
U.S activities are targeted at a broad range of issues, and use different intervention approaches such as:
These broad areas are often carried out as part of larger development assistance and poverty alleviation efforts, activities designed to enhance access to basic and higher education, and interventions that address gender inequalities and empower women and girls. In addition, the U.S. government has a long-standing engagement in providing humanitarian aid and disaster relief, including activities that are not directly focused on health but which can serve to mitigate or prevent adverse health outcomes.
The U.S. government’s engagement in global health is overseen and carried out by multiple agencies and departments, and several congressional committees (see Figure 5). In general, U.S. global health engagement has developed within two main structures of the government: the foreign assistance structure, which is predominantly global development-oriented and has close links to foreign policy, and the public health structure, which has its roots in disease prevention, control, and surveillance efforts. Most funding for and oversight of U.S. global health resides within the foreign assistance structure, including at the Department of State (State), the U.S. Agency for International Development (USAID), and the Millennium Challenge Corporation (MCC). The public health structure, represented most prominently by several agencies within the Department of Health and Human Services (HHS), also plays an important global health role. Additional departments and agencies are also involved in global health, including the Department of Defense (DoD), the Department of Agriculture (USDA), the Peace Corps, the Environmental Protection Agency (EPA), the Department of Homeland Security (DHS), the Department of Labor (DoL), the Department of Commerce (Commerce), the National Security Council (NSC), and the Office of the U.S. Trade Representative (USTR).
A schematic of the U.S. government’s global health organization can be seen in Figure 5 below.
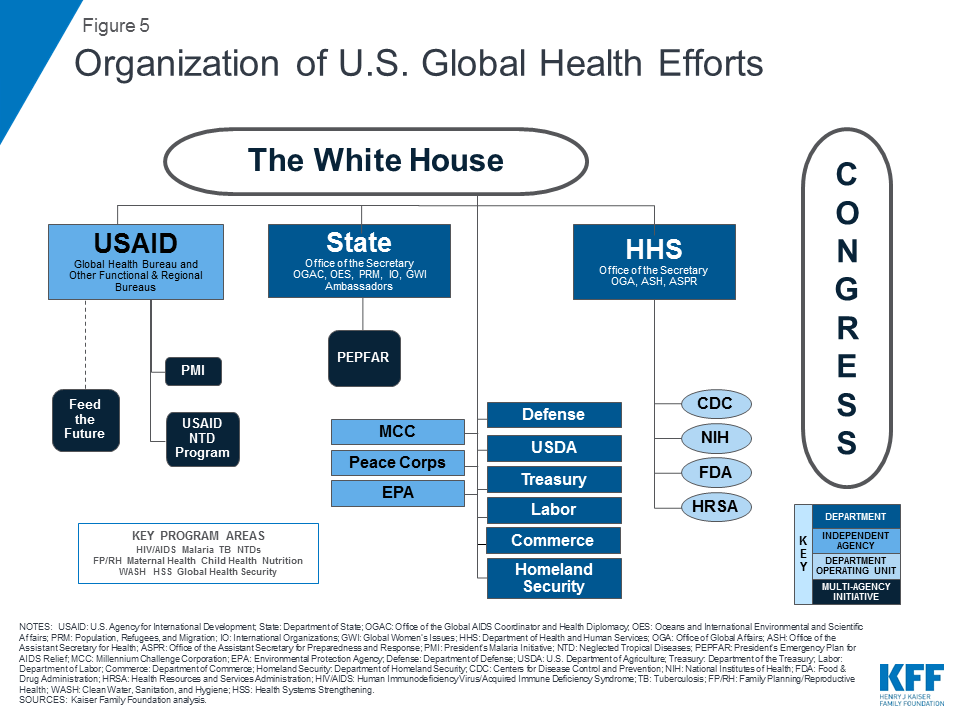
U.S. global health engagement is primarily based in foreign assistance agencies, which receive the bulk of government funding appropriated by Congress to operate the majority of global health programs and activities.
Established in 1789, the State Department is the Cabinet-level foreign affairs agency of the United States. The Department advances U.S. objectives and interests in the world through its primary role in developing and implementing the President’s foreign policy. The State Department also provides policy direction to USAID, the lead federal agency for development assistance. Most of the State Department’s global health policy development and coordination activity is overseen by the Under Secretary for Civilian Security, Democracy, and Human Rights, the Under Secretary for Economic Growth, Energy, and the Environment, and the Office of the U.S. Global AIDS Coordinator and Health Diplomacy (OGAC). Through OGAC (created in 2003), the U.S. Global AIDS Coordinator oversees the implementation of the U.S. President’s Emergency Plan for AIDS Relief (PEPFAR), exercising oversight authority over all funding and activities for global HIV carried out by multiple departments and agencies. OGAC also provides diplomatic support (through U.S. Ambassadors and others) in implementing U.S. global health efforts.46 In addition, the State Department contributes to the development of the U.S. government’s Global Water Strategy, which addresses clean water, sanitation, and hygiene (WASH) efforts in developing countries, as charged by the Senator Paul Simon Water for the Poor Act of 2005 and Water for the World Act of 2014. More information on PEPFAR and U.S. WASH efforts can be found in the “What Are The Major U.S. Global Health Program Areas And Efforts?” section below.
Established in 1961, USAID is an independent U.S. federal government agency that receives overall foreign policy guidance from the Secretary of State. USAID’s role is to support long-term and broad-based economic growth in countries and advance U.S. foreign policy objectives by supporting activities in each of its programmatic functional bureaus (e.g., Bureau for Global Health) as well as regional bureaus. Most USAID global health programs are coordinated through the Bureau for Global Health, including HIV/AIDS and other infectious diseases, maternal and child health, family planning and reproductive health, nutrition, and environmental health. Other bureaus and offices within USAID that address global health issues include the Bureau for Economic Growth, Education, and Environment, which implements clean water and sanitation projects, and the Bureau for Democracy, Conflict, and Humanitarian Assistance, which administers the largest U.S. international food assistance program, the Food for Peace Program (Public Law 480 Title II). USAID serves as the lead agency for the President’s Malaria Initiative (PMI), which is implemented with the Centers for Disease Control and Prevention (CDC), and also serves as one of the main PEPFAR implementing agencies. More information on PMI, PEPFAR, and USAID programs can be found in the “What Are The Major U.S. Global Health Program Areas And Efforts?” section below.
Established in 2004, MCC administers the Millennium Challenge Account (MCA), a U.S. government initiative which provides development assistance to eligible countries in order to promote economic growth and reduce poverty in low- and middle-income countries. MCC supports a number of health-related programs, but health is not the main focus or purpose of its work; it is designed to link contributions for development assistance to greater responsibility by developing nations. The MCC is a government corporation with a Board of Directors that includes the Secretary of State (Chair), the Secretary of Treasury, the U.S. Trade Representative, the Administrator of USAID, the CEO of the MCC, and four public members appointed by the U.S. President with the advice and consent of the U.S. Senate. For further details on these activities, see the KFF fact sheet on The Millennium Challenge Corporation (MCC) and Global Health.
Public health service agencies operate global health programs directly, or in conjunction with foreign assistance agencies.
Established as a Cabinet-level department in 1953, HHS is the U.S. government’s principal agency for protecting the health of all Americans and providing essential human services. The Office of Global Affairs (OGA), which reports directly to the Secretary and is led by the Director of OGA, provides policy guidance to and coordinates with other Federal departments and agencies, international organizations, and the private sector on international and refugee health issues, and manages the health attaché program. While HHS directly operates some in-country programs, much of its global health efforts are provided through technical assistance to foreign assistance agencies through four HHS operating divisions:
The remainder of U.S. global health activities is carried out by programs at several other federal departments and agencies. These include:
Congress drafts program specific legislation, recommends overall funding levels, specifies how funds should or should not be spent, and appropriates funds to U.S. global health programs. More than 15 congressional committees have some jurisdiction and oversight over global health. The major committees with jurisdiction are listed below.
A more complete reference document listing congressional committees with jurisdiction over global health by department, agency, and initiative can be found in Appendix A.
The U.S. global health response has been defined by numerous governing statutes, authorities, and policy decisions, with most legislative and policy activity occurring in the past 15 years. Two major acts have established the main agencies that carry out global health activities and specify where and how funds should be directed:
In addition to the general foreign assistance statutes listed above, the legislation that created PEPFAR in 2003 and its re-authorizations in 2008, 2013, and 2018 are also key statutes for U.S. global health policy.
Other Acts of Congress have also been significant for global health. A timeline of the statutes, authorities, and policies governing U.S. global health policy can be found in Appendix B.
While the U.S. government has been engaged in international health activities for more than a century, the provision of development assistance for health began primarily in the 1960s and 1970s, with support for maternal and child health and family planning efforts. Efforts have grown markedly since the early 2000s, and have largely focused on disease-specific initiatives, including PEPFAR and the PMI.
Each of these programs works in a particular set of countries and typically has its own dedicated budget, staff, objectives, and monitoring and evaluation practices, and historically, these programs have not been well coordinated. The current Administration views global health as a key component of national security and aims to build upon and consolidate the successes of existing U.S. global health programs and initiatives (such as U.S. global HIV/AIDS efforts). It encourages countries to invest in their own basic health care systems by emphasizing “self-reliance” while working with countries to develop their capabilities, including preparedness and response capacities.51
This section gives an overview of the key U.S. global health programs that address the major global health challenges identified earlier.
The U.S. first provided funding to address the global HIV epidemic in 1986, although funding and attention did not increase significantly until the last 15 years. In 1999, President Clinton announced the Leadership and Investment in Fighting an Epidemic (LIFE) Initiative, and in 2002, President Bush announced the International Mother and Child HIV Prevention Initiative. A major increase in support for global HIV/AIDS programs occurred when President Bush announced the U.S. President’s Emergency Plan for AIDS Relief (PEPFAR) in 2003, which has been the largest commitment by any nation to combat a single disease in history.53 ,54 Its first five-year authorization through the United States Leadership Against HIV/AIDS, Tuberculosis and Malaria Act of 2003 (P.L. 108-25 or “Leadership Act”) was for $15 billion (Congress appropriated more over this period). PEPFAR was reauthorized by the Tom Lantos and Henry J. Hyde United States Global Leadership Against HIV/AIDS, Tuberculosis, And Malaria Reauthorization Act of 2008 (P.L. 110-293 or “Lantos-Hyde”) for an additional five years starting in 2008, expanding goals for HIV, TB, and malaria efforts. In 2013, the PEPFAR Stewardship and Oversight Act of 2013 (P.L. 113-56 or “PEPFAR Stewardship Act”) extended a number of existing authorities for an additional five years starting in 2014 and strengthened the oversight of the program through updated reporting requirements, among other things.55 Most recently in 2018, PEPFAR was reauthorized by the PEPFAR Extension Act of 2018 (P.L. 115-305) for an additional five years (FY 2019 – FY 2023).56
PEPFAR is an interagency initiative that supports a range of HIV prevention, treatment, and care efforts worldwide, including prevention of mother-to-child transmission of HIV and the provision of antiretroviral drugs to millions. In 2011, Secretary of State Clinton called for an “AIDS-free generation” as a goal of the U.S. government, and in 2012, PEPFAR released a blueprint for achieving this goal.57 ,58 In 2014, PEPFAR 3.0 – Controlling the Epidemic: Delivering on the Promise of an AIDS-free Generation was released, reflecting a shift in its approach to controlling the epidemic, including targeting resources to key populations, especially adolescent girls and young women, and geographic areas that are most affected by HIV.59 PEPFAR’s current strategy aligns with the UNAIDS 90-90-90 framework, and emphasizes accelerating testing and treatment strategies, expanding prevention, using data to increase PEPFAR’s impact and effectiveness, engaging with faith-based organizations and the private sector, and strengthening policy and financial contributions by partner countries.60
PEPFAR’s original authorization established an Office of the U.S. Global AIDS Coordinator at the Department of State, headed by a coordinator who is appointed by the President and requires Senate confirmation. The U.S. Global AIDS Coordinator has the rank of Ambassador and reports directly to the Secretary of State. The coordinator is responsible for all programs, activities, and funding for global HIV/AIDS efforts. Along with OGAC, the White House and the National Security Council (NSC) are involved in policy development for PEPFAR. USAID and CDC are the main PEPFAR implementing agencies and receive direct funding from Congress. Other implementing agencies include: NIH, HRSA, and FDA at HHS; DoL; Commerce; the Peace Corps; and DoD. For further information on U.S. global HIV efforts and PEPFAR, please see the KFF fact sheets on the Global HIV/AIDS Epidemic and the U.S. President’s Emergency Plan for AIDS Relief.
USAID is the lead U.S. government agency on global tuberculosis control and began its efforts in 1998. The U.S. response to TB grew over time, and in 2003, the passage of the Leadership Act highlighted the U.S. commitment to addressing TB and authorized U.S. contributions to the Global Fund, significantly increasing the amount of support for TB programs by the U.S. government. PEPFAR’s reauthorization by the Lantos-Hyde Act in 2008 established specific funding levels and targets for TB. In 2015, the USG released its five-year USG TB Strategy 2015-2019, which outlines current USG TB goals. The same year, the USG also released its National Action Plan for Combating Multidrug-Resistant Tuberculosis, which identifies interventions and articulates a strategy to respond to the domestic and global challenges of MDR-TB.63 Most recently, at the U.N. High-Level Meeting on TB in 2018, the National Institutes of Health (NIH) released the Strategic Plan for Tuberculosis Research, which aims to accelerate its TB research including MDR-TB research.64 USAID’s TB efforts are focused on the diagnosis, treatment, and control of TB and multi-drug and extensively drug resistant (MDR/XDR) TB. Countries are selected to receive bilateral support for TB based on the prevalence and incidence of TB, HIV/AIDS prevalence, prevalence and/or potential for drug resistance, and case detection and treatment success rates. Political commitment and technical and managerial feasibility are also considered in country selections. For further information on U.S. global TB efforts, please see the KFF fact sheet on the U.S. Government and Global Tuberculosis Efforts.
The U.S. has been involved in efforts to combat malaria since the 1950s through activities at CDC and USAID. Early efforts focused on technical assistance, but also included some direct financial support for programs overseas. U.S. efforts expanded over time, and the 2003 passage of the Leadership Act highlighted the U.S. commitment to addressing malaria and authorized multilateral support to combat the disease through contributions to the Global Fund. In 2005, President Bush announced the U.S. President’s Malaria Initiative, 67 initially a five-year expansion of existing U.S. government efforts to address malaria in certain highly-affected countries. In 2015, the U.S. released the President’s Malaria Initiative Strategy 2015-2020, which outlines its goals as well as its approach to achieving them by 2020.68 The PMI is an interagency initiative led by USAID, and implemented in partnership with CDC. It is overseen by the U.S. Global Malaria Coordinator, who is appointed by the President, and an Interagency Advisory Group made up of representatives of USAID, CDC, State, DoD, NSC, and the Office of Management and Budget. The coordinator reports to the USAID Administrator, and has direct authority over both the PMI efforts and non-PMI USAID malaria programs. U.S. efforts to control malaria include the distribution of insecticide-treated bed nets (ITNs), indoor residual spraying (IRS), intermittent preventive treatment in pregnancy (IPTp), diagnosis of malaria and treatment with artemisinin-based combination therapies (ACTs), entomological monitoring, and seasonal malaria chemoprevention (SMC). For further information on U.S. global malaria efforts, please see the KFF fact sheet on the President’s Malaria Initiative and Other U.S. Government Global Malaria Efforts.
Historically, the U.S. government had supported the NTD response through research and surveillance. In 2006, U.S. attention to NTDs increased when Congress first appropriated funds to USAID for integrated NTD control, marking the launch of the USAID NTD program. In 2008, the program was expanded under President Bush’s U.S. NTD Initiative. The USAID NTD program seeks to control seven NTDs in target countries in Africa, Asia, and Latin America through mass drug administration programs. USAID serves as the lead implementing agency for U.S. global NTD efforts, with several other agencies, including CDC, NIH, DoD, and the FDA, also involved. For further information on U.S. global NTDs efforts, please see the KFF fact sheet on the U.S. Government and Global Neglected Tropical Disease Efforts.
Research on international FP and population issues was first authorized by Congress in the Foreign Assistance Act of 1961. In 1965, USAID launched its first FP program and, in 1968, began purchasing contraceptives to distribute in developing countries. USAID serves as the lead agency on FP/RH. Its efforts aim to reduce high-risk pregnancies; allow sufficient time between pregnancies; provide information, counseling, and access to condoms to prevent HIV transmission; reduce the number of abortions; support women’s rights; and stabilize population growth. Funding is allocated to countries based on factors that include unmet need for family planning services, high-risk births, contraceptive use, and population pressures on land and water resources. For further information on U.S. international family planning and reproductive health efforts, please see the KFF fact sheet on the U.S. Government and International Family Planning & Reproductive Health Efforts.
The U.S. government has been involved in efforts to improve MCH since the 1960s, initially focused on pioneering research on oral rehydration therapy (ORT). Other early programs included fortifying international food aid with vitamin A, and efforts to control malaria (because the bulk of malaria illness and death occurs in children). Funding for USAID’s child survival activities nearly doubled in 1985, and in 2001, USAID introduced a newborn survival strategy. In 2012, USAID, along with many other partners, held a child survival summit to re-energize support for child survival programs.75 USAID’s MCH strategy focuses on bringing a range of “high impact interventions” to scale, and on health systems strengthening (e.g., health workforce, pharmaceutical management, etc.). Funding is allocated to countries based on factors that include high maternal and child mortality burdens, government willingness to partner, and country capacity to implement programs. For further information on U.S. global maternal and child health efforts, please see the KFF fact sheet on the U.S. Government and Global Maternal & Child Health Efforts.
USAID has been involved in efforts to improve nutrition for more than 40 years. USAID’s nutrition program aims to prevent undernutrition through interventions such as nutrition education, nutrition during pregnancy, promotion of exclusive breastfeeding, and micronutrient supplementation. In 2014, USAID released, for the first time, a multisectoral nutrition strategy that focuses on improving linkages among its humanitarian, global health, and development efforts to better address both the direct and underlying causes of malnutrition and to build resilience and food security in vulnerable communities.78 Nutrition efforts are coordinated with the U.S. Feed the Future (FtF) Initiative. Introduced in 2009 following theG-8 Summit in L’Aquila, Italy, FtF is the U.S. government’s global hunger and food security initiative. The initiative, led by USAID and USDA, works to reduce hunger, increase food security, and improve nutrition by investing in agricultural development and nutrition efforts, with an emphasis on country ownership, improving coordination, leveraging multilateral institutions, and ensuring long-term accountability, while addressing the underlying causes of hunger and poverty. FtF works closely with U.S. global health efforts to achieve nutrition targets. For further information on U.S. global nutrition efforts, please see the KFF fact sheet on the U.S. Government and Global Maternal & Child Health Efforts (which includes U.S. MCH and nutrition efforts).
USAID’s water, sanitation, and hygiene (WASH) activities aim to build capacity, strengthen water and sanitation utilities, mobilize domestic resources, improve household and community-level hygiene and sanitation, and work with disaster relief efforts to implement water and sanitation activities. U.S. government efforts to address WASH issues are guided by the Senator Paul Simon Water for the Poor Act of 2005 (P.L. 109-121) and the Senator Paul Simon Water for the World Act of 2014 (P.L. 113-289), which requires the State Department, USAID (the main implementing agency), and other U.S. government agencies to develop and implement a U.S. government Global Water Strategy to provide “first-time or improved access to safe drinking water, sanitation, and hygiene to the world’s poorest on an equitable and sustainable basis” and to identify priority water countries for U.S. WASH efforts.81 These efforts provide assistance to developing countries through capacity building activities and partnerships as well as direct investment in WASH infrastructure and science and technology. USAID’s WASH efforts, which are led by the USAID Global Water Coordinator, focus on providing clean water and ensuring water security through U.S. global health and food security efforts, while the State Department’s efforts, which are led by the State Department’s Special Advisor for Water Resources, focus on diplomatic efforts related to WASH issues and water resources.82
With the growing recognition that the burden from non-communicable diseases (NCDs) is growing in low- and middle-income countries, attention to NCDs in the context of U.S. government programs has increased. For example, the U.S. played an important role in organizing the 2011 U.N. high level meeting on NCDs, and participated in negotiations on global NCD targets and the development of best practices to combat NCDs.83 Funding for NCD programs, though, remains only a small proportion of overall U.S. government global health spending. For further information on U.S. global NCD efforts, please see the KFF fact sheet on the U.S. Government and Global Non-Communicable Disease Efforts.
Since the 1990s there has been growing concern about new and re-emerging infectious diseases that threaten human health. In the last several years alone we have seen the emergence and spread of threats such as Ebola, Zika, H1N1 influenza, and antibiotic resistance. Global health security efforts are meant to reduce the threat of such diseases by supporting preparedness, detection, and response capabilities worldwide. The U.S. has supported a number of global health security programs through agencies such as CDC, USAID, DoD, and the State Department.84 The U.S. has also played a key role in development of the “Global Health Security Agenda (GHSA),” an international partnership launched in 2014 and now involving more than 60 countries and international organizations. Through the GHSA, U.S. government agencies work with host governments and partners to help countries make measurable improvements in capabilities to detect and respond to emerging disease events and achieve global health security targets. For further information on U.S. global health security efforts, please see the KFF brief on the U.S. Government and Global Health Security.
Decisions on where the U.S. focuses its global health programs are based on a number of factors. The burden of disease faced by countries is an important factor in determining support, with more support generally directed to countries facing a higher burden of disease. For example, PEPFAR and PMI funds have been directed principally at those countries with some of the highest burdens of HIV/AIDS and malaria, respectively. Still, other factors also influence where the U.S. directs its health assistance, including the presence of willing and able recipient partner governments, a history of positive relations and goodwill between the countries, strategic and national security priorities, funding, and personnel availability.
The U.S. operates programs in more than 70 countries, with other countries reached through regional programs and contributions to multilateral organizations. The majority of countries receiving U.S. bilateral support for global health are located in Africa (35 countries). The U.S. also operates programs in East Asia and Pacific (11 countries), the Western Hemisphere (10 countries), South and Central Asia (8 countries), the Near East (4 countries), and Europe and Eurasia (4 country).86 The U.S. often operates programs in a number of different areas (HIV/AIDS, TB, NTDs, etc.) in a given country (see Figure 6 and Table 1). For more detailed information on the countries where U.S. global health programs are present, please see Appendix C.

| Table 1: Number of Countries by Program Area and Region, FY 2017 | ||||||||||
| Region | HIV/AIDS | Tuberculosis | Malaria | Neglected Tropical Diseases | Maternal and Child Health | Family Planning and Reproductive Health | Nutrition | Water Supply and Sanitation | Global Health Security | Other Public Health Threats |
| Africa | 27 | 11 | 25 | 17 | 20 | 21 | 13 | 16 | 12 | 0 |
| East Asia and Pacific | 5 | 4 | 2 | 5 | 5 | 3 | 2 | 2 | 5 | 0 |
| Europe and Eurasia | 1 | 1 | 0 | 0 | 1 | 0 | 0 | 0 | 4 | 0 |
| Near East | 0 | 0 | 0 | 0 | 1 | 1 | 0 | 4 | 2 | 1 |
| South and Central Asia | 3 | 6 | 0 | 2 | 6 | 5 | 4 | 4 | 3 | 1 |
| Western Hemisphere | 3 | 0 | 0 | 7 | 2 | 2 | 2 | 3 | 3 | 0 |
| Total | 39 | 22 | 27 | 31 | 35 | 32 | 21 | 29 | 29 | 2 |
| Source: KFF analysis of data from the State Department, Foreign Assistance Dashboard [website], available at: http://www.foreignassistance.gov; accessed June 2018. USAID, Countries Supported by USAID’s NTD Program, available at: https://www.neglecteddiseases.gov/where-we-work accessed June 2018. USAID, Countries Supported by USAID’s Global Health Security Agenda Program, available at: https://www.usaid.gov/what-we-do/global-health/health-systems/countries accessed June 2018. | ||||||||||
The U.S. government is the largest donor to global health in the world.87 U.S. government funding for global health has grown significantly since 2000, in large part due to funding for initiatives such as PEPFAR and PMI. More recently, however, U.S. funding for global health has begun to flatten. Most U.S. funding for global health is provided bilaterally, with the majority of multilateral funding provided to the Global Fund.
The majority of U.S. government funding for global health is captured under the Global Health Programs (GHP) account at USAID and the State Department. Additional funding for global health is provided through the Economic Support Fund (ESF) and Development Assistance (DA) accounts at USAID, the International Organizations and Programs (IO&P) and the Contributions to International Organizations (CIO) accounts at the State Department, and through CDC, NIH, and DoD.88
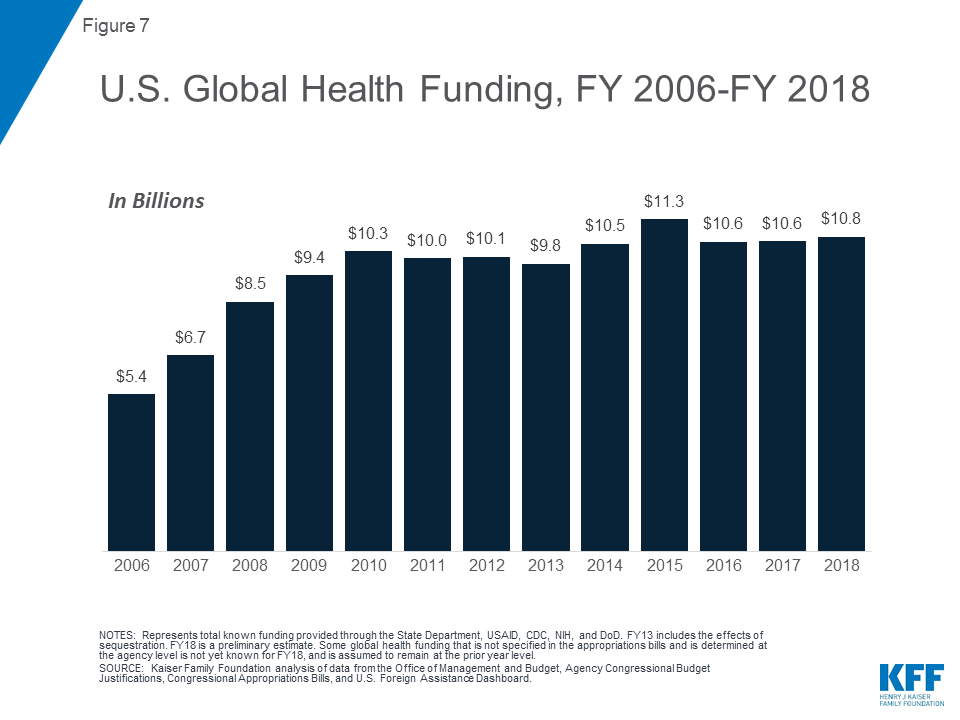
Specified funding for global health grew from $5.4 billion in FY 2006 to $10.3 billion in FY 2010 and has since remained relatively flat, totaling an estimated $10.8 billion in FY 2018 (see Figure 7).89 For further information on U.S. global health funding by program area, see the KFF fact sheet on Breaking Down the U.S. Global Health Budget by Program Area.
Most U.S. global health funding is provided bilaterally. In FY 2018, 81% of the U.S. global health budget was provided through bilateral programs. U.S. contributions to multilateral institutions account for the other 19%, the majority of which is provided to the Global Fund.90
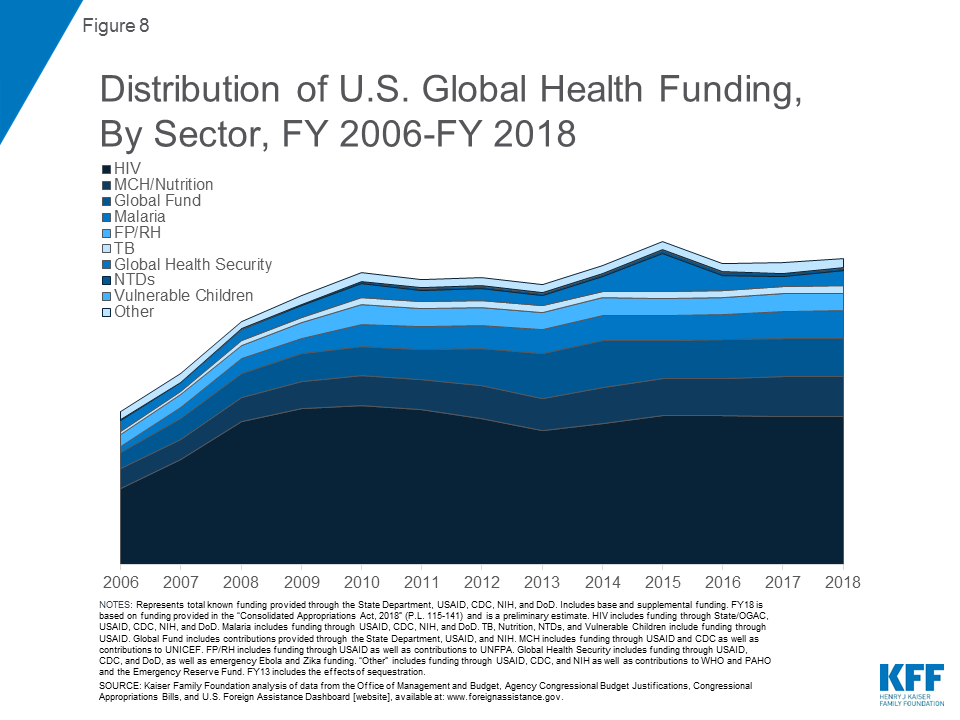
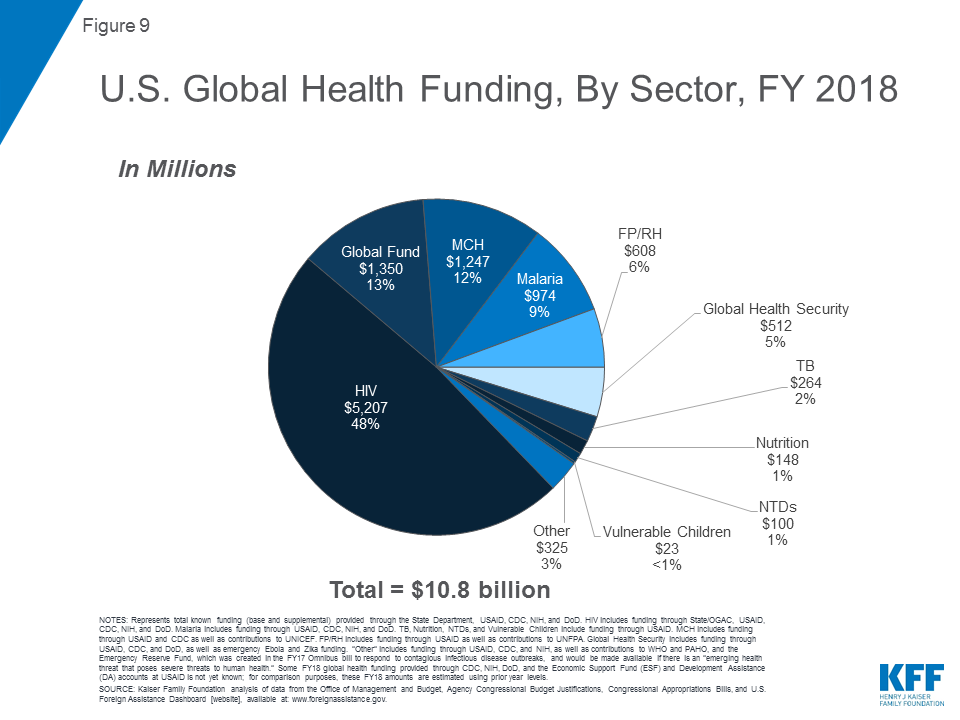
Bilateral HIV programs have received the most U.S. global health funding of any sector, accounting for approximately 50% of U.S. global health funding from FY 2006 through FY 2018 (see Figure 8). The Global Fund accounted for the next largest share over the period, followed by MCH (including nutrition) and malaria.91 The largest share of global health funding in FY 2018 is for bilateral HIV ($5.2 billion), followed by the Global Fund ($1.35 billion), MCH ($1.2 billion), malaria ($974 million), FP/RH ($608 million), Global Health Security ($512 million), TB ($264 million), nutrition ($148 million), NTDs ($100 million), and vulnerable children ($23 million).92 An additional $325 million is provided for other global health activities, which include contributions to WHO, the Pan American Health Organization (PAHO), research activities at the Fogarty International Center, and the Emergency Reserve Fund, which was created in the FY 2017 Omnibus bill to respond to contagious infectious disease outbreaks (see Figure 9).
Most U.S. global health funding is provided under the international affairs budget, which includes funding for USAID and the State Department. The State Department receives the majority of funding, largely due to the fact that most of PEPFAR’s funding is channeled through the State Department (see Figure 10). Prior to the creation of PEPFAR, the majority of U.S. global health funding was provided through USAID. In FY 2018, the State Department received $6.0 billion, followed by USAID ($3.3 billion), HHS ($1.2 billion), and DoD ($246 million).

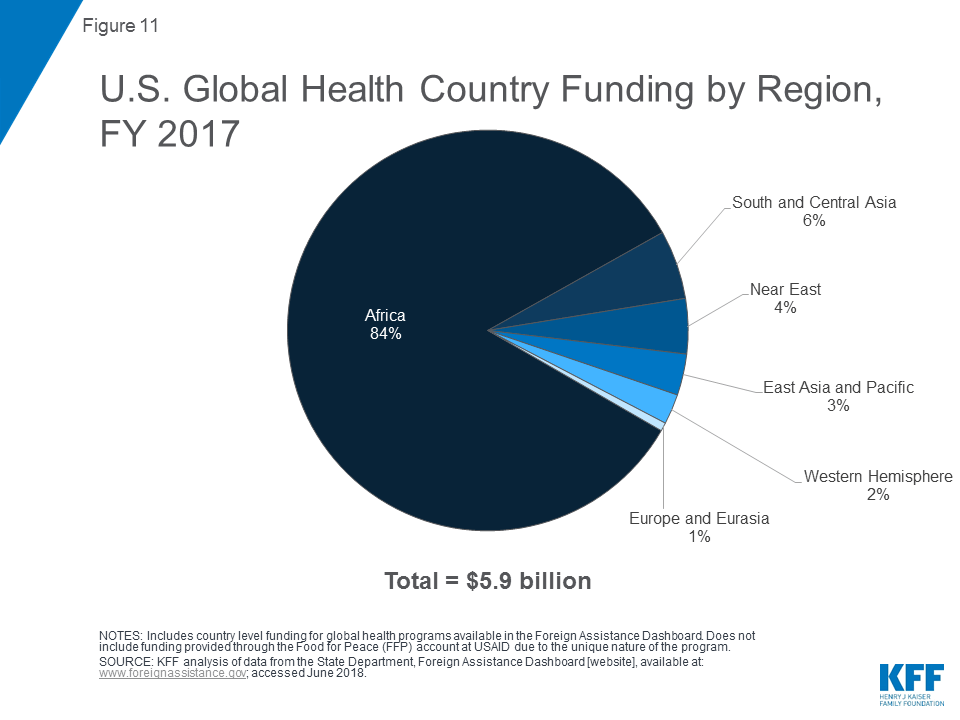
More than 80% of country funding is allocated for global health activities in Africa (see Figure 11), followed by South and Central Asia (6%), the Near East (4%), East Asia and Pacific (3%), the Western Hemisphere (2%), and Europe and Eurasia (1%). Nine of the top ten recipient countries of U.S. global health funding in FY 2017 were in Africa (see Figure 12). The top three recipients were: Kenya, Tanzania, and South Africa. African countries comprised the top 10 most heavily funded recipient countries for malaria and HIV/AIDS, six of 10 for FP/RH, seven of 10 for MCH, and seven of 10 for nutrition. Countries in South and Central Asia also received significant amounts of funding in multiple areas, particularly TB.

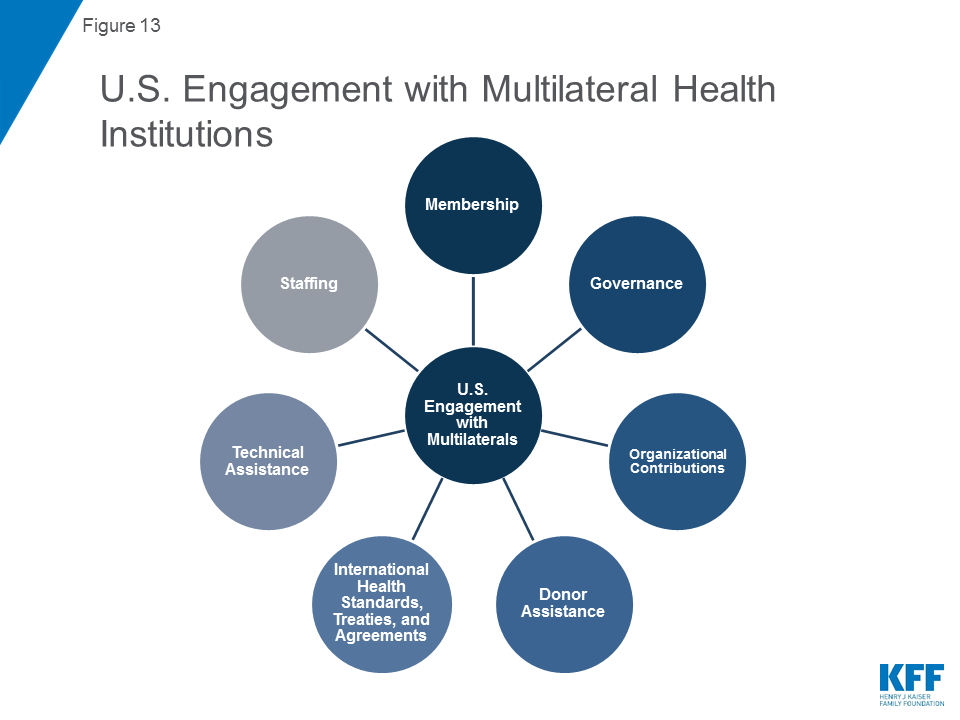
In addition to its own bilateral programs, the U.S. government has a long history of involvement with international health organizations, beginning with its role in the development of the first such organizations, including PAHO in the early 1900s and WHO a few decades later, and continuing through to the present with the Global Fund, which the U.S. helped to launch in 2001. Approximately 19% of U.S. global health funding was allocated to multilateral organizations in FY2018, including $1.35 billion for the Global Fund alone. Still, funding is only one of the ways the U.S. supports and engages with multilateral organizations (Figure 13). Some of the other ways include:
The U.S. also often contributes to several other multilateral organizations including the United Nations Children’s Fund (UNICEF), the Food and Agriculture Organization (FAO), the World Food Programme (WFP), the United Nations Development Programme (UNDP), and the United Nations Population Fund (UNFPA).96 The current Administration, however, has proposed pulling back engagement with some multilateral organizations, creating questions about future U.S. support.97 Lastly, the U.S. government also provides contributions to some of the world’s Multilateral Development Banks (MDBs, such as the World Bank and the Inter-American Development Bank), autonomous international agencies that finance development programs, including health programs, in low- and middle-income countries using borrowed money or funds contributed by donor countries.
U.S. engagement in global health spans many decades and has increased over time. Today, the U.S. global health architecture includes multiple agencies and programs and hundreds of international and local partners, and reaches most low- and middle-income countries around the world. The U.S. is also the largest funder of the global health response. Given its reach and funding, its future trajectory in this area will have a major impact on the world’s response to ongoing and new global health challenges.
| Departments/Agencies | House | Senate |
| Department of State (State) United States Agency for International Development (USAID) Millennium Challenge Corporation (MCC) |
|
|
Department of Health and Human Services (HHS)
|
|
|
| Department of Defense (DoD) |
|
|
| Department of Agriculture (USDA) |
|
|
| Peace Corps |
|
|
| Environmental Protection Agency (EPA) |
|
|
| Department of Homeland Security (DHS) |
|
|
| Department of Labor (DoL) |
|
|
| Department of Commerce (Commerce) |
|
|
| Office of the U.S. Trade Representative (USTR) |
|
|
| + All Subcommittees listed are part of House and Senate Standing Appropriations Committees | ||
| Year | Agency | Title | Purpose |
| 1798 | HHS | Act for the Relief of Sick and Disabled Merchant Seamen | Created the Marine Hospital Service, a federal network of hospitals for the care of merchant seamen. Renamed the “Public Health and Marine-Hospital Service” in 1902 and the Public Health Service in 1912.98 |
| 1930 | USDA | Foreign Agricultural Service Act of 1930 (P.L. 71-304) | Created the Foreign Agricultural Service (FAS) which today is part of the USDA. Among its responsibilities is the provision of food aid and technical assistance.99 |
| 1944 | HHS | Public Health Service Act (Title 42, U.S. Code) | The Public Health Service Act of July 1, 1944 (42 U.S.C. 201) consolidated and revised all existing legislation relating to the Public Health Service, outlined the policy framework for Federal-state cooperation in public health; and established regulatory authorities that transferred with PHS to the Department of Health, Education and Welfare (HEW) and subsequently to the Department of Health and Human Services (HHS). The scope of the Act has been significantly broadened over time. The full act is captured under Title 42 of the US Code, “The Public Health and Welfare.”100 |
| 1954 | USDAUSAID | Public Law 83-480. The Agricultural Trade Development Assistance Act of 1954, renamed The Food for Peace Act in 1961 | Authorized concessional sales of U.S. agricultural commodities to developing countries and private entities by USDA (Title 1); direct donation of U.S. agricultural commodities for emergency relief and development (Title II) and government-to-government grants of agricultural commodities tied to policy reform (Title 3), both assigned to USAID in 1961 (also known as P.L. 480).101 ,102 |
| 1960 | HHS | International Health Research Act of 1960 (Public Law 86-610) | To advance the health sciences through cooperative international research and training. Established the National Institute for International Health and Medical Research, to provide for international cooperation in health research, research training, and research planning, and for other purposes. Section 307 as amended (incorporated into USC Title 42) authorized the Secretary of HHS to enter into international cooperative agreements for biomedical and health activities.103 |
| 1961 | USAID, State | Public Law 87-195. The Foreign Assistance Act of 1961 (FAA) | Reorganized U.S. foreign assistance programs including separating military and non-military aid and mandated the creation of an agency to administer economic assistance programs, which led to the establishment of USAID. Act created a policy framework for foreign assistance to developing nations and mandated the creation of an agency to promote long-term assistance for economic and social development.104 ,105 |
| 1973 | USAID, State | Public Law 93-189. The New Directions Legislation of 1973 (in the Foreign Assistance Act of 1973) | Amended the FAA of 1961, directing USAID to focus its operational programs on five categories of assistance for meeting the basic needs of the poorest countries in the following areas: food and nutrition; population planning; health, education, and human resources development; selected development problems; selected countries and organizations.106 |
| 1984 | USAID, State | “Mexico City” Policy | President Reagan directive expanded prohibition on use of federal funds by foreign NGOs beyond existing requirements in the FAA of 1961, other law, and policies to also prohibit NGOs from using any funds, including non-federal funds, to “perform or actively promote abortion as a method of family planning” as a condition for receiving U.S. global family planning assistance. Rescinded in 1993 by President Clinton. Reinstated in 2001 by President Bush and extended to apply to “voluntary population planning” assistance provided by the Department of State. Rescinded by President Obama in 2009. Reinstated, and expanded to the vast majority of U.S. global health assistance, in 2017 by President Trump.107 |
| 1985 | USDA | The Food for Progress Act of 1985 (Public Law 99-198 (Title XI) | Authorized USDA to provide U.S. agricultural commodities to emerging democracies and developing countries committed to promoting free enterprise in agricultural development.108 |
| 1985 | DoD | Public Law 99-661 (Section 333) Humanitarian and Civic Assistance (HCA) program in the National Defense Authorization Act for Fiscal Year 1987, as amended in: Title 10 USC §401, §402 | Authorized U.S. military forces to carry out humanitarian and civic assistance activities in conjunction with other operations (such as joint exercises) if such activities support mutual U.S.-host country interests, build U.S. force operational readiness skills, and do not duplicate other USG assistance (401); permits the military to transport humanitarian supplies for NGOs without charge (“the Denton Amendment,” Section 402).109 ,110 |
| 1996 | Govt-wide; main roles for State, USAID, DoD, CDC, NIH | Presidential Decision Directive NSTC-7 on Emerging Infectious Diseases | White House established national policy to address emerging infectious disease threats through improved domestic and international surveillance, prevention, and response measures, as follow-up to National Science and Technology Council (NSTC) reports: “Infectious Disease – A Global Health Threat” (September 1995), “Meeting the Challenge — A Research Agenda for Health, Safety, and Food” (February 1996), and “Proceedings of the Conference on Human Health and Global Climate Change” (May 1996). Directive establishes standing NSTC Task Force on emerging infectious diseases.111 |
| 1999 | USAID, DoD, CDC | Leadership and Investment in Fighting an Epidemic (LIFE) Initiative | New program announced by President targeting funding for HIV to 14 hard hit countries in Africa and to India.112 |
| 1999 | DoD | Executive Order 13139 | Established the HIV and AIDS Research and Development Program within the Department of the Army.113 |
| 2000 | CDC | Public Law 106-113. Consolidated Appropriations Act of 2000, as described in House Report 106-419 | Congress first appropriated funding specifically for CDC’s international AIDS activities ($35 million), used to support the newly launched CDC Global AIDS Program (GAP).114 |
| 2000 | — | Appointment of Presidential Envoy for AIDS Cooperation | First U.S. envoy appointed to deal exclusively with a global health issue.115 |
| 2000 | USAID, CDC, NIH | Public Law 106-264. The Global AIDS and Tuberculosis Relief Act of 2000 | Authorized up to $600 million for U.S. global efforts on HIV and TB; Directed Secretary of the Treasury to enter into negotiations with the World Bank, other nations and interested parties to establish World Bank AIDS Trust Fund (what was to become the Global Fund to Fight AIDS, Tuberculosis and Malaria).116 |
| 2002 | USAID, CDC | International Mother and Child HIV Prevention Initiative | Announced by President as new multi-year $500 million initiative, focused on 12 African and 2 Caribbean countries.117 |
| 2001 | DoL | Public Law 106-554. Department of Labor Appropriations Act, 2001 | Authorized the DoL’s Bureau of International Labor Affairs to award funds under and administer DoL’s Global HIV/AIDS Workplace Education program.118 ,119 |
| 2002 | USDA,USAID | Public Law 107-171. The Farm Security and Rural Investment Act of 2002 | Reauthorized the Food for Peace Act through 2007 and provided the original authorization for McGovern–Dole International Food for Education and Child Nutrition Program through USDA’s Foreign Agricultural Service.120 |
| 2003 | State, USAID, DoD, Commerce, DoL, HHS, Peace Corps | Public Law 108-25. United States Leadership Against HIV/AIDS, Tuberculosis, and Malaria Act of 2003 | Required a comprehensive, integrated 5-year strategy for a coordinated USG response to global HIV/AIDS; established Office of the Global AIDS Coordinator in State; amended the Foreign Assistance Act of 1961 to define eligibility for HIV/AIDS assistance; mandated goals, benchmarks, and metrics for program evaluation; authorized up to $15 billion from FY 2004-8.121 |
| 2004 | FDA | Expedited Review of HIV Medications Under PEPFAR | New initiative announced for expedited review process for pharmaceutical products under PEPFAR, allowing any pharmaceutical industry sponsor worldwide to submit U.S. marketing applications for single entity, fixed dose combination (FDC), and co-packaged versions of previously approved antiretroviral therapies, even if a patent or market exclusivity in the U.S. remained in effect).122 |
| 2004 | State,Treasury, USTR, USAID, MCC | Title V, Public Law 108-199. The Millennium Challenge Act of 2003 (in the Consolidated Appropriations Act, 2004) | Established the MCC as USG corporation responsible for administering funds from the Millennium Challenge Account; outlined by-laws for operations and structure. The MCC Board of Directors is composed of the Secretary of State, the Secretary of Treasury, the U.S. Trade Representative, the Administrator of USAID, the CEO of the MCC and four public members appointed by the President.123 |
| 2005 | USAID,CDC | President’s Malaria Initiative (PMI). | Launch of new initiative committing $1.2 billion over five years to reduce malaria deaths by 50 percent in 15 African focus countries. Led by USAID, and implemented with CDC.124 |
| 2005 | USAID,CDC | Public Law 109-13. The Emergency Supplemental Appropriations Act for Defense, the Global War on Terror, and Tsunami Relief | Provided $25 million to USAID for programs to control the global spread of avian flu, and stipulated that $15 million of it be transferred to CDC.125 |
| 2005 | State, USAID, MCC, DoD, CDC, EPA, USDA, Peace Corps | Senator Paul Simon Water for the Poor Act of 2005 (P.L. 109-121; WfP Act) | Built on existing U.S. international water and sanitation programs and requires the Secretary of State, in consultation with USAID and other U.S. Government agencies, to develop and implement a strategy “to provide affordable and equitable access to safe water and sanitation in developing countries”. Among its key objectives is to increase access to, and effective use of, safe drinking water and sanitation to improve human health. |
| 2006 | USAID | Public Law 109-234. Emergency Supplemental Appropriations Act for Defense, the Global War on Terror, and Hurricane Recovery | Provided $30 million to USAID for activities related to international surveillance, planning, preparedness, and response to avian influenza.126 |
| 2006 | DoD | DoD Directive 6485.02E. HIV/AIDS Prevention: Support to Foreign Militaries | Stated in 2006 and reissued in 2013, assigned responsibilities to the ASD/HA and ASD(SO/LIC) for policy development and guidance for DOD HIV/AIDS prevention support to foreign militaries consistent with Public Law 108-25 (PEPFAR); designated Navy as DoD Executive Agent for technical and logistical support of the global Defense HIV/AIDS Prevention Program (DHAPP); established Coordinating Board for DoD international HIV/AIDS activities with foreign militaries.127 |
| 2008 | USAID | Neglected Tropical Diseases (NTD) Initiative | Launch of new President’s initiative to provide $350 million over five years to provide integrated treatment in Africa, Asia, and Latin America, targeting seven major NTDs.128 |
| 2008 | USDA, USAID | Public Law 110-246. The Food, Conservation, and Energy Act of 2008 (The Farm Bill) | Comprehensive reauthorization of all U.S. food and farm policies, including Food for Education, Food for Progress, and Food for Peace programs; re-titled Title I from “Trade and Development Assistance” to “Economic Assistance and Food Security.”129 |
| 2008 | State, USAID, DoD, Commerce, DoL, HHS, Peace Corps | Public Law 110-293. Tom Lantos and Henry J. Hyde United States Global Leadership Against HIV/AIDS, Tuberculosis, and Malaria Reauthorization Act of 2008 | Re-authorized PEPFAR, including an increased funding authorization of up to $48 billion over five years (FY2009-2013); extended the geographic and programmatic scope of HIV/AIDS, malaria, and tuberculosis control and prevention strategies; proposed use of framework agreements with recipient countries; removed some spending requirements on prevention efforts; endorsed health systems strengthening; and established a Global Malaria Coordinator in USAID.130 |
| 2013 | State, USAID, DoD, Commerce, DoL, HHS, Peace Corps | Public Law 113-56.PEPFAR Stewardship and Oversight Act of 2013 | Extended a number of existing authorities of PEPFAR and strengthened the oversight of the program through updated reporting requirements, among other things.131 |
| 2016 | State, USAID, USDA, Commerce, Treasury, Trade | Public Law 114-195.Global Food Security Act of 2016 | Reaffirmed the U.S. commitment to ending global hunger, poverty, and malnutrition.132 |
| 2016 | State, DoD, DoJ, Agriculture, HHS, Homeland Security, OMB, USAID, EPA, CDC, Office of Science and Technology Policy | Executive Order. Advancing the Global Health Security Agenda to Achieve a World Safe and Secure from Infectious Disease Threats | Advanced the Global Health Security Agenda (GHSA), a multi-country partnership that aims to accelerate progress in building country capacity to prevent, detect, and respond to infectious diseases. Establishes the U.S. commitment to achieving the targets of the GHSA.133 |
| 2017 | State, USAID, HHS, and others to be determined | Mexico City Policy | President Trump reinstated and expanded Mexico City Policy, first instated by President Reagan in 1984, repealed by President Clinton in 1993, reinstated by President Bush in 2001, and rescinded by President Obama in 2009 (see 1984 entry above),.134 |
| 2018 | State, USAID, DoD, Commerce, DoL, HHS, Peace Corps | Public Law 115-305.PEPFAR Extension Act of 2018 | Extended a number of existing authorities of PEPFAR through FY 2023 and FY2024, depending on the provision.135 |
| Country/Region | HIV/AIDS | Tuberculosis | Malaria | Neglected Tropical Diseases | Maternal and Child Health | Family Planning and Reproductive Health | Nutrition | Water Supply and Sanitation | Global Health Security | Other Public Health Threats |
| Africa | 27 | 11 | 25 | 17 | 20 | 21 | 13 | 16 | 12 | 0 |
| Angola | X | – | X | – | – | X | – | – | – | – |
| Benin | – | – | X | X | X | X | – | – | – | – |
| Botswana | X | – | – | – | – | – | – | – | – | – |
| Burkina Faso | – | – | X | X | – | – | – | – | – | – |
| Burundi | X | – | X | – | X | X | – | – | – | – |
| Cameroon | X | – | X | X | – | – | – | – | – | – |
| Côte d’Ivoire | X | – | X | X | – | – | – | – | X | – |
| Democratic Republic of Congo | X | X | X | X | X | X | X | X | – | – |
| Djibouti | X | – | – | – | – | – | – | – | – | – |
| Egypt | – | – | – | – | – | X | – | – | – | – |
| Eswatini | X | – | – | – | – | – | – | – | – | – |
| Ethiopia | X | X | X | X | X | X | X | X | X | – |
| Ghana | X | – | X | X | X | X | X | X | X | – |
| Guinea | – | – | X | X | X | X | – | – | X | – |
| Guinea-Bissau | – | – | – | – | – | – | – | – | X | |
| Kenya | X | X | X | – | X | X | X | X | X | – |
| Lesotho | X | – | – | – | – | – | – | – | – | – |
| Liberia | X | – | X | – | X | X | – | X | X | – |
| Madagascar | – | – | X | – | X | X | – | X | – | – |
| Malawi | X | X | X | – | X | X | X | X | – | – |
| Mali | X | – | X | X | X | X | X | X | – | – |
| Mozambique | X | X | X | X | X | X | X | X | – | – |
| Namibia | X | – | – | – | – | – | – | – | – | – |
| Niger | – | – | X | X | – | – | – | – | – | – |
| Nigeria | X | X | X | X | X | X | X | X | – | – |
| Rwanda | X | – | X | – | X | X | X | X | – | – |
| Senegal | X | – | X | X | X | X | X | X | – | – |
| Sierra Leone | X | – | X | X | – | – | – | – | X | – |
| South Africa | X | X | – | – | – | – | – | – | X | – |
| South Sudan | X | – | – | – | X | – | – | X | – | – |
| Tanzania | X | X | X | X | X | X | X | X | X | – |
| Togo | – | – | – | X | – | – | – | – | – | – |
| Uganda | X | X | X | X | X | X | X | X | X | – |
| Zambia | X | X | X | – | X | X | X | X | – | – |
| Zimbabwe | X | X | X | – | X | X | – | – | X | – |
| East Asia and Pacific | 5 | 4 | 2 | 5 | 5 | 3 | 2 | 2 | 5 | 0 |
| Burma | X | X | X | – | X | – | – | – | – | – |
| Cambodia | X | X | X | X | X | X | X | – | – | – |
| Indonesia | X | X | – | X | X | – | – | X | X | – |
| Laos | – | – | – | X | – | – | X | – | – | – |
| Malaysia | – | – | – | – | – | – | – | – | X | – |
| Mongolia | – | – | – | – | – | – | – | – | X | – |
| Papua New Guinea | X | – | – | – | – | – | – | – | – | – |
| Philippines | – | X | – | X | X | X | – | X | – | – |
| Thailand | – | – | – | – | – | – | – | – | X | – |
| Timor-Leste | – | – | – | – | X | X | – | – | – | – |
| Vietnam | X | – | – | X | – | – | – | – | X | – |
| Europe and Eurasia | 1 | 1 | 0 | 0 | 1 | 0 | 0 | 0 | 4 | 0 |
| Azerbaijan | – | – | – | – | – | – | – | – | X | – |
| Georgia | – | – | – | – | – | – | – | – | X | – |
| Turkey | – | – | – | – | – | – | – | – | X | – |
| Ukraine | X | X | – | – | X | – | – | – | X | – |
| Near East | 0 | 0 | 0 | 0 | 1 | 1 | 0 | 4 | 2 | 1 |
| Jordan | – | – | – | – | X | X | – | X | X | X |
| Lebanon | – | – | – | – | – | – | – | X | – | – |
| West Bank and Gaza | – | – | – | – | – | – | – | X | – | – |
| Yemen | – | – | – | – | – | – | – | X | X | – |
| South and Central Asia | 3 | 6 | 0 | 2 | 6 | 5 | 4 | 4 | 3 | 1 |
| Afghanistan | X | X | – | – | X | X | X | X | – | X |
| Bangladesh | – | X | – | X | X | X | X | – | X | – |
| India | X | X | – | – | X | X | – | X | X | – |
| Kyrgyzstan | – | X | – | – | – | – | – | – | – | – |
| Nepal | X | – | – | X | X | X | X | X | – | – |
| Pakistan | – | – | – | – | X | X | – | – | X | – |
| Tajikistan | – | X | – | – | X | – | X | X | – | – |
| Uzbekistan | – | X | – | – | – | – | – | – | – | – |
| Western Hemisphere | 3 | 0 | 0 | 7 | 2 | 2 | 2 | 3 | 3 | 0 |
| Brazil | X | – | – | X | – | – | – | – | – | – |
| Colombia | – | – | – | X | – | – | – | – | X | – |
| Chile | – | – | – | – | – | – | – | – | X | – |
| Ecuador | – | – | – | X | – | – | – | – | – | – |
| Dominican Republic | X | – | – | – | – | – | – | X | – | – |
| Guatemala | – | – | – | X | X | X | X | X | – | – |
| Haiti | X | – | – | X | X | X | X | X | – | – |
| Mexico | – | – | – | X | – | – | – | – | – | – |
| Peru | – | – | – | – | – | – | – | – | X | – |
| Venezuela | – | – | – | X | – | – | – | – | – | – |
| Total | 39 | 22 | 27 | 31 | 35 | 32 | 21 | 29 | 29 | 2 |
| Source: KFF analysis of data from the State Department, Foreign Assistance Dashboard [website], available at: http://www.foreignassistance.gov; accessed June 2018. USAID, Countries Supported by USAID’s NTD Program, available at: https://www.neglecteddiseases.gov/where-we-work accessed June 2018. USAID, Countries Supported by USAID’s Global Health Security Agenda Program, available at: https://www.usaid.gov/what-we-do/global-health/health-systems/countries accessed June 2018. | ||||||||||
Medicare Part D has helped to make prescription drugs more affordable for people with Medicare, yet many beneficiaries continue to face high out-of-pocket costs for their medications. Specialty tier drugs—defined by Medicare as drugs that cost more than $670 per month in 2019—are a particular concern for Part D enrollees in this context. Part D plans are allowed to charge between 25 percent and 33 percent coinsurance for specialty tier drugs before enrollees reach the coverage gap, where they pay 25 percent for all brands, followed by 5 percent coinsurance when total out-of-pocket spending exceeds an annual threshold ($5,100 in 2019). While specialty tier drugs are taken by a relatively small share of enrollees, spending on these drugs has increased over time and now accounts for over 20 percent of total Part D spending, up from about 6 to 7 percent before 2010.
Despite Medicare’s protections, Part D enrollees with serious health problems can face thousands of dollars in annual out-of-pocket costs for specialty drugs.
This analysis draws on data from Medicare’s Plan Finder website to calculate expected annual 2019 out-of-pocket costs for 30 specialty tier drugs used to treat four health conditions—cancer, hepatitis C, multiple sclerosis, and rheumatoid arthritis. For each drug, we calculate the median annual out-of-pocket cost across all plans that cover the drug, based on coverage in stand-alone prescription drug plans (PDPs) and costs at a pharmacy in zip code 21201 (Baltimore, MD). We use one zip code to represent PDP costs nationally because most PDPs are offered on a national or near-national basis (including 24 of the 25 PDPs in the 21201 zip code), and it is common for PDPs to use the same formulary and the same specialty tier coinsurance rate in all regions. As such, our findings are broadly applicable to a majority of PDP enrollees nationwide. (See Methods for additional details.)
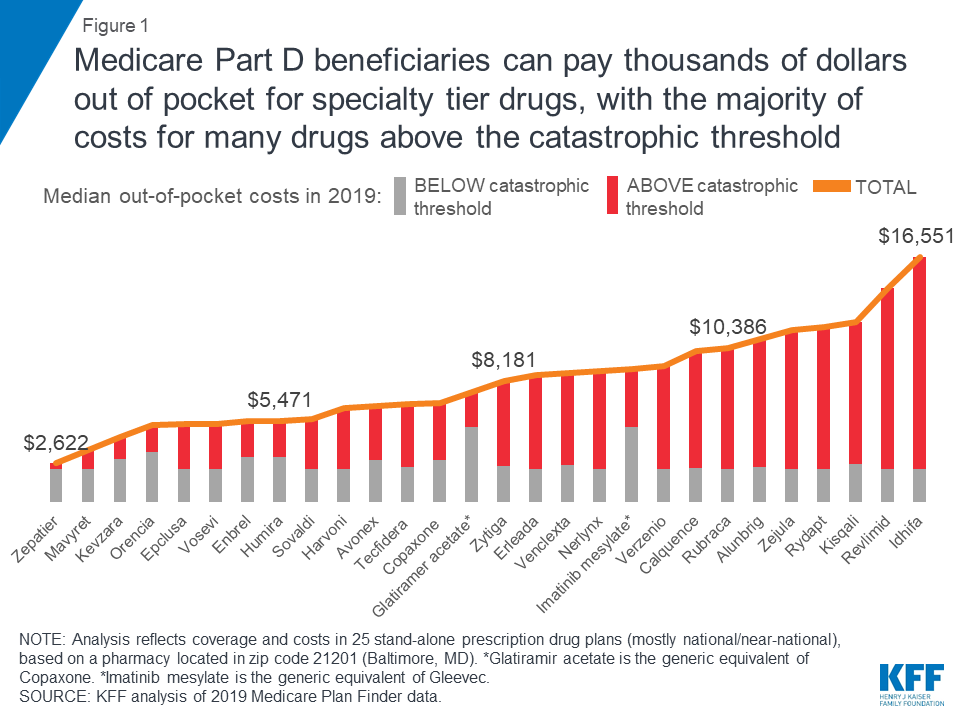
Part D enrollees can face thousands of dollars in annual out-of-pocket costs if they take expensive drugs, despite having catastrophic coverage. Expected annual out-of-pocket costs in 2019 average $8,109 across the 28 specialty tier drugs covered by some or all plans in this analysis. For 28 of the 30 studied specialty drugs used to treat four health conditions—cancer, hepatitis C, multiple sclerosis (MS), and rheumatoid arthritis (RA)—expected annual out-of-pocket costs for a single drug in 2019 range from $2,622 for Zepatier, a treatment for hepatitis C, to $16,551 for Idhifa, a leukemia drug. Two of the 30 drugs are not covered by any plan in our analysis. (See Tables 1 and 2 for drug-specific cost and coverage information.)
Part D enrollees taking high-cost specialty tier drugs often incur significant costs in the catastrophic coverage phase of the benefit because the catastrophic threshold is not an absolute limit on out-of-pocket spending. For the 28 specialty tier drugs in our analysis covered by some or all plans, the share of annual out-of-pocket costs that would be incurred in the catastrophic phase in 2019 ranges from 13 percent for Zepatier to 86 percent for Idhifa; for 19 of these drugs, enrollees can expect to pay more than half of their annual out-of-pocket cost in the catastrophic phase. On average across these 28 specialty drugs, 61 percent of annual out-of-pocket costs occur above the catastrophic threshold in 2019, which translates to $5,444 in out-of-pocket costs in the catastrophic phase alone.
Medicare Part D enrollees without low-income subsidies who take any of the specialty tier drugs in our analysis for various types of cancer would pay more out of pocket for these medications in 2019 than enrollees who take any of the specialty drugs for the other health conditions in this analysis. Fourteen of the 15 studied specialty tier cancer drugs are covered by all plans, and the median annual out-of-pocket cost for each of these drugs exceeds $8,000. One of the 15 cancer drugs, Gleevec, is not covered by any plan in our analysis in 2019, but the generic equivalent, imatinib mesylate, is covered by all plans, which is sufficient to meet the formulary coverage requirement that plans cover all or substantially all drugs in six so-called “protected” classes, including cancer drugs.
Expected annual out-of-pocket costs in 2019 for the 14 covered specialty tier cancer drugs range from $8,181 for Zytiga (for prostate cancer) to $16,551 for Idhifa (for leukemia) (Figure 2). Part D enrollees taking any of the brand-name cancer drugs in our analysis for the full year would pay at least 70 percent of their total annual out-of-pocket costs above the catastrophic threshold in 2019. For example, 84 percent of an enrollee’s out-of-pocket costs for Revlimid, a drug to treat multiple myeloma, would occur in the catastrophic phase, which translates to $12,186 in costs for this drug in the catastrophic phase alone in 2019. For imatinib mesylate, the generic equivalent for Gleevec, the share of costs above the catastrophic coverage threshold is lower (43%) because enrollees taking this drug do not receive a manufacturer discount in the coverage gap and therefore would incur higher out-of-pocket costs below the catastrophic coverage threshold.
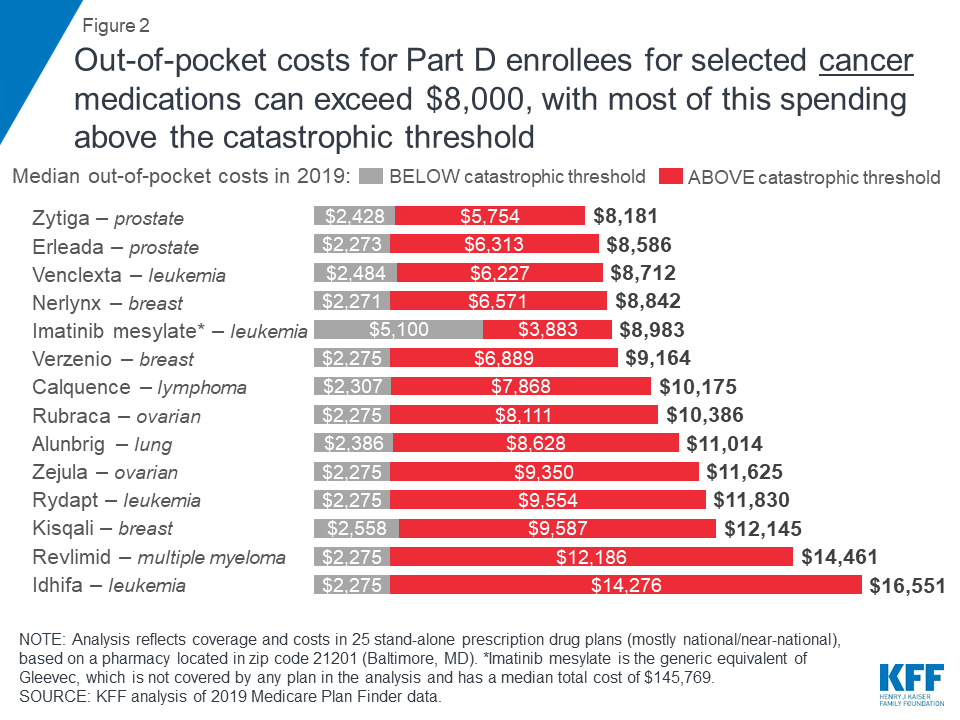
Out-of-pocket spending for breakthrough therapies used to treat and cure hepatitis C represents a significant burden for Part D enrollees who do not receive low-income subsidies, even though costs for some of these drugs have fallen over time as new competitor products have come to market.
Expected annual out-of-pocket costs in 2019 for six of the seven hepatitis C drugs in our analysis range from $2,622 for Zepatier to $6,338 for Harvoni (Figure 3). (A previously published version of this brief reported lower costs for Harvoni, based on the default quantity in the Medicare Plan Finder (28 pills/year), which is lower than the recommended quantity (84 pills/year). The estimates in this report have been updated to reflect the recommended quantity, resulting in higher costs for Harvoni. See Methods for additional details.) One of the seven drugs, Viekira Pak, is not covered by any of the plans in our analysis. For four hepatitis C drugs in our analysis (Epclusa, Vosevi, Sovaldi, and Harvoni), Part D enrollees can expect to pay more than half of their total out-of-pocket costs in the catastrophic phase in 2019, based on a full year of use. For example, 60 percent of an enrollee’s out-of-pocket costs for Sovaldi would occur in the catastrophic phase, which translates to $3,368 in costs for this drug in the catastrophic phase alone in 2019.
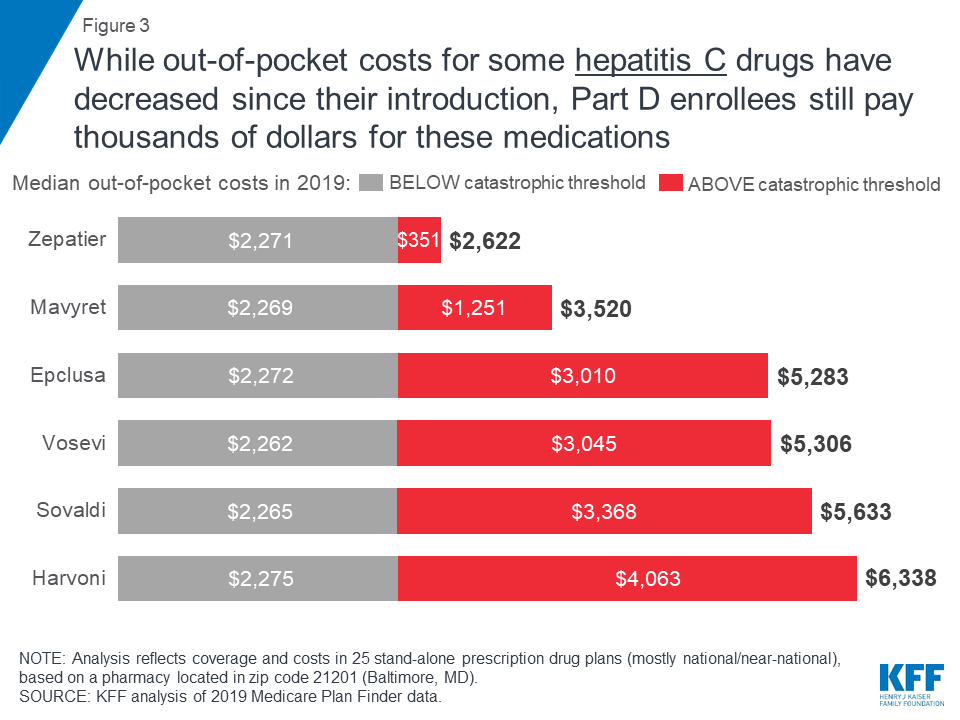
Expected annual out-of-pocket costs in 2019 for the four specialty tier drugs in our analysis used to treat multiple sclerosis range from $6,507 for Avonex to $7,409 for glatiramer acetate (the generic equivalent of Copaxone) (Figure 4). An enrollee taking any of the three brand-name MS drugs in our analysis (Avonex, Copaxone, and Tecfidera) can expect to pay more than half of their total annual out-of-pocket costs in the catastrophic phase.
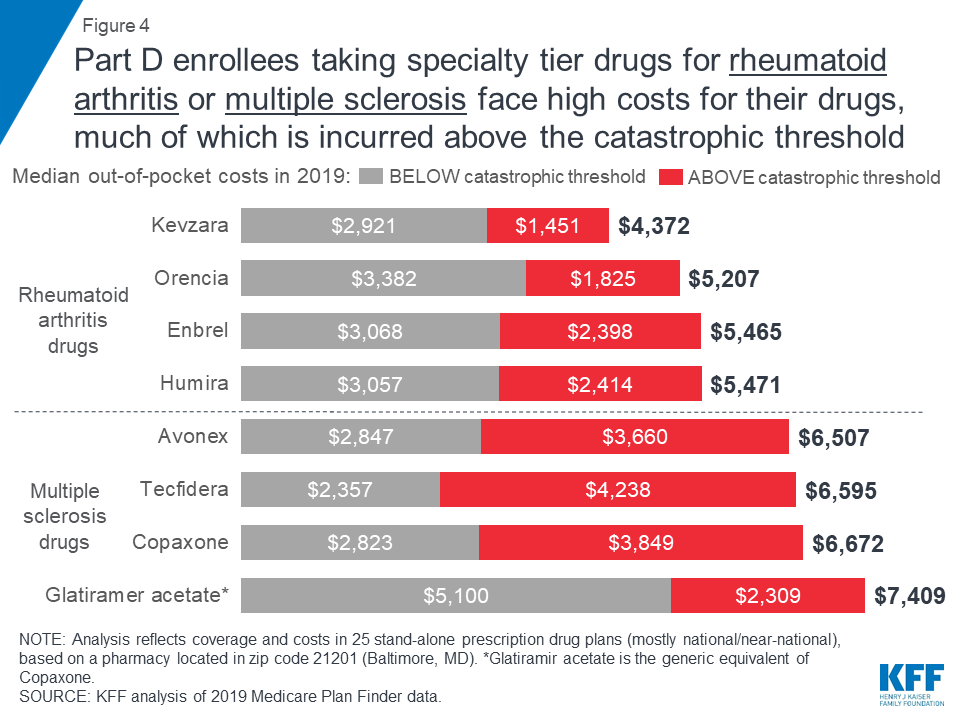
Expected annual out-of-pocket costs for glatiramer acetate are actually higher than costs for the brand Copaxone in 2019—and higher than out-of-pocket costs for the other branded MS drugs—while the share of out-of-pocket costs above the catastrophic threshold is lower. This is because enrollees who take the brand Copaxone would reach the catastrophic phase sooner than those who take the generic equivalent, because they receive a 70 percent manufacturer discount on the brand, which counts towards the annual out-of-pocket spending amount that triggers catastrophic coverage. This discount is not offered to those who use generic drugs, so more of their annual spending would occur below the catastrophic coverage threshold, where they face a higher coinsurance rate in the coverage gap (37%) than those who take brands (25%).
For Part D enrollees taking any of the four specialty tier drugs in our analysis for rheumatoid arthritis, expected annual out-of-pocket costs in 2019 range from $4,372 for Kevzara to $5,471 for Humira (Figure 4). At least one-third of total annual out-of-pocket costs for each of these drugs would be incurred by Part D enrollees after their spending exceeds the catastrophic threshold. For example, Part D enrollees taking either Humira or Enbrel would pay 44 percent of their total annual out-of-pocket costs above the catastrophic threshold in 2019, based on a full year of use, which translates to costs of $2,414 for Humira and $2,398 for Enbrel in the catastrophic phase alone.
Part D plans must adhere to specific formulary guidelines laid out by Medicare, such as covering a minimum of two drugs in each therapeutic class and covering all or substantially all drugs in six protected classes, but plans can omit drugs from their formularies for a variety of reasons. Having flexibility in formulary design means that plan sponsors may be able to leverage steeper rebates or discounts from a drug manufacturer by excluding a competitor’s product from its formulary or placing the competitor’s drug on a non-preferred tier. Part D enrollees may benefit from negotiated rebates if lower overall plan costs translates to lower plan premiums. But Part D enrollees who are prescribed a drug that is not covered by their plan would either have to pay the total cost of the drug on their own (which is unlikely in the case of expensive specialty tier medications), switch to an alternative medication that is covered by their plan, or appeal to their plan to cover their drug that is not on the formulary.
Sixteen of the 30 studied specialty drugs are covered by all plans in our analysis in 2019, 14 of which are for cancer, which is one of the six protected classes. In contrast, 12 of the studied specialty drugs are not covered by some plans and two drugs are not covered by any plan in our analysis (Figure 5).
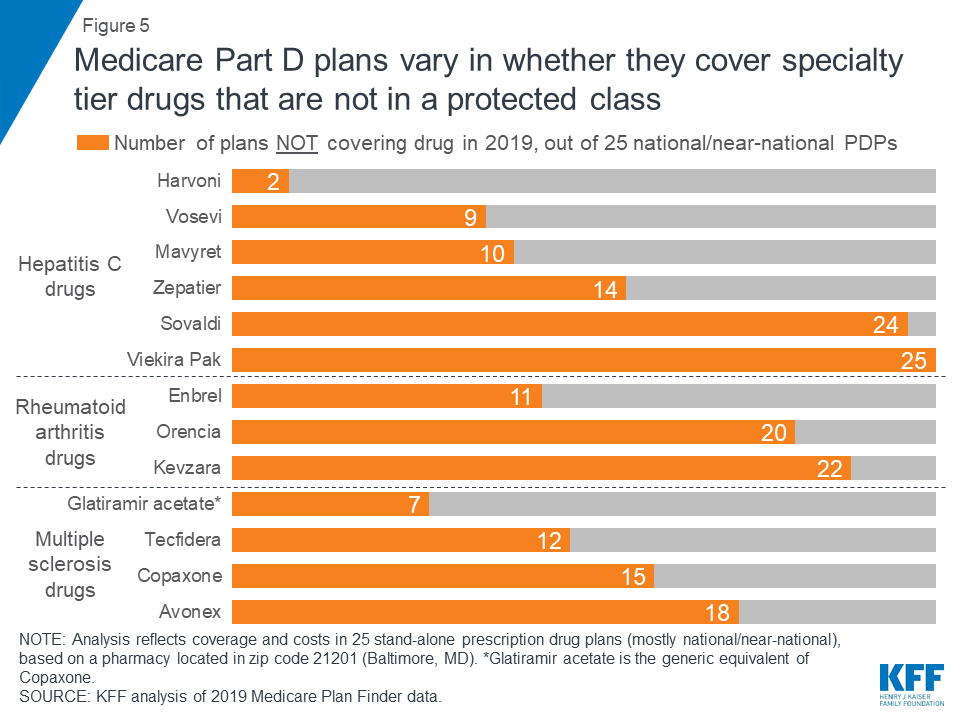
Some plans cover a larger number of specialty drugs to treat each condition than other plans (outside of the protected-class cancer drugs). None of the 25 plans in this analysis covers all of the specialty tier drugs for hepatitis C, multiple sclerosis, or rheumatoid arthritis, and there is wide variation across plans in how many drugs they cover for each condition. For example, of the four MS drugs in our analysis, nine of the 25 plans cover just one of the four drugs, another nine plans cover two, and four plans cover three.
The annual cost for a specialty tier drug that is not covered on a plan’s formulary is substantially greater than the cost of that drug when it is covered. For the 14 specialty drugs in our analysis that are not covered by some or all plans, the median total annual cost when off formulary ranges from $26,209 for Zepatier to $145,769 for Gleevec—amounts that exceed the limits of affordability for the vast majority of Part D enrollees.
For the 12 specialty tier drugs in our analysis covered by some but not all plans, the median annual cost among plans that do not cover the drug is at least 10 times higher than the median out-of-pocket cost when it is covered (Figure 6). For example, the total median annual off-formulary cost for the hepatitis C drug Mavyret, is $47,521 compared to $3,520 in median annual out-of-pocket costs when covered; the total median annual off-formulary cost for the MS drug Tecfidera is $106,070, compared to $6,595 in median out-of-pocket costs when covered.
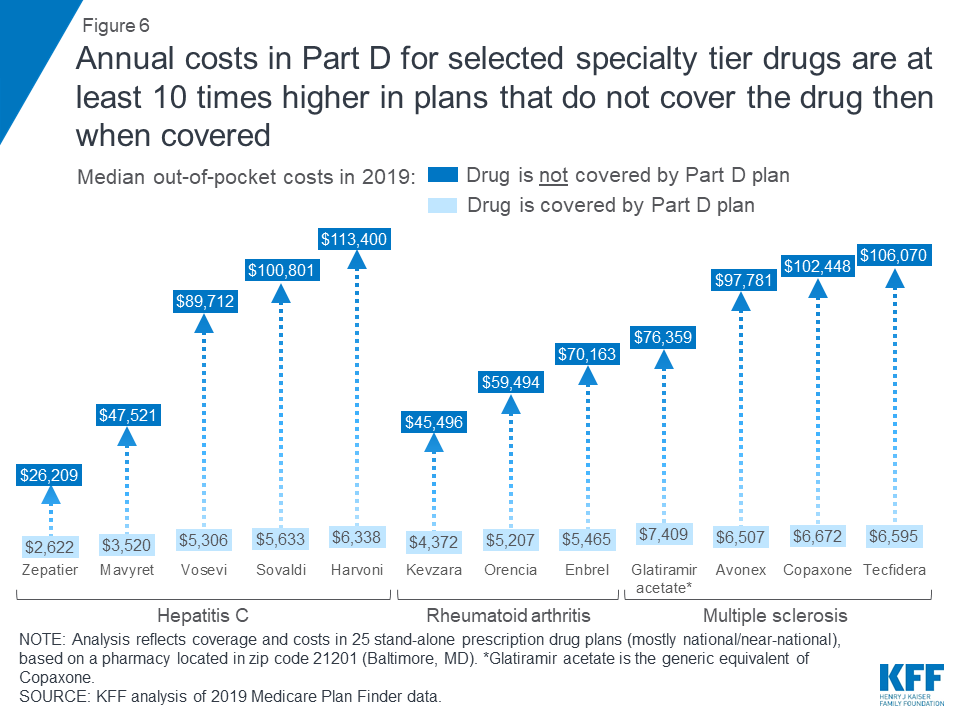
To examine the change in out-of-pocket costs for specialty tier drugs over time, we compared 2016 and 2019 costs for 10 of the 30 drugs in our current analysis that were included in our prior study and covered by at least one plan in 2019. In 2019, expected annual out-of-pocket costs for eight of the 10 specialty tier drugs are 12 percent higher than in 2016, on average (an increase of $873) (Figure 7, Table 3). For two of the 10 drugs, Harvoni and Sovaldi—both used to treat hepatitis C—median annual out-of-pocket costs in 2019 are 13 percent lower than in 2016, on average (a decrease of $896), possibly due to the entrance of competitor products since the end of 2015, and other factors related to changes in the benefit design (lower cost sharing in the gap, the manufacturer price discount, and a higher out-of-pocket threshold for catastrophic coverage), combined with the limited duration of treatment for hepatitis C drugs, that translate to a reduction in annual out-of-pocket costs for enrollees taking these two drugs in 2019. Of the 12 specialty tier drugs in our previous analysis, two drugs (Viekira Pak and Gleevec) are not covered by any plan in our analysis in 2019, so we could not calculate a change in the median out-of-pocket cost for these drugs.
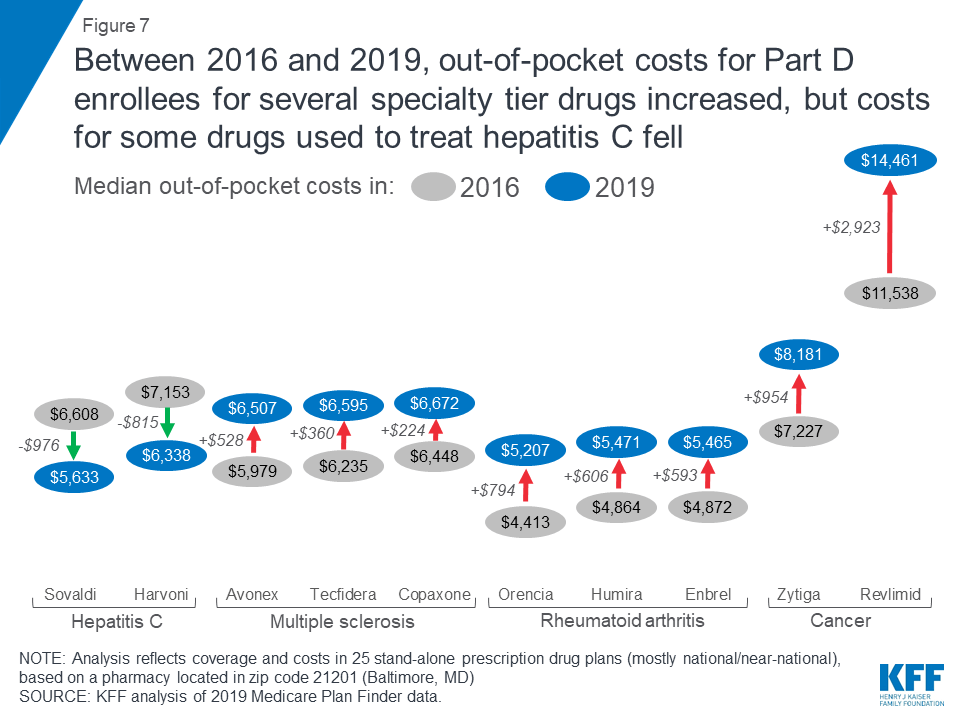
For the eight specialty drugs in our analysis in both years where Part D enrollees can expect to pay more out-of-pocket in 2019 than in 2016, median annual cost increases range from $224 for the MS drug Copaxone to $2,923 for Revlimid, a drug for multiple myeloma. The expected annual out-of-pocket cost for Copaxone is $6,672 in 2019, up from $6,448 in 2016, while the expected annual cost for Revlimid increased from $11,538 to $14,461 over these years. Conversely, median annual out-of-pocket costs for two hepatitis C specialty drugs decreased between 2016 and 2019—by $976 for Sovaldi (from $6,608 to $5,633) and $815 for Harvoni (from $7,153 to $6,338).
With the now-complete closure of the Part D coverage gap for brand-name drugs, enrollees who take selected specialty tier drugs can expect to face lower out-of-pocket costs below the catastrophic threshold in 2019 than in 2016, but higher costs above. Under the current benefit design, beneficiaries pay 25 percent of total costs for brand-name drugs in the coverage gap in 2019, down from 45 percent in 2016, and the manufacturer discount on brand-name drugs in the coverage gap increased from 50 percent to 70 percent between 2018 and 2019, generating even greater savings for enrollees taking brand-name drugs with spending in the coverage gap.
As an example, for Humira, median out-of-pocket costs below the catastrophic coverage threshold decreased by $99 between 2016 and 2019 (from $3,155 to $3,057), while costs above the catastrophic threshold increased by $705 over these years (from $1,709 to $2,414)—and in total, expected annual out-of-pocket costs for Humira are $606 (12%) higher in 2019 than in 2016 (Figure 8).

Thus, while the closing of the coverage gap has reduced out-of-pocket costs for Part D enrollees who reach the gap but not the catastrophic phase of the benefit, enrollees can expect to see higher annual out-of-pocket costs for several specialty tier drugs in 2019 compared to 2016. This is because higher underlying prices for these drugs translate to higher out-of-pocket costs in the catastrophic phase of the benefit, where beneficiaries pay 5 percent of the price of the drug, which more than offsets any savings from lower costs in the gap.
This analysis shows that Medicare Part D enrollees who do not receive low-income subsidies can expect to pay thousands of dollars in out-of-pocket costs for a single specialty tier drug in 2019, even though the Part D coverage gap for brands is now fully closed. Although Part D offers catastrophic coverage for high drug costs, beneficiaries can still face substantial out-of-pocket costs for expensive medications, including many drugs for cancer, hepatitis C, multiple sclerosis, and rheumatoid arthritis, because there is no hard cap on spending in the Part D benefit. Part D enrollees who need specialty tier drugs that are not covered by their plan could be exposed to substantial costs—which would likely mean not filling a prescription for the off-formulary drug and instead taking a therapeutic substitute.
The high cost of prescription drugs has contributed to growing public support for the government to take action to address drug costs. A majority (80%) of Americans say the cost of prescription drugs is unreasonable, and there is broad support among Democrats, Republicans, and Independents for several different options to lower drug costs. The Trump Administration has endorsed a number of proposals to address rising drug costs for Medicare and beneficiaries, including adding a hard cap on Part D out-of-pocket spending. The Administration has also proposed changes to reduce spending on drugs covered under Part B, including a proposal to benchmark U.S. prices against prices set internationally. Lawmakers in Congress are also moving forward with proposals to reduce drug costs, including allowing Medicare to negotiate drug costs, letting patients import prescription drugs from Canada, and expediting the introduction of generic and other prescription drugs. As more expensive drugs come to market in the future, the high cost of prescription drugs will continue to be a pressing issue for policymakers and a major pocketbook issue for patients.
| Table 1: Expected Annual Costs in Medicare Part D Plans for 30 Specialty Tier Drugs, 2019 | ||||||
| Health condition | Drug name | Full drug costs | Out-of-pocket drug costs | |||
| Off formulary | On formulary | On formulary | ||||
| Median annual total cost | Median annual total cost | Median annual out-of-pocket cost | Cost above catastrophic threshold | Percent of median cost above threshold | ||
| Cancer | Alunbrig | N/A | $187,893 | $11,014 | $8,628 | 78% |
| Calquence | N/A | $171,481 | $10,175 | $7,868 | 77% | |
| Erleada | N/A | $137,553 | $8,586 | $6,313 | 74% | |
| Gleevec | $145,787 | N/A | N/A | N/A | N/A | |
| Idhifa | N/A | $300,858 | $16,551 | $14,276 | 86% | |
| Imatinib mesylate | N/A | $91,844 | $8,983 | $3,883 | 43% | |
| Kisqali | N/A | $207,084 | $12,145 | $9,587 | 79% | |
| Nerlynx | N/A | $143,175 | $8,842 | $6,571 | 74% | |
| Revlimid | N/A | $259,051 | $14,461 | $12,186 | 84% | |
| Rubraca | N/A | $176,789 | $10,386 | $8,111 | 78% | |
| Rydapt | N/A | $206,423 | $11,830 | $9,554 | 81% | |
| Venclexta | N/A | $135,686 | $8,712 | $6,227 | 71% | |
| Verzenio | N/A | $150,126 | $9,164 | $6,889 | 75% | |
| Zejula | N/A | $202,330 | $11,625 | $9,350 | 80% | |
| Zytiga | N/A | $125,351 | $8,181 | $5,754 | 70% | |
| Hepatitis C | Epclusa | N/A | $75,538 | $5,283 | $3,010 | 57% |
| Harvoni | $113,400 | $96,732 | $6,338 | $4,063 | 64% | |
| Mavyret | $47,522 | $40,393 | $3,520 | $1,251 | 36% | |
| Sovaldi | $100,802 | $82,747 | $5,633 | $3,368 | 60% | |
| Viekira Pak | $99,985 | N/A | N/A | N/A | N/A | |
| Vosevi | $89,713 | $76,256 | $5,306 | $3,045 | 57% | |
| Zepatier | $26,210 | $22,377 | $2,622 | $351 | 13% | |
| Multiple sclerosis | Avonex | $97,799 | $85,532 | $6,507 | $3,660 | 56% |
| Copaxone | $102,456 | $89,614 | $6,672 | $3,849 | 58% | |
| Glatiramer acetate | $76,375 | $60,385 | $7,409 | $2,309 | 31% | |
| Tecfidera | $106,088 | $92,285 | $6,595 | $4,238 | 64% | |
| Rheumatoid arthritis | Enbrel | $70,171 | $60,621 | $5,465 | $2,398 | 44% |
| Humira | N/A | $59,078 | $5,471 | $2,414 | 44% | |
| Kevzara | $45,514 | $39,809 | $4,372 | $1,451 | 33% | |
| Orencia | $59,511 | $48,838 | $5,207 | $1,825 | 35% | |
| NOTE: Analysis reflects coverage and costs in 25 stand-alone prescription drug plans (mostly national/near-national), based on a pharmacy located in zip code 21201 (Baltimore, MD). ‘N/A’ is not applicable.SOURCE: KFF analysis of 2019 Medicare Plan Finder data. | ||||||
| Table 2: Formulary Tier Placement and Utilization Management Restrictions in Medicare Part D Plans for 30 Specialty Tier Drugs, 2019 | ||||||||
| Formulary tier placement | Utilization management restrictions | |||||||
| Number of plans placing drug on: | Off formulary | Number of plans requiring: | ||||||
| Health Condition | Drug Name | Preferred brand tier | Non-preferred drug tier | Specialty tier | Prior authorization | Quantity limits | Step therapy | |
| Cancer | Alunbrig | 0 | 4 | 21 | 0 | 25 | 16 | 0 |
| Calquence | 0 | 4 | 21 | 0 | 25 | 16 | 0 | |
| Erleada | 0 | 0 | 25 | 0 | 25 | 10 | 0 | |
| Gleevec | 0 | 0 | 0 | 25 | 0 | 0 | 0 | |
| Idhifa | 0 | 0 | 25 | 0 | 25 | 16 | 0 | |
| Imatinib mesylate | 0 | 0 | 25 | 0 | 25 | 24 | 0 | |
| Kisqali | 0 | 4 | 21 | 0 | 25 | 15 | 0 | |
| Nerlynx | 0 | 0 | 25 | 0 | 25 | 11 | 0 | |
| Revlimid | 0 | 4 | 21 | 0 | 25 | 24 | 0 | |
| Rubraca | 0 | 0 | 25 | 0 | 25 | 15 | 0 | |
| Rydapt | 0 | 0 | 25 | 0 | 25 | 16 | 0 | |
| Venclexta | 0 | 7 | 18 | 0 | 25 | 14 | 0 | |
| Verzenio | 0 | 4 | 21 | 0 | 25 | 16 | 0 | |
| Zejula | 0 | 0 | 25 | 0 | 25 | 16 | 0 | |
| Zytiga | 0 | 6 | 19 | 0 | 25 | 15 | 0 | |
| Hepatitis C | Epclusa | 1 | 0 | 24 | 0 | 25 | 15 | 0 |
| Harvoni | 1 | 0 | 22 | 2 | 23 | 13 | 0 | |
| Mavyret | 0 | 0 | 15 | 10 | 15 | 6 | 0 | |
| Sovaldi | 0 | 0 | 1 | 24 | 1 | 1 | 0 | |
| Viekira Pak | 0 | 0 | 0 | 25 | 0 | 0 | 0 | |
| Vosevi | 0 | 0 | 16 | 9 | 16 | 6 | 0 | |
| Zepatier | 0 | 0 | 11 | 14 | 11 | 2 | 0 | |
| Multiple sclerosis | Avonex | 0 | 0 | 7 | 18 | 6 | 6 | 0 |
| Copaxone | 0 | 0 | 10 | 15 | 10 | 10 | 0 | |
| Glatiramer acetate | 0 | 0 | 18 | 7 | 15 | 15 | 0 | |
| Tecfidera | 0 | 0 | 13 | 12 | 11 | 8 | 0 | |
| Rheumatoid arthritis | Enbrel | 1 | 0 | 13 | 11 | 14 | 12 | 0 |
| Humira | 1 | 0 | 24 | 0 | 25 | 21 | 0 | |
| Kevzara | 0 | 0 | 3 | 22 | 3 | 3 | 0 | |
| Orencia | 0 | 0 | 5 | 20 | 5 | 0 | 0 | |
| NOTE: Analysis reflects coverage and costs in 25 stand-alone prescription drug plans (mostly national/near-national), based on a pharmacy located in zip code 21201 (Baltimore, MD).SOURCE: KFF analysis of 2019 Medicare Plan Finder data. | ||||||||
| Table 3: Expected Annual Costs in Medicare Part D Plans for 12 Specialty Tier Drugs, 2016 and 2019 | ||||||
| Health condition | Drug name | Full cost(when covered) | Median out-of-pocket cost up to catastrophic phase | Median out-of-pocket cost in catastrophic phase | Total median out-of-pocket cost | |
| Cancer | Gleevec* | 2016 | $123,158 | $2,780 | $5,723 | $8,503 |
| 2019 | n/a | n/a | n/a | n/a | ||
| change | n/a | n/a | n/a | n/a | ||
| Revlimid | 2016 | $183,517 | $2,780 | $8,758 | $11,538 | |
| 2019 | $259,051 | $2,275 | $12,186 | $14,461 | ||
| change | $75,534 | -$505 | $3,428 | $2,923 | ||
| Zytiga | 2016 | $97,314 | $2,780 | $4,447 | $7,227 | |
| 2019 | $125,351 | $2,428 | $5,754 | $8,181 | ||
| change | $28,037 | -$352 | $1,307 | $954 | ||
| Hepatitis C | Harvoni | 2016 | $95,824 | $2,780 | $4,373 | $7,153 |
| 2019 | $96,732 | $2,275 | $4,063 | $6,338 | ||
| change | $908 | -$505 | -$310 | -$815 | ||
| Sovaldi | 2016 | $85,177 | $2,780 | $3,828 | $6,608 | |
| 2019 | $82,747 | $2,265 | $3,368 | $5,633 | ||
| change | -$2,430 | -$515 | -$460 | -$976 | ||
| Viekira Pak* | 2016 | $82,936 | $2,786 | $3,730 | $6,516 | |
| 2019 | n/a | n/a | n/a | n/a | ||
| change | n/a | n/a | n/a | n/a | ||
| Multiple sclerosis | Avonex | 2016 | $64,173 | $3,141 | $2,838 | $5,979 |
| 2019 | $85,532 | $2,847 | $3,660 | $6,507 | ||
| change | $21,359 | -$294 | $822 | $528 | ||
| Copaxone | 2016 | $73,922 | $3,143 | $3,305 | $6,448 | |
| 2019 | $89,614 | $2,823 | $3,849 | $6,672 | ||
| change | $15,692 | -$320 | $544 | $224 | ||
| Tecfidera | 2016 | $69,393 | $3,167 | $3,068 | $6,235 | |
| 2019 | $92,285 | $2,357 | $4,238 | $6,595 | ||
| change | $22,892 | -$811 | $1,170 | $360 | ||
| Rheumatoid arthritis | Enbrel | 2016 | $41,564 | $3,196 | $1,676 | $4,872 |
| 2019 | $60,621 | $3,068 | $2,398 | $5,465 | ||
| change | $19,057 | -$128 | $721 | $593 | ||
| Humira | 2016 | $42,059 | $3,155 | $1,709 | $4,864 | |
| 2019 | $59,078 | $3,057 | $2,414 | $5,471 | ||
| change | $17,019 | -$99 | $705 | $606 | ||
| Orencia | 2016 | $38,407 | $2,856 | $1,557 | $4,413 | |
| 2019 | $48,838 | $3,382 | $1,825 | $5,207 | ||
change | $10,432 | $527 | $268 | $794 | ||
| NOTE: Analysis reflects coverage in 20 stand-alone prescription drug plans in 2016 and 25 stand-alone prescription drug plans (mostly national/near-national), based on a pharmacy located in zip code 21201 (Baltimore, MD). *Viekira Pak and Gleevec are not covered by any plan in our analysis in 2019.SOURCE: KFF analysis of 2016 and 2019 Medicare Plan Finder data. | ||||||
All data were collected from the Medicare Plan Finder website in November-December 2018, using zip code 21201 in Baltimore, MD, which corresponds to prescription drug plan (PDP) region 5, covering Washington, D.C., Delaware, and Maryland—the same zip code used in our previous analysis. Data were collected for the 25 stand-alone PDPs in Region 5, 24 of which are offered by nine firms that sponsor plans on a national or near-national basis (at least 33 of the 34 PDP regions, excluding the territories). Medicare Advantage drug plans were excluded from the analysis because plan participation varies geographically and few plans are offered on a national or near-national basis.
We use one zip code to represent PDP costs nationally because most PDPs (including 24 of the 25 PDPs in Region 5) are offered on a national or near-national basis; 20 of the 25 PDPs in Region 5 are offered in all 34 PDP regions and 4 are offered in 33 regions; one PDP is offered in only four PDP regions. Based on our analysis of January 2019 enrollment data from the Centers for Medicare & Medicaid Services, the 25 PDPs in this analysis have a total of 19.4 million enrollees across all regions where they are offered, which is 76.5 percent of total PDP enrollment nationwide. As such, the analysis is broadly applicable to a majority of PDP enrollees nationwide.
Moreover, it is common for PDPs to use the same formulary and the same formulary tier structure in all regions. Some of the national and near-national PDPs have modest regional variation in cost-sharing amounts for generic and brand-name drugs, and there may be modest variation in the full price of drugs across pharmacies and regions, but there is no variation in the specialty tier coinsurance rate, which is the cost-sharing tier relevant to the drugs in our analysis in the vast majority of cases.
For all drugs and plans in our analysis, cost and coverage data were collected from a Rite Aid pharmacy on Martin Luther King Jr. Boulevard in Baltimore, which was a standard cost-sharing pharmacy for 14 PDPs in Region 5 and a preferred cost-sharing pharmacy for 10 PDPs in this region. For one of the 25 PDPs (Aetna Medicare Rx Select), the Rite Aid pharmacy was out of network; therefore, for this plan, we obtained cost and coverage information from a CVS pharmacy on Charles Street in Baltimore. It is important to note that the standard versus preferred cost-sharing pharmacy distinction is generally not relevant for our analysis, because none of the 25 PDPs in Region 5 vary their specialty tier coinsurance rate by pharmacy type.
Our analysis focused on 30 specialty tier drugs across four health conditions that are commonly treated by specialty drugs: cancer, hepatitis C, multiple sclerosis, and rheumatoid arthritis. The list of 30 drugs includes 12 from our original 2016 analysis, which were available at the end of 2015, and an additional 18 drugs that were approved by the FDA in the intervening years (2016, 2017, and 2018, through November) for the four health conditions in our analysis and which are covered by Medicare Part D (as opposed to Part B) (as verified by the 09/14/18 version of the 2019 Medicare Part D formulary reference file).
For 19 of the 30 specialty tier drugs in our analysis, the dosage, form, and quantity of the medication used per month were taken from the defaults offered by the Medicare Plan Finder. For 11 drugs, the Plan Finder dosage, form, and/or quantity did not match the dosage and administration recommendations in the prescribing information for each drug available from the FDA, so we modified the Plan Finder dosages, forms, and/or quantities accordingly.
For each drug, we collected information on the full cost (price), cost-sharing amounts paid by enrollees not receiving low-income subsidies (LIS), tier placement, and utilization management restrictions.
We calculated a drug’s expected full cost in 2019 when covered by calculating the median of the annual total cost for each drug among plans that include that drug on formulary, based on a full year of utilization (or in the case of the hepatitis C drugs, for the recommended treatment duration, which is typically 12 weeks); the full cost of non-covered drugs is the median of the annual total cost for each drug among plans that do not include the drug on formulary. We calculated expected annual out-of-pocket costs for each drug by calculating the median of the total annual out-of-pocket cost that a non-LIS enrollee in each plan would pay for the given drug in 2019, based on a full year of utilization (or in the case of the hepatitis C drugs, for the full treatment duration, which is typically 12 weeks), among plans that include that drug on formulary, excluding the monthly plan premium.
Cost information is presented on an annual basis because the 30 studied drugs are priced high enough that out-of-pocket costs are determined based on all benefit phases (deductible, initial coverage level, coverage gap, and catastrophic coverage).
The full cost of the drug is shown on the Medicare Plan Finder. The amount shown if the drug is on formulary is based on the drug’s unit price and dispensing fee as submitted by the plan. For off-formulary drugs, prices are inserted by CMS using a standard formula to approximate cash pricing: the wholesale acquisition cost (WAC) plus 15 percent for brands and WAC plus 20 percent for generics. The WAC is a publicly available list price that approximates what retail pharmacies pay wholesalers for single source drugs and is taken by CMS from the Medispan database, with First Data Bank as a backup. For the drugs in this analysis, the CMS-supplied price tends to be about 10 percent to 20 percent higher than the median price for plans with the drug on formulary.
Cost sharing is shown on the Medicare Plan Finder for four phases of the Part D drug benefit. Cost sharing in the deductible phase (where applicable) is equal to the full cost of the drug. Cost sharing in the initial coverage phase is determined based on the tier placement and cost-sharing structure for the particular plan; the specialty tier coinsurance rate ranges from 25 percent to 33 percent. Cost sharing in the coverage gap phase is based on a statutory formula that takes into account the statutory manufacturer’s discount for most brand drugs (70 percent in 2019) and a required coinsurance amount (25 percent in 2019). Cost sharing in the catastrophic phase is based on a statutory rule: the greater of 5 percent of the full cost of the drug or a nominal copayment amount.
Tier placement is also shown on the Medicare Plan Finder for each drug, as is the use of utilization management restrictions, including prior authorization, step therapy, and quantity limits.
