Medicare Part D in 2018: The Latest on Enrollment, Premiums, and Cost Sharing
Issue Brief
Summary
This analysis presents findings on Medicare Part D enrollment, premiums, and cost sharing in 2018 and key trends over time, based on data from the Centers for Medicare & Medicaid Services (CMS).
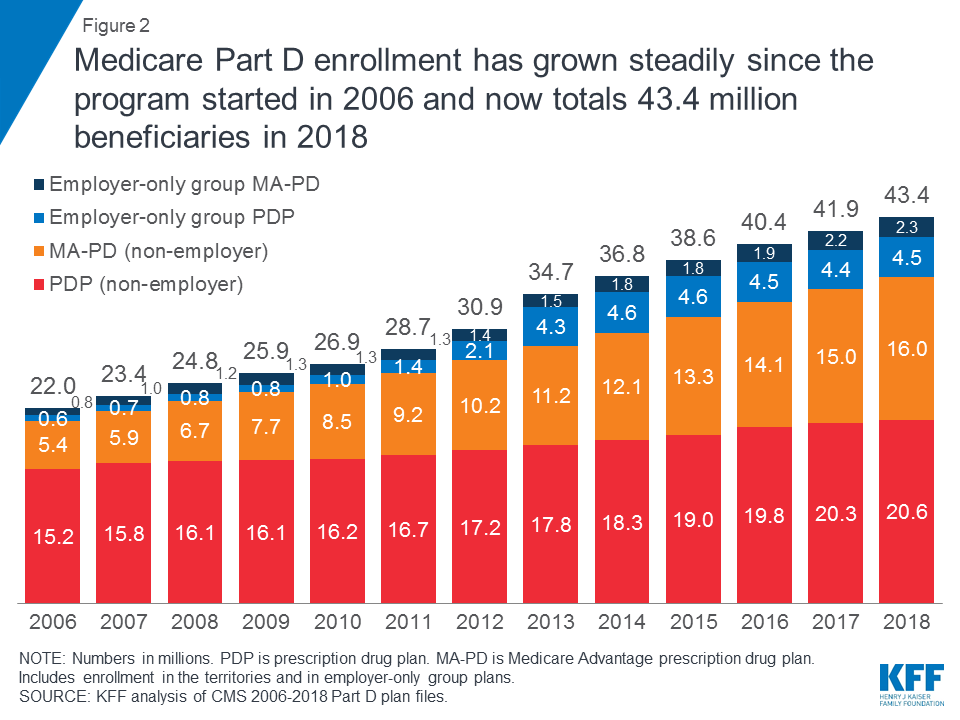
- Enrollment: In 2018, 43 million of the 60 million people with Medicare have prescription drug coverage under a Medicare Part D plan; most (58%) are covered under a stand-alone prescription drug plan (PDP) but a growing share (42% in 2018) are in Medicare Advantage prescription drug plans (MA-PDs), which also provide other Medicare-covered benefits. More than 12 million Part D enrollees receive premium and cost-sharing assistance through the Part D Low-Income Subsidy (LIS) program.
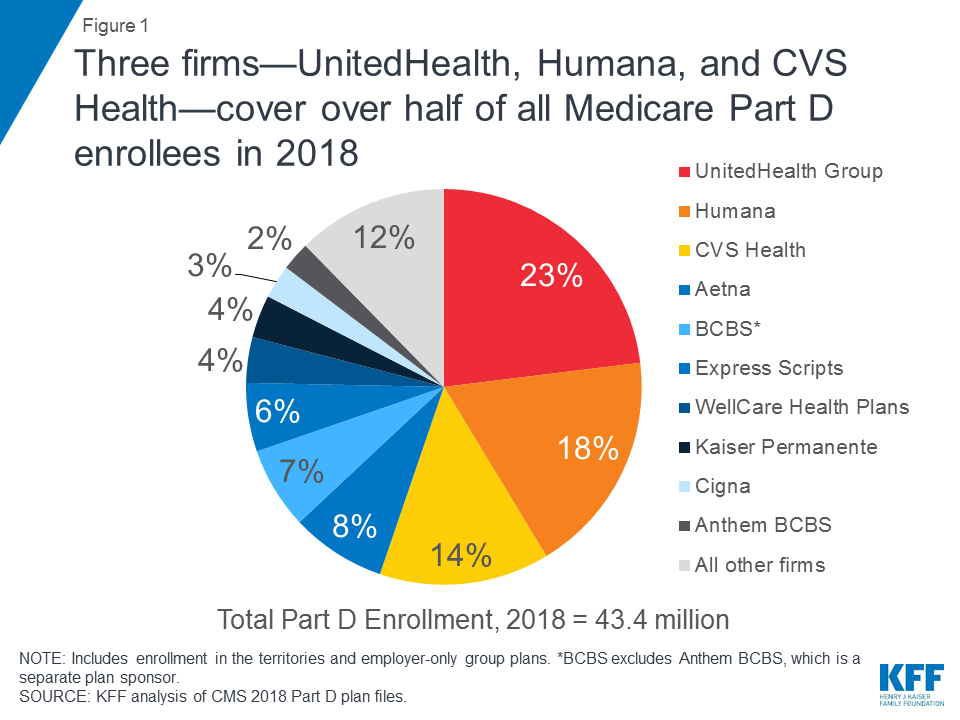
- Three firms—UnitedHealth, Humana, and CVS Health—account for over half (55%) of all Part D (PDP and MA-PD) enrollees in 2018 (Figure 1).
- Premiums: Monthly Part D PDP premiums average $41 in 2018, but premiums vary widely among the most popular PDPs, ranging from $20 per month for Humana Walmart Rx to $84 per month for AARP Medicare Rx Preferred. Overall, average monthly PDP premiums increased by a modest 2 percent in 2018.
- Deductibles: More than 4 in 10 PDP and MA-PD enrollees are in plans that charge no Part D deductible, but a larger share of PDP enrollees than MA-PD enrollees are in plans that charge the standard deductible amount of $405 in 2018.
- Cost sharing for generics and brands: Most Part D enrollees face modest cost-sharing amounts for generic drugs but can face much higher cost sharing for brands and non-preferred drugs, and a mix of copayments and coinsurance for different formulary tiers. For example, for PDP enrollees, median cost sharing ranges from $1 for preferred generics to $37 for preferred brands, and a 40% coinsurance rate for non-preferred drugs.
- Specialty drugs: More than 4 in 10 Part D enrollees are in plans that charge 33 percent coinsurance for specialty tier drugs, defined by CMS as drugs that cost at least $670.
Findings
Enrollment
More than 43 million Medicare beneficiaries, or 72 percent of all Medicare beneficiaries nationwide, are enrolled in Part D plans.
This total includes plans open to everyone and employer-only group plans for retirees of a former employer or union (Figure 2). Most Part D enrollees (58 percent) are in stand-alone prescription drug plans (PDPs), but a rising share (42 percent in 2018, up from 28 percent in 2006) are in Medicare Advantage prescription drug plans (MA-PDs), reflecting overall enrollment growth in Medicare Advantage.
In 2018, three Part D sponsors account for more than half of all Part D enrollees and two-thirds of all PDP enrollees.
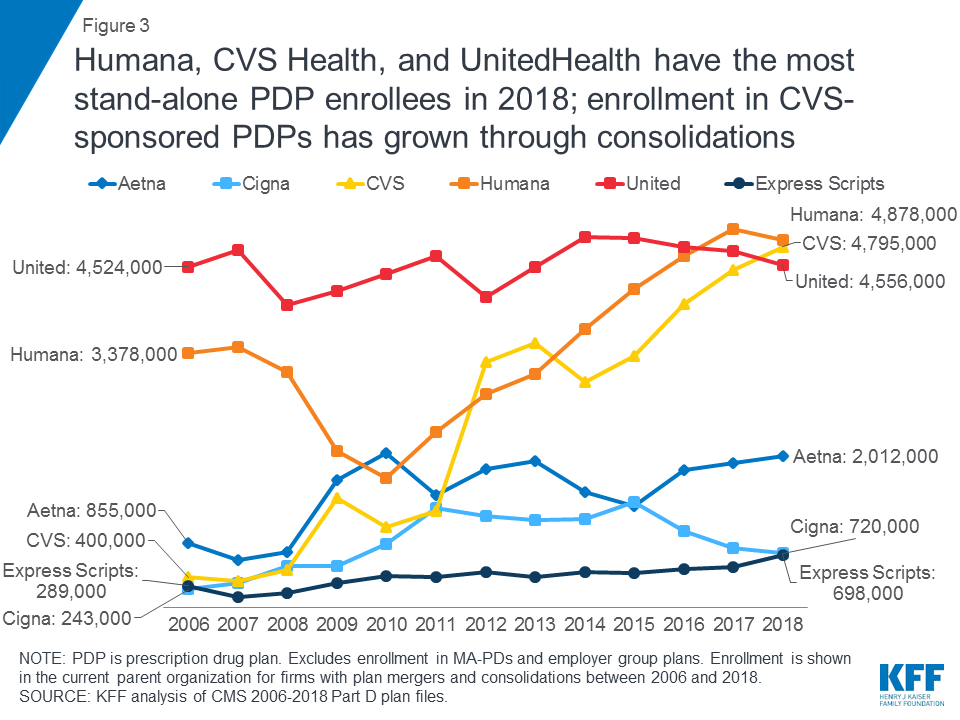
UnitedHealth, Humana, and CVS Health cover more than half (55%) of all beneficiaries enrolled in Part D in 2018, and two-thirds (67%) of all stand-alone PDP enrollees (Table 1). UnitedHealth and Humana have had large market shares since the program began, while enrollment in CVS Health has grown over time through acquisition of other plan sponsors (Figure 3).
The proposed mergers of CVS Health and Aetna, and Cigna and Express Scripts would result in further consolidation of the Part D marketplace. If these mergers go through, four firms—the two merged firms plus UnitedHealth and Humana—would cover 71 percent of all Part D enrollees and 86 percent of stand-alone drug plan enrollees, based on 2018 enrollment.
The ten largest sponsors of Part D plans account for nearly 90 percent of all enrollment.
UnitedHealth has maintained the top position since the Part D program started, and in 2018 provides coverage to nearly one quarter of Part D enrollees, when PDP and MA-PD enrollment is combined (Table 1). Among all plan sponsors, UnitedHealth has the most MA-PD enrollees in 2018, while CVS Health has the most PDP enrollees.
At the state level, UnitedHealth is the top firm in terms of 2018 Part D enrollment in 26 states and territories, and is one of the top 3 firms in 44 states/territories (Figure 4, Table 2). Humana is the top firm in 17 states/territories, and is one of the top 3 firms in 41 states/territories.

CVS Health, which sponsors PDPs but not MA-PDs, is the top Part D firm in only 6 states/territories, but is among the top 3 firms in 35. Together, three firms—UnitedHealth, Humana, and CVS Health—occupy all of the top 3 spots in terms of Part D 2018 enrollment in 19 states and territories (in varying orders).
Among PDPs, at the plan level, SilverScript Choice PDP (sponsored by CVS Health) has the most enrollees in 2018, covering more than 1 in 10 Part D enrollees, or 4.6 million (Table 3). This total is nearly double that of the second most popular plan, AARP MedicareRx Preferred (sponsored by UnitedHealth), with 2.6 million enrollees.
Premiums
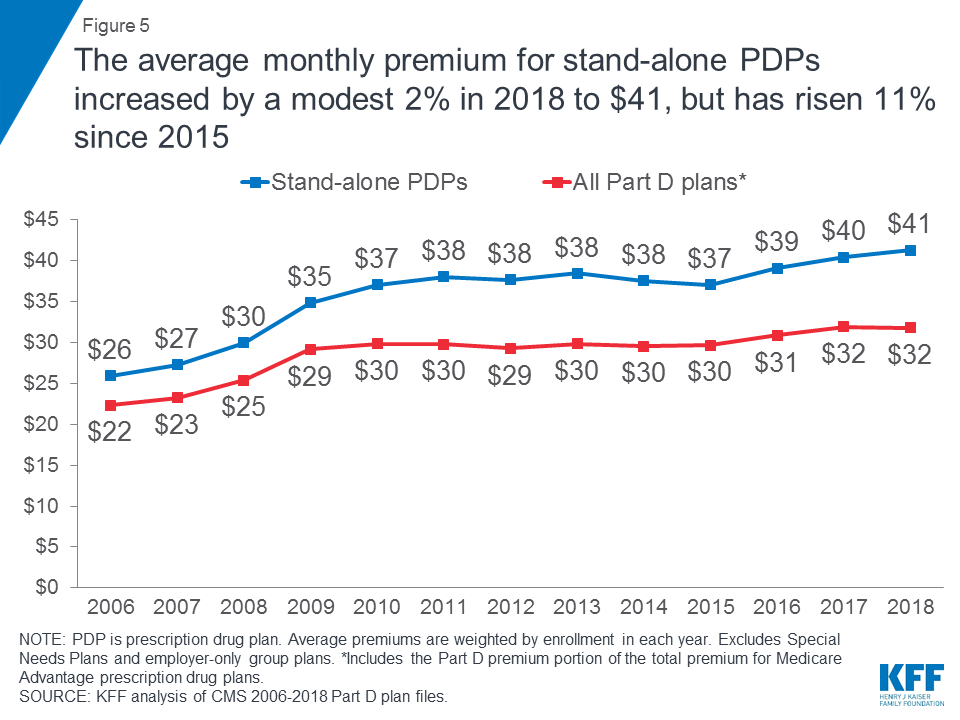
PDP premiums have risen modestly in recent years; for 2018, the average PDP premium is $41 per month.
PDP enrollees are in plans with an average monthly premium of $41 in 2018, a modest 2 percent increase over 2017 but up by 11 percent since 2015 (Figure 5). The combined average Part D premium for PDP and MA-PD enrollees is $32 in 2018. This is lower than the average for PDPs due in part to the ability of MA-PD sponsors to use rebate dollars from Medicare payments for benefits covered under Parts A and B to lower their Part D premiums. The average MA-PD premium is $34 in 2018, which includes Part D and other benefits.
Premiums for 7 of the 10 most popular PDPs increased in 2018, and continue to vary widely across plans.
Monthly premiums for 2 of the 10 largest PDPs–AARP MedicareRx Preferred and Humana Enhanced—increased by more than $10 in 2018 (Figure 6). Premium decreases among the top PDPs were generally of a smaller magnitude; for example, the average monthly premium for SilverScript Choice, the PDP with the most enrollees, fell by $3.
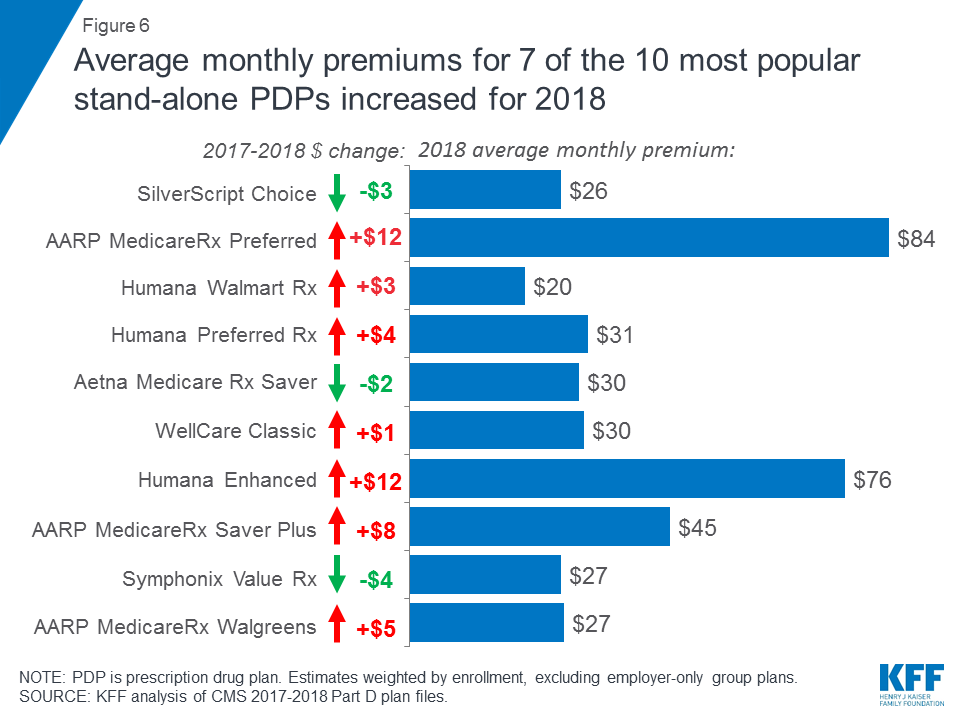
Monthly premiums in 2018 vary widely among the most popular PDPs. Premiums range from $20 per month for Humana Walmart Rx to four times more—$84 per month—for AARP Medicare Rx Preferred.
Among the top 5 PDPs, those plans with lower premiums in 2018 than in 2017 generally have higher enrollment in 2018 than in 2017, and vice versa.
Among several of the top PDPs, there appears to be an inverse relationship between premium changes from 2017 to 2018 and the year-to-year change in voluntary enrollment among enrollees who are not receiving low-income subsidies (LIS). (Low-income enrollees may be reassigned automatically in response to premium increases under certain circumstances.)
For example, the monthly premium for SilverScript Choice fell by $3 for 2018 (from $29 to $26), and its non-LIS enrollment increased by 12 percent between 2017 and 2018 (Figure 7). By contrast, the premium for AARP MedicareRx Preferred increased by $12 for 2018 (from $72 to $84), and its non-LIS enrollment decreased by 10 percent between 2017 and 2018. These enrollment changes take into account both enrollment of new Part D enrollees and plan changes by current enrollees.
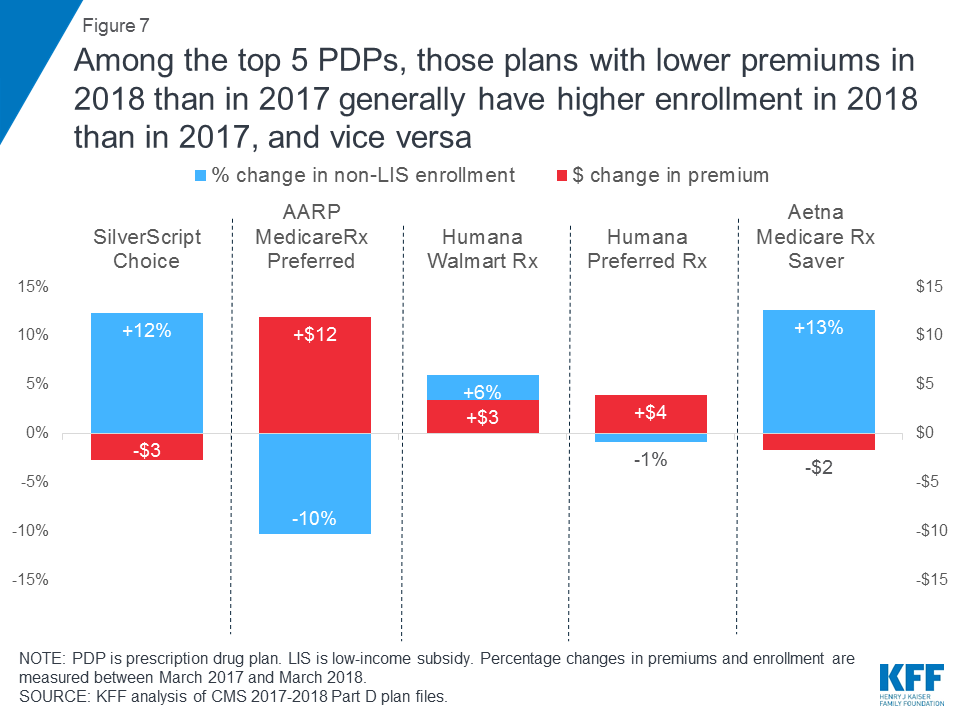
The one exception to this inverse relationship among the top 5 PDPs was Humana Walmart Rx, which experienced a 6 percent increase in enrollment despite a $3 premium increase for 2018 (from $17 to $20). This could be related to the fact that, despite its premium increase for 2018, the Humana Walmart Rx PDP is among the lowest-premium PDPs available in almost all regions in 2018; while some PDPs have lower premiums, they are not available nationwide.
Deductibles and Cost Sharing
In 2018, more than 4 in 10 Part D enrollees are in plans that charge no deductible for drug coverage.
While more than 4 in 10 PDP and MA-PD enrollees (45%) are in plans that charge no deductible, a larger share of PDP enrollees than MA-PD enrollees are in plans charging the standard deductible amount of $405 in 2018 (46% and 3%, respectively), while a larger share of MA-PD enrollees than PDP enrollees face a partial deductible amount (Table 4). As a result, the weighted average Part D deductible is higher among PDP enrollees than MA-PD enrollees in 2018 ($213 and $129, respectively).
Cost Sharing for Generic Drugs
Around 2 in 10 Part D enrollees have a $0 copayment for preferred generics, but many pay $10 or more for other (non-preferred) generics.
In 2018, 19 percent of PDP enrollees and 24 percent of MA-PD enrollees have a $0 copayment for preferred generics (Figure 8). Median cost sharing for preferred generics is $1 for PDP enrollees and $3 for MA-PD enrollees in 2018, a reduction from earlier years (Table 5).
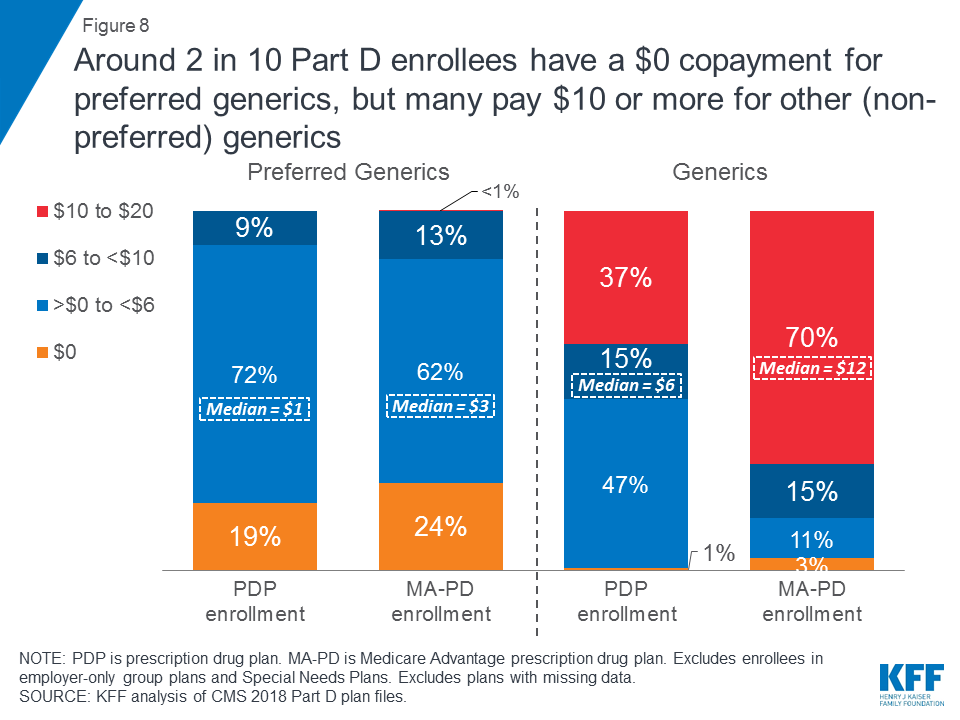
For drugs on the second (non-preferred) generic tier—a tier that became common in 2012—median cost sharing is $6 for PDPs and $12 for MA-PDs. Nearly 4 in 10 PDP enrollees (37%) and 70 percent of MA-PD enrollees pay between $10 and $20 for generics on this tier.
Cost Sharing for Brand-Name Drugs
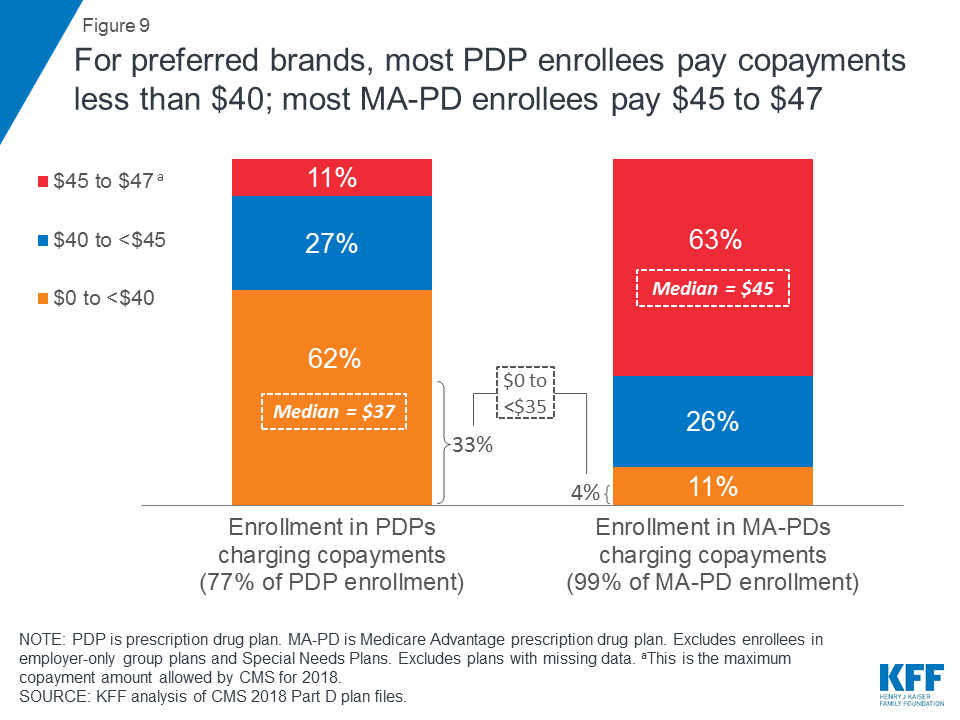
For preferred brands, most PDP enrollees pay copayments less than $40; most MA-PD enrollees pay $45 to $47.
The vast majority of Part D plans (both PDPs and MA-PDs) charge copayments for preferred brand-name drugs rather than coinsurance. Among Part D enrollees in plans that use copayments for preferred brands, enrollees typically face lower copayments in PDPs than MA-PDs (Figure 9). Nearly two-thirds of PDP enrollees (62%) are in plans charging less than $40 for these drugs, while a similar share of MA-PD enrollees (63%) are in plans charging at least $45. Median cost sharing for preferred brands in 2018 is $37 for PDP enrollees and $45 for MA-PD enrollees.
For non-preferred drugs, half of PDP enrollees pay coinsurance between 40% and 50%; most MA-PD enrollees pay copayments between $90 and $100.
For non-preferred drugs (or non-preferred brands; 5-tier plans use one or the other), nearly all PDP enrollees pay a coinsurance rate, whereas most MA-PD enrollees pay a copayment amount. Half of PDP enrollees pay coinsurance of 40 percent or more for non-preferred drugs, while among MA-PD enrollees in plans charging copayments for non-preferred drugs, most (89%) pay between $90-$100 (Figure 10).
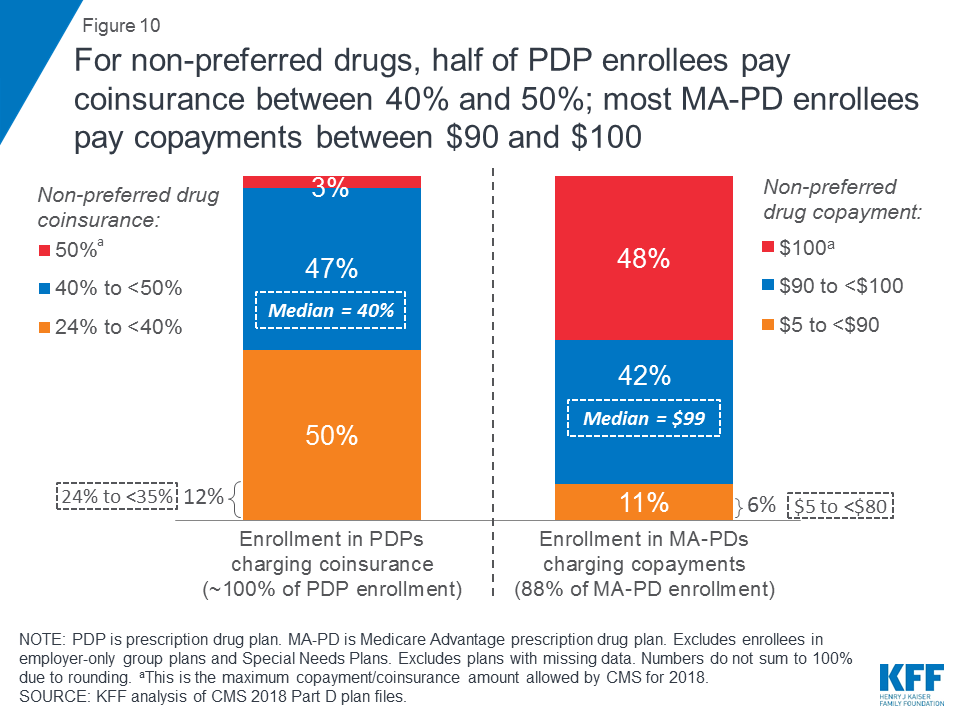
Whether one group of enrollees faces higher average out-of-pocket costs than the other for non-preferred drugs cannot be assessed because of the different approaches to cost sharing that each plan type uses; in particular, the actual out-of-pocket cost that PDP enrollees face who pay coinsurance for non-preferred drugs depends on the list price of the drug.
Cost Sharing for Specialty Drugs
More than 4 in 10 Part D enrollees are in plans charging 33 percent coinsurance for specialty tier drugs.
Close to half of PDP enrollees (45%) and more than 4 in 10 MA-PD enrollees (42%) are in plans that charge the maximum 33 percent coinsurance rate for specialty drugs, defined by CMS as those that cost at least $670 per month (Table 4). Only those plans that waive some or all of the standard deductible are permitted to set the specialty tier coinsurance rate above 25 percent.
Low-Income Subsidies
Three in 10 Part D enrollees receive additional subsidies for Part D coverage through the Low-Income Subsidy program.
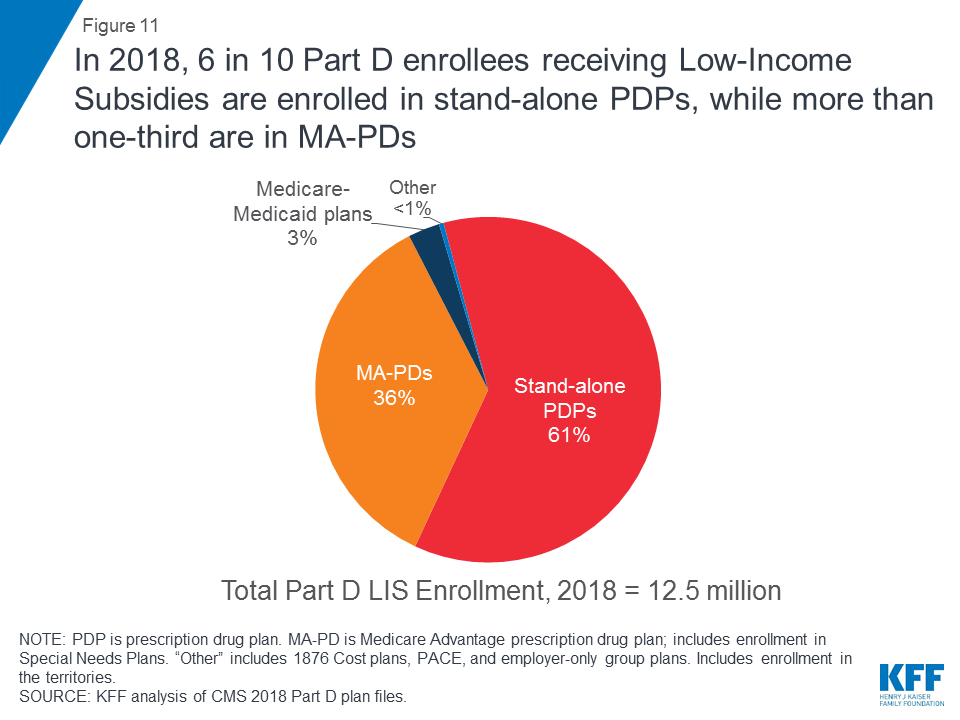
More than 12 million Part D enrollees (29%) receive low-income subsidies (Figure 11). These additional financial subsidies, also called “Extra Help,” pay Part D premiums for eligible beneficiaries, as long as they enroll in PDPs designated as premium-free “benchmark” plans, and also reduces cost sharing. Six in 10 low-income subsidy (LIS) enrollees (61%, or 7.6 million) are enrolled in stand-alone PDPs. The other 4.9 million LIS enrollees are in standard MA-PDs, Medicare Advantage Special Needs Plans (SNPs), Medicare-Medicaid plans participating in financial alignment demonstrations, cost plans, or PACE plans.
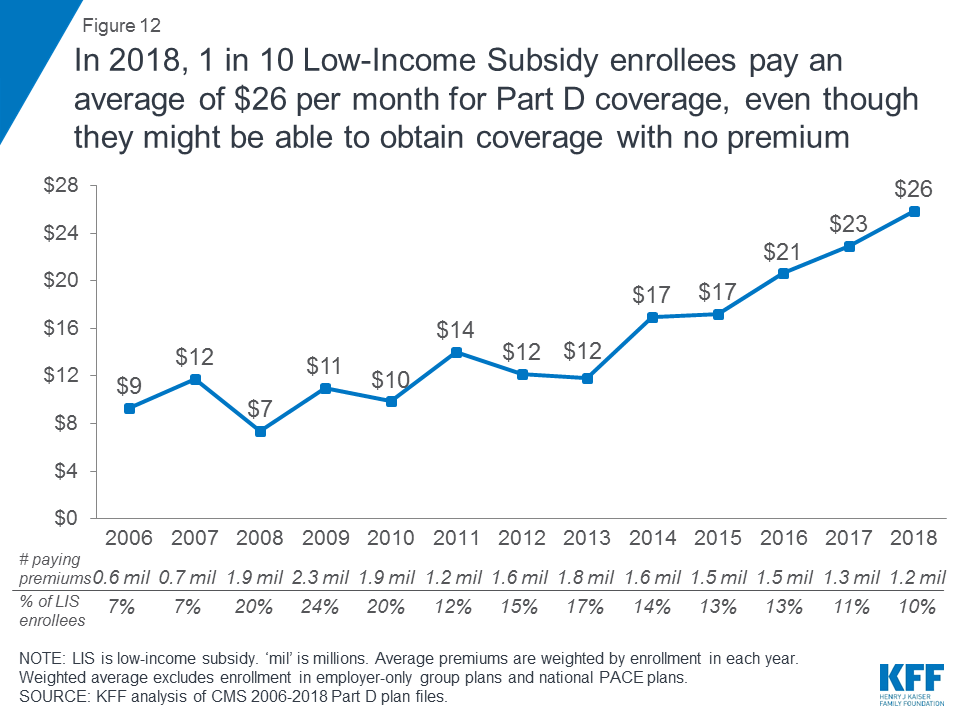
More than 1 million LIS beneficiaries pay premiums for Part D coverage, even though they may be able to obtain coverage with no premium, either through a benchmark PDP or through a zero-premium MA-PD.
In 2018, 1.2 million LIS beneficiaries (10% of all LIS beneficiaries) pay a premium for Part D coverage, even though they may be able to obtain coverage without paying a premium. This total includes 0.9 million PDP enrollees who are not enrolled in benchmark PDPs, and more than 0.3 million MA-PD enrollees who are enrolled in MA-PDs that charge a premium. MA-PDs are not designated as benchmark plans by CMS, although most of the LIS enrollees in MA-PDs are currently enrolled in zero-premium plans.
CMS reassigns some LIS beneficiaries in PDPs to a premium-free PDP during open enrollment if their previous PDP loses benchmark status and charges a premium. But other LIS enrollees are not reassigned by CMS because they have actively selected the plan they are in, whether it is a PDP or an MA-PD.
On average, the 1.2 million LIS beneficiaries paying Part D premiums in 2018 pay $26 per month, or more than $300 per year (Figure 12). This amount is up 13 percent from 2017 and is nearly three times the amount in 2006.
Methodology
This analysis focuses on the Medicare Part D marketplace in 2018 and trends over time. Data on Part D plan availability, enrollment, and premiums were collected primarily from a set of data files released by the CMS on a regular basis:
- Part D plan landscape files, released each fall prior to the annual enrollment period. These files include basic plan characteristics, such as plan names, premiums, deductibles, gap coverage, and benchmark plan status.
- Part D plan and premium files, released each fall. These files include more detail on plan characteristics, including premiums charged to LIS beneficiaries, the portions of the premiums allocated to the basic and enhanced benefits, and the separate drug premiums for MA-PDs.
- Part D plan crosswalk files, released each fall. These files identify which plans are matched up when a plan sponsor changes its plan offerings from one year to the next.
- Part D contract/plan/state/county level enrollment files, released on a monthly basis. These files include total enrollment by contract and plan at the state and county level. We use March enrollment counts for enrollment-weighted analysis in this report. Enrollment files suppress totals for plans with 10 or fewer enrollees.
- Part D Low-Income Subsidy enrollment files, released once annually (in March for 2018). These files include total enrollment counts for LIS enrollees. As with the other enrollment files, we exclude plans with small enrollment counts in estimates that are plan-enrollment weighted.
- Medicare plan benefit package files, released each fall. These files supply detailed information on the benefits offered by plans, including cost-sharing amounts for each formulary tier, tier labels, and the different cost-sharing amounts for standard and preferred cost-sharing pharmacies, where applicable.
- Medicare penetration files, released on a monthly basis. These files are used to estimate average counts of plans available per beneficiary.
For analysis of changes in premiums for the top 5 PDPs and changes in non-LIS enrollment, we calculated the percentage change in premiums and enrollment between March 2017 and March 2018. We did not measure the change in non-LIS enrollment that occurred during the open enrollment period specifically.
For analysis of cost sharing for formulary tiers in PDPs and MA-PDs, we did not analyze which drugs are on what tier under each type of plan and whether this has changed over time, factors which would also influence enrollees’ out-of-pocket costs.
Juliette Cubanski and Tricia Neuman are with the Kaiser Family Foundation.Anthony Damico is an independent consultant.
Tables
| Table 1: Top 10 Firms Offering Medicare Part D Plans Ranked by 2018 Enrollment | ||||||
| Name of firm | Rank | Enrollment (in millions) | % of total Part D | |||
| PDP | MA-PD | Total | ||||
| UnitedHealth Group | 1 | 5.3 | 4.7 | 10.0 | 23% | |
| Humana | 2 | 4.9 | 3.0 | 7.9 | 18% | |
| CVS Health | 3 | 6.0 | 0 | 6.0 | 14% | |
| Aetna | 4 | 2.1 | 1.3 | 3.4 | 8% | |
| BCBS* | 5 | 1.0 | 1.9 | 2.9 | 7% | |
| Express Scripts | 6 | 2.4 | 0 | 2.4 | 6% | |
| WellCare Health Plans | 7 | 1.1 | 0.5 | 1.6 | 4% | |
| Kaiser Permanente | 8 | 0 | 1.5 | 1.5 | 4% | |
| Cigna | 9 | 0.8 | 0.4 | 1.2 | 3% | |
| Anthem BCBS | 10 | 0.4 | 0.6 | 1.0 | 2% | |
| Total top 10 firms | 24.2 | 13.9 | 38.1 | 88% | ||
| Total Part D | 25.1 | 18.3 | 43.4 | 100% | ||
| NOTE: PDP is prescription drug plan. MA-PD is Medicare Advantage prescription drug plan. Includes enrollment in the territories and employer group plans. Number may not sum to total due to rounding. *BCBS excludes Anthem BCBS, which is a separate plan sponsor.SOURCE: KFF analysis of CMS 2018 Part D plan files. | ||||||
| Table 2: Top Firms Offering Medicare Part D Plans by State, 2018 | |||||||||
| State/ territory | TotalPart D enrollment | #1 firm | % of total | #2 firm | % of total | #3 firm | % of total | Top 3 firms % of total | All other firms % of total |
| AK | 35,152 | Humana | 40% | UnitedHealth | 30% | CIGNA | 12% | 81% | 19% |
| AL | 730,549 | UnitedHealth | 25% | Humana | 17% | BCBS | 17% | 59% | 41% |
| AR | 429,440 | CVS Health | 24% | Humana | 22% | UnitedHealth | 16% | 62% | 38% |
| AS | 95 | CVS Health | 34% | UnitedHealth | 32% | Aetna | 23% | 88% | 12% |
| AZ | 915,596 | UnitedHealth | 39% | Humana | 18% | CVS Health | 8% | 65% | 35% |
| CA | 4,777,625 | Kaiser Foundation Health Plan | 24% | UnitedHealth | 22% | CVS Health | 12% | 57% | 43% |
| CO | 622,279 | UnitedHealth | 36% | Humana | 22% | Kaiser Foundation Health Plan | 18% | 76% | 24% |
| CT | 516,578 | UnitedHealth | 35% | CVS Health | 12% | Aetna | 12% | 60% | 40% |
| DC | 55,006 | UnitedHealth | 31% | CVS Health | 14% | Kaiser Foundation Health Plan | 11% | 57% | 43% |
| DE | 146,584 | UnitedHealth | 26% | Express Scripts | 23% | Humana | 14% | 63% | 37% |
| FL | 3,299,357 | UnitedHealth | 27% | Humana | 26% | CVS Health | 15% | 69% | 31% |
| GA | 1,186,871 | UnitedHealth | 32% | Humana | 20% | CVS Health | 16% | 68% | 32% |
| HI | 185,910 | CVS Health | 25% | UnitedHealth | 19% | BCBS | 18% | 63% | 37% |
| IA | 463,528 | Humana | 30% | BCBS | 18% | UnitedHealth | 17% | 65% | 35% |
| ID | 212,023 | Humana | 23% | UnitedHealth | 22% | BCBS | 14% | 59% | 41% |
| IL | 1,598,234 | UnitedHealth | 25% | Humana | 19% | BCBS | 16% | 60% | 40% |
| IN | 921,327 | Humana | 26% | UnitedHealth | 24% | CVS Health | 14% | 64% | 36% |
| KS | 361,451 | Humana | 32% | Aetna | 20% | CVS Health | 20% | 72% | 28% |
| KY | 671,121 | Humana | 36% | CVS Health | 15% | Express Scripts | 13% | 63% | 37% |
| LA | 628,819 | Humana | 36% | CVS Health | 16% | PH Holdings, LLC | 10% | 62% | 38% |
| MA | 988,022 | CVS Health | 22% | UnitedHealth | 15% | Anthem BCBS | 13% | 49% | 51% |
| MD | 615,389 | CVS Health | 26% | UnitedHealth | 20% | Humana | 12% | 58% | 42% |
| ME | 233,896 | UnitedHealth | 28% | Martin’s Point Health Care | 18% | WellCare Health Plans | 13% | 59% | 41% |
| MI | 1,577,228 | UnitedHealth | 21% | Express Scripts | 16% | BCBS | 13% | 50% | 50% |
| MN | 745,107 | BCBS | 26% | Humana | 24% | UCare Minnesota | 12% | 61% | 39% |
| MO | 890,815 | UnitedHealth | 24% | Humana | 21% | Aetna | 17% | 63% | 37% |
| MS | 416,961 | Humana | 31% | CVS Health | 24% | WellCare Health Plans | 15% | 70% | 30% |
| MT | 142,912 | Humana | 39% | BCBS | 20% | CVS Health | 15% | 74% | 26% |
| NC | 1,410,633 | UnitedHealth | 32% | Humana | 22% | CVS Health | 14% | 68% | 32% |
| ND | 86,636 | Humana | 31% | CVS Health | 24% | BCBS | 13% | 69% | 31% |
| NE | 236,212 | Humana | 33% | UnitedHealth | 19% | CVS Health | 17% | 69% | 31% |
| NH | 189,952 | UnitedHealth | 28% | Humana | 17% | CVS Health | 12% | 58% | 42% |
| NJ | 1,163,696 | UnitedHealth | 41% | CVS Health | 13% | Humana | 11% | 65% | 35% |
| NM | 285,307 | UnitedHealth | 24% | Presbyterian Healthcare Services | 15% | Humana | 14% | 53% | 47% |
| NV | 344,086 | UnitedHealth | 39% | Humana | 31% | Aetna | 8% | 79% | 21% |
| NY | 2,733,417 | UnitedHealth | 20% | CVS Health | 18% | Express Scripts | 7% | 46% | 54% |
| OH | 1,767,794 | Humana | 18% | UnitedHealth | 17% | Express Scripts | 13% | 47% | 53% |
| OK | 469,737 | CVS Health | 26% | Humana | 21% | UnitedHealth | 18% | 65% | 35% |
| OR | 607,487 | UnitedHealth | 18% | Centene Corporation | 11% | Humana | 11% | 40% | 60% |
| PA | 2,047,633 | BCBS | 18% | CVS Health | 15% | Aetna | 12% | 45% | 55% |
| PR | 575,911 | Medical Card System | 35% | InnovaCare Inc. | 34% | BCBS | 19% | 88% | 12% |
| RI | 162,225 | BCBS | 32% | UnitedHealth | 24% | CVS Health | 9% | 65% | 35% |
| SC | 732,424 | UnitedHealth | 29% | Humana | 22% | CVS Health | 15% | 65% | 35% |
| SD | 111,201 | Humana | 43% | CVS Health | 17% | BCBS | 13% | 73% | 27% |
| TN | 977,307 | Humana | 25% | UnitedHealth | 20% | BCBS | 15% | 60% | 40% |
| TX | 2,839,293 | UnitedHealth | 30% | Humana | 19% | CVS Health | 16% | 65% | 35% |
| UT | 262,839 | UnitedHealth | 37% | Humana | 17% | Intermountain Health Care | 9% | 63% | 37% |
| VA | 914,191 | Humana | 32% | UnitedHealth | 19% | CVS Health | 14% | 65% | 35% |
| VI | 11,655 | UnitedHealth | 98% | CIGNA | 2% | Express Scripts | 0% | 100% | 0% |
| VT | 103,432 | UnitedHealth | 28% | CVS Health | 19% | Humana | 17% | 63% | 37% |
| WA | 836,641 | UnitedHealth | 30% | Humana | 17% | CVS Health | 10% | 57% | 43% |
| WI | 807,064 | UnitedHealth | 31% | Humana | 21% | CVS Health | 10% | 62% | 38% |
| WV | 296,780 | Humana | 37% | CVS Health | 16% | UnitedHealth | 13% | 65% | 35% |
| WY | 63,933 | Humana | 32% | UnitedHealth | 22% | CVS Health | 18% | 72% | 28% |
| NOTE: Includes enrollment in the territories and employer-only group plans. Excludes Guam, where only two firms are operating in 2018. *BCBS excludes Anthem BCBS, which is a separate plan sponsor.SOURCE: KFF analysis of CMS 2018 Part D plan files. | |||||||||
| Table 3: Top 10 Medicare Part D Plans Ranked by 2018 Enrollment | |||||||
| Name of plan | 2018 | 2017 | Change, 2017-2018 | ||||
| Type of benefit | Rank | Enrollment(in millions) | % of total Part D | Rank | |||
| SilverScript Choice | Basic | 1 | 4.6 | 12.5% | 1 | +7% | |
| AARP MedicareRx Preferred | Enhanced | 2 | 2.6 | 7.0% | 2 | -12% | |
| Humana Walmart Rx Plan | Enhanced | 3 | 2.4 | 6.5% | 3 | +6% | |
| Humana Preferred Rx Plan | Basic | 4 | 1.7 | 4.6% | 4 | -9% | |
| Aetna Medicare Rx Saver | Basic | 5 | 1.2 | 3.2% | 5 | +4% | |
| WellCare Classic | Basic | 6 | 1.0 | 2.8% | 7 | +0.2% | |
| Humana Enhanced | Enhanced | 7 | 0.8 | 2.2% | 8 | -13% | |
| AARP MedicareRx Saver Plus | Basic | 8 | 0.7 | 1.9% | 6 | -35% | |
| Symphonix Value Rx | Basic | 9 | 0.7 | 1.9% | 13 | +70% | |
| AARP MedicareRx Walgreens | Enhanced | 10 | 0.6 | 1.6% | 14 | +72% | |
| NOTE: Excludes employer-group only (EGWP) plans; in 2018, one EGWP (Express Scripts Medicare PDP) had 1.7 million enrollees. Plan names can change from year to year; plans are designated the same if they have the same contract/plan ID.SOURCE: KFF analysis of CMS 2017-2018 Part D plan files. | |||||||
| Table 4: Distribution of Medicare Part D Enrollment by Deductible and Cost-Sharing Amounts, 2018 | |||
| All Part D Enrollment | PDPEnrollment | MA-PD Enrollment | |
| Deductible | |||
| None | 45% | 45% | 45% |
| Partial | 26% | 9% | 52% |
| Standard | 29% | 46% | 3% |
| Cost sharing | |||
| Preferred generics | |||
| $0 | 21% | 19% | 24% |
| >$0 to <$3 | 33% | 41% | 19% |
| $3 to <$6 | 35% | 31% | 43% |
| $6 to <$10 | 11% | 9% | 13% |
| $10 to <$12 | <1% | 0% | <1% |
| $12 to <$15 | 0% | 0% | 0% |
| $15 | <1% | 0% | <1% |
| Other (non-preferred) generics | |||
| $0 | 2% | 1% | 3% |
| >$0 to <$3 | 13% | 21% | <1% |
| $3 to <$6 | 20% | 26% | 11% |
| $6 to <$10 | 15% | 15% | 15% |
| $10 to <$12 | 14% | 10% | 20% |
| $12 to <$15 | 19% | 17% | 22% |
| $15 to $20 | 17% | 10% | 28% |
| Preferred brands | |||
| $0 to <$35 | 20% | 33% | 4% |
| $35 to <$40 | 19% | 29% | 7% |
| $40 to <$45 | 27% | 27% | 26% |
| $45 to $47 | 34% | 11% | 63% |
| Non-preferred brands/drugs (coinsurance) | |||
| 24% to <35% | 12% | 12% | — |
| 35% to <40% | 35% | 38% | — |
| 40% to <46% | 30% | 30% | — |
| 46% to <50% | 17% | 17% | — |
| 50% | 6% | 3% | — |
| Non-preferred brands/drugs (copayment) | |||
| $5 to <$80 | 6% | — | 6% |
| $80 to <$90 | 5% | — | 5% |
| $90 to <$95 | 7% | — | 7% |
| $95 to <$100 | 34% | — | 35% |
| $100 | 47% | — | 48% |
| Specialty tier | |||
| 25% | 33% | 47% | 11% |
| >25% to <33% | 23% | 8% | 47% |
| 33% | 44% | 45% | 42% |
| NOTE: PDP is prescription drug plan. MA-PD is Medicare Advantage prescription drug plan. Excludes enrollees in employer-only group plans and Special Needs Plans. Excludes plans with missing data. ‘–‘ indicates data not shown for this plan type since the majority of these plans use the alternative cost-sharing arrangement (coinsurance or copayment) for non-preferred brands/drugs.SOURCE: KFF analysis of CMS 2018 Part D plan files. | |||
| Table 5: Cost Sharing for Medicare Part D Plans, 2010 and 2018 | |||||||||
| Formulary tier | Plan type | 2010 | 2018 | ||||||
| Minimum | Mean | Median | Maximum | Minimum | Mean | Median | Maximum | ||
| Preferred generic | PDP | $0 | $5 | $6 | $15 | $0 | $2 | $1 | $9 |
| MA-PD | $0 | $6 | $7 | $15 | $0 | $3 | $3 | $15 | |
| Generic | PDP | $13 | $27 | $26 | $37 | $0 | $7 | $6 | $20a |
| MA-PD | $0 | $15 | $10 | $38 | $0 | $11 | $12 | $20a | |
| Preferred brand copayment% of enrollees in plans charging | PDP | $16.25 | $33 | $34 | $45 | $18 | $37 | $37 | $47a |
| 46% | 77% | ||||||||
| MA-PD | $0 | $34 | $35 | $55 | $0 | $43 | $45 | $47a | |
| 99% | 99% | ||||||||
| Preferred brand coinsurance% of enrollees in plans charging | PDP | 10% | 22% | 22% | 33% | 10% | 21% | 20% | 25%a |
| 54% | 23% | ||||||||
| MA-PD | 23% | 24% | 23% | 40% | 15% | 22% | 25% | 25%a | |
| 1% | 1% | ||||||||
| Non-preferred drug copayment% of enrollees in plans charging | PDP | $40 | $80 | $75 | $98 | $70 | $85 | $93 | $100a |
| 65% | <1% | ||||||||
| MA-PD | $10 | $70 | $80 | $95 | $5 | $95 | $99 | $100a | |
| 99% | 88% | ||||||||
| Non-preferred drug coinsurance% of enrollees in plans charging | PDP | 25% | 57% | 55% | 75% | 24% | 39% | 40% | 50%a |
| 35% | ~100% | ||||||||
| MA-PD | 25% | 39% | 50% | 60% | 24% | 44% | 46% | 50%a | |
| 1% | 12% | ||||||||
| Specialty | PDP | 25% | 29% | 30% | 33% | 25% | 29% | 27% | 33%a |
| MA-PD | 25% | 31% | 33% | 33% | 25% | 30% | 31% | 33%a | |
| NOTE: PDP is prescription drug plan. MA-PD is Medicare Advantage prescription drug plan. Part D estimates weighted by enrollment in each year. Mean and median amounts are weighted by enrollment. Excludes Special Needs Plans and plans with missing data. aThis is the maximum copayment/coinsurance amount allowed by CMS for 2018.SOURCE: KFF analysis of CMS 2010 and 2018 Part D plan files. | |||||||||