What to Know about Medicare Spending and Financing
This brief was updated in May 2026 to clarify the description of administrative expenses paid by Medicare.
Medicare, the federal health insurance program for 65 million people ages 65 and older and younger people with long-term disabilities, helps to pay for hospital and physician visits, prescription drugs, and other acute and post-acute care services. This brief provides an overview of Medicare spending and financing, based on the most recent historical and projected data published in the 2022 annual report of the Board of Medicare Trustees and the 2022 Medicare baseline and projections from the Congressional Budget Office (CBO). The brief highlights trends in Medicare spending and key drivers of spending growth, including higher enrollment, growth in health care costs, and increases in payments to Medicare Advantage plans.
Key Facts about Medicare Spending and Financing
- In 2021, Medicare benefit payments totaled $829 billion, up from $541 billion in 2011. Spending on Part B services (including physician services, outpatient services, and physician-administered drugs) accounts for the largest share of Medicare benefit spending (48% in 2021).
- Payments to Medicare Advantage plans for Part A and Part B benefits nearly tripled as a share of total Medicare spending between 2011 and 2021, from $124 billion to $361 billion, due to steady enrollment growth in Medicare Advantage plans and higher per person spending in Medicare Advantage than in traditional Medicare.
- Medicare spending (net of income from premiums and other offsetting receipts) is projected to rise from 10% of total federal spending in 2021 to 18% in 2032, and from 3.1% to 3.9% of GDP over these years, due to growing Medicare enrollment, increased use of services and intensity of care, and rising health care costs.
- Average annual growth in Medicare per capita spending is projected to be 5.4% between 2020 and 2030, on par with the 5.3% growth rate in private health insurance per capita spending over these years.
- Funding for Medicare, which totaled $888 billion in 2021, comes primarily from general revenues (46%), payroll tax revenues (34%), and premiums paid by beneficiaries (15%).
- The Medicare Hospital Insurance (Part A) trust fund, which pays for inpatient hospital, skilled nursing facility, home health and other Part A services, is projected to be depleted in 2028, based on the latest projections from the Medicare Trustees.
Overview of Medicare Spending
Medicare Accounts for 21% of National Health Spending and 10% of the Federal Budget
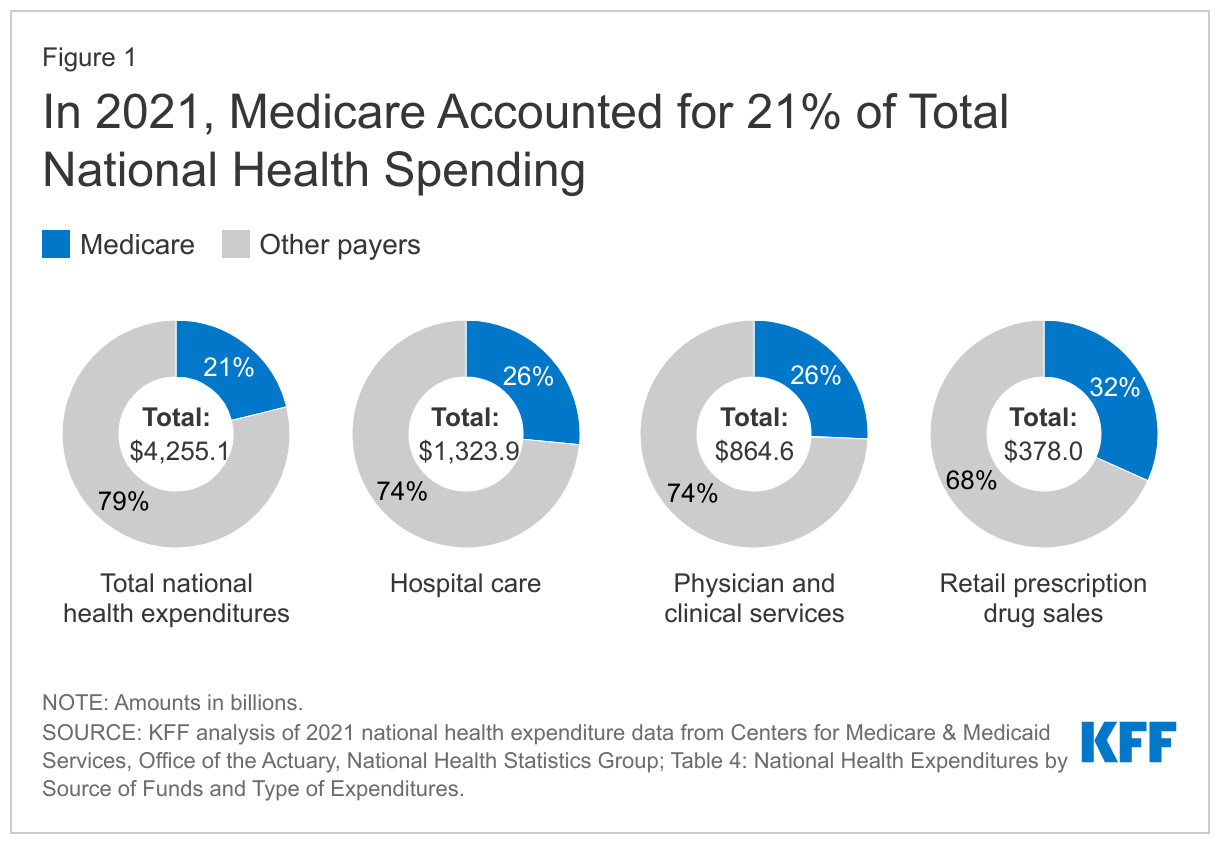
Medicare plays a major role in the health care system, accounting for 21% of total national health spending in 2021, 26% of spending on both hospital care and physician and clinical services, and 32% of spending on retail prescription drug sales (Figure 1).
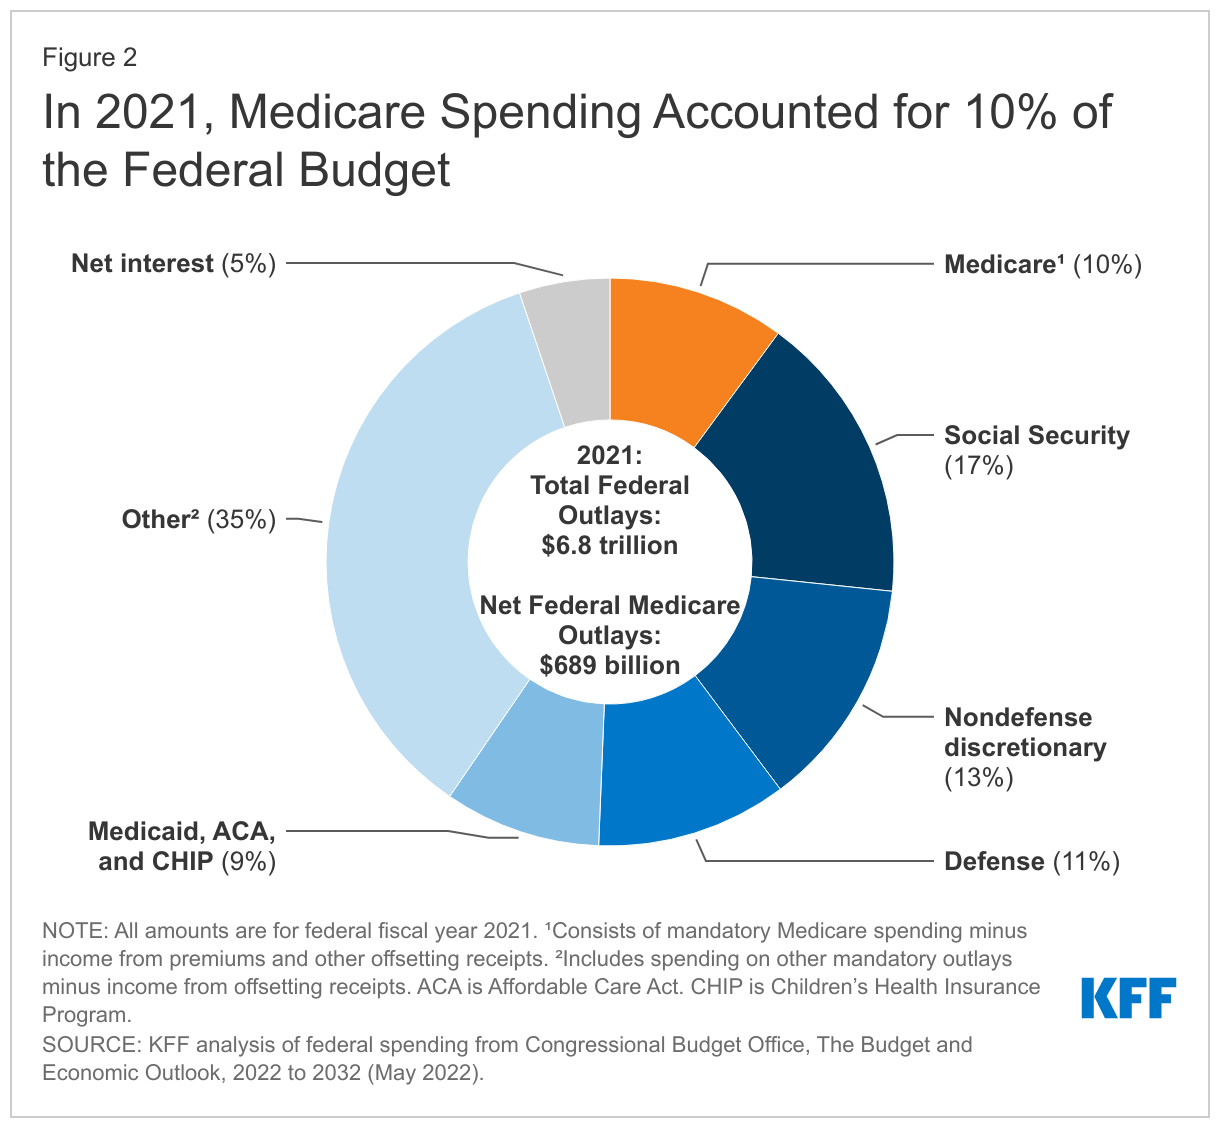
In 2021, Medicare spending, net of income from premiums and other offsetting receipts, totaled $689 billion and accounted for 10% of the federal budget—a similar share as spending on Medicaid, the Affordable Care Act (ACA), and the Children’s Health Insurance Program combined, and defense spending (Figure 2).
Historical and Projected Medicare Spending
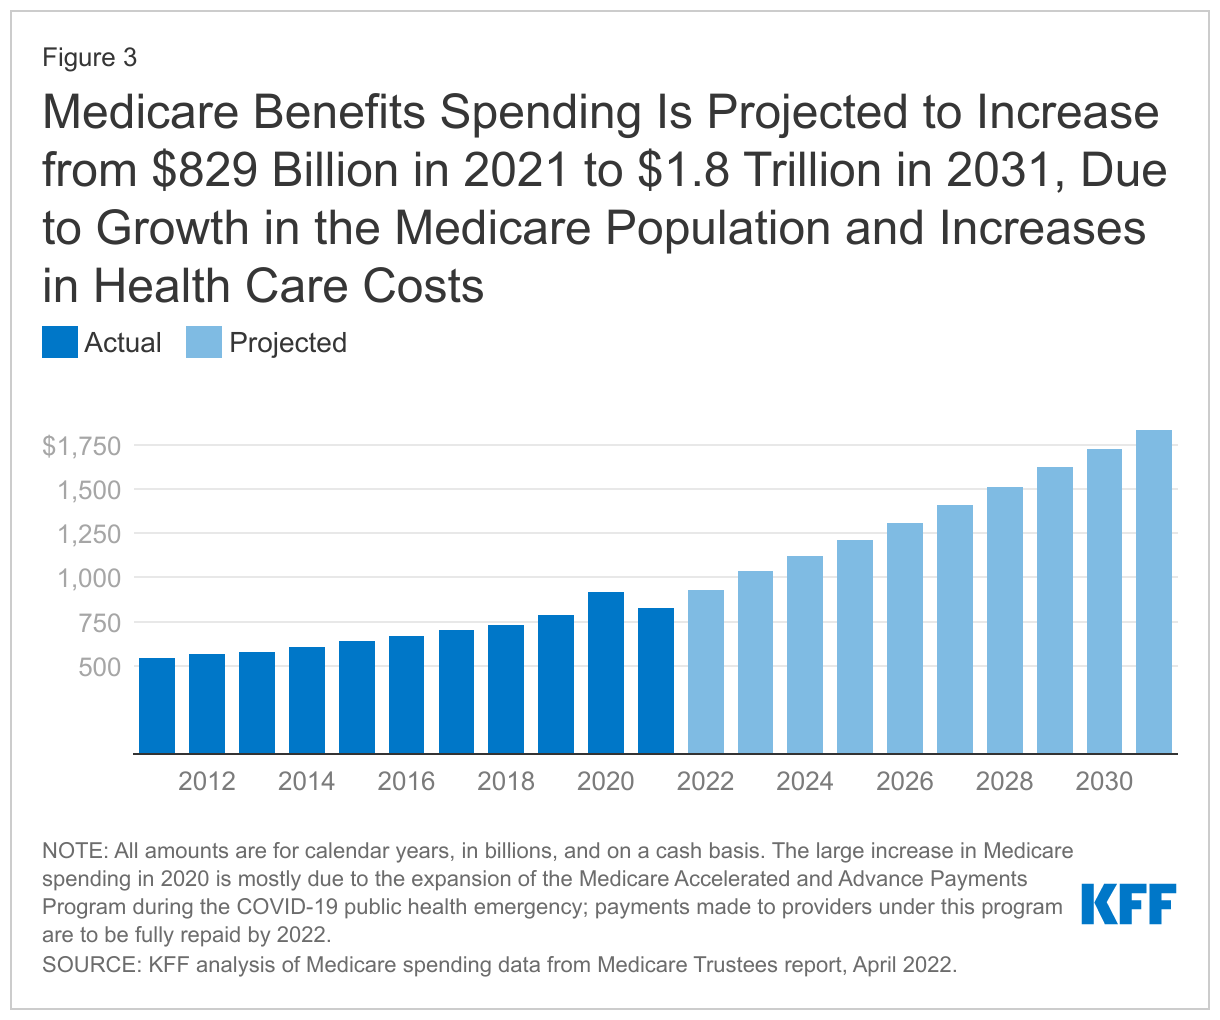
Medicare spending on Part A, Part B, and Part D benefits in 2021 totaled $829 billion, up from $541 billion in 2011, according to the Medicare Trustees (Figure 3). These amounts reflect gross spending, not subtracting premiums or other offsetting receipts, and include spending on beneficiaries in both traditional Medicare and Medicare Advantage. Medicare benefit spending is expected to grow to $1.8 trillion in 2031 (Figure 3).
CBO projects that between 2021 and 2032, net Medicare spending—after subtracting premiums and other offsetting receipts—will grow as a share of both the federal budget, from 10.1% to 17.8%, and the nation's economy, from 3.1% to 4.3% of gross domestic product (GDP). Projected spending growth for Medicare is due in part to growing enrollment in Medicare related to the aging of the population, increased use of services and intensity of care, and rising health care costs.
Over the longer term, net Medicare spending will increase to 5.9% of GDP in 2052, according to CBO's most recent long-term projections. CBO projects that rising health care costs per person will account for two-thirds of the increase in spending on the nation's major health care programs (Medicare, Medicaid, and subsidies for ACA Marketplace coverage) over the next 30 years, and the aging of the population will account for one-third.
Spending on Physician and Other Outpatient Services Accounts for a Growing Share of Medicare Spending
Spending on benefits under each part of Medicare (A, B, and D) increased in dollar terms between 2011 and 2021, but the distribution of total benefit payments by part has changed over time. Spending on Part B benefits, including physician services, hospital outpatient services, physician-administered drugs, and other outpatient services, increased from 41% in 2011 to 48% in 2021, and now accounts for the largest share of total spending on Medicare benefits (Figure 4). The share of total spending on Part A benefits (mainly hospital inpatient services) decreased from 47% to 39%, reflecting a shift from inpatient to outpatient services. Moving forward, Medicare spending on physician services and other services covered under Part B is expected to grow to just over half of total Medicare spending by 2031, while spending on hospital care and other services covered under Part A is projected to decrease further as a share of the total.
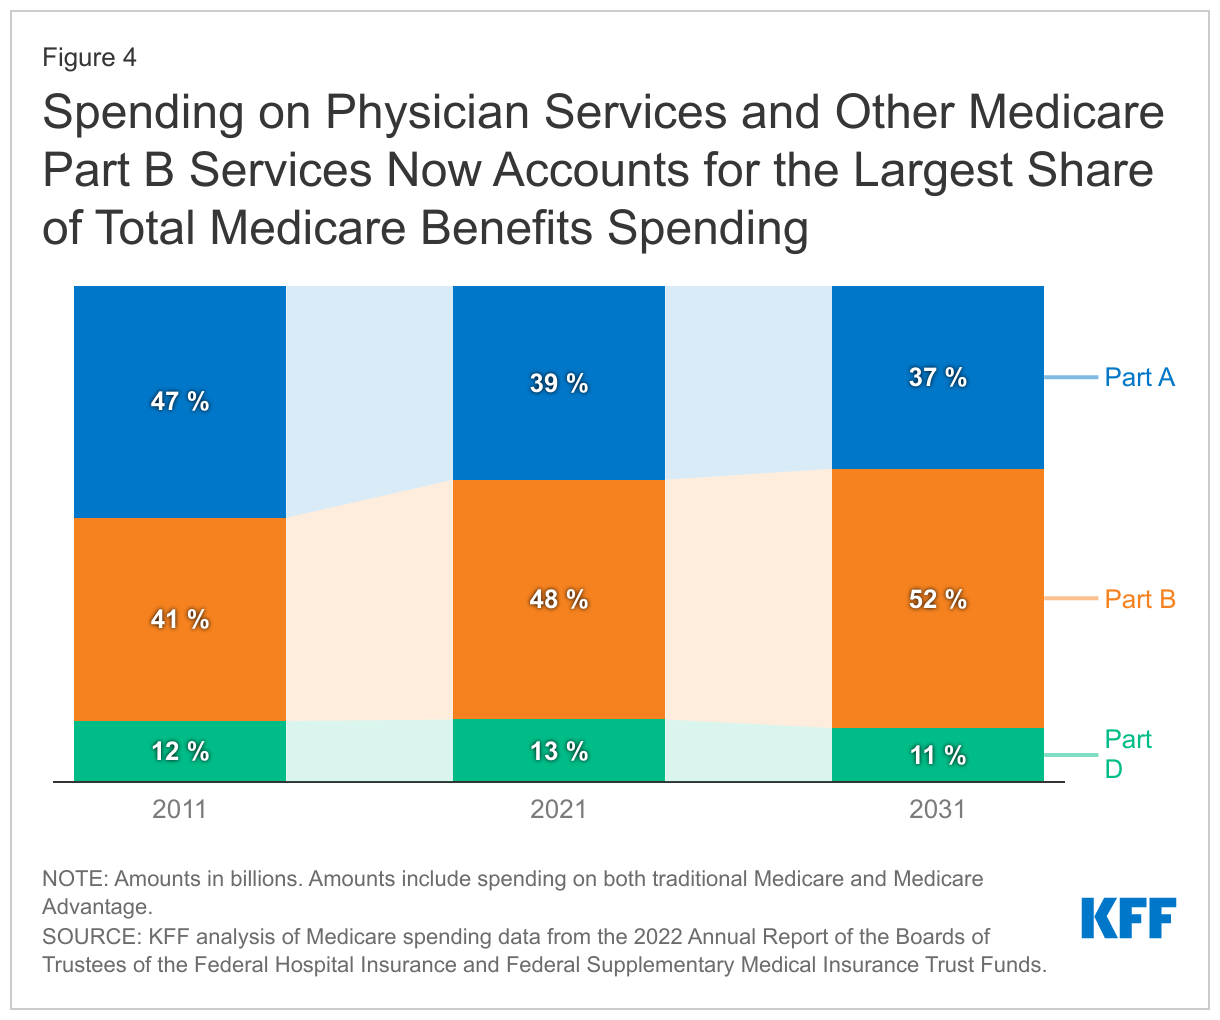
Spending on Part D prescription drug benefits has been a roughly constant share of total Medicare spending since the drug benefit began in 2006 (around 12-13%) and is expected to account for a similar share in the coming decade (11% in 2031). This projection does not take into account any savings to Medicare associated with implementation of the prescription drug provisions in the Inflation Reduction Act, which CBO projects will reduce the federal deficit by $237 billion between 2022 and 2031.
Spending on Medicare Advantage Has Grown as a Share of Total Medicare Spending
Another notable change in Medicare spending over the past decade is the increase in payments to Medicare Advantage plans, which are private health plans, such as HMOs and PPOs, that cover all Part A and Part B benefits and typically also Part D benefits. Medicare payments to Medicare Advantage plans for benefits covered under Part A and Part B nearly tripled between 2011 and 2021, from $124 billion to $361 billion—increasing from 26% of total Part A and Part B spending to 47% over this period. These payments are expected to increase to $943 billion in 2031, accounting for nearly 60% of total Part A and B spending that year (Figure 5). Beginning in 2023, Medicare spending on Part A and Part B benefits for beneficiaries in Medicare Advantage will exceed Part A and Part B benefits spending for beneficiaries in traditional Medicare.
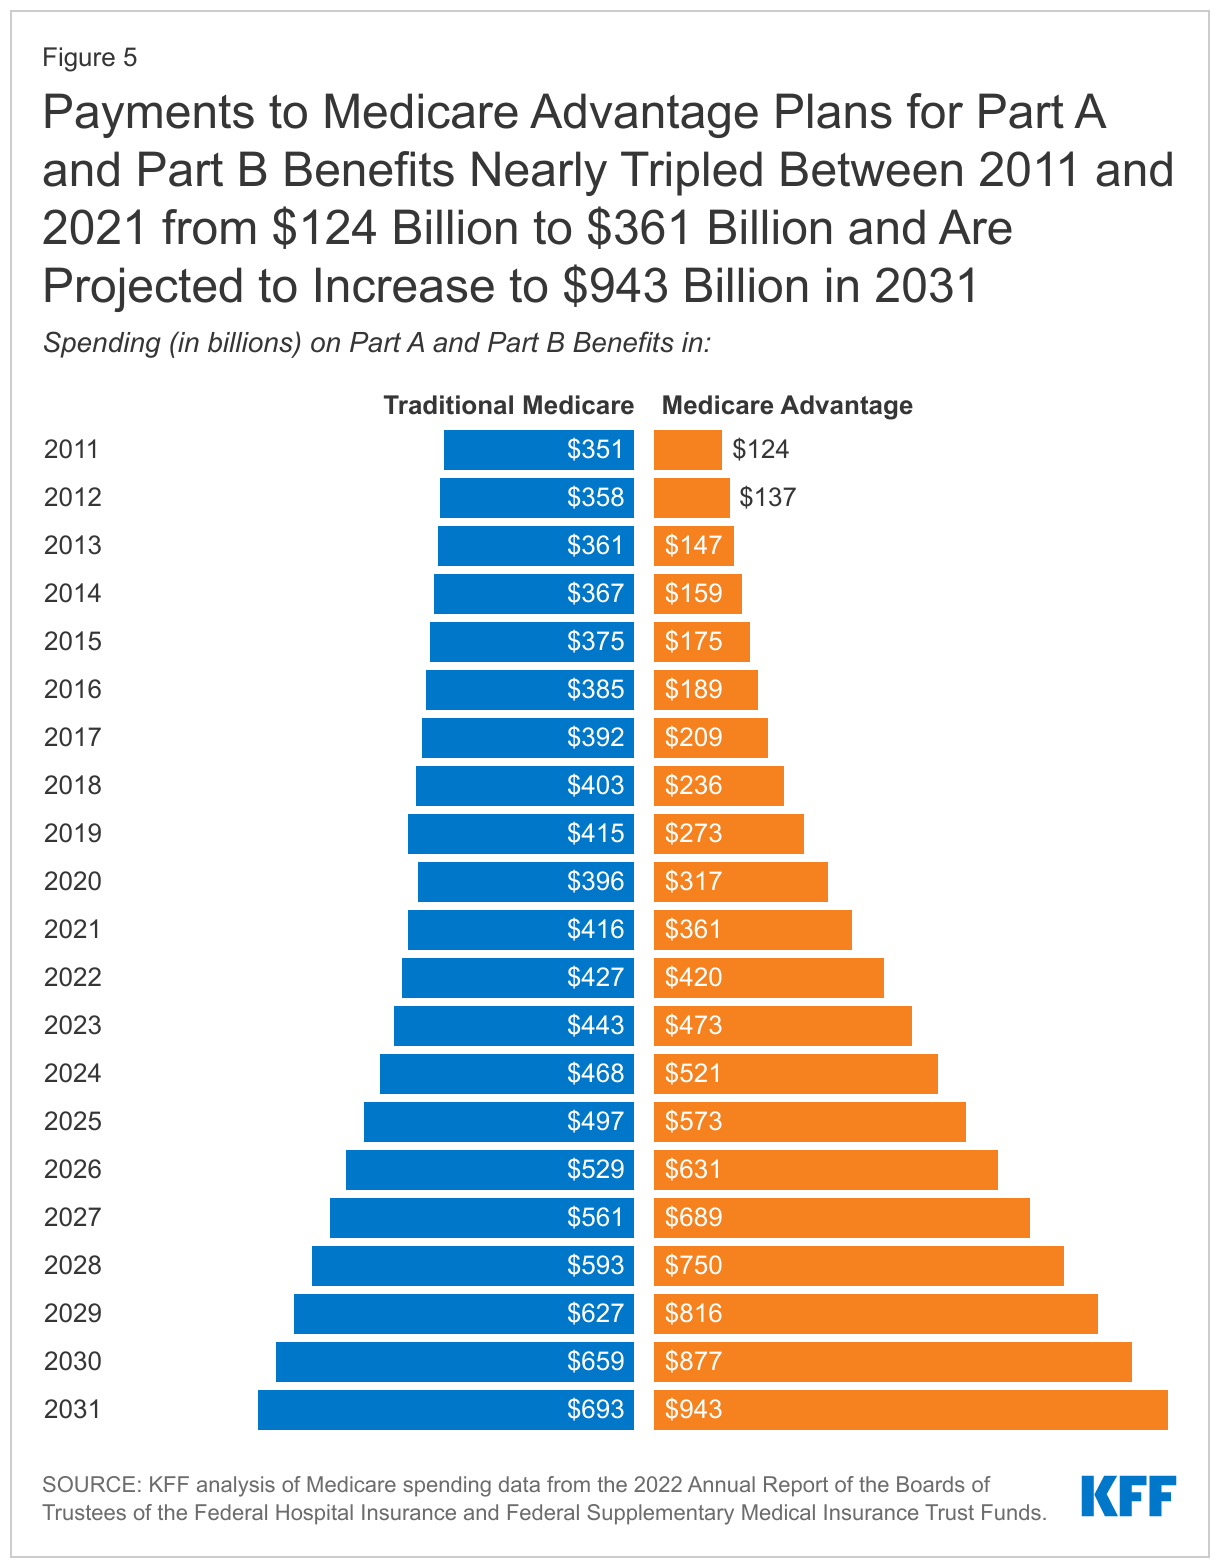
Historically, growth in spending on Medicare Advantage is due in large part to steady growth in private plan enrollment. In 2022, 48% of eligible Medicare beneficiaries are enrolled in Medicare Advantage plans, up from 26% in 2011. Based on CBO’s latest Medicare enrollment projections, Medicare Advantage enrollment will increase to 61% of eligible Medicare beneficiaries by 2031.
In addition, Medicare pays more to private Medicare Advantage plans for enrollees than their costs would be in traditional Medicare, on average, and these higher payments have contributed to growth in spending on Medicare Advantage and overall Medicare spending. In 2022, payments to Medicare Advantage plans are estimated to be 104% of what traditional Medicare would have spent on these beneficiaries, on average, according to MedPAC. This percentage is lower than in 2010, when Congress made changes to how Medicare Advantage plans are paid, but it has been trending higher since 2017.
According to the Congressional Budget Office, higher payments to Medicare Advantage plans, relative to traditional Medicare spending, are due to three factors. First, the payment methodology is based on benchmarks that are higher than traditional Medicare spending in half of all U.S. counties. Second, Medicare Advantage enrollees have higher “risk scores” than traditional Medicare beneficiaries in part because plans have a financial incentive to code for diagnoses, which increases the amount they are paid per enrollee. Third, Medicare Advantage plans typically receive higher payments based on their quality-based star ratings ($10 billion in 2022, according to KFF analysis), but these bonus payments do not apply to traditional Medicare.
Administrative Expenses in Medicare Are Relatively Low, But Higher for Medicare Part D and Medicare Advantage Plans
The overall cost to the federal government of administering Medicare benefits is relatively low. In 2021, administrative expenses for traditional Medicare, plus CMS administration and oversight of private Medicare Advantage and Medicare Part D plans, totaled $10.8 billion, or 1.3% of total program spending, according to the Medicare Trustees. Administrative expenses include payment of benefits for beneficiaries in traditional Medicare, making payments to Medicare Advantage and Part D plans, collecting revenues where applicable, fraud and abuse control activities, and conducting payment and coverage demonstrations.
This estimate does not include insurers’ costs of administering private Medicare Advantage and Part D drug plans, which are considerably higher. Medicare’s actuaries estimate that insurers’ administrative expenses and profits for Part D plans were 8% of total net plan benefit payments in 2021. The actuaries have not provided a comparable estimate for Medicare Advantage plans, but according to KFF analysis, medical loss ratios (medical claims covered by insurers as a share of total premiums income) averaged 83% for Medicare Advantage plans in 2020, which means that administrative expenses, including profits, were 17% for Medicare Advantage plans.
Medicare Spending Grew More Slowly in the Past Decade than in Decades Prior but Faster Growth Is Projected in the Coming Years
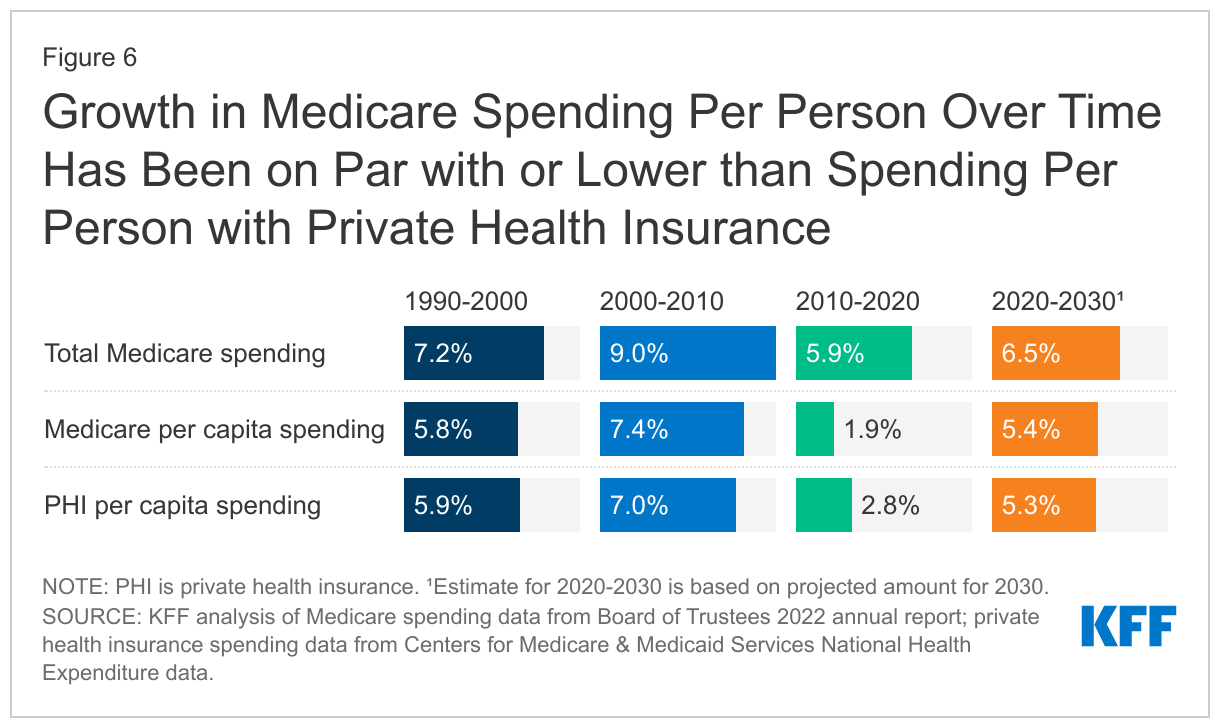
Looking at the average annual rate of growth in Medicare spending, both overall and per beneficiary, growth was notably slower in the most recent decade (2010-2020) than in prior decades, and somewhat slower than growth in private health insurance (PHI) per capita spending. For 2020-2030, the Medicare Trustees project that Medicare per capita spending growth will be higher than in the past decade, but on par with growth in private health insurance (PHI) per capita spending (Figure 6).
Growth in Total Medicare Spending
- Between 2010 and 2020, average annual growth in total Medicare spending was 5.9%, down from 9.0% between 2000 and 2010. The influx of younger, healthier beneficiaries since 2011, when the baby boom generation started becoming eligible for Medicare, was a contributing factor in the slower rate of growth in overall Medicare spending in the 2010s. Slower growth in Medicare spending can also be attributed to policy changes made by the ACA, including reductions in Medicare payments to plans and providers and increased revenues, and the Budget Control Act of 2011, which lowered Medicare spending through sequestration that reduced payments to providers and plans by 2%, beginning in 2013 and since extended through 2031.
- Between 2020 and 2030, average annual growth in total Medicare spending is projected to be somewhat higher than between 2010 and 2020 (6.5% vs. 5.9%).
Growth in Medicare Spending Per Person
Prior to 2010, per enrollee spending growth rates were comparable for Medicare and private health insurance. With the recent slowdown in the growth of Medicare spending and the recent expansion of private health insurance through the ACA, the difference in growth rates between Medicare and private health insurance spending per enrollee widened but is expected to be roughly the same over the next decade.
- In the 1990s and 2000s, Medicare spending per enrollee grew at a similar rate to per enrollee spending among people with private insurance: 5.8% and 5.9%, respectively, in the 1990s and 7.4% and 7.0% in the 2000s.
- Between 2010 and 2020, Medicare per capita spending was relatively low, and grew more slowly than private insurance spending, increasing at an average annual rate of 1.9% over these years, while average annual private health insurance spending per capita grew at a rate of 2.8%.
- Between 2020 and 2030, Medicare per capita spending is projected to grow at a faster rate than between 2010 and 2020, on par with average annual growth in per capita private health insurance spending (5.4% vs. 5.3%).
Growth in Per Capita Medicare Spending on Parts A, B, and D
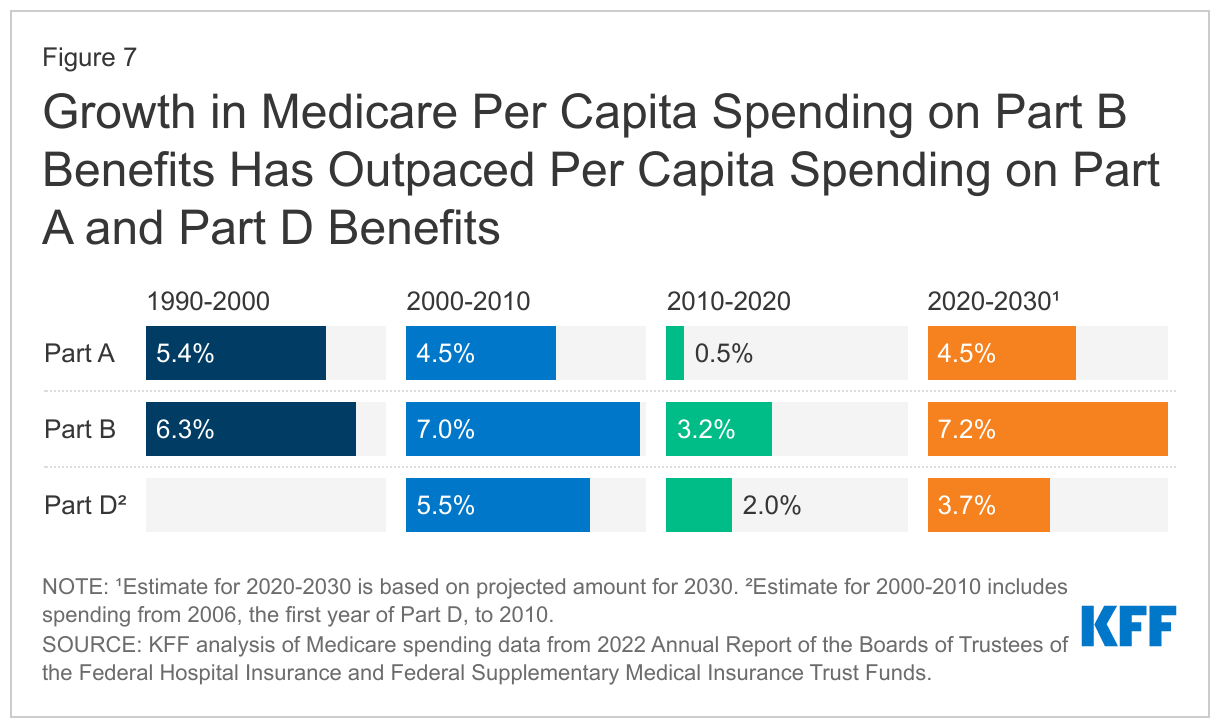
- Between 2010 and 2020, per capita spending on each of the three parts of Medicare (A, B, and D) grew more slowly than in previous decades (Figure 7). For Part D, estimates are based on spending starting in 2006, the first year of the Part D benefit. For example, the average annual growth rate for Part A was 0.5% between 2010 and 2020, down from 4.5% between 2000 and 2010. For Part B, average annual spending grew at 3.2% between 2010 and 2020, down from 7.0% between 2000 and 2010.
- Between 2020 and 2030, Medicare’s actuaries project a higher per capita growth rate for each part of Medicare, compared to growth between 2010 and 2020: 4.5% for Part A (up from 0.5%), 7.2% for Part B (up from 3.2%), and 3.7% for Part D (up from 2.0%). The Medicare Trustees project faster growth in Part B per capita spending due to higher spending on outpatient hospital services and physician-administered drugs, while the projected increase in Part D per capita spending growth is driven by a slowdown in the generic dispensing rate and increased specialty drug use, offset somewhat but not completely by higher manufacturer rebates negotiated by private plans. The projections for Part B and Part D do not take into account any savings associated with implementation of the prescription drug provisions in the Inflation Reduction Act. The Medicare Trustees have not yet updated spending projections to reflect these changes.
How is Medicare Financed?
Funding for Medicare Comes Primarily from General Revenues, Payroll Taxes, and Premiums
Funding for Medicare, which totaled $888 billion in 2021, comes primarily from general revenues (46%), payroll tax revenues (34%), and premiums paid by beneficiaries (15%) (Figure 8). Other sources include taxes on Social Security benefits, payments from states, and interest. The different parts of Medicare are funded in varying ways, and revenue sources dedicated to one part of the program cannot be used to pay for another part.
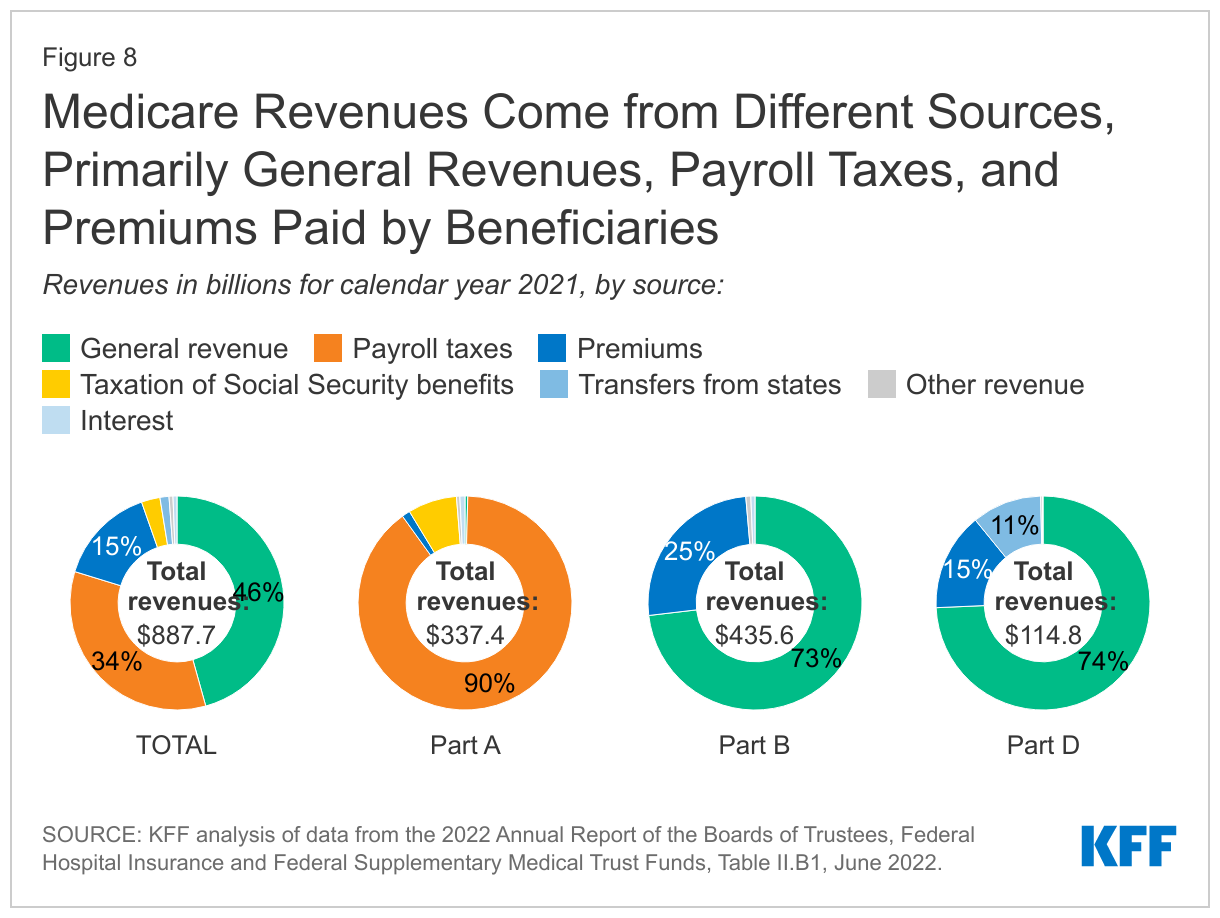
- Part A, which covers inpatient hospital stays, skilled nursing facility (SNF) stays, some home health visits, and hospice care, is financed primarily through a 2.9% tax on earnings paid by employers and employees (1.45% each). Higher-income taxpayers (more than $200,000 per individual and $250,000 per couple) pay a higher payroll tax on earnings (2.35%). Payroll taxes accounted for 90% of Part A revenue in 2021.
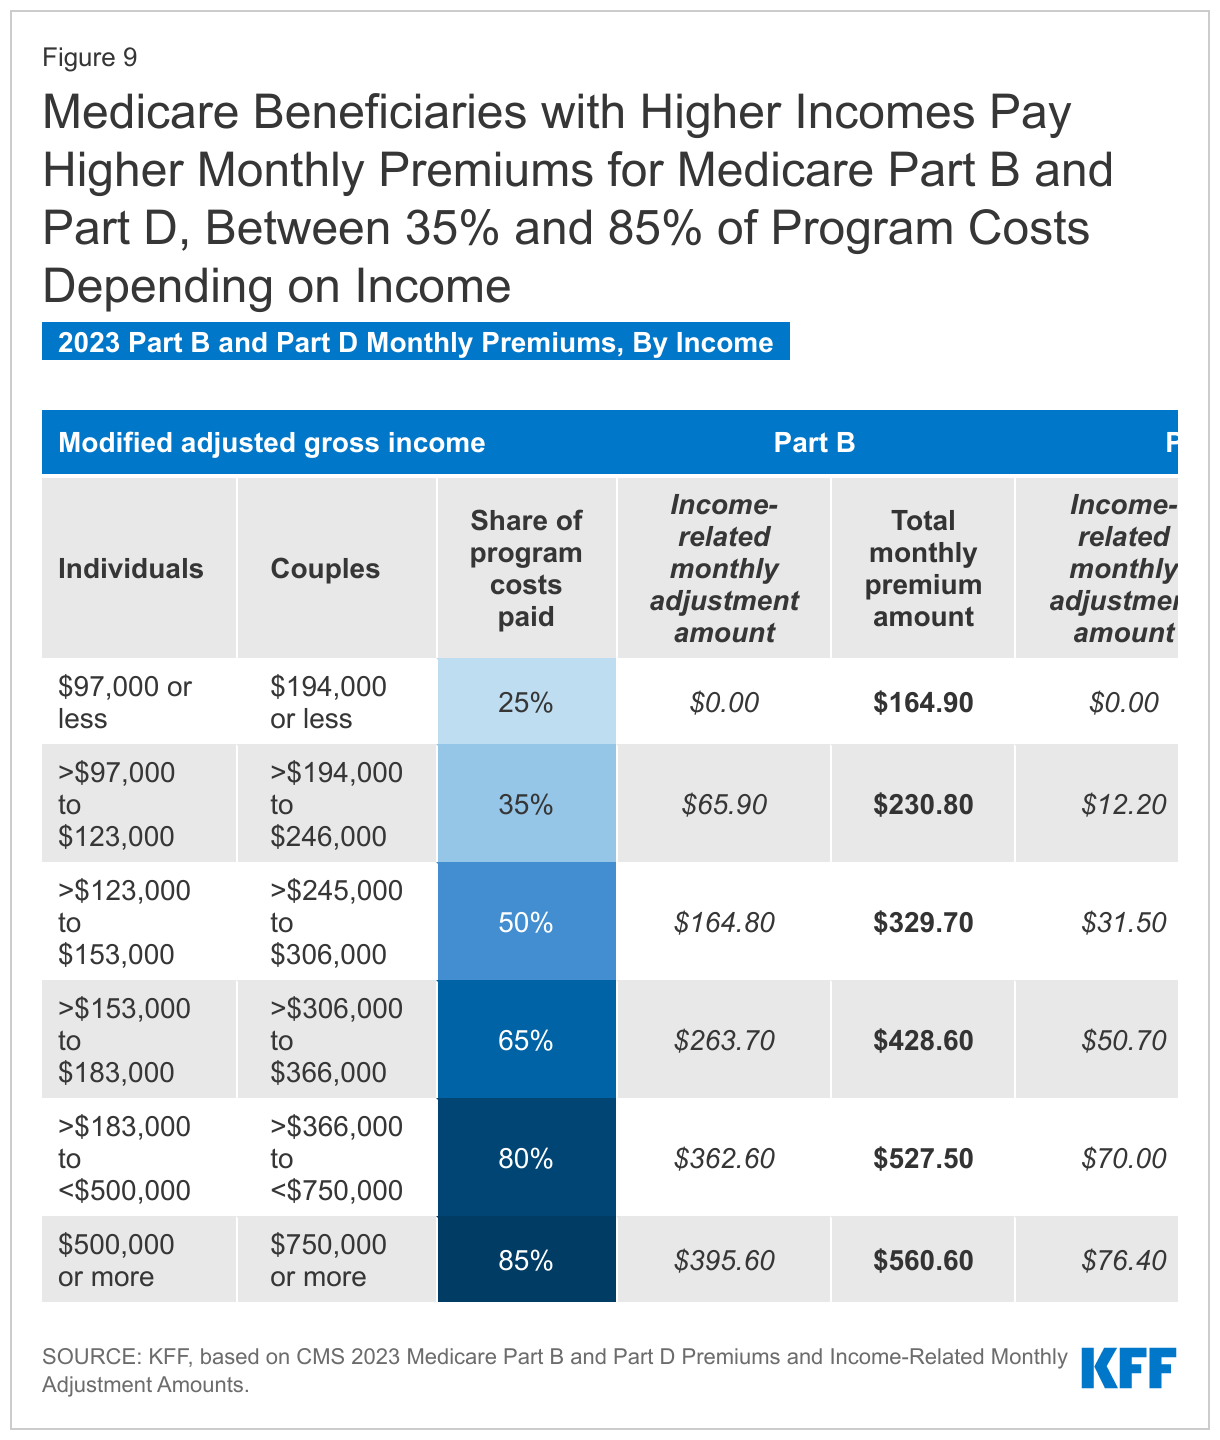
- Part B, which covers physician visits, outpatient services, preventive services, and some home health visits, is financed primarily through a combination of general revenues (73% in 2021) and beneficiary premiums (25%) (and 2% from interest and other sources). Beneficiaries with annual incomes over $97,000 per individual or $194,000 per couple pay a higher, income-related Part B premium reflecting a larger share of total Part B spending, ranging from 35% to 85% (Figure 9).
- Part D, which covers outpatient prescription drugs , is financed primarily by general revenues (74%) and beneficiary premiums (15%), with an additional 11% of revenues coming from state payments for beneficiaries enrolled in both Medicare and Medicaid. Higher-income enrollees pay a larger share of the cost of Part D coverage, as they do for Part B.
Medicare Advantage Is Not Separately Financed
The Medicare Advantage program (sometimes referred to as Part C) does not have its own separate revenue sources. Funds for Part A benefits provided by Medicare Advantage plans are drawn from the Medicare HI trust fund (accounting for 42% of Medicare Advantage spending on Part A and B benefits in 2021). Funds for Part B and Part D benefits are drawn from the Supplementary Medical Insurance (SMI) trust fund. Beneficiaries enrolled in Medicare Advantage plans pay the Part B premium and may pay an additional premium if required by their plan. In 2022, 69% of Medicare Advantage enrollees pay no additional premium.
Assessing Medicare’s Financial Condition
Medicare’s financial condition can be assessed in different ways, including comparing various measures of Medicare spending—overall or per capita—to other spending measures, such as Medicare spending as a share of the federal budget or as a share of GDP, as discussed above, and estimating the solvency of the Medicare Hospital Insurance (Part A) trust fund.
The Medicare Hospital Insurance Trust Fund Faces Solvency Challenges
The solvency of the Medicare Hospital Insurance trust fund, out of which Part A benefits are paid, is one way of measuring Medicare's financial status, though because it only focuses on the status of Part A, it does not present a complete picture of total program spending. The solvency of Medicare in this context is measured by the level of assets in the Part A trust fund. In years when annual income to the trust fund exceeds benefits spending, the asset level increases, and when annual spending exceeds income, the asset level decreases. When spending exceeds income and the assets are fully depleted, Medicare will not have sufficient funds to pay all Part A benefits for the full year.
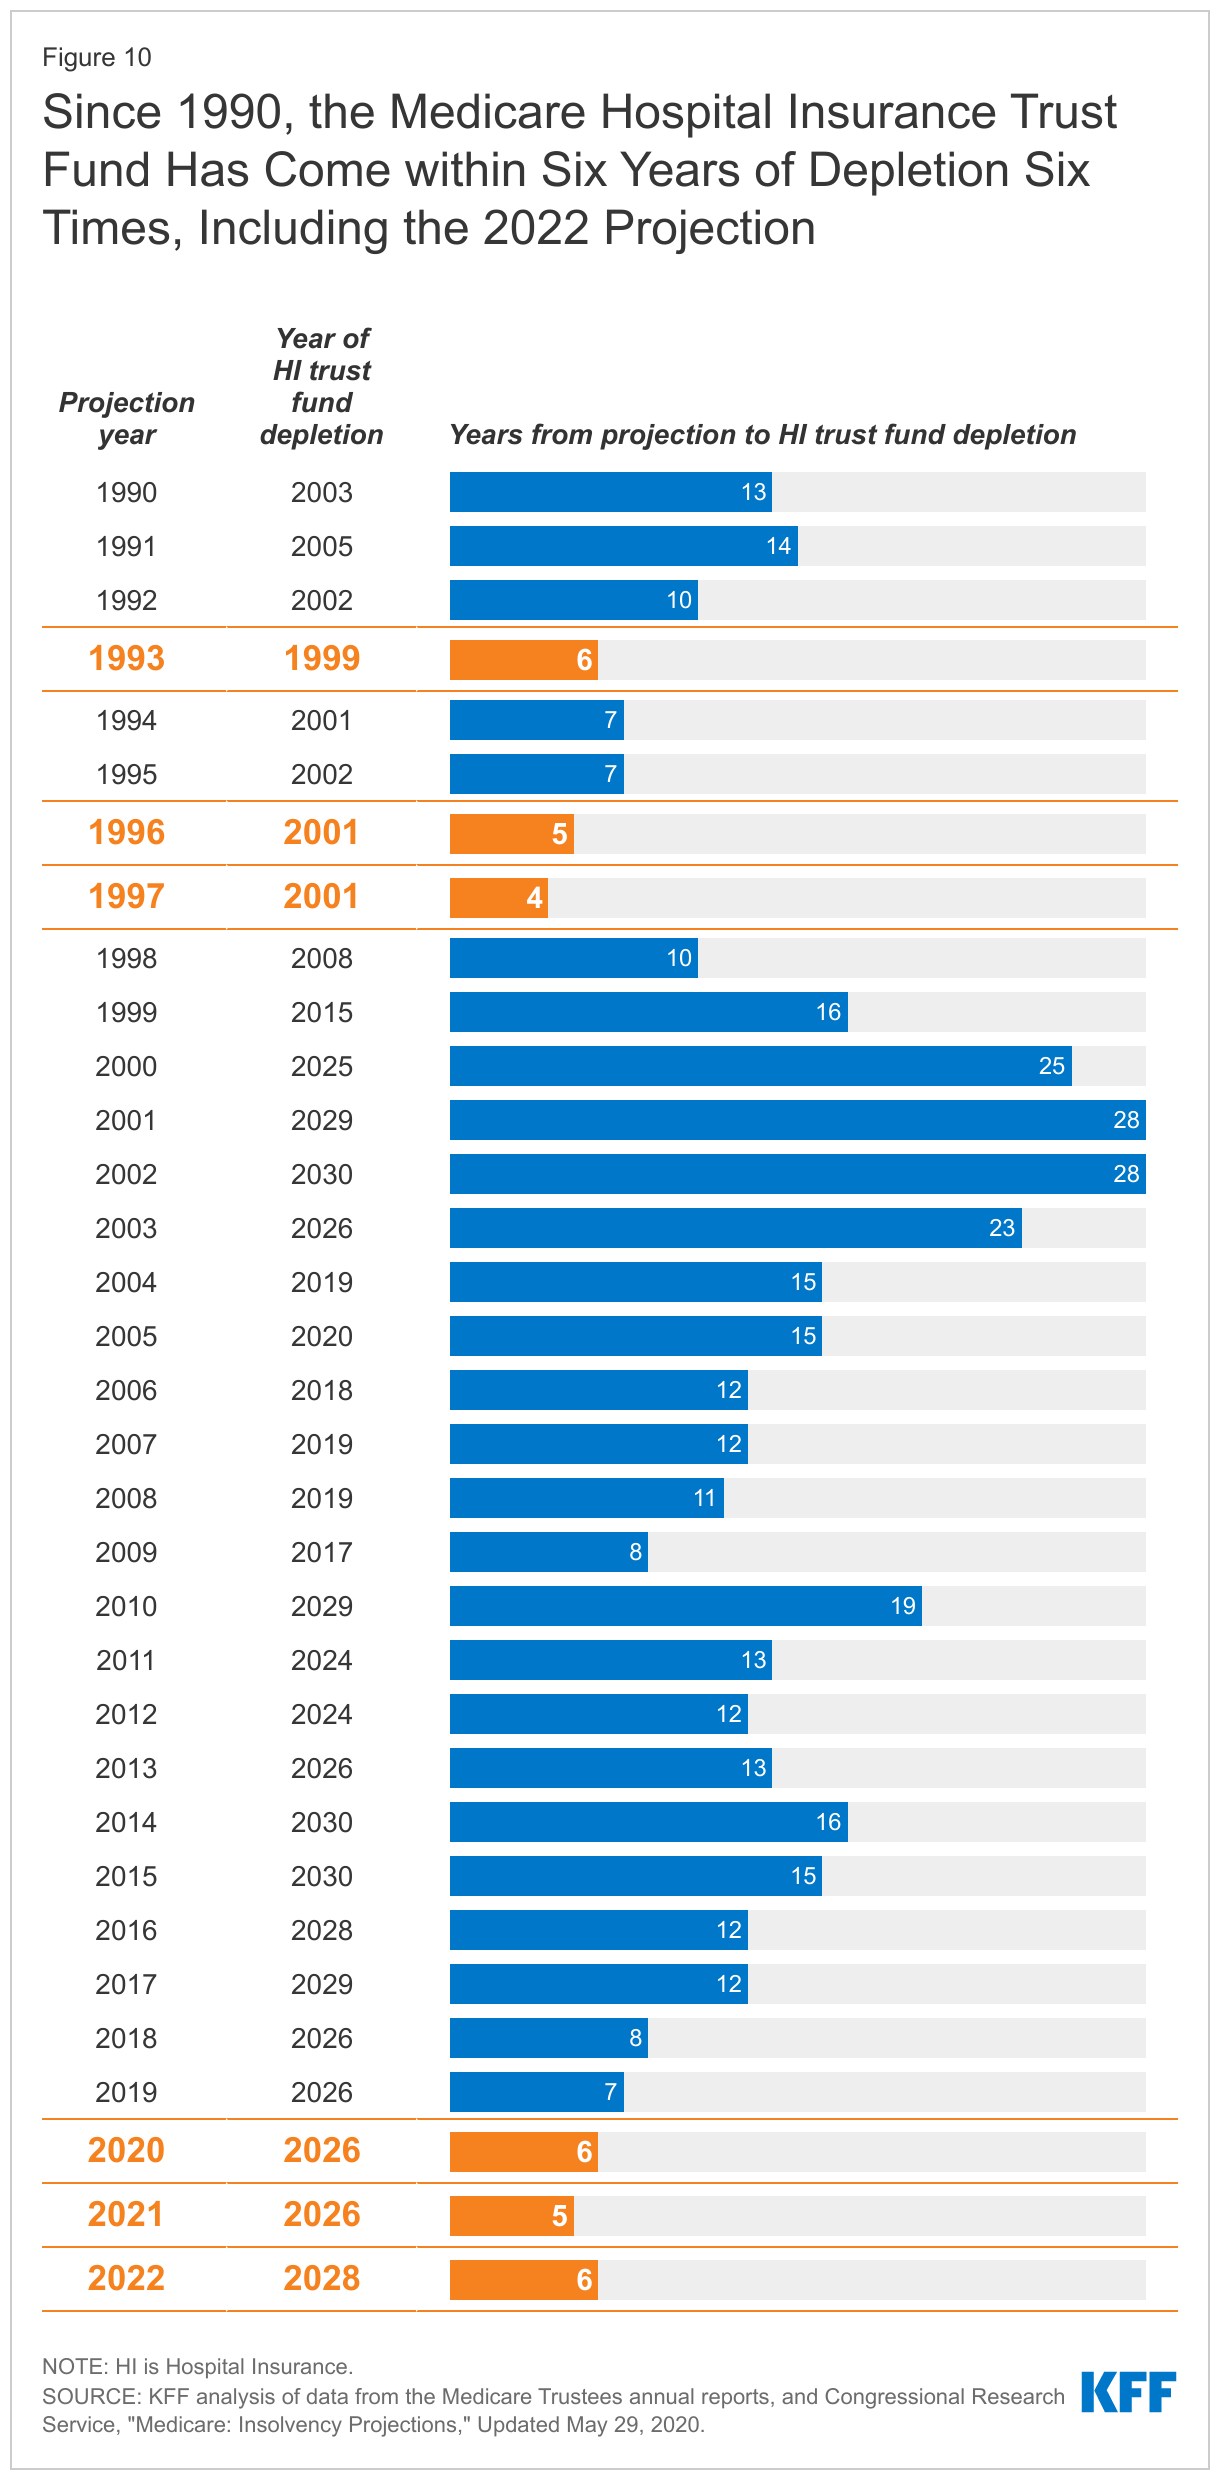
Each year, Medicare’s actuaries provide an estimate of the year when the asset level is projected to be fully depleted. In the 2022 Medicare Trustees report, the actuaries projected that the Part A trust fund will be depleted in 2028, six years from now. This is a modest improvement from the projection in the 2021 Medicare Trustees report, when the depletion date was projected to be 2026, based primarily on projections of higher revenues from payroll taxes resulting from higher employment and wage growth. Since 1990, the Trustees have projected that the Medicare Part A trust fund will come within six years of depletion six times (Figure 10).
The actuaries estimate that in 2028, Medicare will be able to cover almost all of Part A benefits spending with revenues plus the small amount of assets remaining at the beginning of the year, and just under 90% with revenues alone in 2029 through 2031, once the assets are depleted. Over a longer 75-year timeframe, the Medicare Trustees estimate that it would take either an increase of 0.70% of taxable payroll (from 2.9% to 3.6%) or a 15% reduction in benefit payments to bring the Part A trust fund into balance.
The Solvency of the Part A Trust Fund Is Affected by Several Factors
In addition to legislative and regulatory changes that affect Part A spending (including utilization of services and payments for services provided by hospitals, skilled nursing facilities, and other providers, and for Part A services covered by Medicare Advantage plans) and revenues, Part A trust fund solvency is affected by:
- The level of growth in the economy, which affects Medicare’s revenue from payroll tax contributions: economic growth that leads to higher employment and wages boosts revenue to the trust fund, while an economic downturn can have the opposite effect.
- Overall health care spending trends: higher health care price and cost growth can lead to higher spending for services covered under Medicare Part A, which could hasten the depletion date, while moderation in the growth of prices and costs could slow spending growth.
- Demographic trends: this includes the aging of the population, which is leading to increased Medicare enrollment, especially between 2010 and 2030 when the baby boom generation reaches Medicare eligibility age; a declining ratio of workers per beneficiary making payroll tax contributions, which means lower revenue; and other factors, such as fertility rates and immigration.
While Part A is funded primarily by payroll taxes, benefits for Part B physician and other outpatient services and Part D prescription drugs are funded by general revenues and premiums paid for out of separate accounts in the Supplementary Medical Insurance (SMI) trust fund. The revenues for Medicare Part B and Part D are determined annually to meet expected spending obligations, meaning that the SMI trust fund does not face a funding shortfall, in contrast to the HI trust fund. But higher projected spending for benefits covered under Part B and Part D will increase the amount of general revenue funding and beneficiary premiums required to cover costs for these parts of the program in the future.
Impact of COVID-19 on Medicare Spending and Financing
According to the Medicare Trustees, the COVID-19 pandemic has had a significant impact on Medicare spending and financing, and some effects are expected to continue for several years. In terms of revenues, the pandemic initially resulted in a substantial increase in unemployment that caused a drop in payroll tax revenue to the HI trust fund. Spending was affected by new outlays for COVID-19 treatment, testing, and vaccine administration, plus accelerated and advance payments to providers, but this higher spending was more than offset by a steep reduction in spending on non-COVID services, as utilization dropped sharply in 2020. While utilization picked up again in 2021, it remained lower than expected that year. In addition, beneficiaries who died of COVID-19 had higher costs pre-pandemic than the average Medicare beneficiary, and the lower morbidity among the surviving Medicare population contributed to modestly lower costs in 2020 and 2021, according to the Medicare Trustees.
Moving forward, the Trustees project that the spending effects of the pandemic will not have a large effect on the financial status of the Medicare program beyond 2028. Accelerated and advance payments are expected to be fully repaid by the end of 2022. A rebound in employment since the early days of the pandemic has bolstered payroll tax revenue in the short term, while Medicare spending trends are expected to return to pre-pandemic levels in 2024 as beneficiaries seek care that was deferred in 2020 and 2021, which in fact may lead to more intensive and costly services. The morbidity effect associated with deaths due to COVID-19 is expected to decrease over time and end in 2028.
The Future Outlook
Over the longer term, the Medicare program faces financial pressures associated with higher health care costs, growing enrollment, and an aging population. Growth in Medicare spending places pressure on the federal budget, contributes to the depletion of the Part A trust fund, and results in higher Medicare premiums, deductibles, and cost sharing paid by beneficiaries.
A number of changes to Medicare have been proposed in the past to address Medicare’s fiscal challenges, including options such as raising the age of Medicare eligibility and transitioning Medicare to a premium support system. More recently, Congress passed the Inflation Reduction Act of 2022, which aims to control the growth in Medicare prescription drug spending by requiring the federal government to negotiate drug prices in Medicare and requiring drug manufacturers to pay rebates for drug price increases faster than inflation, among other changes. To sustain Medicare for the long run, policymakers may consider adopting broader changes to the program that could include both changes in payments to health care providers and Medicare Advantage plans or reductions in benefits, and additional revenues, such as payroll tax increases or new sources of tax revenue.
At the same time, proposals that could increase Medicare spending are also being discussed, or have been adopted, including policies related to provider payments and Medicare benefit improvements. For example, the recently-enacted Consolidated Appropriations Act, 2023 includes several Medicare spending provisions, such as a reduction in the scheduled physician payment cut for 2023 from 4.5% to 2%, increases in payments to certain hospitals, an extension of Medicare telehealth coverage through 2024, and improvements in Medicare coverage of mental health services. Spending on these provisions will be offset in part by extending the 2% Medicare payment sequestration, currently set to expire in 2031, partway into fiscal year 2032. In addition, policymakers have expressed interest in other policies that could increase Medicare spending, such as enhancing Medicare’s benefit package by adding coverage of vision, hearing, and dental care, adding an out-of-pocket spending cap to traditional Medicare, making permanent Medicare coverage of telehealth, and strengthening financial protections for low-income beneficiaries.
While the prospects for proposals that would affect Medicare spending and financing over the long term are unknown, evaluating such changes will involve a consideration of their effects on federal expenditures, the Medicare program’s finances, and beneficiaries, health care providers, and taxpayers.
This work was supported in part by Arnold Ventures. KFF maintains full editorial control over all of its policy analysis, polling, and journalism activities.