Total Run Time: 2:02

Total Run Time: 1:58

Health Care Costs Keep Rising … Why and Who Pays?

Narrated by:

Published:

The U.S. spends more on health care than other large, wealthy countries. Concerns about rising costs aren’t new, yet somehow we keep paying the bill. 

KFF’s Larry Levitt, Executive Vice President for Health Policy, explains how we got here, who bears the consequences and why reining in spending systematically may be central to the next big health care debate.


Watch and share the full series. Available on YouTube. 

KFF encourages linking to and reposting of our content on social media and other digital platforms.

Choose a video from our YouTube channel, click the Share button, select Embed, and copy the generated <iframe> code. Paste this HTML code directly into your websites editor or source code.

For collaboration or to request direct video downloads (vertical and horizontal formats) and carousel graphics, email us at outreach@kff.org

Subscribe to the KFF YouTube Channel. Stay connected with KFF on other social platforms

When citing us, please note our legal name is KFF. We should be cited as KFF, a nonprofit health policy research, polling, and news organization. Our name is no longer the Kaiser Family Foundation. More about KFF citations and permissions. 

The videos were scripted and produced by KFF. Visuals and graphics were developed using Adobe Creative Cloud with assistance from AI tools and refined by a graphic designer. Additional content: C-SPAN.


Video Transcript

Narrated by Larry Levitt, KFF Executive Vice President for Health Policy

It’s hardly controversial to assert that U.S. health care is far less affordable compared with the rest of the world. 

In 2024, the U.S. spent $14,775 per person on health care compared to $7,860 per person in other high-income countries. 

That’s 88% higher than other large, wealthy countries.

Concerns about rising health care costs aren’t new. 

President Barack Obama said in 2009 that the soaring costs of health care make our current course unsustainable. 

President Bill Clinton said in 1992 that health care costs were increasing at unsustainable rates. 

In 1971, President Richard Nixon described a growing crisis in health care, when national health spending had reached what was then an unthinkable 7% of the economy. 

By 2024, U.S. healthcare spending had reached 18% of GDP. 

Somehow, we keep paying the bill even as health spending continues to increase. But there are consequences to rising health care costs. Health spending crowds out other spending priorities for federal, state, and local governments. 

For employers, the rising cost of health benefits can reduce profits, hurt international competitiveness, increase prices, and result in stagnating wages for workers. 

For individuals, unaffordable health care costs can create barriers to care and result in crushing medical debt, bankruptcy, falling behind on other household expenses, and poorer health. 

While government subsidies and employer contributions to health benefits can reduce out-of-pocket premiums for individuals, those costs must be borne by someone. 

And as health care costs increase, there is pressure on the government to reduce spending on health programs and on employers to shift costs to workers. 

Ultimately, the only way to achieve greater health care affordability systematically is to lower underlying health care costs, especially the price of care for hospitals and prescription drugs. 

And that may be central to the next big health care reform debate.

Total Run Time: 2:19

Total Run Time: 2:14

What Your Employer-Based Health Coverage Really Costs

Narrated by:

Published:

More Americans get health coverage through work than any other source — that’s more than 154 million people. And, the costs keep rising.

While employers bear most of that burden, workers also feel the pressure in the premium deductions in every paycheck and higher deductibles. 

The total premium for a family plan now averages $27,000 a year, according to KFF’s latest annual Employer Health Benefits Survey. That’s enough to buy a new Toyota Corolla Hybrid. Every. Single. Year.

KFF’s Matt Rae, Associate Director of the Program on the Health Care Marketplace, unpacks the full cost of employer-sponsored insurance and why that may be the bigger health care affordability story hiding in plain sight.


Watch and share the full series. Available on YouTube. 

KFF encourages linking to and reposting of our content on social media and other digital platforms.

Choose a video from our YouTube channel, click the Share button, select Embed, and copy the generated <iframe> code. Paste this HTML code directly into your websites editor or source code.

For collaboration or to request direct video downloads (vertical and horizontal formats) and carousel graphics, email us at outreach@kff.org

Subscribe to the KFF YouTube Channel. Stay connected with KFF on other social platforms

When citing us, please note our legal name is KFF. We should be cited as KFF, a nonprofit health policy research, polling, and news organization. Our name is no longer the Kaiser Family Foundation. More about KFF citations and permissions. 

The videos were scripted and produced by KFF. Visuals and graphics were developed using Adobe Creative Cloud with assistance from AI tools and refined by a graphic designer. Additional content: C-SPAN.


Video Transcript

Narrated by Matthew Rae, Associate Director, The Health Care Marketplace Program, KFF

More people get health coverage through an employer than from any other source. That’s 154 million Americans under the age of 65.

The debate over the Affordable Care Act’s expiring enhanced premium tax credits put health care affordability in the national spotlight.

But the issue doesn’t stop with Marketplace enrollees.

In the 2026 midterm election year, the cost of health care is a top economic worry for voters. 

And for good reason. The costs add up.

People who get health insurance through an employer typically see a deduction in every paycheck for their share of the premium.  

Workers contributed on average $6,850 towards the cost of a family premium in 2025. And, $1,440 for single coverage. 

And those payments are just the starting cost.

Most workers also have a deductible that must be met before insurance starts paying for most services. 

Workers at smaller companies, those with fewer than 200 employees, typically face higher out-of-pocket deductibles than those at larger companies.

As substantial as those out-of-pocket costs are, the true price tag of health insurance is largely shielded from workers through employer contributions, which on average cover about three quarters of the total premium. 

The total annual cost for a family plan, including both worker and employer premium contributions, has been steadily rising, now averaging about $27,000 a year. Up 26% from five years before.   

That’s enough to buy a new Toyota Corolla Hybrid. Every. Single. Year.

Rising premiums are straining both workers and employers.

The average annual earnings of a full-time worker was about $62,000. That puts the full cost of a family health insurance premium at over 40% of the typical salary.

Employers single out drug prices as a contributing factor, especially the widely popular and effective GLP-1 medication for diabetes and weight loss.

Add in rising hospital costs and a growing burden of chronic illness and the pressure isn’t letting up anytime soon.

Employer-sponsored insurance is a cornerstone of how Americans access health care. Understanding its full cost and what’s driving it higher matters for workers, employers, and policymakers alike.

Total Run Time: 3:00

Total Run Time: 3:00

Did the Affordable Care Act Make Health Care More Affordable?

Narrated by:

Published:

The Affordable Care Act (ACA) has been criticized for not living up to its name. But has it actually failed on affordability? The answer is complicated — and consequential. 

The ACA opened the door to comprehensive coverage for tens of millions who didn’t have that option before. In 2025, Marketplace enrollment hit an all time high of more than 24 million.

The expiration of the ACA’s enhanced premium tax credits at the start of 2026, combined with rising insurer premiums, put a spotlight on health care affordability that extends beyond Marketplace enrollees. 

KFF’s Cynthia Cox, Senior Vice President and Director, Program on the ACA and Peterson-KFF Health System Tracker, looks at the ACA’s record and the broader underlying question it raises:  what’s a fair price to pay for health care?


Watch and share the full series. Available on YouTube. 

KFF encourages linking to and reposting of our content on social media and other digital platforms.

Choose a video from our YouTube channel, click the Share button, select Embed, and copy the generated <iframe> code. Paste this HTML code directly into your websites editor or source code.

For collaboration or to request direct video downloads (vertical and horizontal formats) and carousel graphics, email us at outreach@kff.org

Subscribe to the KFF YouTube Channel. Stay connected with KFF on other social platforms

When citing us, please note our legal name is KFF. We should be cited as KFF, a nonprofit health policy research, polling, and news organization. Our name is no longer the Kaiser Family Foundation. More about KFF citations and permissions. 

The videos were scripted and produced by KFF. Visuals and graphics were developed using Adobe Creative Cloud with assistance from AI tools and refined by a graphic designer. Additional content: C-SPAN.


Video Transcript

Narrated by Cynthia Cox Senior Vice President, Program on the ACA Director, Peterson-KFF Health System Tracker, KFF 

The Affordable Care Act has been criticized for not living up to its name. But has it actually failed on affordability?

National health spending has been on the rise in recent years, driven by the increasing cost of hospital care, physician and clinical services, and prescription drugs. 

But looking back to the decade after the ACA, annual spending grew markedly slower. 

Dropping from average increases of 10 to 12 percent a year in the 1970s and 80s to around 4 percent in the 2010s.

It’s hard to prove that the ACA restrained spending, but there’s no evidence it accelerated growth even while helping to bring down the rates of the uninsured by providing coverage for millions more people.

The ACA allowed states to expand Medicaid to cover more low income individuals. It also created new Marketplaces where people without coverage through a job or other sources could buy their own insurance.

Now, the self-employed, small business owners, those between jobs or working without benefits, retirees not yet eligible for Medicare, can buy a comprehensive plan comparable to most employer-sponsored insurance.

The ACA also set new insurance regulations, among the most significant of which was prohibiting insurers from charging more or denying coverage based on a pre-existing health condition. 

It also established a list of essential health benefits that insurance must offer without lifetime or annual limits.

Importantly, the ACA’s individual market has similar average premiums as employer-sponsored plans. 

While employers offset the high cost of health insurance for workers, under the ACA, the federal government provides tax credits based on income to make self-purchased coverage more affordable. 

Even with these tax credits, the ACA faced criticism about not being affordable enough.

In 2021, Congress temporarily enhanced the ACA’s premium tax credits, and then extended them through 2025 as part of the Inflation Reduction Act, lowering out-of-pocket premium payments across the board for enrollees.

With coverage more affordable, Marketplace enrollment hit record highs.

The expiration of the enhanced premium tax credits at the end of 2025, combined with insurers charging more for coverage, means ACA Marketplace enrollees are facing higher costs this year. 

On average, up 58 percent, or about $780 more than last year. 

To offset the higher costs, many switched to lower premium plans. But that comes with a tradeoff: higher deductibles.

A KFF survey of ACA Marketplace enrollees found 3 in 10 switched plans in 2026, the large majority citing cost. Another 1in 10 dropped coverage altogether and are now uninsured.

While the expiration of the ACA’s enhanced premium tax credits has raised affordability concerns for many enrollees, the underlying question it raises is a wider reaching one: 

What is an affordable level of health care costs that people should be expected to bear?

Contraceptive Implants: Access and Coverage in the U.S.

Published: Jul 8, 2026

The contraceptive implant is the most effective reversible birth control method available. Implants, along with intrauterine devices (IUDs), are known as long-acting reversible contraception (LARCs) because they can be used to prevent pregnancy for several years and can be removed at any time. Implants have been available since the 1990s and have undergone substantial design modifications since their debut. The newest generation implant was introduced to the U.S. market in 2006 and remains the only contraceptive implant available in the U.S. Barriers to implant use include limited awareness and availability, high up-front costs for clinicians to stock the device, and required insertion and removal by a trained clinician. This fact sheet provides an overview of contraceptive implants including use, availability, and financing.

Background

In 1990, the Food and Drug Administration (FDA) approved Norplant, manufactured by Leiras Oy, the first subdermal contraceptive implant that was inserted under the skin of the upper arm by a trained clinician. Made of silicone, it had six capsules containing levonorgestrel, a synthetic hormone, and was effective for up to five years. Following concerns about its effectiveness and lawsuits on behalf of users who experienced complications, Norplant’s distributor, Wyeth-Ayerst, discontinued its U.S. distribution in 2002.

In 2006, the FDA approved Implanon, a single, thin, plastic, etonogestrel-releasing rod inserted under the skin of the arm. It is manufactured by Organon USA, a division of Merck. The improved design and composition made Implanon easier and faster to insert and remove than first generation implants. In 2010, the manufacturer replaced Implanon with Nexplanon, which is designed to be radiopaque (visible through x-ray) and has an improved insertion device. It is FDA-approved for use up to five years and prevents pregnancy by suppressing ovulation.

With a 0.05% failure rate, the contraceptive implant is the most effective FDA-approved reversible contraceptive. Additionally, the implant removes the potential for user error and non-use associated with self-administered contraception because it is inserted by a clinician and does not require any regular maintenance by the user.

Implants must be inserted and removed by a trained clinician who uses a special insertion device to place the implant just under the skin of the patient’s upper arm. Once inserted, the clinician ensures proper placement of the device by palpating the insertion site. The minor surgical procedure takes a few minutes and requires a local anesthetic and a small incision. After five years of use, the implant must be removed by a trained clinician, and if the patient desires, a new implant can be placed at that time. Implants may be removed by a clinician at any time before five years, and pregnancy can occur as soon as the first week following removal. 

Contraceptive implants are safe for most people and can be inserted any time if the user is not pregnant. Implants are primarily used for pregnancy prevention, but they can also be used to reduce menstrual cramps and make menstrual periods lighter. While there has been some concern about hormonal contraception for individuals who are breastfeeding, findings from the U.S. Selected Practice Recommendations for Contraceptive Use show that progestin-only methods, such as the implant, do not appear to negatively affect breastfeeding outcomes. Some common side effects include irregular menstrual bleeding, headache, weight gain, and breast pain, which may lead to discontinuation among some users. Although rare, some users who smoke or have certain health conditions may have a higher risk of developing severe complications.

Implant Use, Availability, and Awareness

Use

Because of their efficacy, continuation, and satisfaction rates, leading medical groups including the American College of Obstetricians and Gynecologists (ACOG) and the American Academy of Pediatrics have recommended the use of implants for most individuals of reproductive age, including adolescents and nulliparous and postpartum women. However, research demonstrates persistent misperceptions and a lack of awareness about implants. Although implant use in the U.S. has increased since it was first introduced in 1995, it is still lower than other contraceptive methods such as the IUD, pill, and sterilization.

Between 2022 and 2023, the most recent years for which there are national data, 5% of women ages 15-49 who were currently using contraception used the implant (Figure 1). Implant users tended to be younger, lower-income, and covered by Medicaid. Notably, one in ten (11%) adolescent girls who use contraception report using the contraceptive implant compared to only 1% of women ages 35 to 49. Possible explanations for the association of higher implant use among younger women and lower-income women include the desire to avoid pregnancy for a longer period of time, lower maintenance and chance of user error, promotion of LARCs by medical organizations for adolescents, and availability at publicly funded clinics.

The Contraceptive Implant Is Most Frequently Used Among Women Who Are Younger, Have Lower Incomes, And Covered by Medicaid (Bar Chart)

Availability and Awareness

Access to implants can depend, in part, on the clinician’s ability and willingness to offer them. A 2023 KFF survey of OBGYNs found that eight in ten (83%) OBGYNs provided contraceptive implants in their practice. Publicly funded family planning clinics are an important source of care for many low-income and uninsured people of reproductive age. Access to contraceptive implants has been challenging for some clinics due to high upfront costs, as well as limited training and staff capacity to insert the device. As a result, some sites may be unable to provide the full range of contraceptive services to their patients, including contraceptive implants. Overall, 75% clinics offered implants from 2022-2023 compared to 61% in 2015.

Physicians may require multiple visits for a contraceptive implant insertion, which can be inconvenient for patients with limited time and resources. ACOG recommends OBGYNs implement same-day insertion procedures to improve patient access and experiences with contraceptive care, but some clinicians report barriers such as high upfront costs and challenges with reimbursement for contraceptive implants. Nonetheless, the share of publicly funded family planning clinics that offer same-day contraceptive implant insertions has increased overall. Between 2022 and 2023, about two-thirds (69%) of clinics performed same-day insertions, compared to one in three (37%) in 2015. 

In 2026, the FDA made some changes to the provision of implants. One change was the extension of the use of the implant from three to five years. Additionally, the FDA made the implant available only through the FDA’s Risk Evaluation and Mitigation Strategy program (REMS), a drug safety program with special requirements for clinicians, pharmacies, and other distributors who wish to provide the implant, due to the rare but serious health risks associated with improper insertion of the device. The Nexplanon REMS program requires clinicians to register with REMS, pass a specialized knowledge assessment, and complete an in-person 90-minute training from the manufacturer to become certified in Nexplanon insertion and removal. In addition to medical doctors, the training is open to advanced practice clinicians (such as nurses and physician assistants) who are authorized to perform implant insertions and removals in their practice jurisdiction. Additional clinical training for the implant is available from a variety of reproductive health organizations.

Insurance Coverage and Financing of Implants

The wholesale price for an implant is about $1275, in addition to potential costs associated with insertion and removal. The Affordable Care Act’s (ACA) contraceptive coverage requirement eliminated many women’s out-of-pocket costs for contraceptives, although some women still do not have access to full coverage.

There is currently no generic or therapeutically equivalent version of Nexplanon available in the U.S. Nexplanon’s manufacturer, Organon USA (a division of Merck), currently holds patents on the device and associated materials, though these patents are set to expire between 2027 and 2030.

Private Insurance

The ACA includes a requirement that most private insurance plans cover at least one type of all 18 FDA-approved contraceptive methods as prescribed without cost sharing. This means that most private plans must cover the implant at no cost to policy holders. Before the ACA was passed, individuals with private insurance were likely to face out-of-pocket expenses for the implant and associated visits. After the contraceptive coverage mandate went into effect in 2012, research found that about three in four (73%) women with private insurance paid $0 in out-of-pocket expenses for contraceptive implants in 2020, compared to about three in then (28%) in 2012. However, recent research suggests an increase in the number of women with out-of-pocket expenses for contraceptive implant insertion, despite the coverage requirement. While nearly two-thirds (64%) of women with private insurance continued to have no out-of-pocket expenses for contraceptive implant insertion, over one in three (36%) paid a median cost of $16.88 for implant-related services in 2023—including office visits, ultrasounds, medications, and STI and pregnancy testing. Nonetheless, studies have found an increase in LARC initiation overall among women with private insurance coverage since the ACA’s coverage requirement took effect.

Insurers can use medical management to help control costs and encourage beneficiaries to choose more affordable contraceptive methods, but federal guidance prohibits insurers from categorically restricting access to a particular contraceptive method. Insurers can choose to cover generic contraceptives while charging cost-sharing for the brand-name version. Since contraceptive implants do not have a generic equivalent, the brand-name version (Nexplanon) must be covered without cost-sharing.

Medicaid

Federal law requires Medicaid programs to cover family planning services and supplies without cost sharing, but there are variations in coverage between states and between different Medicaid populations. For enrollees of the traditional Medicaid programs that were in place prior to the passage of the ACA, coverage of implants is determined by each state program. Recognizing the high (cost) effectiveness of LARCs, many states are pursuing policies to reduce barriers to provision, like reimbursing for insertion and removal, returning unused devices for credit, and providing hospitals with separate payments for post-partum LARC insertion.

Those who qualify for Medicaid under the ACA’s expansion of the program must receive coverage for the implant because the ACA requires these expansion programs to cover all FDA-approved methods for women without cost sharing, which is the same as the requirement for private insurance plans. Furthermore, 30 states and D.C. extend Medicaid coverage for family planning services, including contraception, to some uninsured women who do not qualify for full scope Medicaid.

Uninsured

The federal Title X Family Planning Program funds a network of clinics to provide family planning care to millions of low-income and uninsured people at reduced or no cost. Federal guidelines such as the Office of Population Affairs’ and the CDC’s Providing Quality Family Planning Services (QFP) and the Health Resources and Services Administration’s (HRSA) recommendations for women's preventive services state that offering women the full range of FDA-approved contraceptive methods is a crucial aspect of quality family planning services.

Research shows that sites that received Title X funds were consistently more likely to offer contraceptive implants compared to sites that do not receive Title X funding. Community health centers (CHCs) and specialized family planning clinics such as Planned Parenthood centers play a critical role in providing reproductive health care to low-income people, medically underserved communities, and people who are uninsured. CHCs are required to provide “voluntary family planning” services but have significant leeway in determining the specific services they provide. For example, nearly all (98%) Planned Parenthood clinics offered same-day implant insertions from 2022 to 2023, compared to just over half (57%) of federally qualified health clinics.

As a result of the 2025 One Big Beautiful Bill Act and other federal policy changes, the uninsured rate is expected to rise substantially over the next decade. Uninsured women could decide to stop using contraception because they cannot afford it or switch to a less effective method, which could result in an increase of unwanted pregnancies and a loss of reproductive autonomy. KFF research has found that one in five uninsured women of reproductive age has had to stop using a birth control method in the past 12 months because they couldn’t afford it, a rate that is four times greater than those with Medicaid (5%) or private insurance (2%).

News Release

In Preliminary Rate Filings, ACA Marketplace Insurers Largely Propose Double-Digit Premium Increase For 2027, Following a Steep Climb This Year 

Premiums Could Jump More Than One-Third Over Two Years—Middle-Income Enrollees Face the Full Costs Without Enhanced Credits, Even as Existing Federal Subsidies Shield Most from Further Increases

Published: Jul 8, 2026

ACA Marketplace insurers are proposing a median premium increase of 14% for 2027— indicating a likely second consecutive year of double-digit increases, according to a new analysis of preliminary rate filings in 16 states and DC. If these increases hold, typical premiums for insurers participating in the ACA Marketplaces would jump by more than one-third between 2025 and 2027.

Across the 77 ACA Marketplace insurers in the 16 states and DC that have submitted rate filings so far, most are requesting premium increases of between 10% and 20% for 2027, with 20 insurers requesting premium increases of more than 20%.  

July 15 is the deadline for health insurance companies to submit their proposed premiums for 2027 ACA Marketplace plans. These preliminary filings provide insight into the factors insurers expect to drive health costs for the coming year. Among the key drivers, insurers cite the rising cost of health services, the expiration of the enhanced premium tax credits, and some federal regulatory changes.

  • The rising cost of health services have been driven by the cost of hospitalizations, physician visits, and prescription drugs—including GLP-1s and other specialty medications. Relatedly, labor shortages and general economic inflation have driven up provider wages and costs, increasing the cost of health services as well. The underlying cost of medical care and prescription drugs has risen by 10% for 2027—greater than the 8% average growth seen over the last few years.
  • The ACA’s enhanced premium tax credits expired at the end of 2025—leading to a 58% average increase in out-of-pocket premiums in 2026 and deductibles of about $1,000 more per person. Most Marketplace enrollees are largely protected from the premium increases because they still qualify for ACA subsidies, though at a lower level. However, people with incomes at 400% or more of the federal poverty level ($62,600 for a single person in 2026) lost subsidies entirely when the enhanced credits expired and, therefore, face the full increase in premiums. This caused many healthier enrollees to leave the ACA Marketplaces in 2026, leaving behind a smaller number of enrollees who are somewhat sicker and more expensive to cover on average. Further market deterioration is expected heading into 2027. Insurers estimate that the sicker risk pool drove 2026 premiums up by roughly four percentage points and expect another four percentage point increase in 2027.
  • Federal regulatory changes, including the recent Notice of Benefit and Payment Parameters and the Marketplace Integrity and Affordability Rule, have also been cited as having an upward effect on premiums.  

The full analysis and other data on health costs are available on the Peterson-KFF Health System Tracker, an online information hub dedicated to monitoring and assessing the performance of the U.S. health system.

Digital Health Tools and Technologies: An Overview of CMS’ Recent Efforts to Expand Their Use in Medicare

Authors: Nancy Ochieng, Juliette Cubanski, and Tricia Neuman
Published: Jul 7, 2026

As an increasing share of older adults have adopted digital health technologies over the past several years, and with most expressing interest in using them to manage their health care, the Centers for Medicare & Medicaid Services (CMS) has introduced several initiatives to expand the use of digital health technologies in Medicare. Broadly speaking, these technologies include health-related applications (“apps”), online patient portals, and connected devices such as smartphones and wearable devices that can be used to measure or track health data.   

A central component of CMS’s efforts in this area is the Health Tech Ecosystem, launched in 2025, through which CMS partners with private-sector organizations, including health care providers, payers, health app developers, and electronic health record vendors, to increase the availability of digital health tools and improve access to and exchange of electronic health information. While the initiative spans all CMS programs, people with Medicare gained access to the first wave of personalized health apps through the new Medicare app Library launched in April 2026, which allows beneficiaries to access third-party apps that have undergone independent review and meet certain requirements for privacy and security.

Separately, CMS introduced the ACCESS Model, a new Center for Medicare and Medicaid Innovation payment model scheduled to begin in July 2026 that aims to expand access to technology-enabled care for people in traditional Medicare with certain chronic conditions. CMS also enhanced the Medicare Plan Finder, the official online tool on Medicare.gov that helps beneficiaries compare and select Medicare coverage options.

This brief summarizes these digital health initiatives and draws on data from various surveys, including KFF Tracking Polls from September 2025 and March 2026, to highlight facts about recent experiences with and use of digital health tools among Medicare beneficiaries and older adults more generally.

The CMS Health Tech Ecosystem Aims to Expand Access to Patient-Facing Apps and Improve Health Data Exchange  

As part of the CMS Health Tech Ecosystem, dozens of companies have pledged to develop patient-facing apps that support exchange of health data and enable connectivity to the new Medicare App library, where people with Medicare can access third-party apps that meet CMS’s privacy and security criteria. To support the use of these tools, participating app developers, health information networks, electronic health record vendors, and payers have agreed to adopt common standards that make it easier for patients and providers to access and exchange electronic health information through the apps. The Medicare App library that launched in April 2026 will feature apps that meet one of the following initial use cases:

  • Supporting management and prevention of diabetes and obesity, such as features that enable medication management or include resources related to prediabetes.
  • Integrating conversational artificial intelligence (AI) assistants to help people navigate their care options and manage aspects of their health care, such as checking symptoms.
  • Allowing patients to securely share their health and identity information electronically at check-in instead of completing paper forms (so-called “kill the clipboard” apps). Patients can also receive a summary of their visit through the same platform.

As of June 2026, the Medicare app library lists five apps that are available to beneficiaries and an additional eight apps that are expected to be added soon. A search tool on the app library website enables a comparison of apps based on 13 key features, such as managing health records, connecting to wearable devices, or sharing information with caregivers or providers, as well as searching for apps tailored to a range of health conditions and by price, with some apps being free and others requiring a subscription or having paid features.

CMS’s efforts to expand the availability of health care apps that have been vetted by the agency and meet specified standards for privacy and security build on the popularity and appeal of these tools, including among older adults.In 2025, eight in 10 (78%) Medicare beneficiaries ages 65 and older used a health care app or website to manage their health care in the past year, and more than half (58%) said these tools make managing their health care easier, according to a September 2025 KFF Health Tracking Poll (Figure 1). Three-quarters (75%) say they have used a health care app or website to access their medical records or lab results, the most common reported use of health apps among Medicare beneficiaries.

In addition, nearly two-thirds (63%) of older adults on Medicare say it’s important for Medicare to increase the availability of apps that help manage chronic conditions with the help of a health care provider, but few older adults on Medicare—about one in four (23%)— say they have used a health app or website in the past year to manage a chronic condition with their health care provider.

Federal Efforts to Expand Digital Health Tools for People With Medicare Come as Most Older Adults Use Health Apps and Support Greater Availability of These Tools (Small multiple donut chart)

The ACCESS Model Expands Access to Technology-Enabled Care for People in Traditional Medicare with Certain Chronic Conditions

The CMS Innovation Center launched the ACCESS Model in December 2025 to test a national, voluntary payment approach that uses technology-supported care options to help traditional Medicare beneficiaries prevent and manage a specified set of chronic conditions. These chronic conditions are grouped into an initial set of four clinical tracks, two of which target cardiovascular, kidney, or metabolic conditions (e.g., hypertension, diabetes), one that targets musculoskeletal conditions (e.g., chronic musculoskeletal pain), and another that targets behavioral health conditions (e.g., depression). About 7 in 10 Medicare beneficiaries have conditions that qualify for at least one track, though this estimate may change as CMS considers additional conditions and clinical tracks in the future.

The model is voluntary for both participating organizations and people in traditional Medicare, who need to enroll directly with participating organizations or through a referral from their provider. It will run for 10 years from July 2026 through June 2036, with organizations joining in cohorts on a rolling basis throughout the model period. Medicare beneficiaries may disenroll or switch participating organizations after 90 days of their enrollment, and participating organizations may withdraw with advance notice to CMS and beneficiaries. 

To date, 190 organizations have been accepted as participants, including digital health companies, mental health organizations, health systems, and physician groups, most of which, according to CMS, have not previously served Medicare beneficiaries. These participants, who must enroll as Medicare Part B providers or suppliers, will receive monthly payments for managing beneficiaries’ qualifying conditions, with full payment tied to achieving certain health outcomes, such as helping a beneficiary with hypertension lower their blood pressure to a specific level. Currently, the vast majority of accepted applicants (151 organizations) have signed up for at least one of the two tracks focused on cardiovascular, kidney, or metabolic conditions, while 108 have signed up for the track on behavioral health conditions and 76 for the musculoskeletal track. Because organizations can participate in multiple tracks, these categories are not mutually exclusive.

Currently, it is unclear how broadly individual participants will operate geographically or the scope of services offered by each participant. CMS plans to launch a public directory of all ACCESS participants in July 2026, allowing people with Medicare and their providers to identify participating organizations, the conditions they treat, with risk-adjusted outcome measures for each organization expected to be added beginning in 2028. Organizations that participate in the model and also pledge to join the Health Tech Ecosystem will also be featured in the Medicare App Library as participants.

Participating organizations may use a variety of digital tools to deliver services under the Model, ranging from FDA-regulated medical devices such as continuous glucose monitors, to mobile applications, wearables, and non-FDA regulated software. CMS gives participants flexibility in selecting technologies and clinical tools that support the model. Some tools may be classified as clinical devices, including continuous glucose monitors, blood pressure cuffs, and wearable devices such as fitness trackers and smartwatches. Beneficiaries may receive these tools on either a loan or ownership basis from the participating organization or use their own devices. While participants generally may not require beneficiaries to purchase or rent devices classified as clinical, beneficiaries may still need access to non-clinical technologies, such as internet access, tablets, or smartphones to use technology-enabled services.

Variation in the technologies used under the ACCESS Model, as well as Medicare beneficiaries’ access to and familiarity with digital tools, may lead to differences in how people in traditional Medicare access and experience technology-supported care under this model. For example, some beneficiaries may enroll with participating organizations that incorporate the use of technologies already integrated into their care, such as Medicare-covered continuous glucose monitors. Others may enroll with participating organizations that incorporate technologies such as wearable fitness trackers that are generally not covered by Medicare and may be less widely adopted among beneficiaries. For example, in 2024, just under a quarter (23%) of adults ages 65 and older used an electronic wearable device to monitor or track their health or activity in the past year, based on KFF analysis of the Health Information National Trends Survey (Figure 1).  However, among older adults who use wearable devices, the vast majority (85%) said they would be willing to share data from their device with their health care providers.

Medicare Advantage enrollees, who account for more than half of all Medicare beneficiaries, do not qualify for the ACCESS Model, but 16 insurers, including those serving Medicare Advantage enrollees, have pledged to adopt similar models of care to date. Many Medicare Advantage enrollees report having conditions being targeted by the ACCESS Model, including hypertension (64%), diabetes (35%), and depression (28%), based on a KFF analysis of the 2023 Medicare Current Beneficiary Survey (MCBS). Because details about the programs pledged by the 16 insurers are not yet available, it is unclear how they will be structured or the patient populations that will be targeted, though they may resemble existing supplemental benefits offered by Medicare Advantage plans. In 2026, 44% of enrollees are in individual Medicare Advantage plans that offer remote access technologies, which may include clinical devices such as continuous glucose monitors, and 95% are in plans that offer fitness benefits, which may include discounts on wearable devices. For example, some plans offered by Devoted Health, which has pledged to align with ACCESS, offer partial reimbursement for the purchase of a wearable device as part of a fitness benefit. While CMS collects data on use and spending on supplemental benefits in Medicare Advantage plans, such as the number and characteristics of enrollees who use these benefits, this data is currently unavailable to researchers and consumers.

Changes to the Medicare Plan Finder Could Make It Easier to Compare and Select Medicare Coverage Options

In 2025, CMS announced enhancements to the Medicare Plan Finder, the official tool on the Medicare.gov website that helps beneficiaries compare and select Medicare coverage options. These enhancements include the following updates: 

  • Offering Medicare Advantage provider directory information to help beneficiaries identify whether their doctors are in a plan’s network. Unlike traditional Medicare, most Medicare Advantage insurers use provider networks, which can change from year to year. Medicare beneficiaries say having access to their preferred providers is an important factor when selecting their Medicare coverage, yet in 2022, Medicare Advantage enrollees were in a plan that included just under half (48%) of all physicians available to traditional Medicare beneficiaries in their area. Prior to 2025, the Medicare Plan Finder did not include data on provider networks, resulting in beneficiaries’ going to each plan’s website or third-party sources to determine whether their preferred providers were in the network. Incorporating provider directory information in the Medicare Plan Finder may make it easier for beneficiaries to evaluate their coverage options, though the usability and completeness of this feature continue to evolve.
  • Showing additional details on more than 30 supplemental benefits under Medicare Advantage. These details include in-network and out-of-network cost sharing amounts, whether prior authorization is required for each benefit, and whether there are limits on how much the plan will provide. Currently, most Medicare Advantage enrollees are in plans that offer supplemental benefits not covered by traditional Medicare, such as vision, hearing, and dental, and beneficiaries highlight the availability of extra benefits as a reason they choose to enroll in Medicare Advantage plans.

CMA also announced the launch of an “AI-powered” prescription drug search tool that will provide personalized cost comparisons across pharmacies. While prescription drug costs covered under Medicare Part D, including premiums and deductibles, can change from year to year and vary by plan, most enrollees in Medicare Advantage prescription drug plans (81%) and stand-alone prescription drug plans (69%) in 2023 did not compare their plans’ drug coverage with drug coverage offered by other plans in their area. According to CMS, the new prescription drug search tool will be available on Medicare.gov to users with an individual account but will not be incorporated in the Medicare Plan Finder. This tool could provide more individualized guidance to help Medicare beneficiaries lower their prescription drug costs beyond the prescription drug lookup tool that is already incorporated in the plan finder.

However, these enhancements will require beneficiaries to access the Medicare website and navigate the plan finder, even as just over half (53%) of Medicare beneficiaries said they hadn’t visited the Medicare website, according to KFF analysis of the 2023 MCBS, and it is unknown how many beneficiaries have used the Medicare Plan Finder specifically to compare coverage options or enroll in a plan. But with less than a third (28%) of Medicare beneficiaries comparing their coverage options during a previous open enrollment period for Medicare, enhancements to Medicare Plan Finder and Medicare.gov may help address some of the challenges beneficiaries face when evaluating their coverage options and comparing costs.

The Business of Health with Chip Kahn

AI: Rewiring the Machine

July 7, 2026

Video

Audio

About this Episode


Episode 11, AI Series: In a conversation focused on the technology underlying AI in health care, Chip is joined by Seema Verma, former administrator of the Centers for Medicare & Medicaid Services (CMS), and now Executive Vice President and General Manager at Oracle Health and Life Sciences, the second largest electronic health records (EHR) platform in the U.S. Seema shares her insights on the evolution of EHRs and why it’s necessary to redesign these systems to better integrate AI capabilities and improve the quality of care.

The Host


Headshot photo of Chip Kahn wearing a navy blue suit with a red tie, red pendant on lapel, and glasses.

Sr. Visiting Fellow

Charles N. Kahn III is a senior visiting fellow at KFF. He is also a visiting senior fellow at the American Enterprise Institute and a nonresident senior scholar at the University of Southern California’s Schaeffer Center for Health Policy & Economics. He serves as co-chair of the international Future of Health collaborative.

Guest


Executive Vice President and General Manager, Oracle Health and Life Sciences

Seema Verma is Executive Vice President and General Manager of Oracle Health and Life Sciences, leading global strategy to modernize healthcare through data, connectivity, and AI. Previously, she served as Administrator of the Centers for Medicare & Medicaid Services.  

A recognized industry leader, she serves on multiple healthcare boards and has been named among Modern Healthcare’s Most Influential People and Becker’s Healthcare’s Great Leaders in 2026. She has a bachelor’s degree in life sciences from the University of Maryland and a master’s degree in public health from John’s Hopkins University. 


SERIES

This weekly podcast features insightful conversations between host Chip Kahn and his guests, who discuss the business of health care, connecting the dots between the health care business, policy, and patients.

The podcast’s first series on AI in health care illuminates how AI is changing health care, and features guests who are deploying this technology, managing its consequences, and designing policy around it.

Medicare Advantage Insurers Deny Prior Authorization Requests for Post Acute Care at Substantially Higher Rates Than the Overall Denial Rate

Published: Jul 6, 2026

Prior authorization practices by health insurers have come under scrutiny in recent years, in part spurred by the public sentiment that delays and denials of care are a problem. According to KFF polling, about seven in ten insured adults say prior authorization is a burden. New evidence from the Office of Inspector General (OIG) within the Department of Health and Human Services documents the high rate of denials of prior authorization requests for certain post-acute care services in Medicare Advantage plans, which now enroll more than half of all Medicare beneficiaries.

The OIG recently published two reports finding that Medicare Advantage insurers deny more than half of all prior authorization requests for the most expensive types of post-acute care, including 65% of requests for stays in long-term care hospitals (LTCHs) and 54% of requests for stays in inpatient rehabilitation facilities (IRFs), as well as 12% of requests for stays in skilled nursing facilities (SNFs). These denial rates are higher, and in the case of LTCHs and IRFs substantially higher, than the overall Medicare Advantage prior authorization denial rate found by KFF in previous analysis of less than 8% for all services (Figure 1). The OIG also found substantial variation across insurers, highlighting the heterogeneous experience Medicare Advantage enrollees could face depending on the private insurer that administers their Medicare benefits.

Medicare Advantage Insurers Deny Prior Authorization Requests for Post-Acute Care at Substantially Higher Rates Than the Overall Denial Rate (Bar Chart)

Insurers use prior authorization to reduce the use of unnecessary or low-value care and to restrain costs. KFF analysis shows that virtually all Medicare Advantage enrollees are in a plan that requires prior authorization for at least some services – most often, high-cost services. For example, in 2026, 95% of Medicare Advantage enrollees are in a plan that requires prior authorization for skilled nursing facility stays. According to the Medicare Payment Advisory Commission (MedPAC), the average Medicare payment in 2023 for traditional Medicare beneficiaries was $43,000 per LTCH stay, $24,000 per IRF stay, and $16,000 per SNF stay.

In 2024, insurers made nearly 53 million prior authorization determinations for Medicare Advantage enrollees. In contrast, prior authorization is rarely used in traditional Medicare (notwithstanding a new Innovation Center model testing the use of AI tools to conduct prior authorization for a limited set of services in traditional Medicare). The new OIG findings suggest the burden of delays and denials from the use of prior authorization is greater for Medicare Advantage enrollees with higher health needs and in more fragile condition. LTCHs generally treat patients with multiple serious conditions, providing services such as respiratory therapy, head trauma treatment, and pain management over the course of hospital stays that extend more than 25 days, on average. IRFs provide intensive rehabilitation services, including for people recovering from strokes or brain injuries. The initial denial of the prior authorization request meant that the requested post-acute care was delayed between 5 and 6 days, on average. In addition to having potential health implications for enrollees seeking post-acute care, the delay could mean higher out-of-pocket spending for the associated hospital stay, because many Medicare Advantage enrollees face daily cost-sharing requirements for hospital stays.

Additionally, the OIG found that when denials were appealed – which happened for 36% of LTCH denials, 31% of IRF denials, and 18% of SNF denials – the requested service was ultimately approved much of the time for LTCHs (36%) and IRFs (43%), and virtually all of the time for SNFs (95%). The extremely high rate of overturning the initial decision upon appeal for SNFs raises questions about whether this care is being routinely inappropriately denied. At the same time, if insurers anticipate that only a relatively small number of initial denials will be appealed, the high overturn rate could reflect a determination by insurers that reversing an initial denial is preferable to having the appeal continue to the next stage. At that point, an independent review entity (IRE) would hear the case, and if the IRE disagrees with the Medicare Advantage insurer’s initial determination to deny a service, that would have a negative impact on a plan’s star ratings.

The findings in the OIG reports are consistent with a previous Senate investigation that found the largest Medicare Advantage insurers denied prior authorization requests for post-acute care at substantially higher rates than other services between 2019 and 2022. Together, these reports underscore the value of having service level data on the use of prior authorization in Medicare Advantage. However, detailed data on the use of prior authorization and denial rates by type of service in Medicare Advantage are not yet required to be reported and therefore not routinely available. The lack of detailed data on prior authorization requests, denials, and appeals has made it difficult to understand the impact on people seeking care and to assess whether initiatives, such as the pledge taken by several private insurers last summer to improve the prior authorization process, are leading to meaningful change. CMS introduced a pilot program to collect more detailed data at the plan and service level this year and anticipates requiring this information beginning in 2027. Nevertheless, it will be several years before those data are available.

Global COVID-19 Tracker

Published: Jul 6, 2026

Editorial Note: The Policy Actions tracker will no longer be updated as the data source has ceased tracking government responses to COVID-19. For more information, please visit the Oxford Covid-19 Government Response Tracker.

Cases and Deaths

This tracker provides the cumulative number of confirmed COVID-19 cases and deaths, as well as the rate of daily COVID-19 cases and deaths by country, income, region, and globally. It will be updated weekly, as new data are released. As of March 7, 2023, all data on COVID-19 cases and deaths are drawn from the World Health Organization’s (WHO) Coronavirus (COVID-19) Dashboard. Prior to March 7, 2023, this tracker relied on data provided by the Johns Hopkins University (JHU) Coronavirus Resource Center’s COVID-19 Map, which ended on March 10, 2023. Please see the Methods tab for more detailed information on data sources and notes. To prevent slow load times, the tracker only contains data from the last 200 days. However, the full data set can be downloaded from our GitHub page. While the tracker provides the most recent data available, there is a two-week lag in the data reporting.

Note: The data in this tool were corrected on March 18, 2024, to clarify that they represent new cases and deaths over a full week rather than the average per day over a seven-day period.

Policy Actions

This tracker contains information on policy measures currently in place to address the COVID-19 pandemic. Policy categories currently being tracked include social distancing & closure measures, economic measures, and health systems measures. Policies are tracked at the country-, income-, and region-level. Please see the Methods tab for more detailed information on data sources and notes.

Social Distancing and Closure Measures

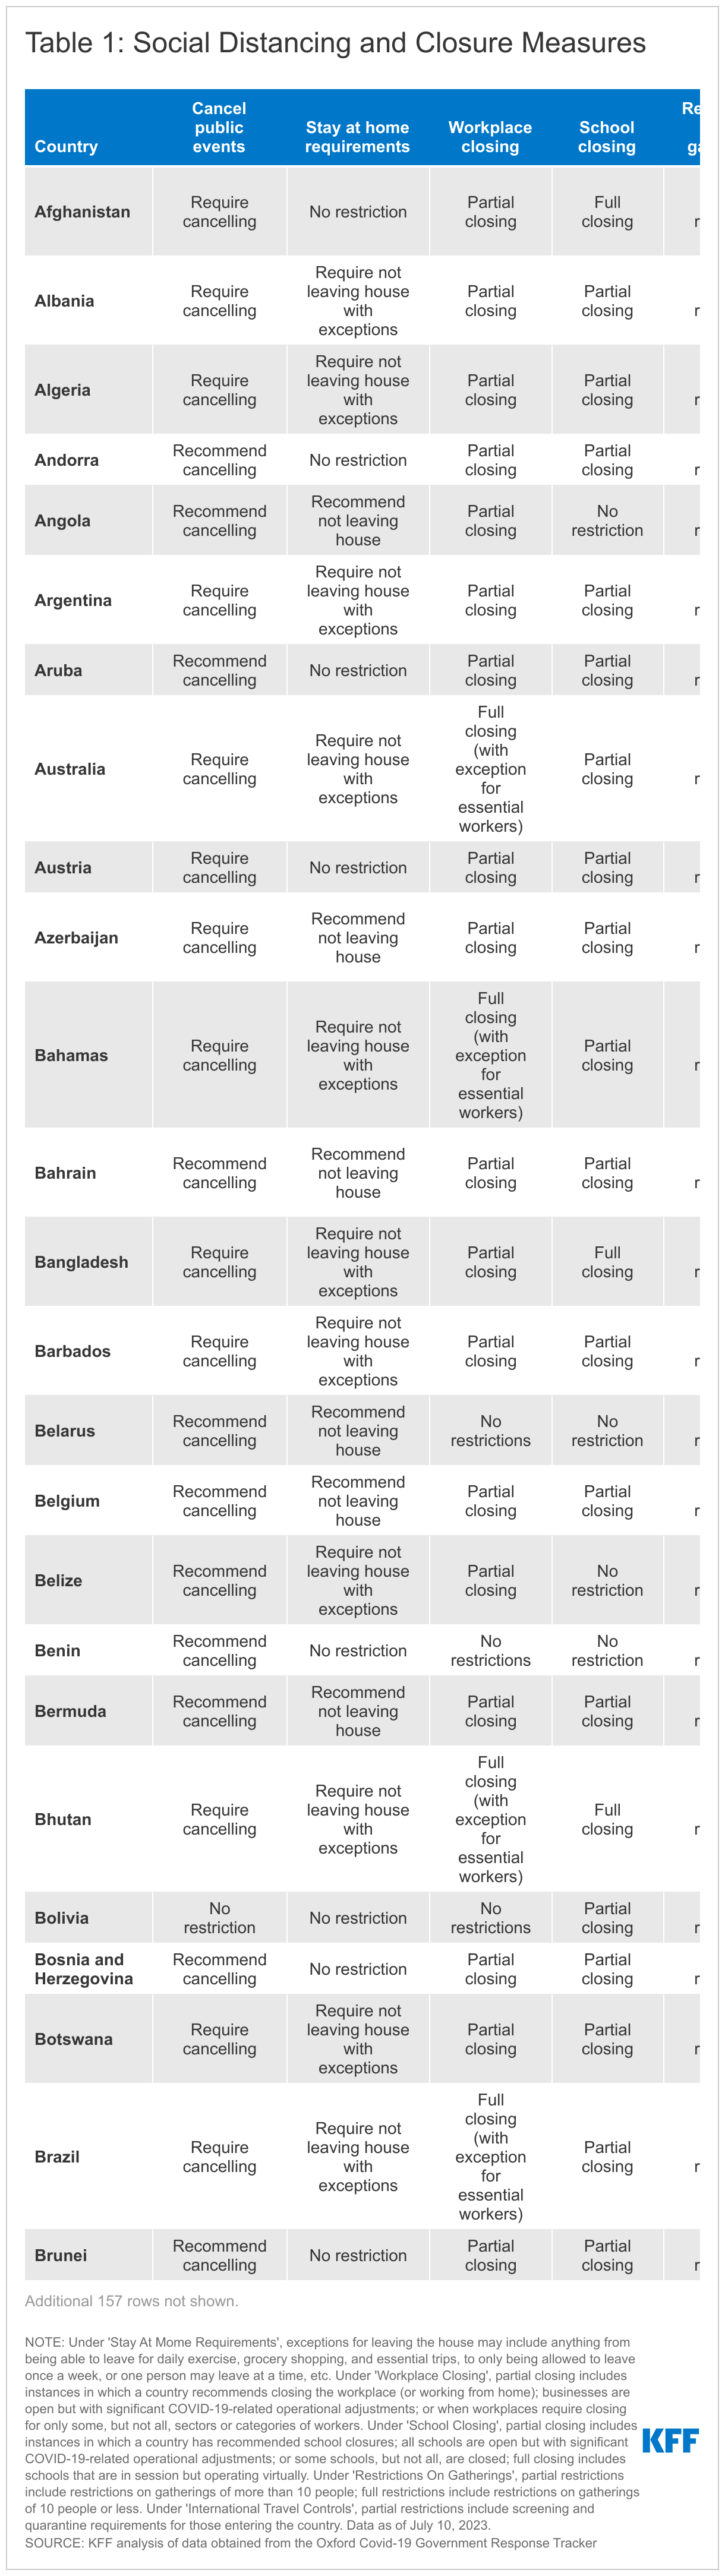
As countries continue to implement policies to prevent the transmission of SARS-CoV-2, the virus that causes COVID-19, these tables and charts show which social distancing and closure measures are currently in place by country.

Global COVID-19 Policy Actions

Economic Measures

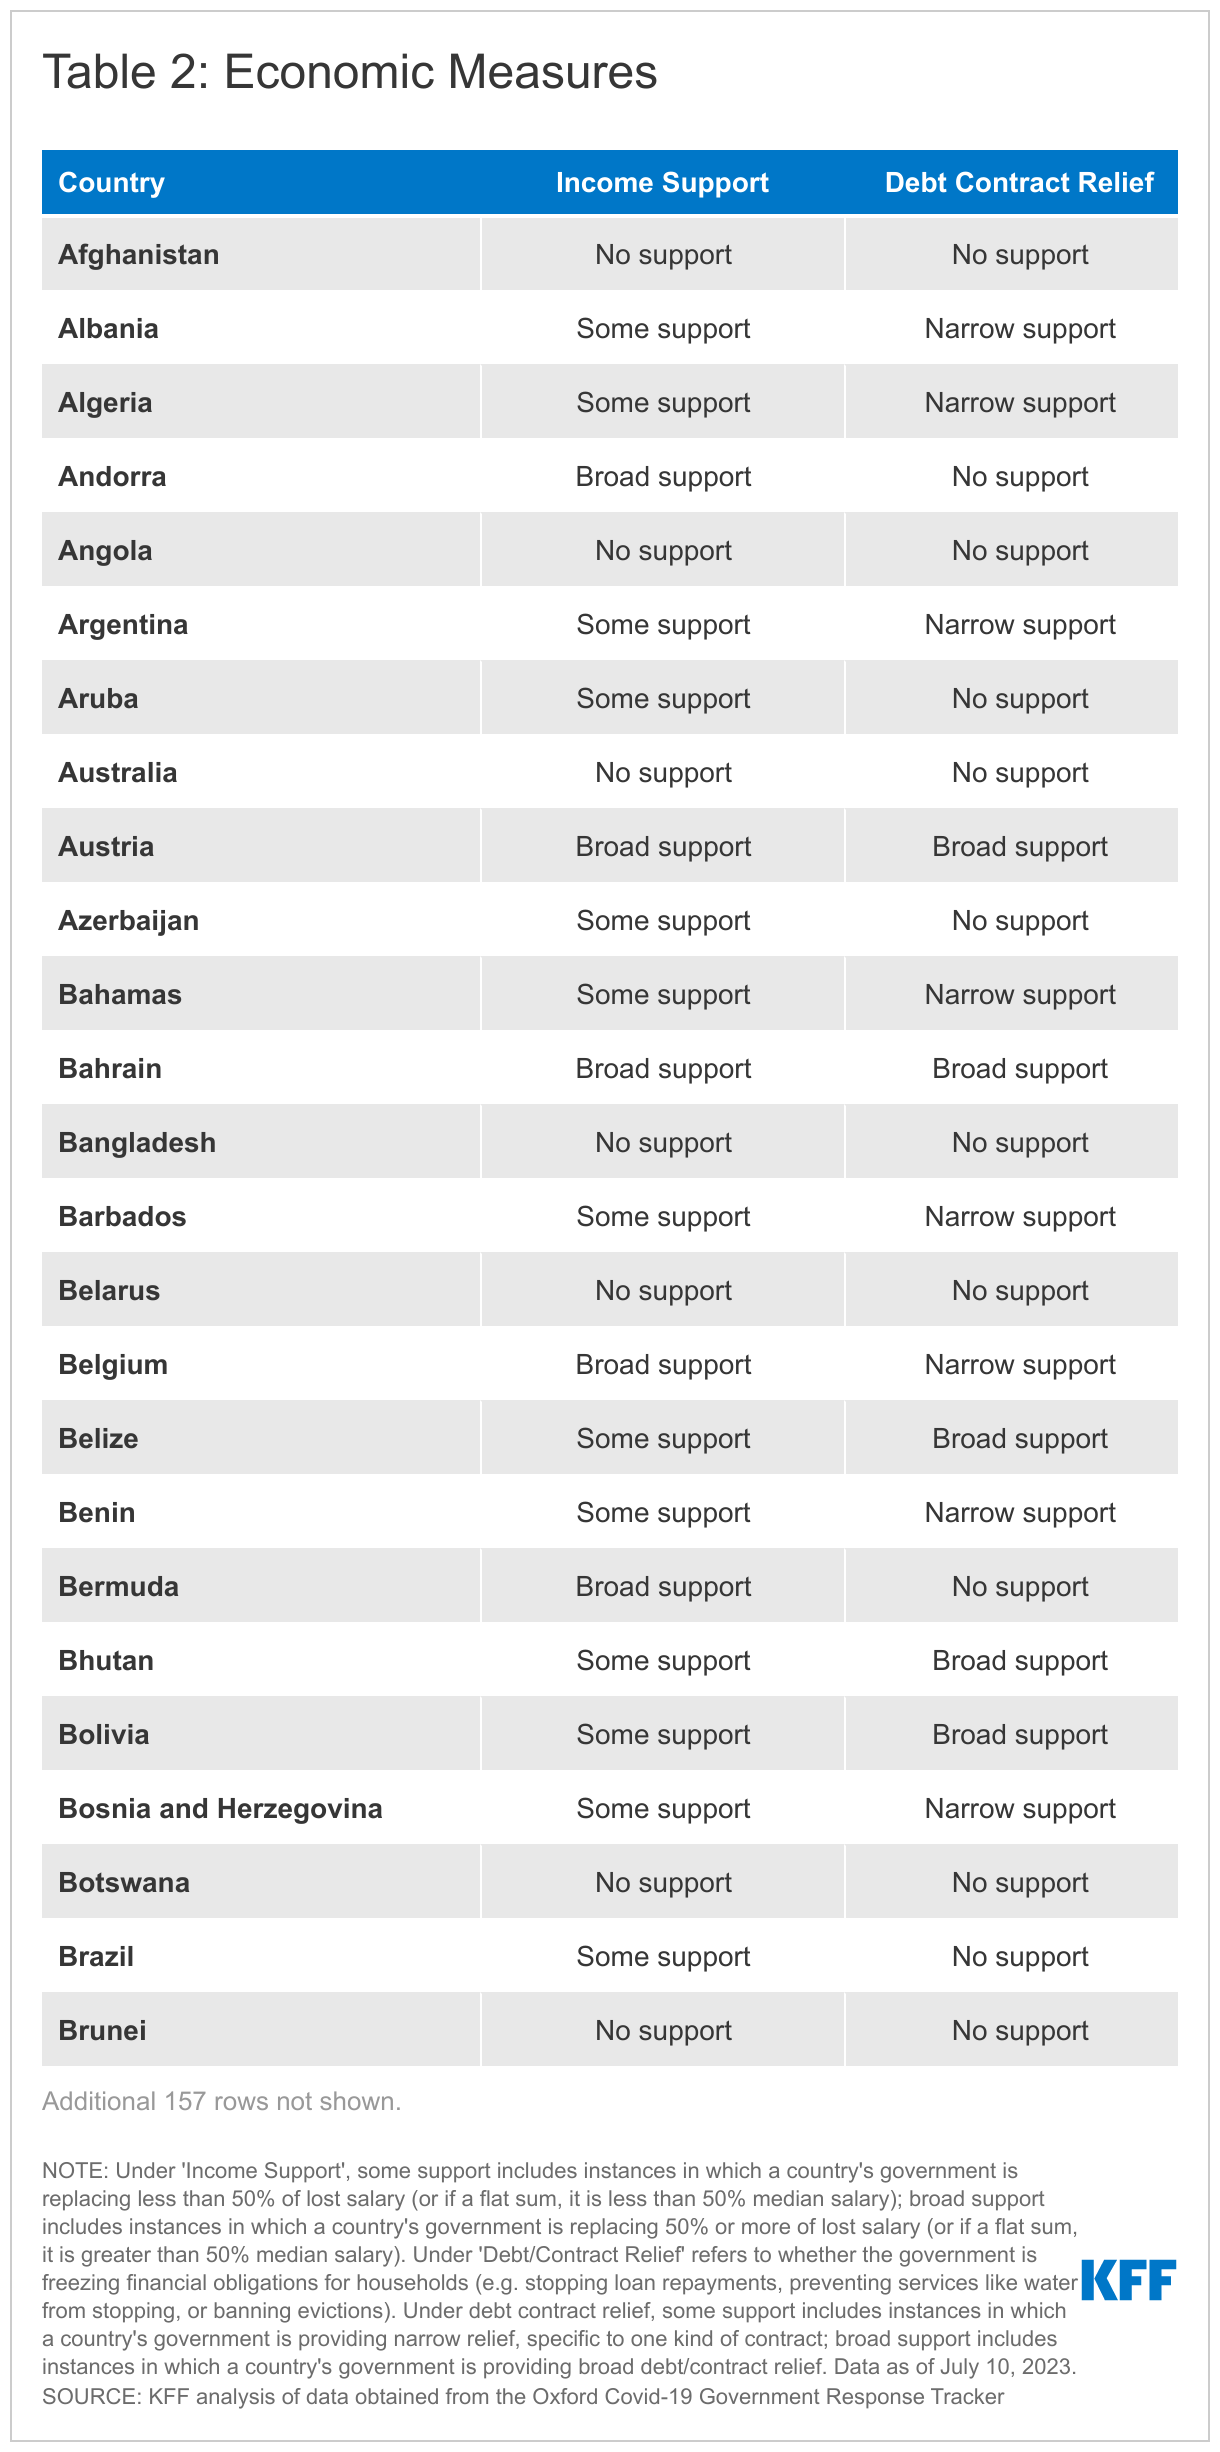
The COVID-19 pandemic has placed an unprecedented strain on country economies. These tables and charts show which economic-related measures, namely income support and debt relief, are currently in place by country.

Global COVID-19 Policy Actions

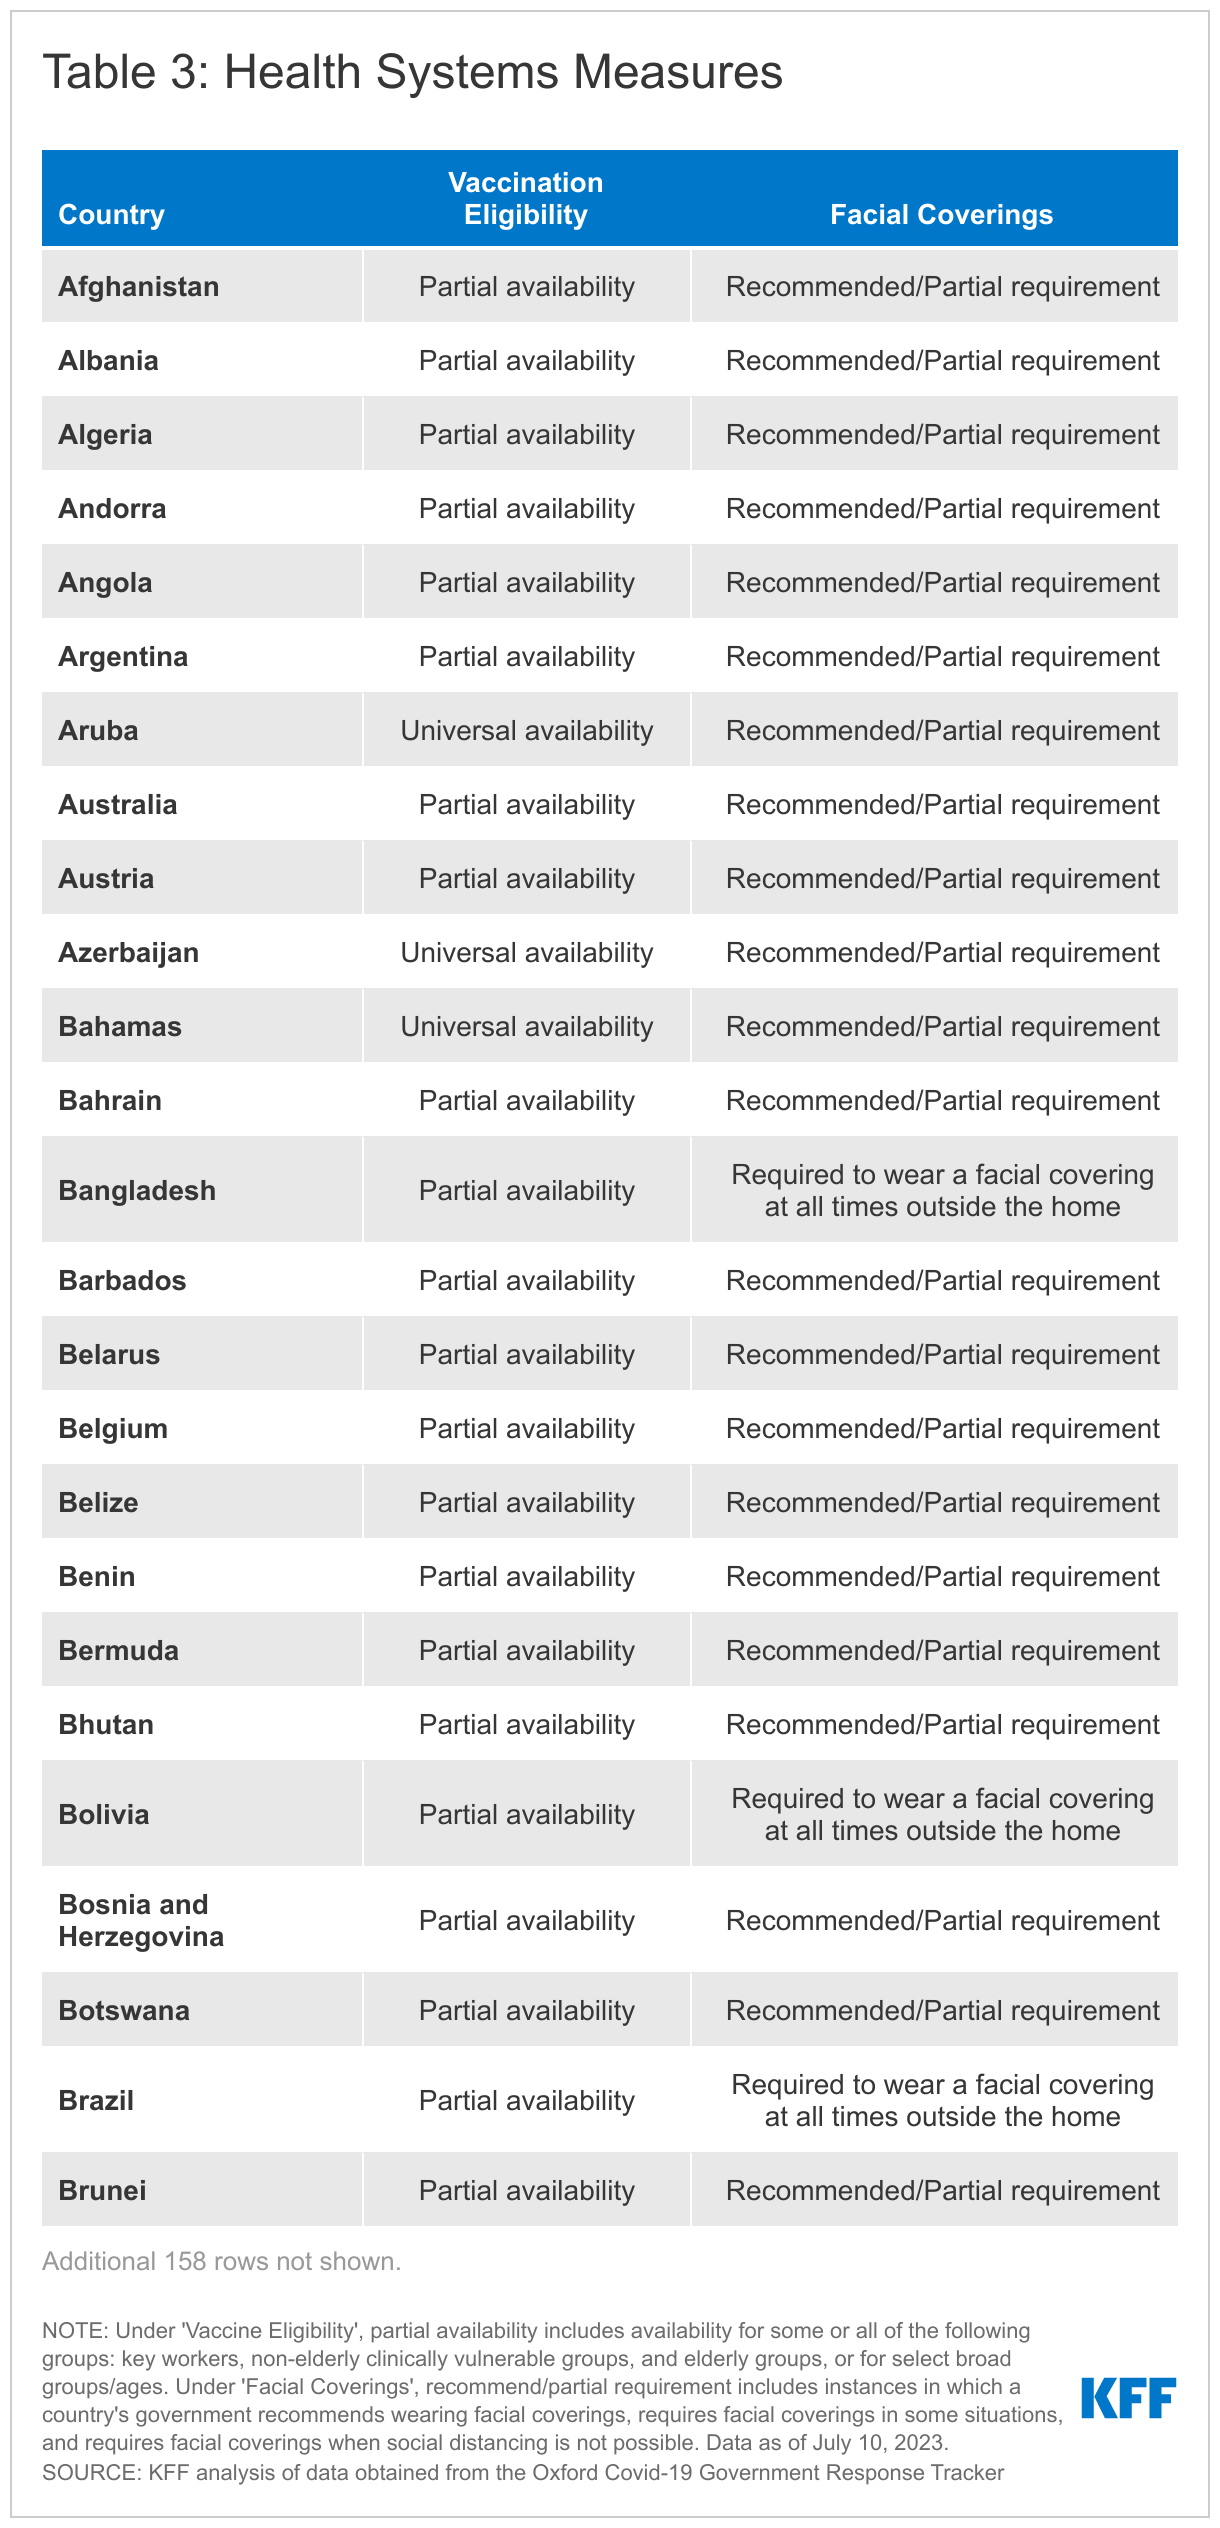
Health Systems Measures

The COVID-19 pandemic continues to strain and disrupt global health systems. These tables and charts show which health systems measures are currently in place by country.

Global COVID-19 Policy Actions

Methods

Cases and Deaths

SOURCES

As of March 7, 2023, all data on COVID-19 cases and deaths are drawn from the World Health Organization’s (WHO) Coronavirus (COVID-19) Dashboard. Prior to March 7, 2023, this tracker relied on data provided by the Johns Hopkins University (JHU) Coronavirus Resource Center’s COVID-19 Map, which ends on March 10, 2023. Population data are obtained from the United Nations World Population Prospects using 2021 total population estimates. Income-level classifications are obtained from the latest World Bank Country and Lending Groups. Regional classifications are obtained from the World Health Organization.

Policy Actions

NOTES

Policy actions data include the measure that was in place for each indicator at the country-level as of the end of 2022. Policy actions data will no longer be updated as the data source has ceased tracking government responses to COVID-19. For more information, please visit the Oxford Covid-19 Government Response Tracker.

Social Distancing and Closure Measures

Under 'Stay At Home Requirements', exceptions for leaving the house may include anything from being able to leave for daily exercise, grocery shopping, and essential trips, to only being allowed to leave once a week, or one person may leave at a time, etc. Under 'Workplace Closing', partial closing includes instances in which a country recommends closing the workplace (or working from home); businesses are open but with significant COVID-19-related operational adjustments; or when workplaces require closing for only some, but not all, sectors or categories of workers. Under 'School Closing', partial closing includes instances in which a country has recommended school closures; all schools are open but with significant COVID-19-related operational adjustments; or some schools, but not all, are closed; full closing includes schools that are in session but operating virtually. Under 'Restrictions On Gatherings', partial restrictions include restrictions on gatherings of more than 10 people; full restrictions include restrictions on gatherings of 10 people or less. Under 'International Travel Controls', partial restrictions include screening and quarantine requirements for those entering the country. Values for ‘Cancel Public Events’ were not recodified.

Economic Measures

Under 'Income Support', narrow support includes instances in which a country's government is replacing less than 50% of lost salary (or if a flat sum, it is less than 50% median salary); broad support includes instances in which a country's government is replacing 50% or more of lost salary (or if a flat sum, it is greater than 50% median salary). Under 'Debt/Contract Relief', narrow support includes instances in which a country's government is providing narrow relief, such as relief specific to one kind of contract.

Health Systems Measures

Under 'Vaccine Eligibility', partial availability includes availability for some or all of the following groups: key workers, non-elderly clinically vulnerable groups, and elderly groups, or for select broad groups/ages. Under 'Facial Coverings', recommend/partial requirement includes instances in which a country's government recommends wearing facial coverings, requires facial coverings in some situations, and requires facial coverings when social distancing is not possible. 

SOURCES

Data on and descriptions of government measures related to COVID-19 provided by the Oxford Covid-19 Government Response Tracker (OxCGRT). For more detailed information on their data collection and methodology, please see their codebook and interpretation guide.

The Status of Abortion-related State Ballot Initiatives Since Dobbs

Last updated on July 5, 2026

Since the Supreme Court’s Dobbs decision, overturning Roe v. Wade, voters in 17 states have weighed in on ballot measures regarding abortion– some more than once. In November 2026, voters in Missouri, Nevada, and Virginia will weigh in on abortion measures that could change the legal status of abortion in their state. In addition, measures in Idaho and Nebraska are in the process of collecting signatures.  

In 2024, 10 states voted on abortion measures that sought to affirm that the state constitution protects the right to abortion. Nebraska voted on two measures: one seeking to protect abortion and the other seeking to ban abortion after the first trimester. Measures protecting abortion rights succeeded in 7 states — Arizona, Colorado, Maryland, Missouri, Montana, Nevada, and New York — and failed in 3 — Florida, Nebraska, and South Dakota. Voters passed a measure amending the Nebraska state constitution prohibiting abortions after the first trimester.  

Prior to the 2024 election, the side favoring access to abortion prevailed in every state that voted on abortion-related ballot measures. In 2022 and 2023, California, Michigan, Ohio, and Vermont voters passed measures amending the state constitution to protect the right to abortion. Measures seeking to curtail the right to abortion in Kentucky, Kansas, and Montana failed.  

There are two ways a measure may be placed on the ballot: through citizen initiative or legislative referral. 

  • Legislatively-referred  measures are introduced and approved by lawmakers before they appear on the ballot for citizens to vote on. 
  • Citizen-initiated  measures are written by citizen groups and are placed on the ballot if they receive enough signatures.  

Not all states allow for citizen-initiated ballot measures. For more background information on abortion related ballot initiatives, please see our brief Addressing Abortion Access through State Ballot Initiatives

For more information on confirmed and potential abortion-related ballot measures in the 2026 election, please see our brief Abortion on the 2026 Ballot: The Evolving Landscape of State Abortion Initiatives

Status of Abortion-Related Ballot Measures Since Dobbs, as of July 5, 2026 (Table)