An Overview of Medicare
Medicare is the federal health insurance program created in 1965 for people ages 65 and over, regardless of income, medical history, or health status. The program was expanded in 1972 to cover certain people under age 65 who have a long-term disability. Today, Medicare plays a key role in providing health and financial security to 60 million older people and younger people with disabilities. The program helps to pay for many medical care services, including hospitalizations, physician visits, prescription drugs, preventive services, skilled nursing facility and home health care, and hospice care. In 2017, Medicare spending accounted for 15 percent of total federal spending and 20 percent of total national health spending.
Most people ages 65 and over are entitled to Medicare Part A if they or their spouse are eligible for Social Security payments, and do not have to pay a premium for Part A if they paid payroll taxes for 10 or more years. People under age 65 who receive Social Security Disability Insurance (SSDI) payments generally become eligible for Medicare after a two-year waiting period, while those diagnosed with end-stage renal disease (ESRD) and amyotrophic lateral sclerosis (ALS) become eligible for Medicare with no waiting period.
#Medicare plays a key role in providing health and financial security to 60 million older people and younger people with disabilities. It covers many basic health services, including hospital stays, physician services, and prescription drugs.
Characteristics of People on Medicare
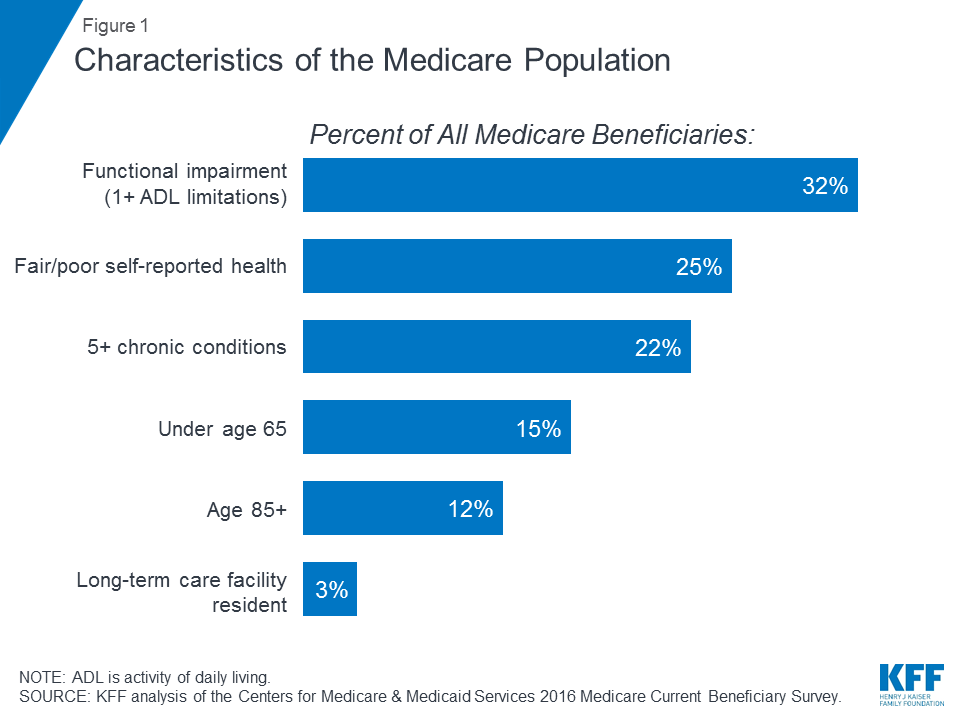
Many people on Medicare live with health problems, including multiple chronic conditions and limitations in their activities of daily living, and many beneficiaries live on modest incomes. In 2016, nearly one third (32%) had a functional impairment; one quarter (25%) reported being in fair or poor health; and more than one in five (22%) had five or more chronic conditions, (Figure 1). More than one in seven beneficiaries (15%) were under age 65 and living with a long-term disability, and 12 percent were ages 85 and over. Nearly two million beneficiaries (3%) lived in a long-term care facility. In 2016, half of all people on Medicare had incomes below $26,200 per person and savings below $74,450.
What Medicare Covers
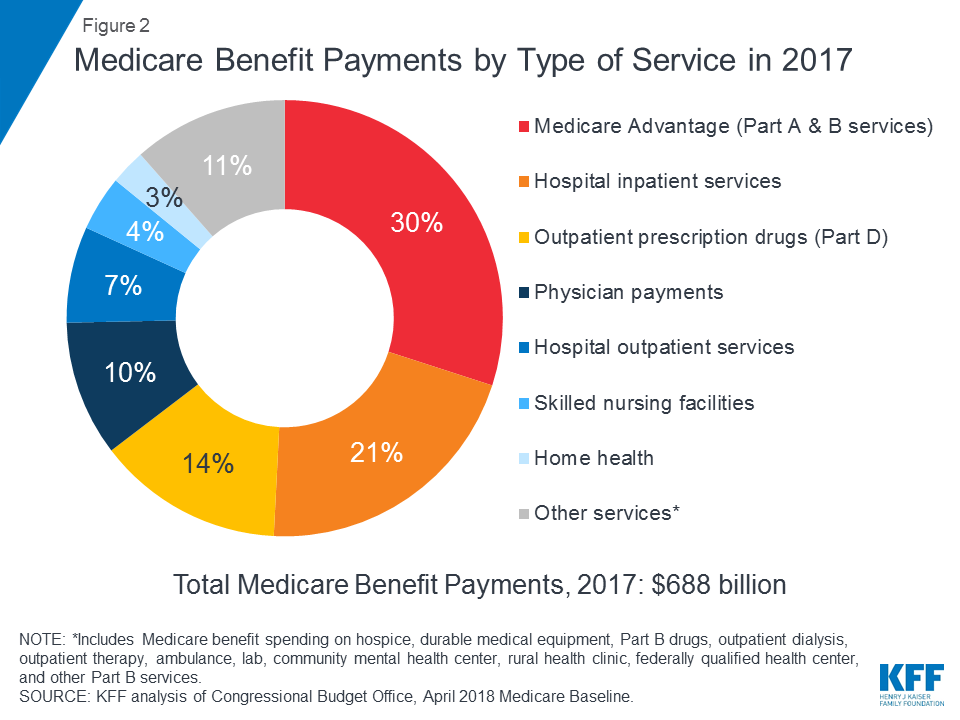
Medicare covers many health services, including inpatient and outpatient hospital care, physician services, and prescription drugs (Figure 2). Medicare benefits are organized and paid for in different ways:
- Part A covers inpatient hospital stays, skilled nursing facility (SNF) stays, some home health visits, and hospice care. Part A benefits are subject to a deductible ($1,364 per benefit period in 2019). Part A also requires coinsurance for extended inpatient hospital and SNF stays.
- Part B covers physician visits, outpatient services, preventive services, and some home health visits. Many Part B benefits are subject to a deductible ($185 in 2019), and, typically, coinsurance of 20 percent. No coinsurance or deductible is charged for an annual wellness visit or for preventive services that are rated ‘A’ or ‘B’ by the U.S. Preventive Services Task Force, such as mammography or prostate cancer screenings.
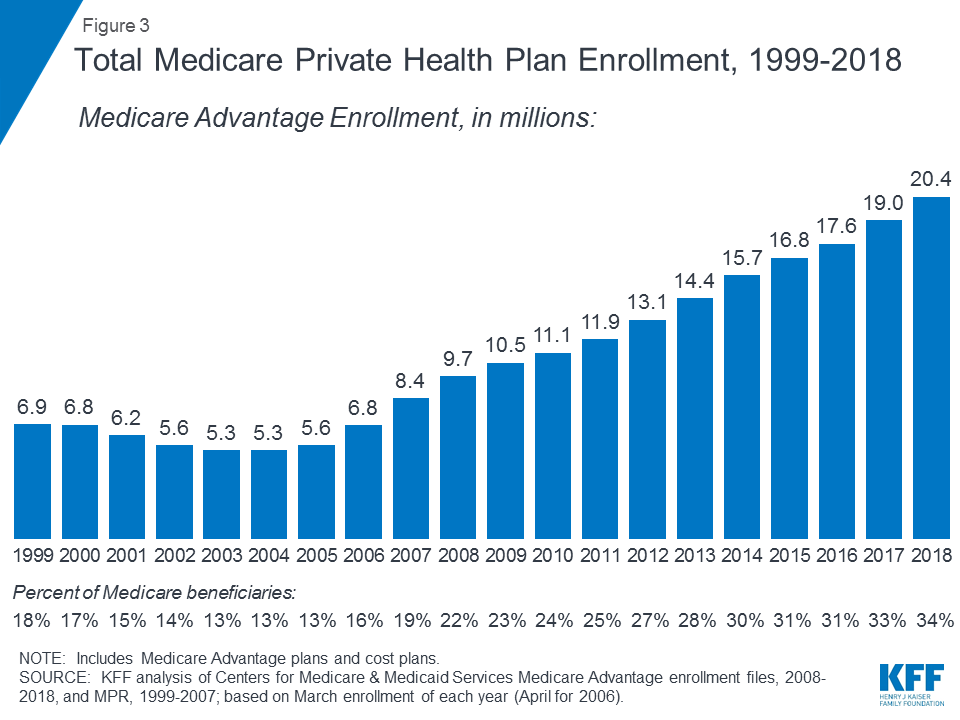
- Part C refers to the Medicare Advantage program, through which beneficiaries can enroll in a private health plan, such as a health maintenance organization (HMO) or preferred provider organization (PPO), and receive all Medicare-covered Part A and Part B benefits and typically also Part D benefits. Enrollment in Medicare Advantage plans has grown over time, with more than 20 million beneficiaries enrolled in Medicare Advantage in 2018, or 34 percent of all Medicare beneficiaries (Figure 3).
- Part D covers outpatient prescription drugs through private plans that contract with Medicare, including stand-alone prescription drug plans (PDPs) and Medicare Advantage plans with prescription drug coverage (MA-PDs). In 2019, beneficiaries have a choice of 27 PDPs and 21 MA-PDs, on average. The Part D benefit helps pay for enrollees’ drug costs and provides coverage for very high drug costs. Additional financial assistance is available for beneficiaries with low incomes and modest assets. Enrollees pay monthly premiums and cost sharing for prescriptions, with costs varying by plan. Enrollment in Part D is voluntary; in 2018, 43 million people on Medicare were enrolled in a PDP or MA-PD. Of this total, roughly one in four receive low-income subsides.
Benefit Gaps and Supplemental Coverage
Medicare provides protection against the costs of many health care services, but traditional Medicare has relatively high deductibles and cost-sharing requirements and places no limit on beneficiaries’ out-of-pocket spending for services covered under Parts A and B. Moreover, traditional Medicare does not pay for some services that are important for older people and people with disabilities, including long-term services and supports, dental services, eyeglasses, and hearing aids. In light of Medicare’s benefit gaps, cost-sharing requirements, and lack of an annual out-of-pocket spending limit, most beneficiaries covered under traditional Medicare have some type of supplemental coverage that helps to cover beneficiaries’ costs and fill the benefit gaps (Figure 4).
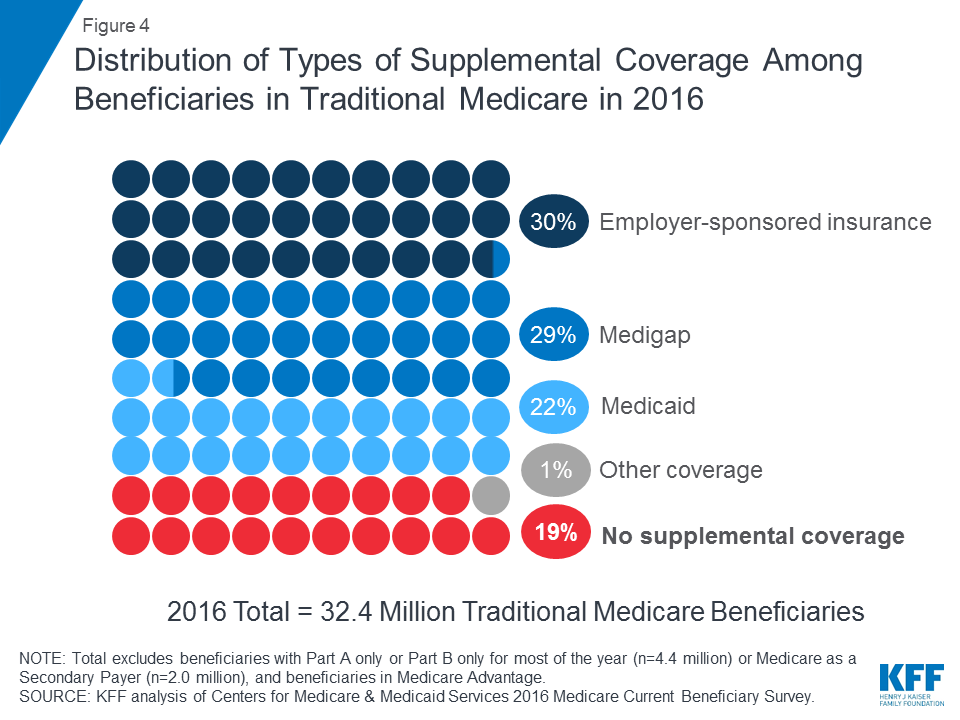
- Employer-sponsored insurance provided retiree health coverage to 3 in 10 (30%) of traditional Medicare beneficiaries in 2016. Over time, however, fewer beneficiaries are expected to have this type of coverage, since the share of large firms offering retiree health benefits to their employees has dropped from 66 percent in 1988 to 18 percent in 2018.
- Medigap, also called Medicare supplement insurance, provided supplemental coverage to nearly 3 in 10 (29%) beneficiaries in traditional Medicare in 2016. These policies are sold by private insurance companies and fully or partially cover Part A and Part B cost-sharing requirements, including deductibles, copayments, and coinsurance.
- Medicaid, the federal-state program that provides coverage to low-income people, was a source of supplemental coverage for more than 1 in 5 (22%, or 7.0 million) traditional Medicare beneficiaries with low incomes and modest assets in 2016 (not including 3.5 million beneficiaries who were enrolled in both Medicare Advantage and Medicaid). These beneficiaries are known as dually eligible beneficiaries because they are eligible for both Medicare and Medicaid. Most traditional Medicare beneficiaries who receive Medicaid (5.3 million) receive both full Medicaid benefits, including long-term services and supports, and payment of their Medicare premiums and cost sharing. Another 1.7 million beneficiaries do not qualify for full Medicaid benefits but Medicaid covers their Medicare premiums and/or cost sharing through the Medicare Savings Programs.
- Nearly 1 in 5 (19%, or 6 million) Medicare beneficiaries with traditional Medicare had no supplemental coverage in 2016. These 6 million beneficiaries are fully exposed to Medicare’s cost-sharing requirements and lack the protection of an annual limit on out-of-pocket spending, unlike beneficiaries enrolled in Medicare Advantage.
Medicare Advantage
In 2018, one-third of all beneficiaries were enrolled in Medicare Advantage plans rather than traditional Medicare, some of whom also have coverage from a former employer/union or Medicaid. Medicare Advantage plans are required to limit beneficiaries’ out-of-pocket spending for in-network services covered under Medicare Parts A and B to no more than $6,700, and may also cover supplemental benefits not covered by Medicare, such as eyeglasses, dental services, and hearing aids.
Medicare Beneficiaries’ Out-of-Pocket Health Care Spending
In 2016, beneficiaries in traditional Medicare and enrolled in both Part A and Part B spent $5,806 out of their own pockets for health care spending, on average (Figure 5). Nearly half (45%) of beneficiaries’ average total spending was for premiums for Medicare and other types of supplemental insurance, and 55 percent was for medical and long-term care services.

Among different types of services, average per capita spending was highest for long-term care facility services, followed by medical providers and supplies, prescription drugs, and dental services. Out-of-pocket spending rises with age among beneficiaries ages 65 and over and is higher for women than men. Not surprisingly, Medicare beneficiaries with poorer self-reported health status spend more than those who rate themselves in better health.
Medicare Spending Now and In the Future
In 2017, Medicare benefit payments totaled $688 billion; 21 percent was for hospital inpatient services, 14 percent for outpatient prescription drugs, and 10 percent for physician services; 30 percent was for payments to Medicare Advantage plans for services covered by Part A and Part B (see Figure 2).
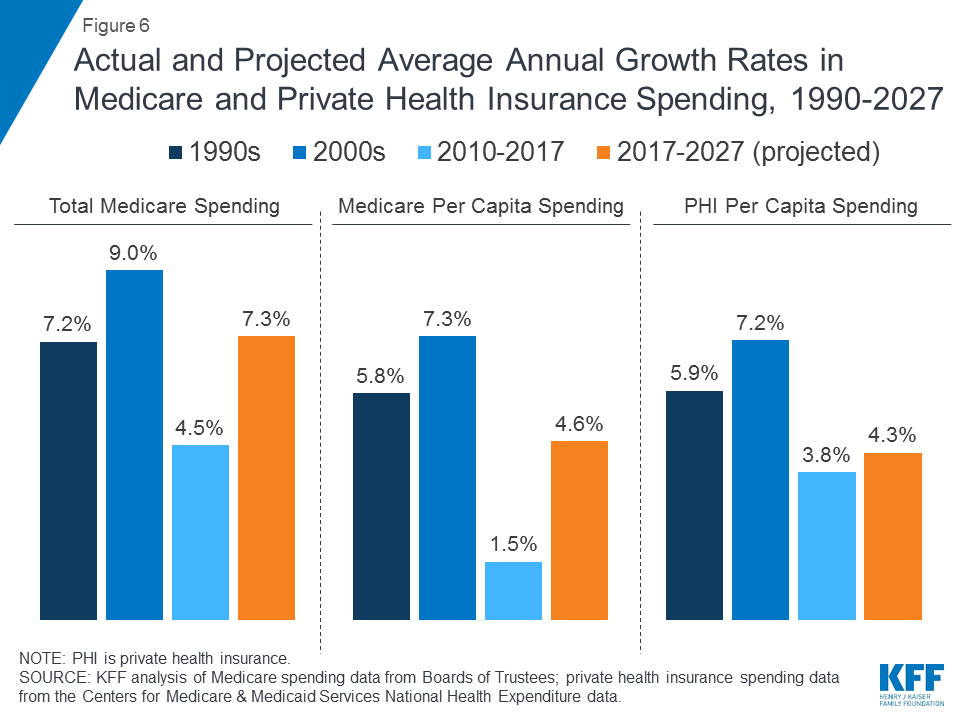
Medicare spending is affected by a number of factors, including the number of beneficiaries, how care is delivered, the use of services (including prescription drugs), and health care prices. Both in the aggregate and on a per capita basis, Medicare spending growth has slowed in recent years, but is expected to grow at a faster rate in the next decade than since 2010 (Figure 6). Looking ahead, Medicare spending (net of income from premiums and other offsetting receipts) is projected to grow from $583 billion in 2018 to $1,260 billion in 2028. The aging of the population, growth in Medicare enrollment due to the baby boom generating reaching the age of eligibility, and increases in per capita health care costs are leading to growth in overall Medicare spending.
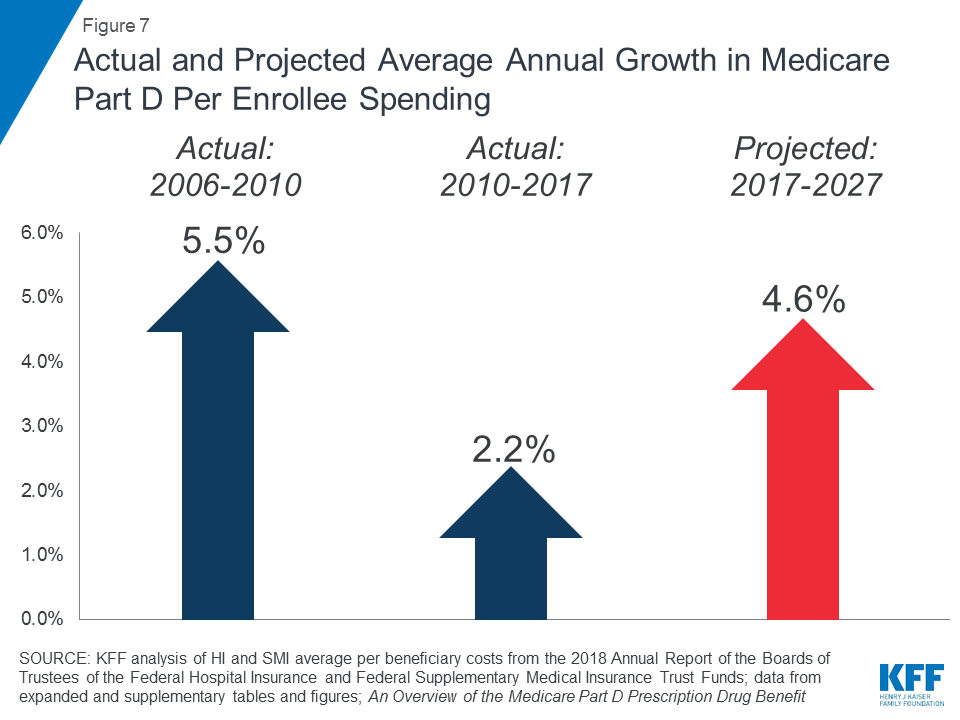
Rising prescription drug costs are a particular concern in relation to Medicare spending. The average annual growth rate in per beneficiary costs for the Part D prescription drug benefit is projected to be higher in the coming decade (4.6%) than between 2010 and 2017 (2.2%) (Figure 7). This is due in part to projected higher Part D program costs associated with expensive specialty drugs.
How Medicare is Financed
Medicare is financed by general revenues (41% in 2017), payroll tax contributions (37%), beneficiary premiums (14%), and other sources (Figure 8).
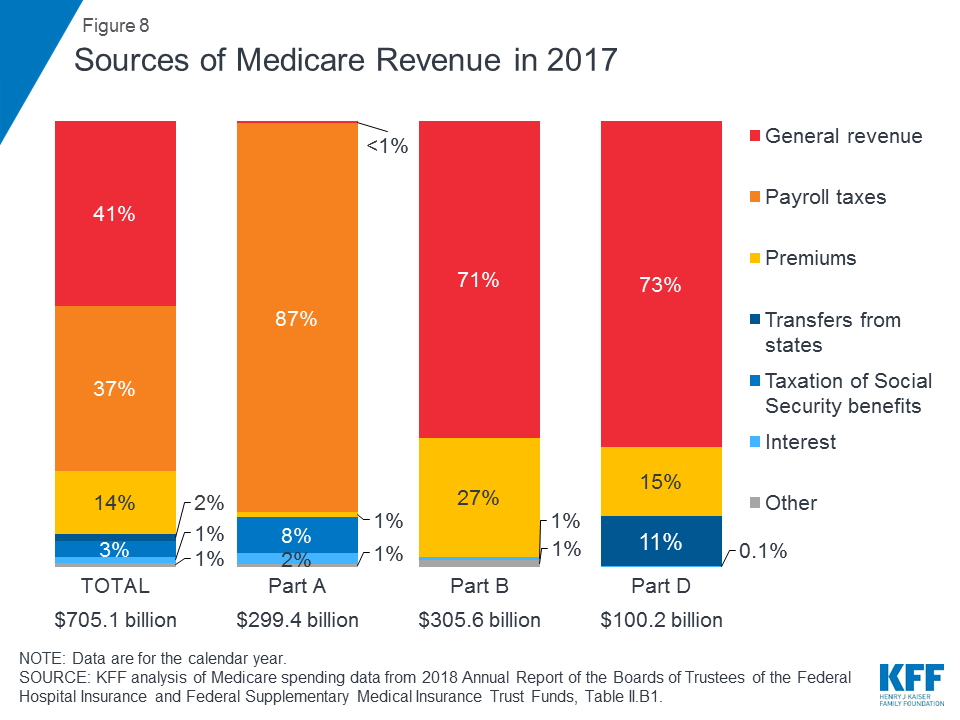
- Part A is funded mainly by a 2.9 percent payroll tax on earnings paid by employers and employees (1.45% each) deposited into the Hospital Insurance Trust Fund. Higher-income taxpayers (income greater than $200,000/individual and $250,000/married couple) pay a higher Medicare payroll tax on earnings (2.35%). The Part A Trust Fund is projected to be solvent through 2026.
- Part B is funded by general revenues and beneficiary premiums; the standard premium is $135.50 per month in 2019. Medicaid pays Part B premiums on behalf of beneficiaries who qualify for Medicaid based on having low incomes and assets. Beneficiaries with incomes greater than $85,000 for individuals or $170,000 for married couples filing jointly pay a higher, income-related monthly Part B premium, ranging from 35% to 85% of Part B program costs, or $189.60 to $460.50 per person per month in 2019.
- Part C, the Medicare Advantage program, is not separately financed; Medicare Advantage plans provide benefits covered under Part A, Part B, and (typically) Part D, and these benefits are financed primarily by payroll taxes, general revenues, and premiums. Medicare Advantage enrollees generally pay the monthly Part B premium and many also pay an additional premium directly to their plan. The average monthly premium for Medicare Advantage drug plans in 2018 was $34 per month.
- Part D is funded by general revenues, beneficiary premiums, and state payments. The average PDP premium for 2018 was $41 per month. Part D enrollees with higher incomes pay an income-related premium surcharge, with the same income thresholds used for Part B. In 2019, premium surcharges range from $12.40 to $77.40 per month for higher-income beneficiaries.
Medicare Payment and Delivery System Reform
Policymakers, health care providers, insurers, and researchers continue to debate how best to introduce payment and delivery system reforms into the health care system to tackle rising costs, quality of care, and inefficient spending. Medicare has taken a lead in testing a variety of new models that include financial incentives for providers, such as doctors and hospitals, to work together to lower spending and improve care for patients in traditional Medicare. The goals of these financial incentives generally link a portion of Medicare’s payments for services to “value” as determined by providers’ performance on spending and quality targets.
Accountable Care Organizations (ACOs) are one example of a delivery system reform model currently being tested within Medicare. With over 10 million assigned beneficiaries in 2018, ACO models allow groups of providers to accept responsibility for the overall care of Medicare beneficiaries and share in financial savings or losses depending on their performance in meeting spending and care quality targets. Other new models include medical homes, bundled payments (models that combine Medicare payments to multiple providers across a single episode rather than pay for each service separately), and initiatives aimed to reduce hospital readmissions.
Many of these Medicare payment models are managed through the Center for Medicare and Medicaid Innovation (CMMI), which was created by the Affordable Care Act (ACA). These models are being evaluated to determine their effect on Medicare spending and the quality of care provided to beneficiaries. The Secretary of Health and Human Services (HHS) is authorized to expand or extend models that demonstrate quality improvement without an increase in spending, or spending reduction without a decline in quality.
Looking to the Future
Medicare faces a number of critical issues and challenges, perhaps none greater than providing affordable, quality care to an aging population while keeping the program financially secure for future generations. While Medicare spending is on a slower upward trajectory now than in past decades, total and per capita annual growth rates appear to be edging away from their historically low levels of the past few years. Medicare prescription drug spending is also a growing concern, with the Medicare Trustees projecting a comparatively higher per capita growth rate for Part D in the coming years than in the program’s earlier years due to higher costs associated with expensive specialty drugs.
To address the health care financing challenges posed by the aging of the population, a number of changes to Medicare have been proposed, including restructuring Medicare benefits and cost sharing; raising the Medicare eligibility age; shifting Medicare from a defined benefit structure to a “premium support” system; and allowing people under age 65 to buy in to Medicare. As policymakers consider possible changes to Medicare, it will be important to evaluate the potential effect of these changes on total health care spending and Medicare spending, as well as on beneficiaries’ access to quality care and affordable coverage and their out-of-pocket health care costs.