Recent Trends in Children’s Poverty and Health Insurance as Pandemic-Era Programs Expire
After a period of increased federal investment in children and families, pandemic-era programs and federal funding are expiring and overall federal spending on children began to decline in 2022. At the same time, millions are being disenrolled from Medicaid, including children, creating a host of challenges for households with children, who already fared worse throughout the pandemic compared to households without children. In December 2023, growing concern over loss of Medicaid coverage for children prompted the federal government to issue additional guidance with strategies to protect coverage and to write letters nine states with high numbers or shares of Medicaid child enrollment declines urging them to take up policy options to prevent disenrollments due to paperwork, or procedural, issues. Despite recent challenges, there have also been some recent federal actions that may help children and families, including reports of a tentative bipartisan agreement to expand the Child Tax Credit (CTC). This issue brief examines recent trends in children’s poverty rates and the impact of expiring federal aid, explores recent changes in Medicaid coverage for children, and discusses what to watch as families contend with these compounding changes.
What are recent trends in poverty rates for children?
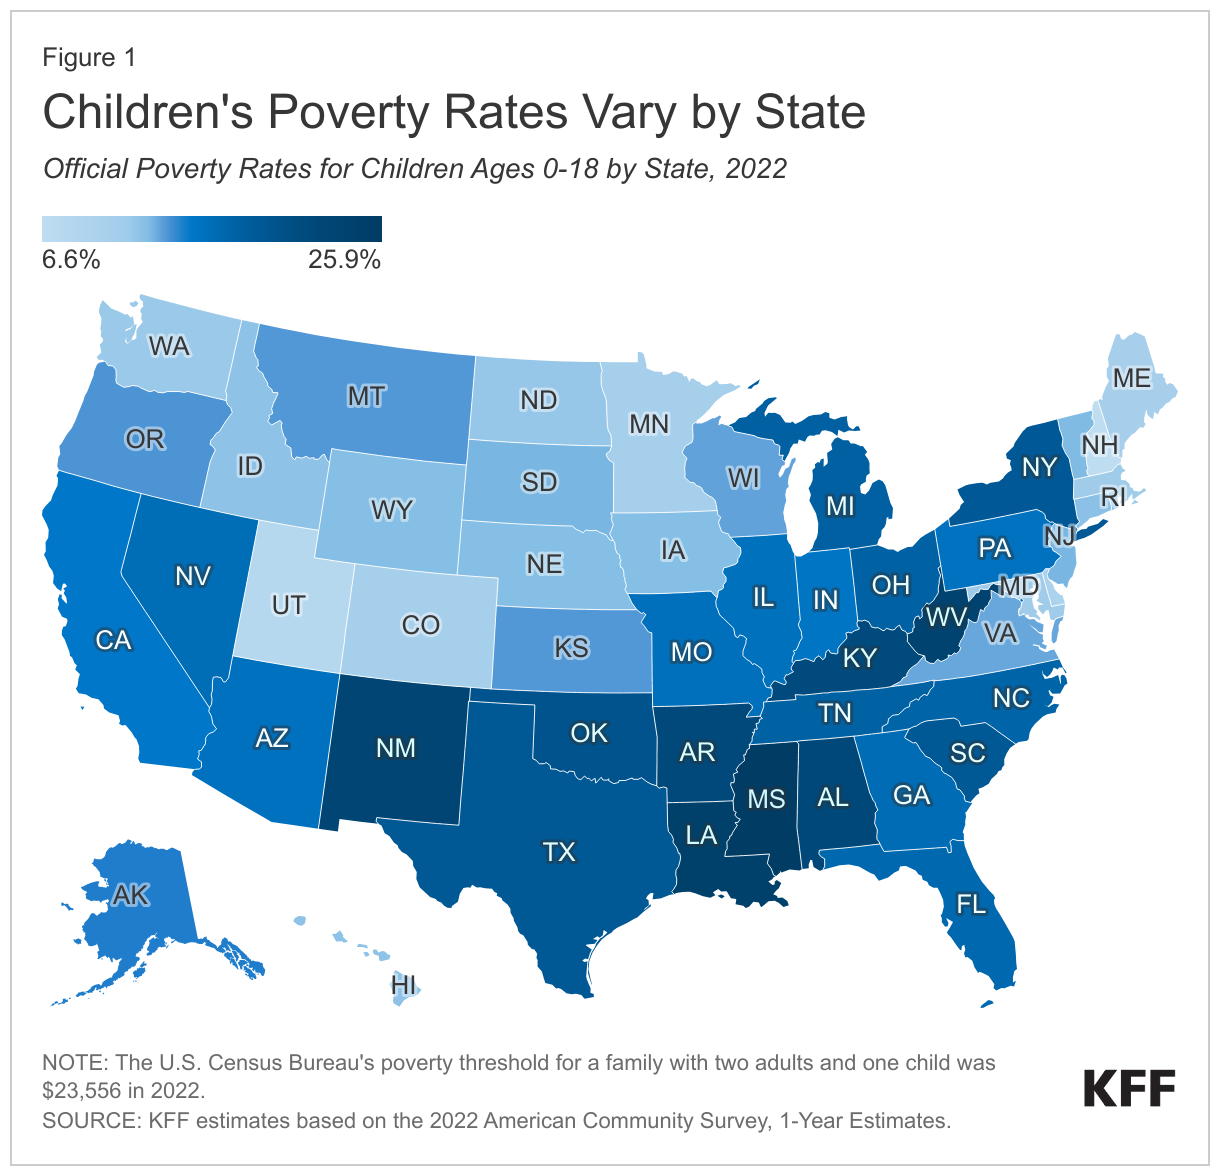
Children have the highest official poverty rates compared to other age groups, and rates vary substantially by state (Figure 1). In 2022, the percent of children ages 0-18 living in poverty was 16.1% based on KFF analysis of the American Community Survey. This rate has remained stable in recent years and is higher than the share of adults ages 19-64 (11.7%) and adults 65 and older (10.9%). There is substantial variation in child poverty across states, ranging from 6.6% of children in New Hampshire living in poverty in 2022 to 25.9% of children in Mississippi. The child poverty rate in Puerto Rico, a U.S. territory, is 56.9%. These rates are based on the official poverty measure, which only accounts for pretax cash resources, including cash assistance programs such as social security and unemployment insurance.
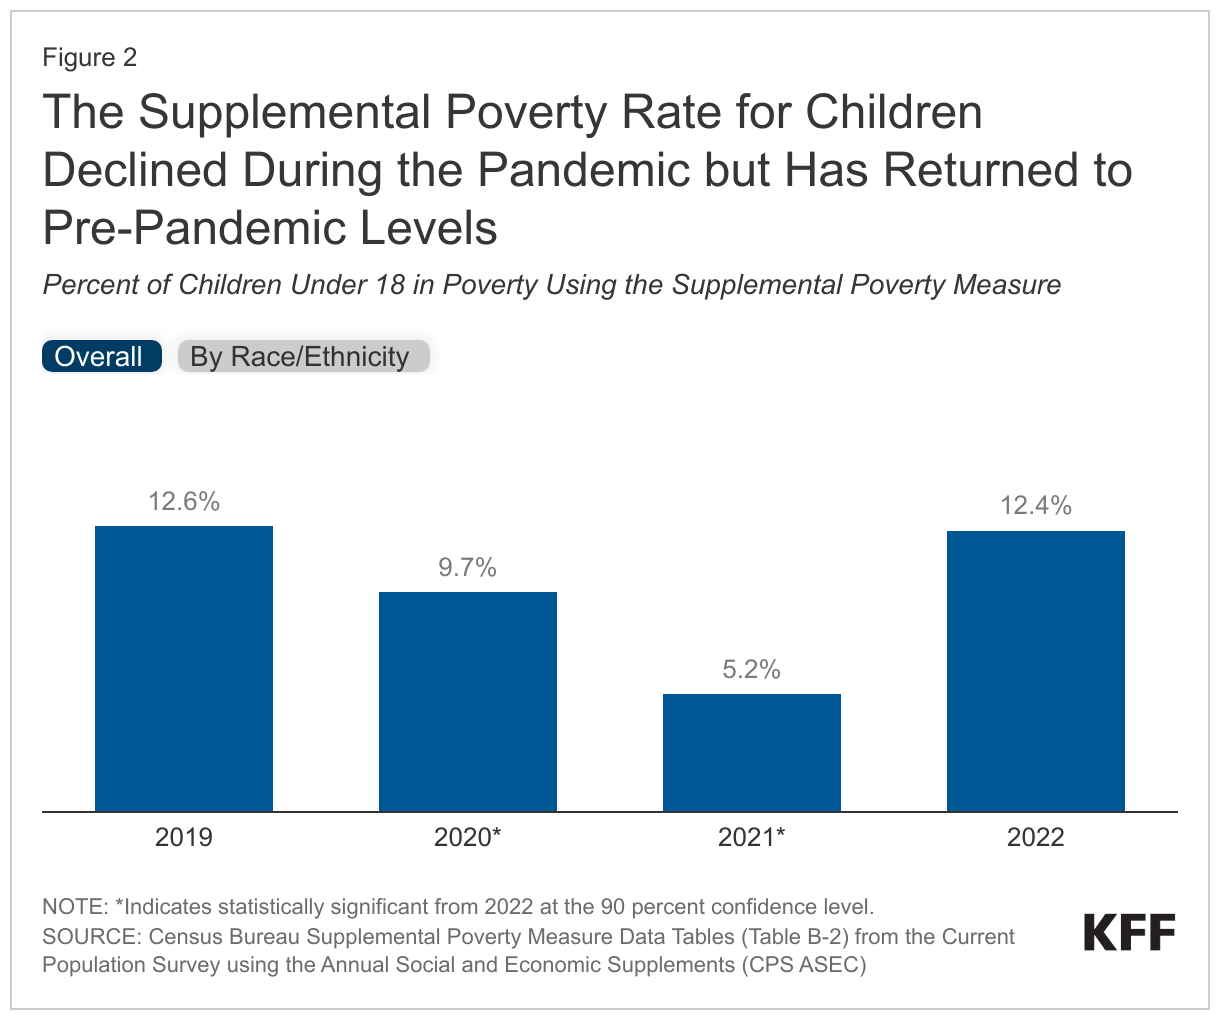
A recent Census Bureau report found that while the official poverty measure remained stable from 2021 to 2022, the supplemental poverty rate for children more than doubled (Figure 2). The supplemental poverty measure (SPM) accounts for pretax cash resources but, unlike the official poverty measure, also includes refundable tax credits (such as the Child Tax Credit (CTC) and Earned Income Tax Credit) and noncash benefits (such as SNAP, school lunches, and WIC) while excluding some necessary expenses (such as taxes or medical expenses). Following the onset of the pandemic, the SPM rate for children fell from 12.6% in 2019 to 9.7% in 2020 and fell again to 5.2% in 2021, a record low. However, the SPM rate more than doubled to 12.4% in 2022, returning to pre-pandemic levels. The expiration of expanded tax credits, including the expanded CTC, and stimulus payments, both included in the SPM but not the official poverty measure, contributed to this increase. The Census Bureau also reported the CTC kept twice as many individuals out of poverty in 2021, when the expanded CTC was in place, compared with 2022 once the expansion had expired.
The supplemental poverty rate increased from 2021 to 2022 for children across all racial and ethnic groups (Figure 3). From 2019 to 2021, the SPM fell for all racial and ethnic groups shown here and helped narrow percentage point differences in supplemental poverty rates between children of color and White children. Black and Hispanic children experienced the largest SPM declines from 2019 to 2021, decreasing from 20.6% to 8.3% and 20.3% to 8.4%, respectively, which mirrors findings from another survey that found that the expanded CTC in 2021 disproportionately benefited Black and Hispanic families. However, from 2021 to 2022, the SPM more than doubled for most groups. The percentage point differences in supplemental poverty rates between children of color and White children widened once more, and SPM rates returned to pre-pandemic levels for all racial and ethnic groups aside from American Indian and Alaska Native (AIAN) children, whose SPM in 2022 (25.9%) was significantly higher than before the pandemic (14% in 2019). Overall, supplemental poverty rates were highest in 2022 for children who identify as AIAN (25.9%), Hispanic (19.5%), or Black (17.8%). Once the expanded CTC payments expired, a survey found families reported increased financial stress, including Hispanic parents who were more likely to experience difficulty with monthly expenses and food hardship following the expiration compared with White and Black parents.
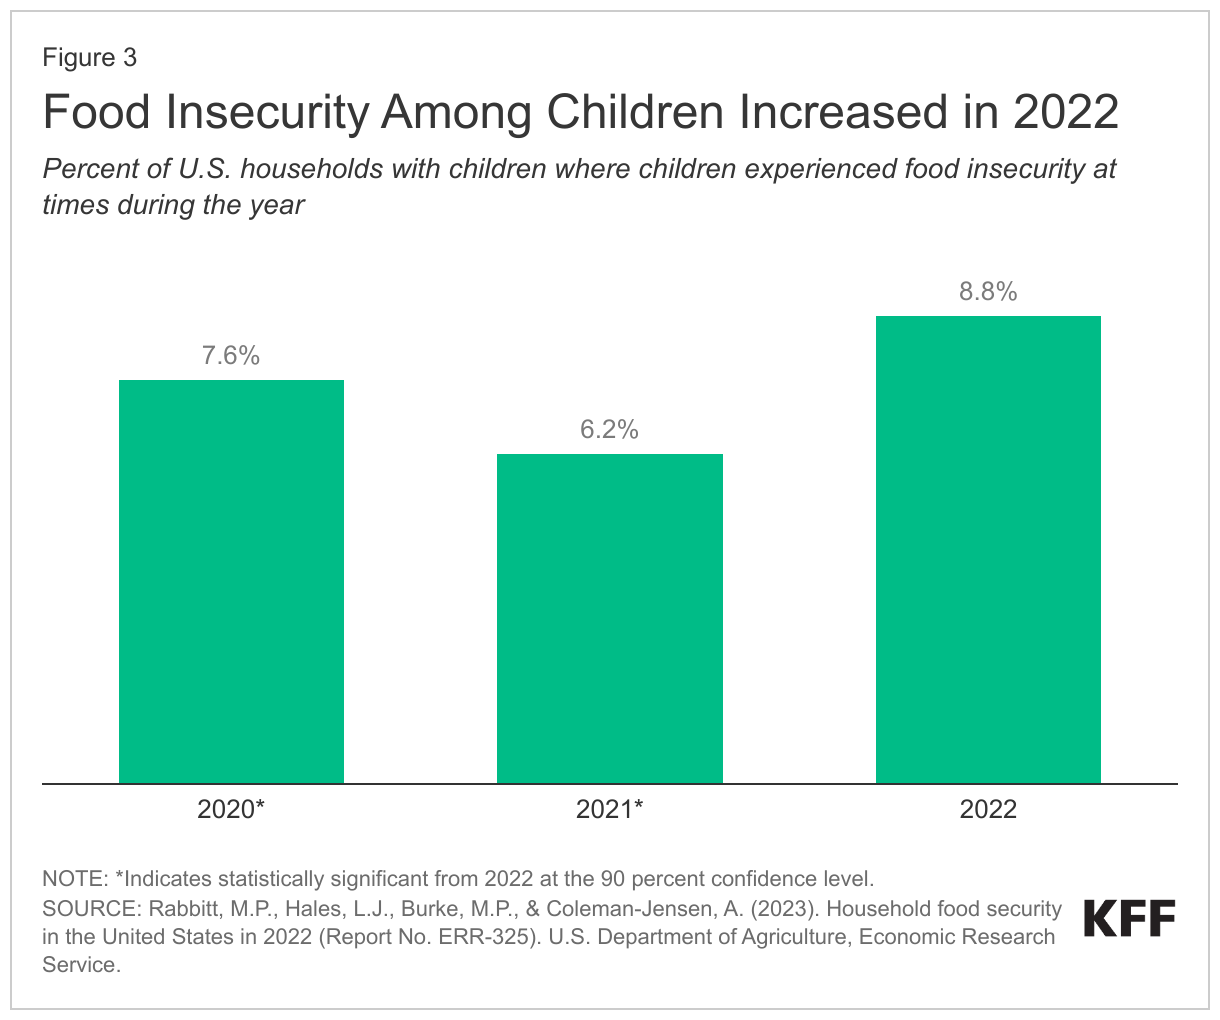
Along with expiring pandemic-era federal financial relief and rising poverty rates, families have also dealt with the rising cost of household expenses due to inflation, all leading to increased financial hardships for families with children. The share of U.S. households with children in which children faced food insecurity increased from 6.2% in 2021 (or 2.3 million households) to 8.8% in 2022 (or 3.3 million households), meaning around 1 million more families could not provide adequate food for their children (Figure 3). The expiration of the CTC likely contributed to this increase, with one report finding most families used their expanded CTC in 2021 to fund basic needs including food, utilities, housing, clothing or education costs. High inflation over the past year reduced the purchasing power of families, also contributing to increased food insecurity and rising financial hardships. While inflation has cooled in recent months, prices remain much higher than before the pandemic. Other pandemic-era relief that helped families with household expenses, including increased childcare funding and expanded SNAP benefits, have also expired.
What are recent trends in children’s health coverage?
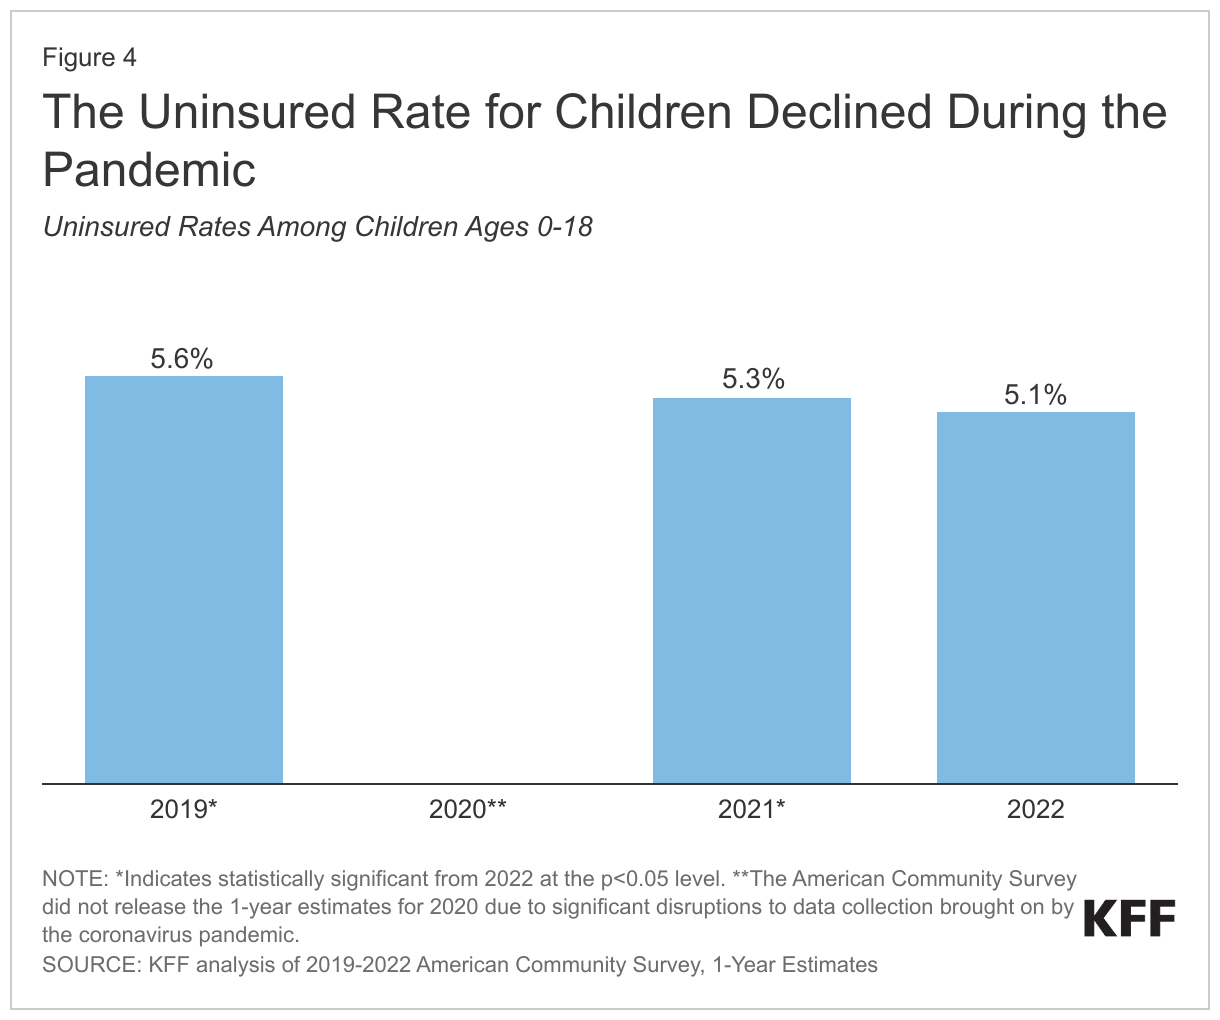
During the Medicaid continuous enrollment period, Medicaid enrollment increased substantially, and the uninsured rate declined. One report found that over half of children in the U.S. were covered by Medicaid or the Children’s Health Insurance Program (CHIP) at one point during the continuous enrollment period. Medicaid also covers 8 in 10 children living in poverty and over half of Black, Hispanic, and American Indian and Alaska Native children. The uninsured rate among children was 5.1% in 2022, down from 5.6% in 2019 and less than half the rate among nonelderly adults (11.3%), largely due to broader availability of Medicaid and CHIP coverage for children than for adults (Figure 4). People who are insured have better access to care and are more likely to receive preventive care or needed services compared with people without insurance. In 2022, nearly one-quarter (24.5%) of uninsured children had not seen a doctor in the past year compared to 5.7% of children with private coverage, and 8.6% of uninsured children went without needed care due to cost compared to less than 1% of children with private coverage. Further, a recent study released by the Congressional Budget Office (CBO) found that Medicaid enrollment in childhood can increase earnings and potentially reduce federal spending in the future.
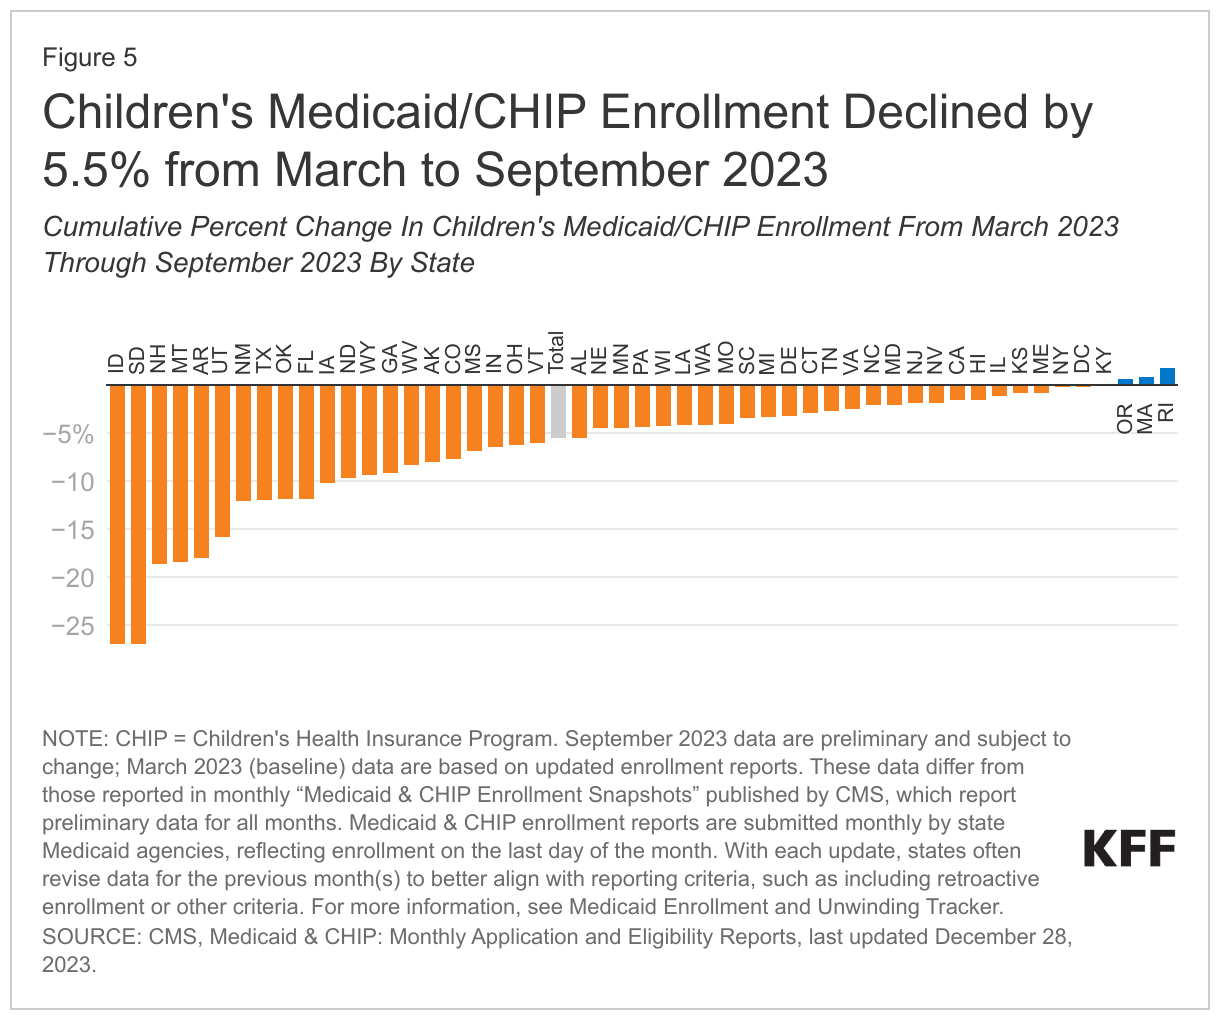
However, amid increases in poverty and financial hardship, millions have recently been disenrolled from Medicaid due to the unwinding of the Medicaid continuous enrollment provision. KFF analysis of national data from the Centers for Medicare and Medicaid Services (CMS) reveals children’s Medicaid/CHIP enrollment declined by 5.5%, or 2.3 million children, from March 2023, before the unwinding began, to September 2023 (Figure 5). Other data through January 2024 show that net Medicaid enrollment declines have reached 3.3 million children. The KFF unwinding tracker shows that in 23 states reporting data, almost 4 in 10 (37%) of those disenrolled are children. Because Medicaid eligibility levels are higher for children and with three-quarters of overall disenrollments happening because of procedural or paperwork reasons, there are concerns that children may be losing coverage and becoming uninsured despite remaining eligible. A recent KFF focus group report found that while some enrollees found the Medicaid renewal process simple, others had difficulty navigating the process and ended up losing their coverage and, in some cases, becoming uninsured. Participants noted that losing Medicaid would be “devastating” and expressed anxiety at the thought of no longer having Medicaid coverage for themselves or their children. The CBO study also found that the loss of Medicaid coverage in childhood could result in reduced GDP and have negative long-term fiscal implications for federal spending.
What to watch?
Changes in poverty and family resources have implications for financial security, as does a loss of Medicaid, and, looking ahead, it will be important to track both. Though millions of individuals have already been disenrolled from Medicaid, considerable uncertainty remains as to how overall Medicaid enrollment will change and how many individuals, including children, will become uninsured as the unwinding continues. CMS is also monitoring the unwinding and took action to reinstate coverage for 500,000 individuals (mostly children) who were erroneously disenrolled. The agency also recently released unwinding data revealing that states who have adopted unwinding strategies, including temporary waivers, have been better at maintaining coverage for children. Given this evidence, CMS issued an informational bulletin reminding states about available flexibilities and sent letters encouraging the use of these strategies to the governors of the nine states with the highest disenrollment rates for children.
While children’s poverty rates and Medicaid coverage losses have increased, there have been some recent federal actions that may help children and families cover expenses and maintain coverage in the future. President Biden has repeatedly called for an expansion of the CTC, including proposals in his Build Back Better framework and fiscal year 2024 budget. There have also been various legislative proposals to expand the CTC over the past year, with reports of Congress recently reaching tentative a bipartisan agreement to expand the CTC (although on a somewhat smaller scale relative to the 2021 expansion). Further, as of January 2024, all states are also now required to provide 12-month continuous eligibility for Medicaid and CHIP children, which has been shown to reduce Medicaid disenrollment and churn rates. Three states also recently received approval to extend continuous eligibility for children in Medicaid for multiple years, which could help children maintain coverage beyond one year.