Utilization and Spending Trends in Medicaid Outpatient Prescription Drugs, 2015-2019
Issue Brief
Key Takeaways
Prescription drug spending in Medicaid and other health programs has returned to the national policy debate. This analysis examines Medicaid outpatient prescription drug utilization and spending before rebates over the 2015 to 2019 period, which is helpful for understanding recent cost drivers and areas for targeted policy action. Key takeaways include:
- Utilization, measured in terms of the number of prescriptions, increased by 5% from 2015 to 2019. Utilization increased from 2015 to 2017 and then declined in the years following.
- The ten most frequently prescribed drug groups, which included Analgesics/Antipyretics, psychotherapeutic agents, cardiac drugs, antibiotics, and anticonvulsants, were relatively stable throughout the period, with the same groups making up the top five drug groups by utilization every year. These drug groups treat common illnesses and health conditions and reflect the health needs of Medicaid beneficiaries.
- Notably, psychotherapeutic agents, including antidepressants, were the second most prescribed drug group throughout the period of study, highlighting the key role Medicaid plays in covering and financing behavioral health care.
- Opioid prescriptions used to treat pain declined 41% over the period of study, while prescriptions to treat opioid addiction and overdose increased.
- While Medicaid net spending on prescription drugs remained almost unchanged, spending before rebates increased by 23% from 2015 to 2019. Spending before rebates followed a similar pattern to utilization, increasing from 2015 to 2017 and decreasing in 2018; however, as utilization continued to decrease in 2019, spending increased again by 9%. Trends in gross spending and utilization provide important context for pharmacy benefit policy by highlighting underlying cost factors.
- The ten most costly drug groups were relatively stable throughout the period, with the exception of molecular targeted therapy drugs, which grew from the 12th most costly drug group in 2015 to the 5th most costly drug group in 2019 before rebates.
- Antivirals were the most costly drug group before rebates every year from 2015 to 2019. Spending on antivirals, and especially hepatitis C drugs, is disproportionate to their utilization.
- Antidiabetics spending before rebates grew by 53% over the period of study, driven by spending on newer, non-insulin antidiabetic drugs.
- Generic drugs accounted for the vast majority of prescriptions over the 2015 to 2019 period, while brand drugs accounted for the vast majority of spending. Throughout the period, brand drugs accounted for a growing share of spending.
- Spending on biological products is disproportionate to their utilization, accounting for little over 1% of prescriptions every year but between 15% and 21% of Medicaid spending before rebates over the period.
States remain concerned about the entry of new high-cost drugs to the market and report that developing strategies and policies to address these drugs is a top priority. There has also been recent policy discussion about federal action to address the cost of new therapies through the FDA accelerated approval pathway as well as gene and cell therapies. Data on utilization and spending can help highlight potential implications of policy proposals.
Introduction
Prescription drugs have returned to the national policy debate, with both Congress and the administration developing proposals to address drug prices. Though attention in current federal actions is largely focused on Medicare and private insurance drug prices, federal legislation also has been recently introduced or enacted that would affect Medicaid prescription drug policy. States also remain concerned about the budgetary impact of new, high cost drugs and Medicaid drug spending, given fiscal pressures. Understanding utilization and spending patterns in Medicaid can help illustrate the potential effects of proposed policy changes or targeted policy actions.
This brief analyzes data on Medicaid drug spending and utilization from 2015 to 2019, the period after the major expansion of Medicaid under the ACA and through most recent complete data available. It examines trends across drug groups, brand or generic status, and biologic status and takes a closer look at some of the drug groups that are experiencing changes in utilization and spending or have been the subject of recent policy debates. As described in more detail in Appendix B, it is based on Medicaid State Drug Utilization Data merged with IBM Micromedex RED BOOK data to analyze trends by drug group and brand or generic status. It also incorporates data from the Food and Drug Administration (FDA) to analyze trends among biological products. Because of data restrictions, spending does not reflect rebates. This analysis updates previous analysis of Medicaid outpatient prescription drug trends.
Background: Structure of the Medicaid Prescription Drug Benefit
The Medicaid prescription drug benefit is an optional benefit that all states provide. The state may provide the benefit in a fee-for-service environment or through managed care. Most states provide the benefit through managed care, although some states have moved to carve out specific classes or the pharmacy benefit altogether. State Medicaid programs reimburse pharmacies for prescription drugs based on the ingredient costs for the drug and a dispensing fee for filling the prescription; they do not buy drugs directly from manufacturers.
Under the Medicaid Drug Rebate Program (MDRP), manufacturers that want their drugs covered by Medicaid must sign an agreement with the Secretary of Health and Human Services stating that they will rebate a specified portion of the Medicaid payment for the drug to the states, who in turn share the rebates with the federal government. In return, Medicaid must cover almost all FDA-approved drugs that those manufacturers produce.1 However, state Medicaid programs can and do implement drug utilization management techniques, such as preferred drug lists and prior authorizations, to manage utilization and spending.
In addition to federal statutory rebates, most states negotiate supplemental rebates. Both statutory and supplemental rebates account for a sizeable share of prescription drug spending, lowering aggregate drug spending by about 55% in 2019. Rebates also increased during the period of this analysis, leaving Medicaid net spending in 2019 almost the same as net spending in 2015. Rebates vary across brand and generic drugs and specialty and non-specialty drugs due to the rebate formulas and rules that require Medicaid to receive the “best price” available to other purchasers (excluding certain government programs).2 A CBO analysis recently found that on average, Medicaid obtained rebates of approximately 77% of the Medicaid retail price for certain brand-name drugs.3 Medicaid rebates also include an inflation-based component to account for rising prices over time, which insulates the program from large price hikes. The specific rebate on a given drug is proprietary for both statutory and supplemental rebates. Because of this, it is not possible to include them in this analysis of trends by drug or drug group. While rebates have implications for net Medicaid spending, understanding trends in gross spending and utilization provides important context for pharmacy benefit policy by highlighting underlying cost factors.
Trends in Prescription Drug Utilization and Spending
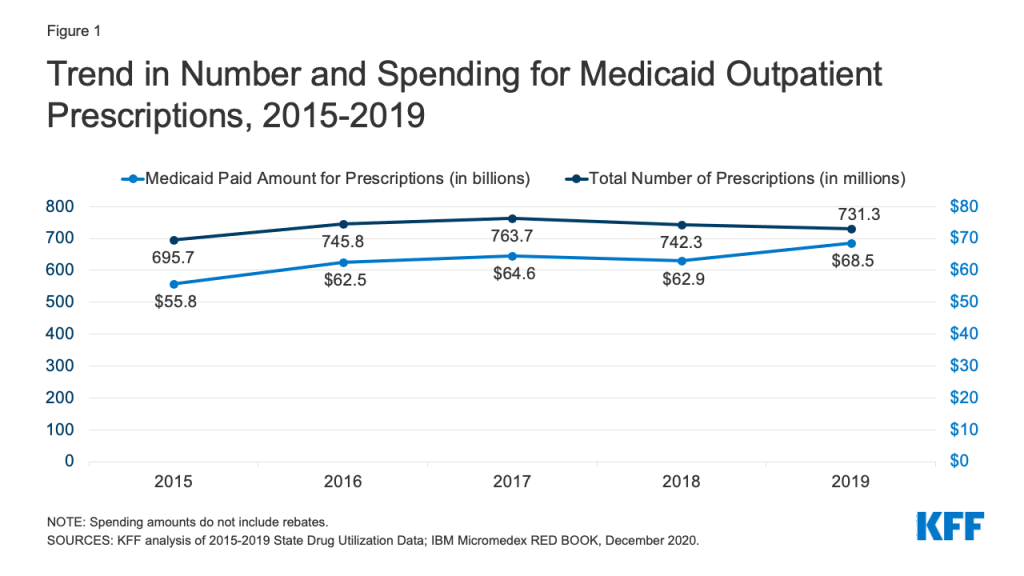
Medicaid drug utilization and spending before rebates followed similar trends from 2015-2018 but diverged in 2019. Medicaid outpatient drug utilization increased from 695.7 million prescriptions in 2015 to 763.7 million in 2017, an average annual growth of 5% (Figure 1). Following a similar pattern, Medicaid spending before rebates also increased from $55.8 billion in 2015 to $64.6 billion in 2017, representing average annual growth of 8%. From 2017 to 2018, utilization and spending both declined by 3%, decreasing from 763.7 million prescriptions and $64.6 billion down to 742.3 million prescriptions and $62.9 billion, respectively. This decline likely reflects declines in Medicaid enrollment, which declined by 1.6 million in 2018. From 2018 to 2019, utilization decreased by 1%, down to 731.3 million prescriptions, while spending diverged and grew by 9%, up to $68.5 billion. The increase in spending before rebates in 2019 may reflect the launch of expensive new brand drugs and increasing list prices.
Trends by Drug Group
The top ten most frequent drug groups by number of prescriptions accounted for over half of all prescriptions each year from 2015 through 2019 and were relatively stable during the period. The exception is antihyperlipidemic drugs, which replaced anxiolytics (a type of psychotherapeutic) as the 10th most prescribed drug group starting in 2017 (Table 1 and Appendix Table A1). Further, the same groups made up the top five drug groups by utilization every year. Throughout all years, analgesics/antipyretics accounted for the largest number of prescriptions, and psychotherapeutic agents accounted for the second largest number of prescriptions. In 2019, both groups together accounted for 20% of all Medicaid prescriptions (Figure 2). Within the drug group psychotherapeutic agents, antidepressants made up more than 70% of all psychotherapeutic prescriptions each year.

| Table 1: Rankings of Top Drug Groups by Number of Medicaid Prescriptions | ||||||
| Drug Group | Typical Use | Ranking by Year | ||||
| 2015 | 2016 | 2017 | 2018 | 2019 | ||
| Analgesics/Antipyretics | Reduce pain, fever, inflammation | 1 | 1 | 1 | 1 | 1 |
| Psychotherapeutic Agents | Treat psychosis and depression | 2 | 2 | 2 | 2 | 2 |
| Cardiac Drugs | Treat medical conditions associated with the heart or circulatory system | 4 | 3 | 3 | 3 | 3 |
| Antibiotics | Treat bacterial infections | 3 | 4 | 4 | 4 | 4 |
| Anticonvulsants | Treat epileptic seizures | 5 | 5 | 5 | 5 | 5 |
| Antidiabetic Agents | Treat diabetes | 8 | 7 | 6 | 6 | 6 |
| Allergy Immunotherapy & Antihistamines | Allergy treatment | 6 | 6 | 7 | 7 | 7 |
| Sympathomimetic Agents | Stimulate adrenergic receptors | 7 | 8 | 8 | 8 | 8 |
| Adrenals & Combinations | Reduce inflammation | 9 | 9 | 9 | 9 | 9 |
| Antihyperlipidemic Drugs | Reduce lipid levels | 12 | 12 | 10 | 10 | 10 |
| SOURCES: KFF analysis of 2015-2019 State Drug Utilization Data; IBM Micromedex RED BOOK, December 2020. | ||||||
Similarly, the ten most costly drug groups accounted for almost two thirds of Medicaid spending before rebates each year, and the composition of the top ten most costly drug groups before rebates remained relatively stable throughout the period (Table 2 and Appendix Table A2). Throughout all years, antivirals accounted for the largest share of gross drug spending. Although they switched places in 2017, antidiabetic agents and psychotherapeutic agents consistently ranked second and third in spending by year. In 2019, antivirals, antidiabetic agents, and psychotherapeutic agents together made up 30% of gross spending on Medicaid outpatient prescriptions (Figure 3). Additionally, five of the most prescribed drug groups were also five of the most costly drug groups each year: antidiabetic agents, psychotherapeutic agents, adrenals & combinations, analgesics/antipyretics, and anticonvulsants. Psychotherapeutic agents were consistently the second most prescribed drug group and second or third most costly drug group before rebates each year, highlighting the key role Medicaid plays in covering and financing behavioral health care. However, these trends in gross spending may not reflect net payment, given differences in rebates to Medicaid across brand and generic drugs, among other factors.4

| Table 2: Rankings of Top Drug Groups by Medicaid Spending | ||||||
| Drug Group | Typical Use | Ranking by Year | ||||
| 2015 | 2016 | 2017 | 2018 | 2019 | ||
| Antivirals | Treat viral infections | 1 | 1 | 1 | 1 | 1 |
| Antidiabetic Agents | Treat diabetes | 3 | 3 | 2 | 2 | 2 |
| Psychotherapeutic Agents | Treat psychosis and depression | 2 | 2 | 3 | 3 | 3 |
| Immunosuppressants | Treat autoimmune diseases and used for organ transplant | 7 | 5 | 4 | 4 | 4 |
| Molecular Targeted Therapy | Cancer treatment | 12 | 9 | 7 | 6 | 5 |
| Adrenals & Combinations | Reduce inflammation | 5 | 6 | 6 | 7 | 6 |
| Stimulant | Speed up the central nervous system | 4 | 4 | 5 | 5 | 7 |
| Coagulants & Anticoagulants | Promote blood clotting or thinning | 9 | 10 | 10 | 9 | 8 |
| Analgesics/Antipyretics | Reduce pain, fever, inflammation | 6 | 7 | 8 | 10 | 9 |
| Anticonvulsants | Treat epileptic seizures | 8 | 8 | 9 | 8 | 10 |
| NOTE: Spending amounts do not include rebates.SOURCES: KFF analysis of 2015-2019 State Drug Utilization Data; IBM Micromedex RED BOOK, December 2020. | ||||||
Antivirals
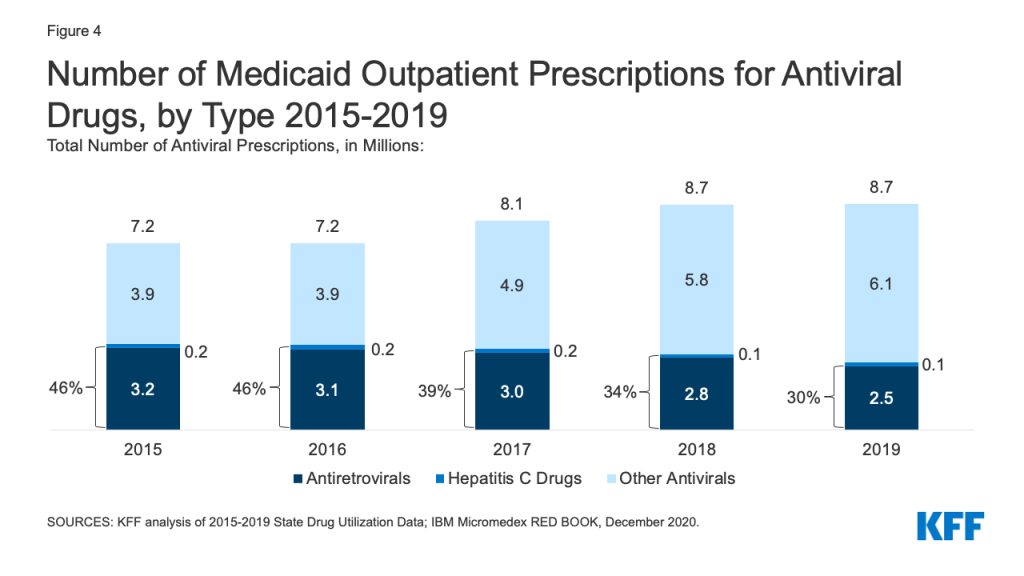
While utilization of antivirals overall increased over the period, the number of prescriptions for antiretrovirals (drugs largely used to treat or prevent HIV) and other drugs used for hepatitis C treatment have declined slightly in recent years. Medicaid plays a substantial role in covering people with HIV or Hepatitis C, providing insurance to 42% of the 1.2 million people with HIV and a disproportionate share of the 2.4 million people with hepatitis C in the US. Prescription drugs are a core component of treatment for these health conditions. Utilization of antiviral drugs increased over the period by 21% driven by increased use of other antiviral drugs, such as those that treat the flu. Utilization of antiretrovirals and other hepatitis C drugs decreased slightly over the period, making up 30% of antiviral prescriptions by 2019 (Figure 4). Declines in antiretrovirals may in part reflect substitution toward single-dose regimens, which increased by approximately 0.4 million prescriptions over this period. It could also represent greater stability in prescription regimens within a calendar year or be indicative of churn in the Medicaid program including with private insurance and the Ryan White HIV/AIDS Program. Declines in hepatitis C drugs could reflect utilization controls state Medicaid programs placed on hepatitis C drugs over the period or declining demand as a growing number of people receive the curative treatment. Over the period, antiretrovirals are more commonly prescribed than hepatitis C drugs due to the relatively larger number of people with HIV covered by Medicaid, expanded reach of these drugs through introduction of pre-exposure prophylaxis (PrEP) drugs to prevent HIV, and the fact that antiretrovirals are a maintenance drug taken over a lifetime (versus curative hepatitis C drugs taken over one course).
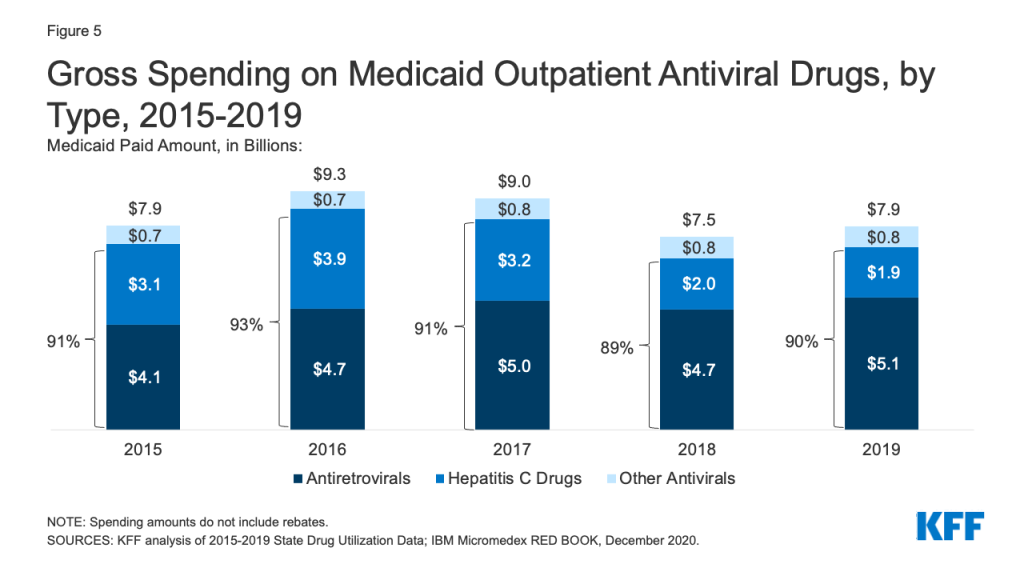
Over the entire period, antivirals were consistently the most costly drug group in Medicaid before rebates, driven by spending for drugs used to treat HIV and hepatitis C drugs. Antivirals accounted for 11% of gross Medicaid outpatient drug spending in 2019 (Figure 3). Antiretrovirals and hepatitis C drugs accounted for, on average, 91% of Medicaid antiviral spending each year before rebates (Figure 5). Gross spending on antivirals is disproportionate to their utilization (they were not among the top ten most frequently prescribed drug groups) and reflects the high cost of these drugs. While gross spending on hepatitis C drugs has decreased since 2016 due to competition, these drugs, like Harvoni and Sovaldi, account for a relatively large share of spending due to their high per-treatment cost.
Opioids
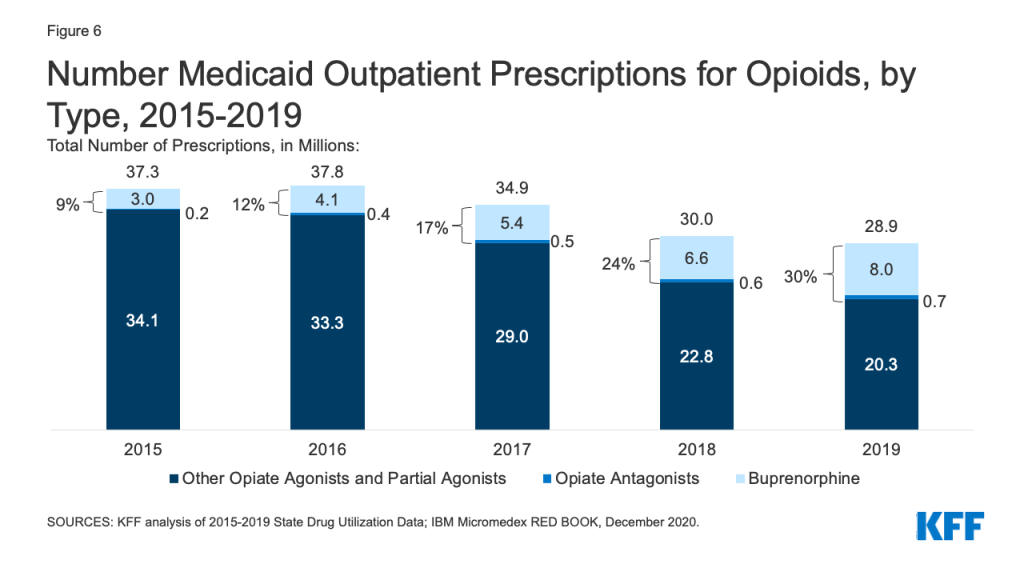
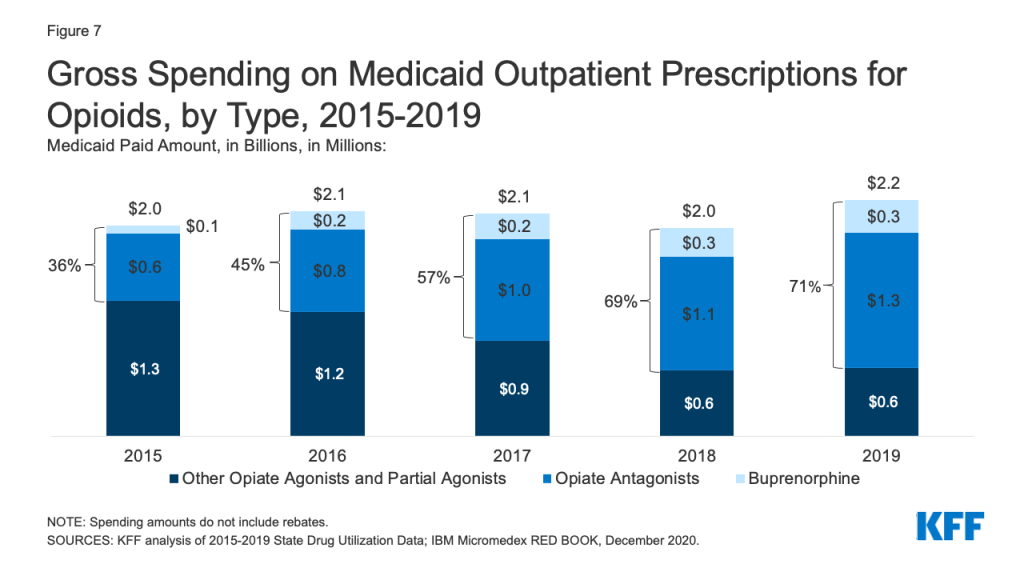
Patterns of prescriptions for opioids have shifted in recent years, with an increase in the number of prescriptions to treat opioid addiction and overdose and a decline in the number of prescriptions to treat pain. Opioids were widely prescribed during the period of study, with opiate agonists, partial agonists, and antagonists together accounting for 5.4% of all Medicaid outpatient prescriptions in 2015. However, opioid prescriptions declined over time, decreasing from 37.3 million prescriptions in 2015 to 28.9 million prescriptions in 2019 (Figure 6). While most opioids are used to treat pain, the opiate partial agonist, buprenorphine, and the opiate antagonists, naloxone and naltrexone, are used to treat addiction and overdose.5 Buprenorphine and opiate antagonists made up an increasing share of opioid prescriptions during the period, growing from 9% in 2015 to 30% in 2019. If opioids are examined aside from buprenorphine and opiate antagonists, the number of opioid prescriptions fell from 34.1 million in 2015 to 20.3 million in 2019, a 41% decline.
While overall gross spending on opioids remained relatively stable during the period, buprenorphine and opiate antagonists made up an increasing share of opioid spending before rebates. The share of gross opioid spending on buprenorphine and opiate antagonists grew from 36% in 2015 to 71% in 2019 (Figure 7). At the same time, gross spending on other opiate agonist and partial agonist prescriptions, the vast majority of which are generic, decreased by 49% over the period, reflecting the decline in the number of prescriptions to treat pain.
Antidiabetics
Antidiabetics were consistently in the top 10 most prescribed and most costly drug groups throughout the period of study. Their use grew 17% from 2015 to 2019, and Medicaid gross spending grew 53% from 2015 to 2019 (Appendix Table A1 and Figure 8). While insulins remained the largest source of gross spending on antidiabetics, non-insulin antidiabetic treatments, such as glucagon-like peptide-1 (GLP-1) receptor agonists and sodium glucose co-transporter (SGLT) inhibitors accounted for a growing share of spending (Figure 8).
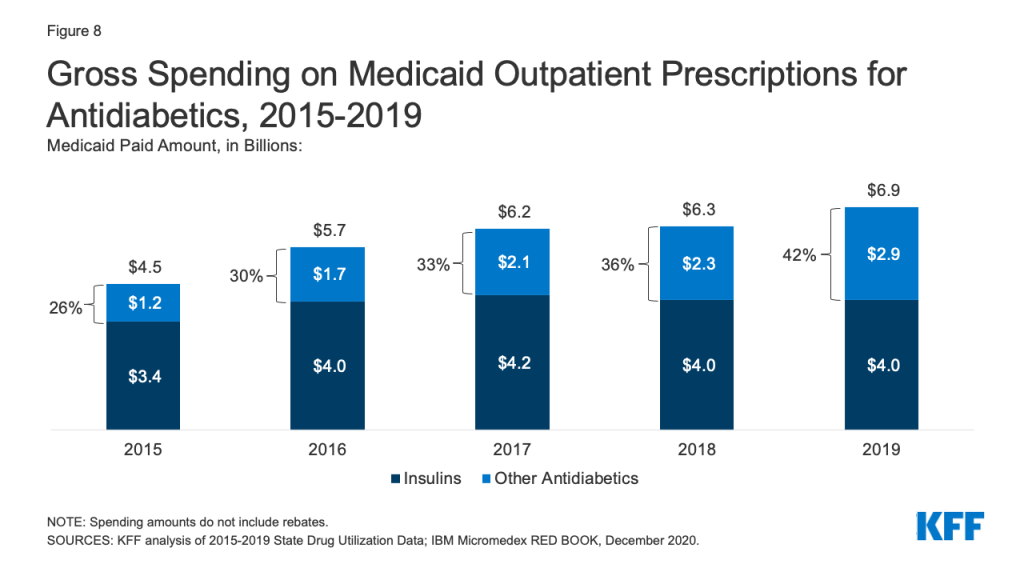
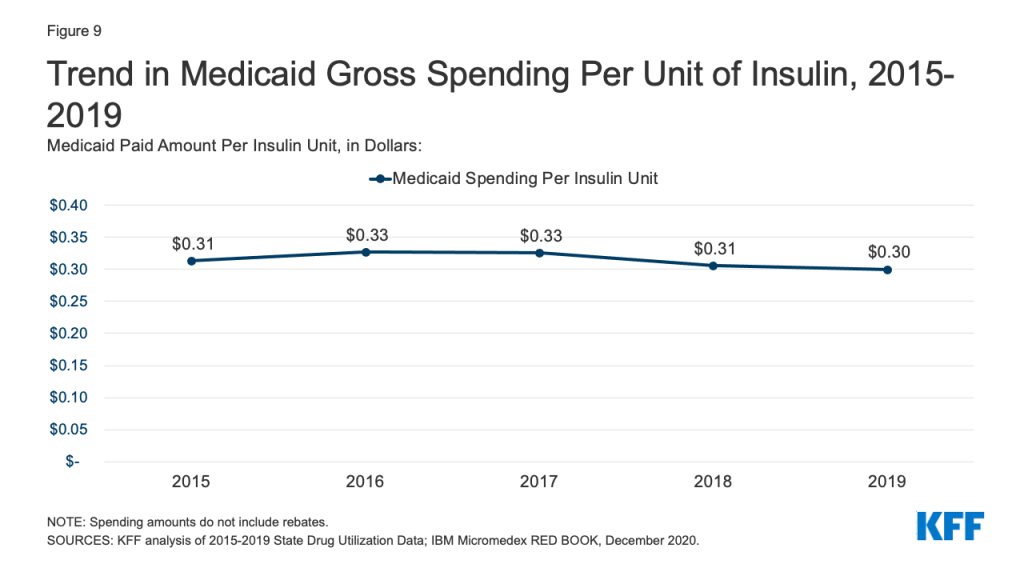
Medicaid spending on insulins before rebates remained relatively stable throughout the period. While the price of an insulin prescription nearly doubled between 2012 and 2016, Medicaid gross spending on insulin has remained around $4 billion since 2016, apart from 2017 when spending on insulins rose to $4.2 billion (Figure 8). Further, Medicaid gross spending per unit of insulin leveled off in 2016, then began to fall from a high of $0.33 in 2017 to $0.30 in 2019 (Figure 9). It is not clear from this data what has been driving this trend. Across payers, there has been a national pattern of declining insulin prices in recent years due to recent approvals of biosimilars and generics. However, because brand drugs are lower cost on net for the Medicaid program, likely due to high rebate amounts, Medicaid insulin utilization remains concentrated in brand drugs, and generic drugs are not similarly driving down insulin spending for Medicaid.
Molecular Targeted Therapy
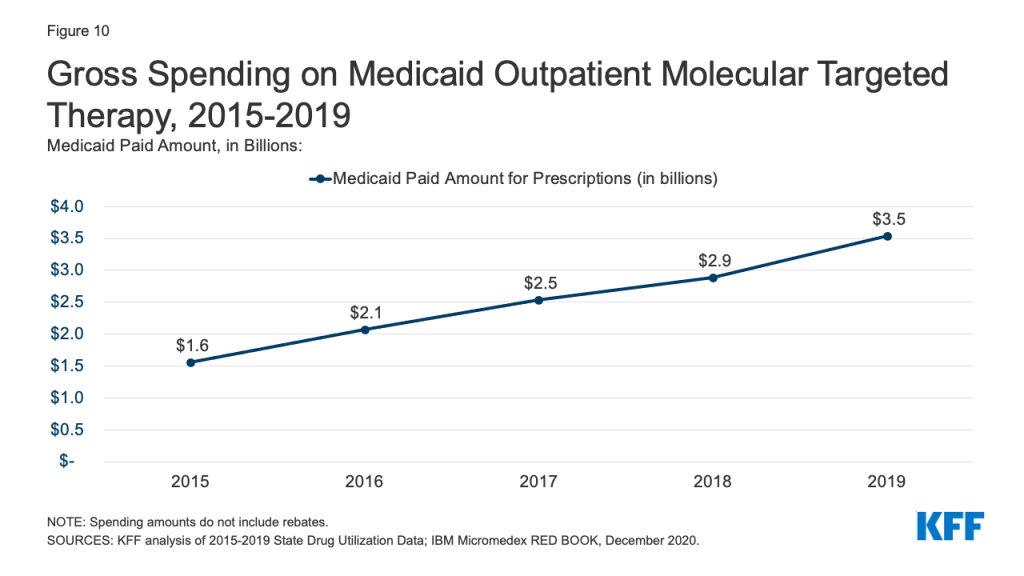
Gross Medicaid spending on molecular targeted therapy (a type of targeted cancer treatment) more than doubled during the period of study. Spending on these drugs grew from the 12th most costly drug group in 2015 to the 5th most costly drug group in 2019 (Table 2 and Figure 10). Spending on these drugs is disproportionate to their utilization, with these drugs making up only 0.1% of prescriptions but 5% of overall Medicaid spending by 2019 (Figure 3). This growth reflects the rising cost of cancer treatment and signifies a shift toward more tailored cancer treatment, using therapies to target specific molecular features of tumors alongside other cancer treatments.
Trends by Brand and Generic Status
State preference for brand or generic drugs is complex due to the incentives created by the Medicaid Drug Rebate Program. Because generic drugs have lower list prices than brand-name drugs but are still therapeutically equivalent to their corresponding brand drugs, state Medicaid programs may implement required generic substitution policies to steer utilization to generic drugs where possible.6 ,7 However, because Medicaid rebates are higher on brand-name drugs than generics, net costs may actually be lower for brand-name drugs in Medicaid, leading some states to implement “brand over generic” programs. This is especially the case at the initial entrance of a generic equivalent into the market, when a state may still have supplemental rebate agreements and other large rebates that offset the price of the brand drug. Estimates suggest these programs can lead to substantial savings.
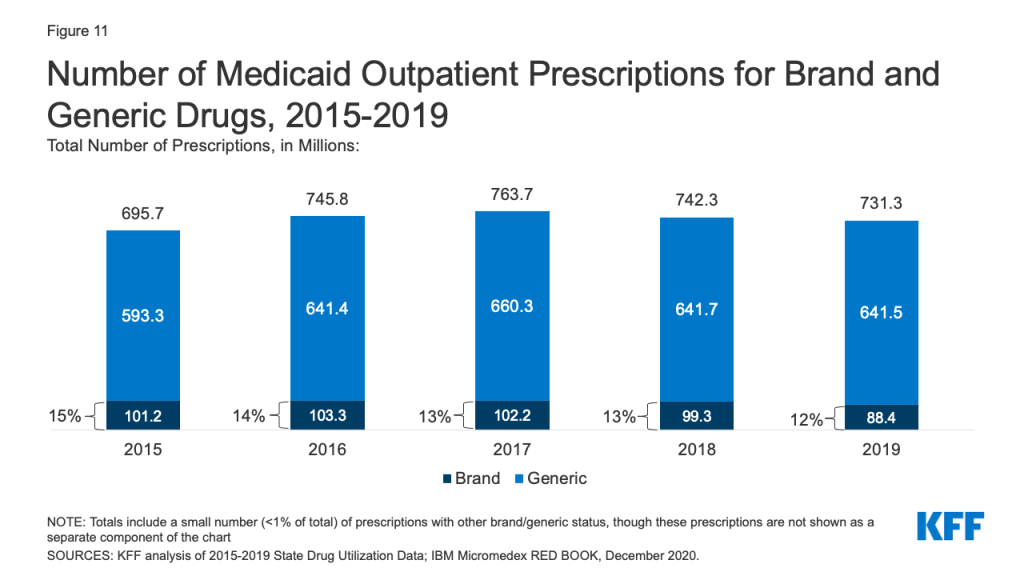
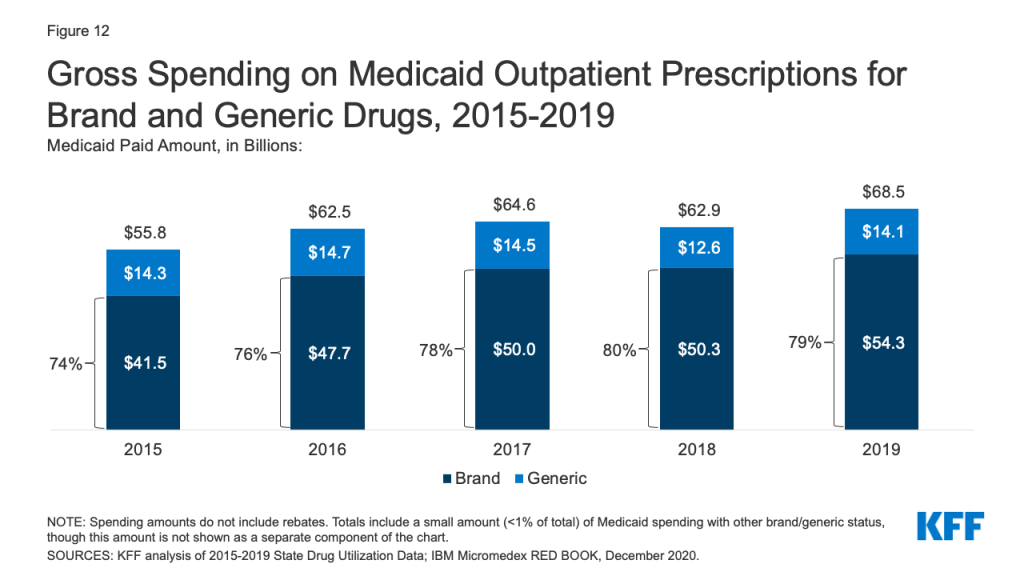
Generic drugs accounted for the vast majority of Medicaid outpatient prescriptions while brand drugs accounted for the vast majority of Medicaid spending before rebates during the period. The increase in number of Medicaid prescriptions from 2015 to 2017 was driven by the growing number of generic drugs, while the number of brand drug prescriptions over this period changed very little. The number of both brand and generic prescriptions fell from 2017 to 2019, but brand prescriptions decreased more quickly (14% drop) compared generic prescriptions (3% drop) (Figure 11). However, brand drugs consistently accounted for a relatively large share of Medicaid spending before rebates from 2015 through 2019, and this share increased slightly over time (from 74% to 79%) (Figure 12). The growth in brand spending despite decreases in both brand and generic prescriptions reflects national trends caused by increasing list prices for brand drugs and the launch of expensive new drugs during the period. Gross brand spending increased 8% from 2018 to 2019, likely driven by the launch of high cost, new specialty brand drugs like Biktarvy, Hemlibra, and Epidiolex. Other analysis shows that while other drugs have lost exclusivity over this period, the savings due to introduction of competition for those drugs are not keeping pace with the increased spending from the new drugs launching. There have also been price increases for existing brand drugs, like Humira, but Medicaid may be protected from some of these price hikes over time due to the inflationary component of the MDRP.
Trends by Biologic Status
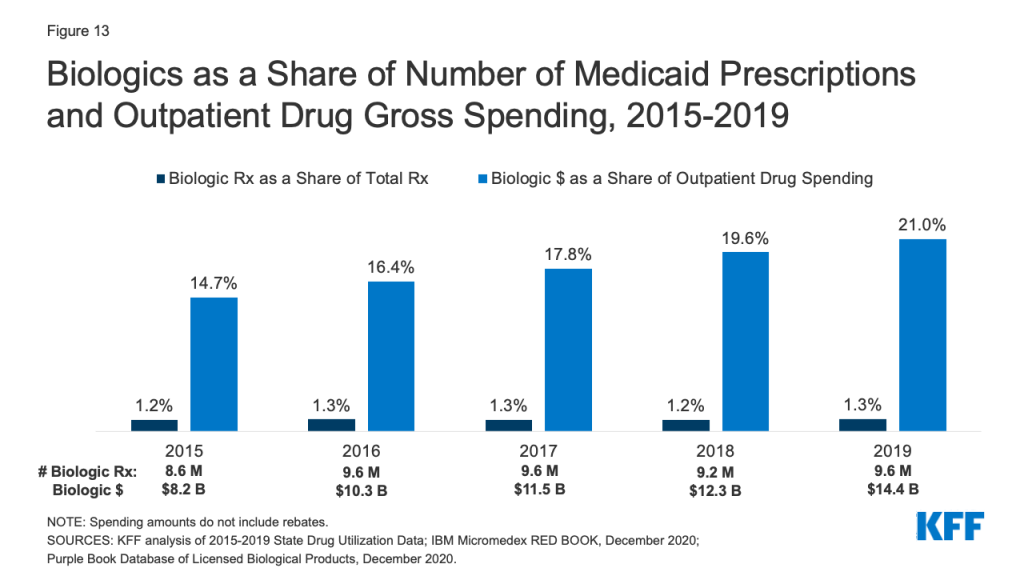
Biologics account for a very small share of prescriptions but a disproportionate share of gross Medicaid drug spending. Biologics are products, such as drugs or vaccines, derived from living organisms with chemical structures more complicated than traditional small molecule drugs. Biosimilars are products that are deemed “highly similar” or “interchangeable” with a referenced biologic. Biologics tend to be priced expensively and face less competition from biosimilars than small molecule brand drugs face from generics. Additionally, while there has been an increase in both biologics and biosimilars approved by the FDA from 2015 to 2019, some FDA approved biosimilars are not due to enter the US market for a few years or have delayed market entry to avoid patent litigation. Across the entire period from 2015-2019, relatively few prescriptions in Medicaid were biologics, but the amount Medicaid spends before rebates on biological products is outsized. While biological products consistently accounted for a little over 1% of Medicaid outpatient prescriptions every year, they accounted for between 15% and 21% of Medicaid spending on prescriptions before rebates over the period (Figure 13).
Looking Ahead
Medicaid prescription drug policy is likely to remain an issue at both the federal and state levels due to budgetary constraints and the entry of new, high-cost drugs. States remain concerned about the entry of new high-cost drugs to the market and report that developing strategies and policies to address these drugs is a top priority. There has also been recent policy discussion about strategies at the federal level to address the cost of new therapies through the FDA accelerated approval pathway as well as gene and cell therapies.
Congress may take action to address drug prices in both Medicaid and in the health system more broadly. Recent COVID-19 relief legislation includes a provision that lifts the Medicaid rebate cap (currently set at 100% AMP) beginning in 2024 and is estimated to reduce direct Medicaid spending by $14.5 billion. For drugs with large price increases over time, the Medicaid program may receive rebates from manufacturers that exceed the price of the drug. Reducing drug prices remains a focus of policymakers, particularly for individuals in Medicare and with private insurance, but any policies that change underlying drug prices will also have implications for Medicaid drug spending.
This work was supported in part by Arnold Ventures. We value our funders. KFF maintains full editorial control over all of its policy analysis, polling, and journalism activities.
Appendices
Appendix A: Tables
| Table A1: Top 10 Drug Groups by Prescriptions | |||||
| Rank | 2015 | 2016 | 2017 | 2018 | 2019 |
| 1 | Analgesics/ Antipyretics (86,082,409) | Analgesics/ Antipyretics (90,170,824) | Analgesics/ Antipyretics (87,603,296) | Analgesics/ Antipyretics (79,869,640) | Analgesics/ Antipyretics (76,321,204) |
| 2 | Psychotherapeutic Agents (63,323,593) | Psychotherapeutic Agents (68,986,100) | Psychotherapeutic Agents (73,151,398) | Psychotherapeutic Agents (73,344,877) | Psychotherapeutic Agents (74,095,484) |
| 3 | Antibiotics(48,116,460) | Cardiac Drugs (52,973,438) | Cardiac Drugs (54,803,664) | Cardiac Drugs (53,439,953) | Cardiac Drugs (51,222,781) |
| 4 | Cardiac Drugs (47,945,551) | Antibiotics (49,851,747) | Antibiotics (49,680,272) | Antibiotics (46,379,522) | Antibiotics (45,651,425) |
| 5 | Anticonvulsants (32,063,688) | Anticonvulsants (35,343,240) | Anticonvulsants (37,403,568) | Anticonvulsants (36,626,167) | Anticonvulsants (35,988,061) |
| 6 | Allergy Immunotherapy & Antihistamines (28,486,952) | Allergy Immunotherapy & Antihistamines (30,544,135) | Antidiabetic Agents (31,258,870) | Antidiabetic Agents (30,908,637) | Antidiabetic Agents (30,704,265) |
| 7 | Sympathomimetic Agents (26,357,905) | Antidiabetic Agents (29,755,936) | Allergy Immunotherapy & Antihistamines (30,975,968) | Allergy Immunotherapy & Antihistamines (29,799,083) | Allergy Immunotherapy & Antihistamines (30,083,207) |
| 8 | Antidiabetic Agents (26,186,260) | Sympathomimetic Agents (27,487,892) | Sympathomimetic Agents (27,965,076) | Sympathomimetic Agents (27,234,648) | Sympathomimetic Agents (26,686,231) |
| 9 | Adrenals & Comb. (24,081,529) | Adrenals & Comb. (25,998,790) | Adrenals & Comb. (26,753,411) | Adrenals & Comb. (25,734,924) | Adrenals & Comb. (25,814,435) |
| 10 | Anxiolytic (23,216,218) | Anxiolytic (24,351,405) | Antihyperlipidemic Drugs (24,292,645) | Antihyperlipidemic Drugs (24,004,351) | Antihyperlipidemic Drugs (23,483,226) |
| SOURCES: KFF analysis of 2015-2019 State Drug Utilization Data; IBM Micromedex RED BOOK, December 2020. | |||||
| Table A2: Top 10 Drug Groups by Medicaid Paid Amount | |||||
| Rank | 2015 | 2016 | 2017 | 2018 | 2019 |
| 1 | Antivirals ($7,848,368,982) | Antivirals ($9,206,505,141) | Antivirals ($8,917,155,503) | Antivirals ($7,457,676,103) | Antivirals ($7,853,471,067) |
| 2 | Psychotherapeutic Agents ($6,912,012,885) | Psychotherapeutic Agents ($6,283,181,304) | Antidiabetic Agents ($6,239,455,084) | Antidiabetic Agents ($6,308,551,082) | Antidiabetic Agents ($6,908,757,194) |
| 3 | Antidiabetic Agents ($4,528,901,818) | Antidiabetic Agents ($5,668,623,740) | Psychotherapeutic Agents ($5,689,022,416) | Psychotherapeutic Agents ($5,625,902,994) | Psychotherapeutic Agents ($5,873,827,270) |
| 4 | Stimulant ($2,987,804,886) | Stimulant ($3,170,230,462) | Immunosuppressants ($3,918,023,261) | Immunosuppressants ($4,601,953,316) | Immunosuppressants ($5,866,587,687) |
| 5 | Adrenals & Comb. ($2,700,067,098) | Immunosuppressants ($3,157,553,958) | Stimulant ($3,189,477,837) | Stimulant ($3,049,867,394) | Molecular Targeted Therapy ($3,537,105,418) |
| 6 | Analgesics/ Antipyretics ($2,453,327,623) | Adrenals & Comb. ($2,979,009,890) | Adrenals & Comb. ($3,039,048,140) | Molecular Targeted Therapy ($2,892,308,999) | Adrenals & Comb. ($2,976,007,562) |
| 7 | Immunosuppressants ($2,166,612,165) | Analgesics/ Antipyretics ($2,502,808,801) | Molecular Targeted Therapy ($2,539,071,962) | Adrenals & Comb. ($2,890,468,521) | Stimulant ($2,934,419,541) |
| 8 | Anticonvulsants ($1,947,754,343) | Anticonvulsants ($2,175,883,747) | Analgesics/ Antipyretics ($2,404,774,675) | Anticonvulsants ($2,433,696,422) | Coagulants & Anticoagulants ($2,590,002,985) |
| 9 | Coagulants & Anticoagulants ($1,798,452,692) | Molecular Targeted Therapy($2,077,065,490) | Anticonvulsants ($2,330,799,364) | Coagulants & Anticoagulants ($2,241,068,696) | Analgesics/ Antipyretics ($2,444,551,383) |
| 10 | Sympathomimetic Agents ($1,635,996,791) | Coagulants & Anticoagulants ($2,013,718,601) | Coagulants & Anticoagulants ($2,124,605,146) | Analgesics/ Antipyretics ($2,193,543,762) | Anticonvulsants ($2,432,123,911) |
| NOTE: Spending amounts do not include rebates.SOURCES: KFF analysis of 2015-2019 State Drug Utilization Data; IBM Micromedex RED BOOK, December 2020. | |||||
Appendix B: Methodology
This analysis of Medicaid prescription drug utilization and spending trends used 2015 through 2019 State Drug Utilization Data (SDUD), downloaded in early January 2021, merged with data from IBM Micromedex RED BOOK. The SDUD is publicly available data provided as part of the Medicaid Drug Rebate Program. It provides data on the number of prescriptions, Medicaid spending before rebates, and cost-sharing for rebate-eligible Medicaid outpatient drugs. At the time of download, 2019 data were the most recent full year of data available. The RED BOOK data is from December 2020. The use of RED BOOK data does not represent and should not be characterized as a RED BOOK endorsement of any data, findings, or other content presented in this report.
The SDUD and the RED BOOK data were merged at the NDC-level to consistently identify the drug name, as well as to incorporate brand versus generic status and the therapeutic/pharmacologic category of the product. Branded-generic drugs were classified as generic drugs. Using the FDA’s Purple Book, a list of all FDA-licensed biological products regulated by the Center for Drug Evaluation and Research (CDER) and the Center for Biologics Evaluation and Research (CBER) as of December 2020, biological products in the SDUD were identified based on drug name.
Limitations
The SDUD provides spending and utilization data by NDC, quarter, managed care or fee-for-service, and state. It also provides this data summarized for the whole country. CMS has suppressed data cells with fewer than 11 prescriptions, citing the Federal Privacy Act and the HIPAA Privacy Rule. This analysis used the national data because less data is suppressed at the national versus state level.
This analysis does not include rebates because rebate data is unavailable to the public at the NDC level. Rebates have a considerable effect on Medicaid drug spending overall, lowering net spending, but this effect varies at the drug level as different drugs receive different rebates. Additionally, although Medicaid beneficiaries largely self-administer drugs that are prescribed in an outpatient setting, medical practitioners must administer some drugs. Although states are instructed to collect drug rebates on physician-administered outpatient drugs that are not billed as a bundled service, physician-administered drugs subject to a rebate can vary from state to state. Because biologics and other specialty drugs are often physician-administered, it is possible that the data reflects lower Medicaid spending and utilization of certain drugs of this kind.
Endnotes
- 42 USC § 1396r-8(a)(1). ↩︎
- For brand name drugs, the rebate is 23.1% of Average Manufacturer Price (AMP) or the difference between AMP and “best price,” whichever is greater. Best price is defined as the lowest available price to any wholesaler, retailer, or provider, excluding certain government programs, such as the health program for veterans. For generic drugs, the rebate amount is 13% of AMP, and there is no best price provision. Rachel Dolan, Understanding the Medicaid Prescription Drug Rebate Program (Washington, DC: KFF, November 2019) https://modern.kff.org/medicaid/issue-brief/understanding-the-medicaid-prescription-drug-rebate-program/ ↩︎
- CBO analysis of 176 top-selling brand-name drugs in Medicare Part D. CBO computed the average price of those drugs per standardized prescription—a measure that roughly corresponds to a 30-day supply of medication. Congressional Budget Office, A Comparison of Brand-Name Drug Prices Among Selected Federal Programs (CBO, February 2021), https://www.cbo.gov/system/files/2021-02/56978-Drug-Prices.pdf ↩︎
- On average, Medicaid obtains rebates on brand drugs that are 77 percent of the average Medicaid retail price but only 60% for specialty drugs. The inflation-based component of the rebate averaged 31 percent of the retail price in Medicaid for specialty drugs and 43 percent for nonspecialty drugs. Congressional Budget Office, A Comparison of Brand-Name Drug Prices Among Selected Federal Programs (CBO, February 2021), https://www.cbo.gov/system/files/2021-02/56978-Drug-Prices.pdf ↩︎
- Buprenorphine, Naltrexone, and Methadone are FDA approved drugs used in Medication Assisted Treatment for opioid addiction. Buprenorphine and Methadone reduce withdrawal symptoms, and Naltrexone is an antagonist and blocks the effects of both opioids and alcohol. Naloxone is an antagonist that can reverse an opioid overdose. Methadone is administered when used to treat OUD, which is not reported in the Medicaid SDUD data. See Lisa Clemans-Cope, Emma Winiski, Victoria Lynch, and Marni Epstein, Rapid Growth in Medicaid Prescriptions and Spending to Treat Opioid Use Disorder and Opioid Overdose from 2010 to 2018 (Washington, DC, Urban Institute, July 2020), https://www.urban.org/research/publication/rapid-growth-medicaid-prescriptions-and-spending-treat-opioid-use-disorder-and-opioid-overdose-2010-2018/view/full_report. ↩︎
- Medicaid Drug Utilization Review State Comparison/Summary Report FFY 2015 Annual Report, Prescription Drug Fee-For-Service Programs, CMS, December 2016, https://www.medicaid.gov/medicaid-chip-program-information/by-topics/prescription-drugs/downloads/2015-dur-summary-report.pdf; Medicaid Drug Utilization Review State Comparison/Summary Report FFY 2016 Annual Report, Prescription Drug Fee-For-Service Programs, CMS, October 2017, https://www.medicaid.gov/medicaid-chip-program-information/by-topics/prescription-drugs/downloads/2016-dur-summary-report.pdf; Medicaid Drug Utilization Review State Comparison/Summary Report FFY 2017 Annual Report, Prescription Drug Fee-For-Service Programs, CMS, October 2018, https://www.medicaid.gov/medicaid/prescription-drugs/downloads/drug-utilization-review/2017-dur-summary-report.pdf; Medicaid Drug Utilization Review State Comparison/Summary Report FFY 2018 Annual Report, Prescription Drug Fee-For-Service Programs, CMS, https://www.medicaid.gov/medicaid/prescription-drugs/downloads/drug-utilization-review/2018-dur-ffs-summary-report.pdf; Medicaid Drug Utilization Review State Comparison/Summary Report FFY 2019 Annual Report, Prescription Drug Fee-For-Service Programs, CMS, https://www.medicaid.gov/medicaid/prescription-drugs/downloads/2019-dur-ffs-summary-report.pdf; See also “Section VI – Generic Policy and Utilization Data” in state DUR Reports, https://www.medicaid.gov/medicaid/prescription-drugs/drug-utilization-review/annual-reports/index.html. ↩︎
- Of the states that required more the restrictive requirements, a majority required preauthorization to enable a pharmacist to provide a brand drug when a generic was available. States included other requirements, such as requiring the submission of a MedWatch Form and requiring a medical reason to override the use of a generic, and some implement more than one restrictive requirement. Ibid. ↩︎