Utilization and Spending Trends in Medicaid Outpatient Prescription Drugs, 2014-2017
Issue Brief
Key Takeaways
This analysis examines Medicaid outpatient prescription drug utilization in terms of prescriptions and spending before rebates over the 2014 to 2017 period. Key takeaways include:
- Although outpatient drugs account for a small share of Medicaid spending, spending on this service before rebates increased by 21% in 2015 and grew an additional 11% in 2016. Though it grew more slowly in 2017, it is expected to grow faster than most other Medicaid services in the next 10 years. Because states must balance their budgets, ongoing increased spending on Medicaid prescription drugs is a policy concern, prompting states to consider ways to reduce drug spending.
- Utilization, measured in terms of the number of prescriptions, increased 21% from 2014 to 2017, with faster growth from 2014-15 as the ACA was implemented and slower growth in later years. The ten most frequently prescribed drug groups are the same every year, although the order changes.
- Opioid analgesics were the most prescribed drug group in 2014, but opioids as a share of total number of Medicaid prescriptions declined over time. In addition, buprenorphine composes a growing share of opioid analgesic prescriptions during the period.
- By 2017, antidepressants were the most prescribed drug group, in part reflecting significant behavioral health needs among the Medicaid expansion population.
- Medicaid spending before rebates increased 39% from 2014 to 2017; similar to use, growth was with faster from 2014-15 and slower growth in later years. Eight of the ten most costly drug groups are the same every year, although the order changes.
- Antivirals were the most costly drug group before rebates every year from 2014 to 2017, accounting for more than 13% of Medicaid outpatient drug spending in 2017. Spending on antivirals, and especially hepatitis C drugs, is disproportionate to their utilization.
- Antidiabetics grew as a share of spending becoming the second largest share by 2017. This increase is largely due to the price increases of insulins over this time period.
- Generic drugs accounted for the vast majority of prescriptions over the 2014 to 2017 period, while brand drugs accounted for the vast majority of spending. Though the volume of generic drugs has increased faster than brand, brand drugs account for a growing share of spending over time. This pattern reflects national trends caused by the launch of expensive new drugs during the period.
- Although biologics accounted for less than one percent of prescriptions, they accounted for more than ten percent of spending before rebates each year from 2014 to 2017.
Introduction
Although outpatient prescription drugs net of rebates account for only 6% of Medicaid spending, spending on this service net of rebates increased by 25% in 2014, grew an additional 13% in 20151 , and is expected to grow faster than other Medicaid services in the next 10 years.2 This growth in spending in recent years is due in part to the launch of high cost drugs, such as the hepatitis C drugs Sovaldi and Harvoni, as well as the overall growth in Medicaid spending related to the ACA expansion. Because states must balance their budgets, ongoing increased spending on Medicaid prescription drugs is a policy concern, prompting states to consider ways to reduce drug spending.3 Understanding patterns and trends in drug spending is crucial to effectively managing the benefit and developing strategies to address high drug costs.
This issue brief examines Medicaid drug spending and utilization from 2014 through 2017, the most recent complete data available. As described in more detail in Appendix B, it is based on Medicaid State Drug Utilization Data merged with Wolters Kluwer Clinical Drug Information, Inc. data to analyze trends by drug group and by brand or generic status. It also incorporates data from the Food and Drug Administration (FDA) to analyze trends among biologics. Because of data restrictions, spending does not reflect rebates. This analysis updates previous analysis of Medicaid outpatient prescription drugs.4
Background: Structure of the Medicaid Prescription Drug Benefit
Under federal law establishing the Medicaid Drug Rebate Program, in order for a drug to qualify for federal statutory Medicaid matching funds, manufacturers must sign an agreement with the Secretary of Health and Human Services stating that they will rebate a specified portion of the Medicaid payment for the drug to the states, who in turn share the rebates with the federal government. In return, Medicaid must cover almost all FDA-approved drugs that those manufacturers produce.5 Because most manufacturers participate in the Medicaid Drug Rebate Program,6 Medicaid essentially maintains an open formulary in which all drugs are covered. However, state Medicaid programs can and do implement drug utilization management techniques, such as preferred drug lists and prior authorizations, to manage utilization and spending.
In addition to federal statutory rebates, most states negotiate supplemental rebates. Both statutory and supplemental rebates account for a sizeable share of prescription drug spending, lowering aggregate drug spending by about 55% in 2017.7 The specific rebate on a given drug is proprietary for both statutory and supplemental rebates. Because of this, it is not possible to include them in this analysis of trends by drug or drug group.
The Medicaid prescription drug benefit is an optional benefit that all states provide. The state may provide the benefit in a fee-for-service environment, or through managed care. Medicaid beneficiaries8 typically fill an outpatient prescription at a pharmacy, with minimal or no copay, although sometimes a medical professional administers the outpatient drug. States that provide the benefit in a fee-for-service environment reimburse the pharmacy or outpatient setting for the prescription. States that provide the benefit through managed care pay a capitated payment to the managed care company, which reimburses the pharmacy or outpatient setting either directly or through a pharmacy benefit manager.
Trends in Prescription Drug Utilization and Spending
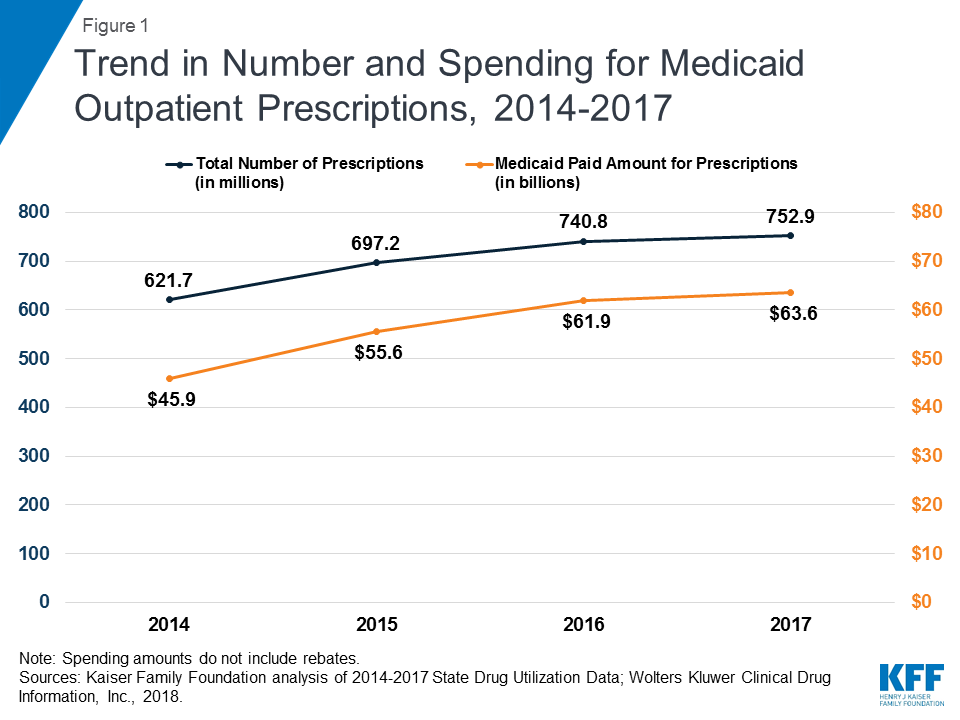
Medicaid outpatient drug utilization increased from 621.7 million prescriptions in 2014 to 752.9 million in 2017. Similarly, Medicaid spending before rebates also increased from $45.9 billion in 2014 to $63.6 billion in 2017. During this period, both utilization and spending increased more quickly between 2014 and 2015 as Medicaid expansion was implemented and the number of beneficiaries grew. Growth then slowed between 2015 and 2016 and again between 2016 and 2017. (Figure 1)
Trends by Drug Group
Though there are over 90 distinct drug groups represented in the Medicaid pharmacy benefit from 2014 through 2017, the ten most frequently prescribed and ten most costly drug groups consistently account for a disproportionate share of Medicaid outpatient drug utilization and spending. The ten most frequently prescribed groups accounted for nearly half of all prescriptions in all years. The ten most costly drug groups accounted for about two thirds of Medicaid spending before rebates from 2014 through 2017 (See Appendix Tables A1 and A2). Thus, to examine trends in drugs driving utilization and spending, the figures and tables focus on the ten most prescribed and ten most costly groups.
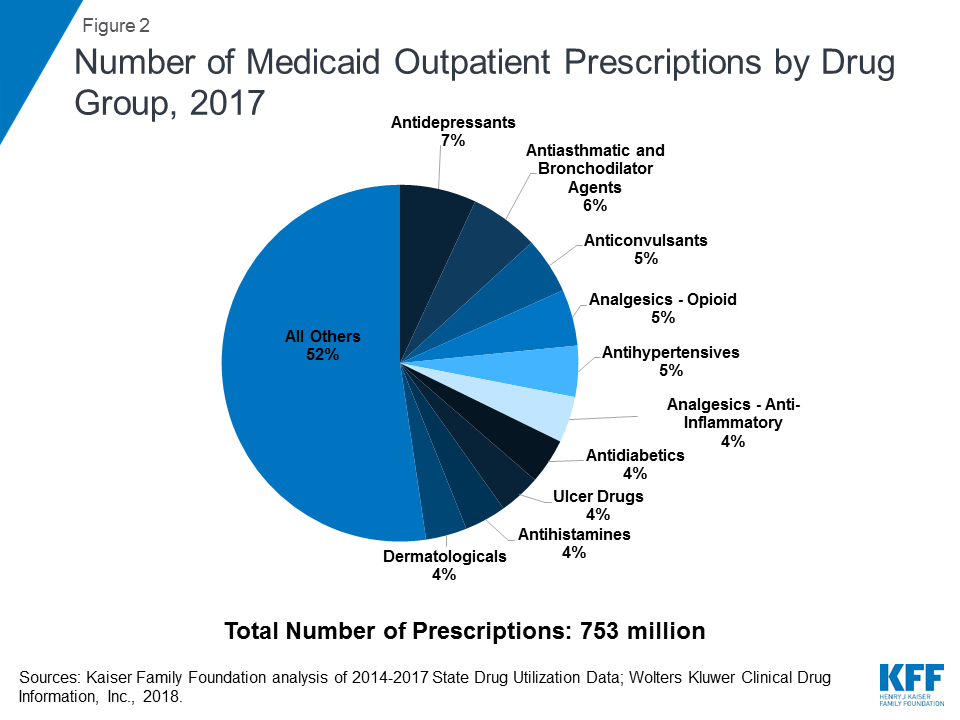
As shown in Table 1, the ranking of drug groups by number of prescriptions is relatively stable during the period, with the same groups composing the ten most prescribed drug groups each year from 2014 through 2017. Additionally, the same groups (Antiasthmatic & Bronchodilator Agents, Opioid Analgesics, Antidepressants, and Anticonvulsants) make up the top four drug groups by utilization every year. However, in recent years, antidepressant use accounted for the largest number of prescriptions, holding the top most frequently prescribed spot from 2015 through 2017. By 2017, antidepressants account for nearly 7% of total Medicaid prescriptions. (Figure 2) Medicaid expansion at least in part explains the increased use of antidepressants, as behavioral health needs, with depression and anxiety in particular, were common amongst the expansion population, and the ACA requires that Medicaid provide behavioral health treatment.9
| Table 1: Rankings of Top Drug Groups by Number of Medicaid Prescriptions | |||||
| Drug Group | Typical Usage | Ranking by Year | |||
| 2014 | 2015 | 2016 | 2017 | ||
| Analgesics – Opioid | Narcotic pain killers | 1 | 3 | 3 | 4 |
| Antiasthmatic & Bronchodilator Agents | Treats asthma & COPD | 2 | 2 | 2 | 2 |
| Antidepressants | Treats depression | 3 | 1 | 1 | 1 |
| Anticonvulsants | Treats epileptic seizures | 4 | 4 | 4 | 3 |
| Antihypertensives | Treats high blood pressure | 5 | 5 | 5 | 5 |
| Dermatologicals | Treats skin disorders | 6 | 7 | 10 | 10 |
| Analgesics – Anti-Inflammatory | Non-narcotic pain killers | 7 | 6 | 6 | 6 |
| Antihistamines | Allergy treatment and nausea suppressants | 8 | 10 | 9 | 9 |
| Ulcer Drugs | Treats ulcers | 9 | 9 | 8 | 8 |
| Antidiabetics | Treats diabetes | 10 | 8 | 7 | 7 |
| Source: Kaiser Family Foundation analysis of Medicaid State Drug Utilization Data, 2014-2017; Wolters Kluwer Clinical Drug Information, Inc., January 2018. | |||||
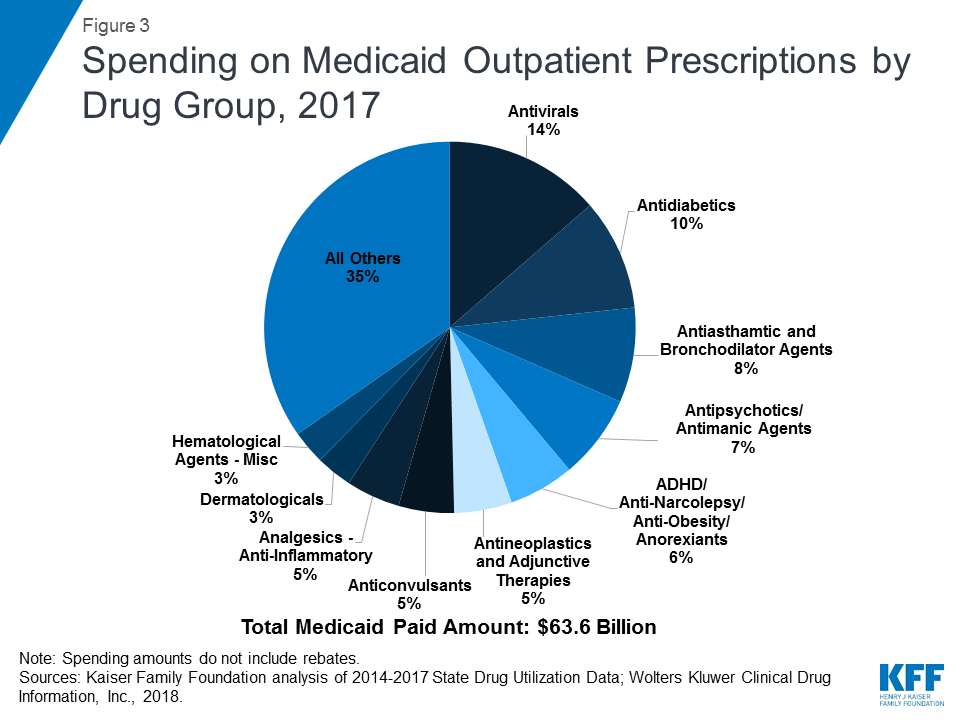
Similar to utilization, the composition of the ten most costly drug groups is relatively stable over the period, with eight of the ten groups being the same every year. (Table 2) During the period of study, antivirals accounted for the largest share of drug spending in all years, and antidiabetics grew as a share of spending to account for the second largest share of spending by 2017. (Figure 3) Although order changed, the other three groups in the top five most costly drug groups remained the same over the study period: Antipsychotic/Antimanic Agents, Antiasthmatic & Bronchodilator Agents, and ADHD/Anti-Narcolepsy/Anti-Obesity/Anorexiants. Additionally, four of the most prescribed drug groups are also four of the most costly drug groups each year: Antiasthmatic & Bronchodilator Agents, Antidiabetics, Anticonvulsants, and Dermatologicals.
| Table 2: Rankings of Top Drug Groups by Medicaid Spending | |||||
| Drug Group | Typical Usage | Ranking by Year | |||
| 2014 | 2015 | 2016 | 2017 | ||
| Antivirals | Treats viral infections | 1 | 1 | 1 | 1 |
| Antipsychotics/Antimanic Agents | Treats psychosis and bipolar disorder | 2 | 2 | 3 | 4 |
| Antiasthmatic & Bronchodilator Agents | Treats asthma and COPD | 3 | 4 | 4 | 3 |
| ADHD/ Anti-Narcolepsy/Anti-Obesity/ Anorexiants | Treats ADHD, Sleep, and Eating Disorders | 4 | 5 | 5 | 5 |
| Antidiabetics | Treats diabetes | 5 | 3 | 2 | 2 |
| Anticonvulsants | Treats epileptic seizures | 6 | 6 | 6 | 7 |
| Antineoplastics & Adjunctive Therapies | Chemotherapy | 7 | 7 | 7 | 6 |
| Analgesics – Opioid | Narcotic pain killers | 8 | 8 | 10 | 12 |
| Dermatologicals | Treats skin disorders | 9 | 9 | 9 | 9 |
| Hematological Agents – Misc. | Treats blood diseases | 10 | 11 | 11 | 10 |
| Analgesics –Anti-Inflammatory | Non-narcotic, anti-inflammatory pain killers | 11 | 10 | 8 | 8 |
| Note: Medicaid spending used to determine rankings does not include rebates.Source: Kaiser Family Foundation analysis of Medicaid State Drug Utilization Data, 2014-2017; Wolters Kluwer Clinical Drug Information, Inc., January 2018. | |||||
Antivirals
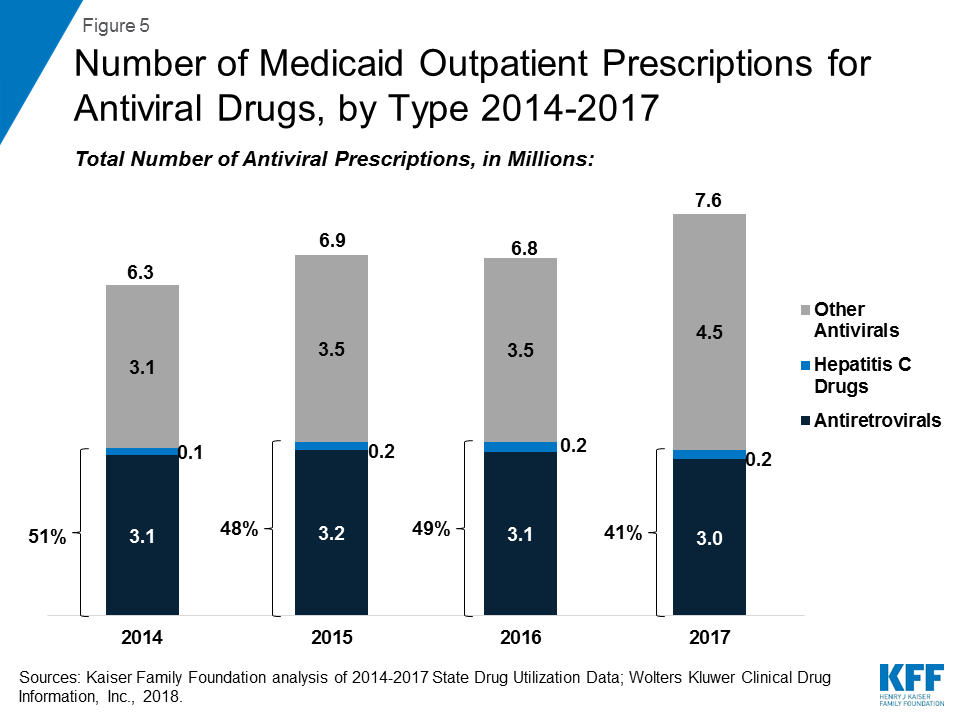
Over the entire period, antivirals are consistently the most costly drug group, accounting for 14% of Medicaid outpatient drug spending in 2017. (Figure 3) Drugs used to treat HIV, also called antiretrovirals, and hepatitis C drugs drive Medicaid spending on antivirals. Together these subclasses account for more than 90% of Medicaid antiviral spending before rebates. (Figure 4) Spending on antivirals is disproportionate to their utilization (they are not among the top ten most frequently prescribed drug groups) and reflects the high cost of these drugs as well as Medicaid’s important role in providing treatment for HIV and hepatitis C. Medicaid is the largest source of coverage for people with HIV, covering over 280,000 people, or an estimate of more than 40% of people with HIV.10 ,11 Of the up to 5 million people in the U.S. with hepatitis C, a disproportionate number are enrolled in Medicaid.12
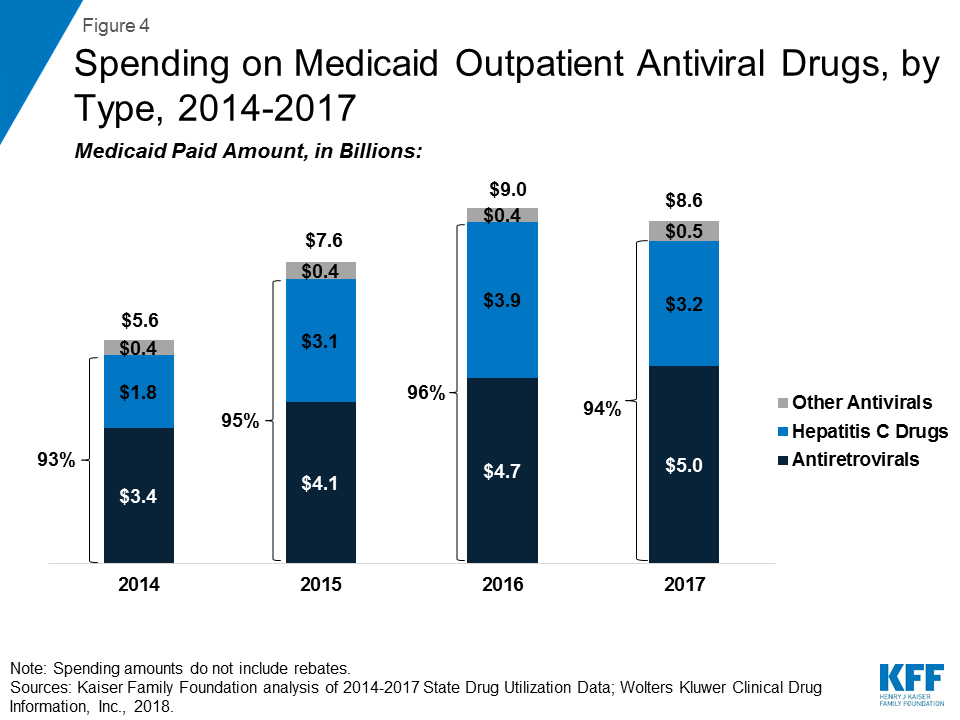
Within the drug group of antivirals, spending on hepatitis C drugs is disproportionately high relative to their utilization. Antiretrovirals are more commonly prescribed than hepatitis C drugs in part due to antiretrovirals being a maintainence drug, but also due to utilization controls state Medicaid programs placed on hepatitis C drugs over the period. (Figure 5) However, hepatitis C drugs, such as Sovaldi and Harvoni, account for a relatively large share of spending due to their high per-treatment cost. (Figure 4)13
Opioids
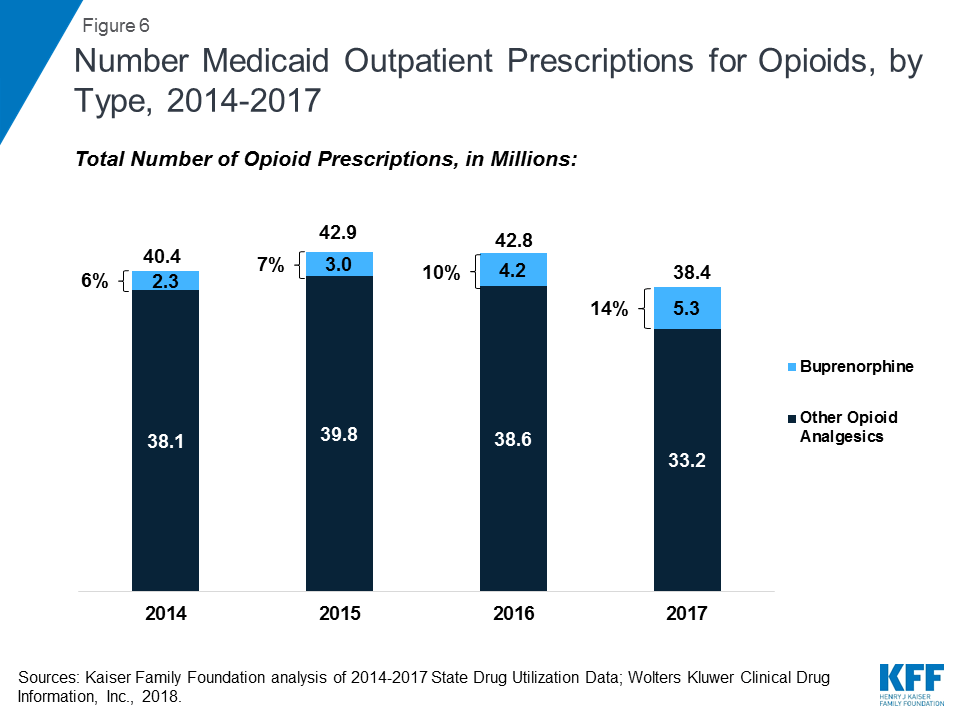
Opioid analgesics were widely prescribed during the period of study, being among the top four drug groups every year. In part, this reflects the widespread use of opioid painkillers across all payers during the period.14 However, opioids as a share of total number of Medicaid prescriptions declined over time. Further, in addition to drugs used to treat pain, this drug class includes buprenorphine, which is used to treat both pain and drug addiction.15 Buprenorphine composes a growing share of opioid analgesic prescriptions during the period at 6% in 2014 and 14% in 2017. If we examine the opioid analgesics aside from buprenorphine, the number of opioid analgesics prescriptions falls from a high of 39.8 million in 2015 to 33.2 million in 2017, a 17% decline. (Figure 6) Despite their relatively high share of prescription volume, opioids analgesics account for a smaller share (but still a top ten drug group) of Medicaid spending, due to their relatively low per prescription cost. In addition, consistent with trends in utilization, opioids dropped as a share of Medicaid outpatient drug spending over time. (Table 2)
Antidiabetics
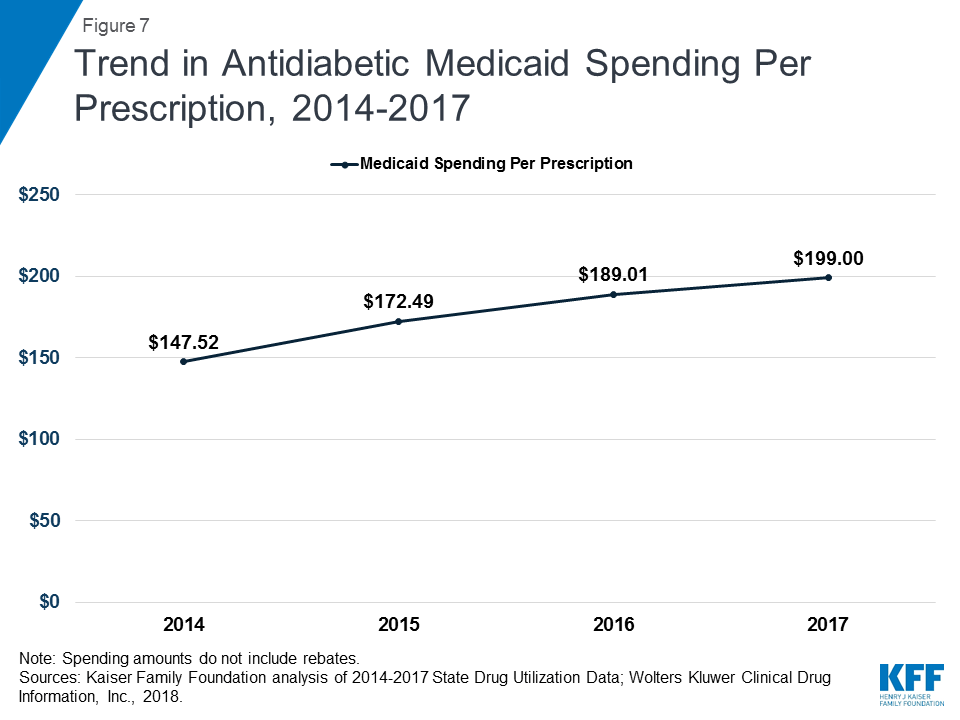
While antidiabetic use grew by 42% over the period of study, spending for the group nearly doubled, resulting in spending per prescription increasing from $148 in 2014 to $199 in 2017. (Appendix Tables A1 and A2 and Figure 7) By 2017, antidiabetic drugs were the second most costly drug group. (Figure 3) The increase in antidiabetic spending in Medicaid is largely due to the price increases of insulins over this time period. Although there have been advances in insulin since the discovery of the drug in 1921, the base form has remained largely the same since then.16 However, because of the way the drug is manufactured and regulated, there are no generic versions of insulin.17 In addition, three manufacturers, Eli Lilly, Novo Nordisk, and Sanofi Aventis, produce over 90% of the market and have increased the price of insulin over time since 2002, sometimes simultaneously.18 ,19 ,20
Trends by Brand and Generic Status
Since the 1984 Hatch-Waxman Act, drug manufacturers have been able to obtain FDA approval for generic equivalents of brand-name drugs through an expedited process, as long as the generic drug is therapeutically equivalent to a drug on the market that had received FDA approval through the more rigorous application for a new product. To balance out increased competition from generic manufacturers, the FDA has power to grant exclusivity periods for brand name drugs approved through the more rigorous pathway. Regulatory exclusivity provides manufacturers with a degree of market exclusivity, enabling them to price the drug with no market competition.
Because generic drugs are lower cost, but still therapeutically equivalent to their corresponding brand drugs, state Medicaid programs implement policies to encourage use of generic drugs where possible. From 2014 through 2017, most state Medicaid programs required generic substitution in their FFS programs when the equivalent brand name drug was prescribed, unless the prescriber had written “Brand Medically Necessary” on the prescription or the state included a more restrictive requirement.21 ,22
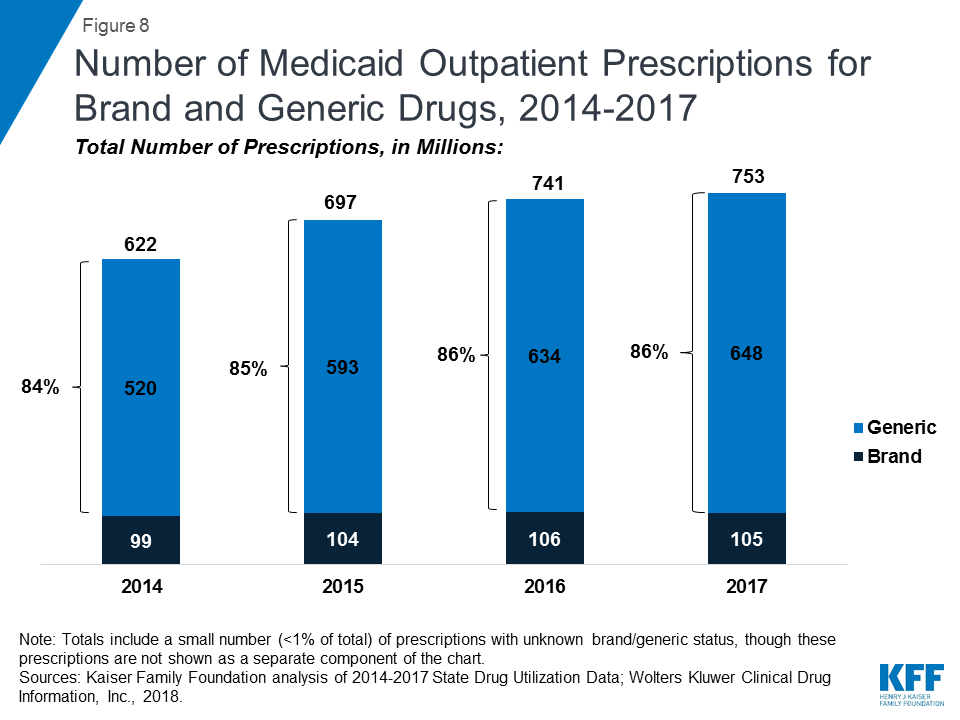
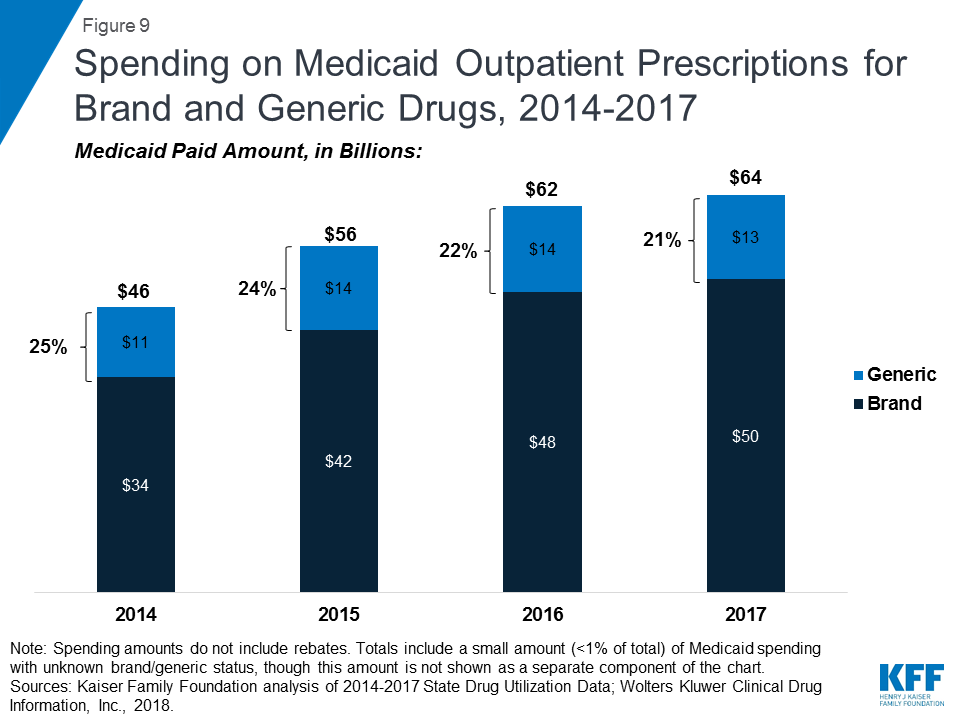
As seen in Figure 8, generic drugs accounted for the vast majority of prescription drug volume in Medicaid from 2014 through 2017. In addition, the average annual increase in number generic prescription drugs covered through Medicaid outpaced the increase in the number of brand name drugs leading to a small increase in generic drugs’ share of total prescription volume (from 84% to 86%). However, as seen in Figure 9, generic drugs accounted for a relatively small share of Medicaid spending on drugs before rebates from 2014 through 2017, and this share declined slightly over time (from 25% to 21%). This growth in brand spending despite larger increases in generic volume reflects national trends caused by the launch of expensive new drugs during the period. While other drugs have lost exclusivity over this period, the savings due to introduction of competition for those drugs are not keeping pace with the increased spending from the new drugs launching.23
Trends by Biologic Status
Biologics are products, such as drugs or vaccines, derived from living organisms with chemical structures more complicated than traditional small molecule drugs. As a result, the FDA licenses biologics through a different process than it uses to approve small molecule drugs.24 As part of the ACA, Congress created a pathway for the FDA to license biosimilars, products that are deemed “highly similar” or “interchangeable” with a referenced biologic.25
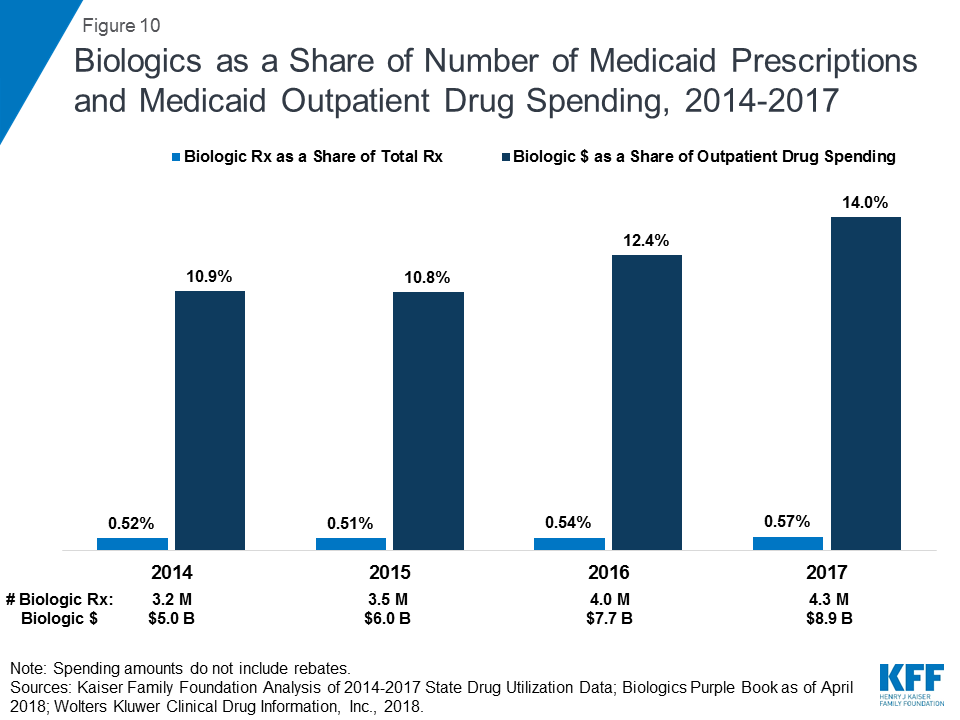
Biologics tend to be priced expensively and face less competition from biosimilars than small molecule brand drugs face from generics. Additionally, although biosimilar competition does lower the price of biologics, it does so to a lesser degree compared with the effect of generic entry on small-molecule drug market.26 As a result, across the entire period, the amount Medicaid spends before rebates on biologics is outsized compared to the number of prescriptions that Medicaid fills. While biologics consistently account for less than 1 percent of Medicaid outpatient prescriptions every year, they account for between 11% and 14% of Medicaid spending on prescriptions before rebates over the period. (Figure 10)
Looking Ahead
As Medicaid drug spending is expected to grow faster than most other components of the program, policy makers are looking into ways to generate savings in the pharmacy benefit. Medicaid directors are concerned about the launch of expensive new prescription drugs.27 States have been able to negotiate higher rebates for hepatitis C drugs due to competition within the class, but they remain concerned about other high cost drugs such as hemophilia factor, oncology, mental health and HIV/AIDS drugs.28 Policymakers are also expressing concern about insulin, common antibiotic prescriptions that have been rising in price. About 30 million Americans have either type 1 or type 2 diabetes, and the prevalence of the disease is expected to grow.29 Because of both the cost and the rising prevalence of diabetes, the cost of insulin has become a touchstone, and state and federal lawmakers, attorneys general, and other parties have been examining the topic, writing legislation, and filing lawsuits.30 In reaction to the growing concern about Medicaid drug costs, there has been a fair amount of action at the state level, such as the implementation of New York’s drug spending cap in April 2017,31 Oklahoma’s value-based contracts for specific drugs,32 and Louisiana’s steps towards a subscription payment model for hepatitis C drugs.33
At the federal level, Congress is considering how the Medicaid Drug Rebate Program interacts with alternative payment structures, such as value-based payments.34 In addition, the FDA has taken steps and announced plans to increase competition among generics35 and biosimilars.36 In 2016, 2017, and 2018, the FDA approved record numbers of generic drugs.37 However, while biologics remain expensive, and many biosimilars have been approved in the past several years, as of yet, only four biosimilars have come to market. In general, the effects of actions at the federal level, both in terms of new bills and FDA activity, remain yet to be seen.
Although an optional benefit within Medicaid, outpatient prescription drugs are an important component in the management of acute and long-term health issues. Without Medicaid, many prescription drugs would be prohibitively expensive to beneficiaries. Because prescription drugs are an integral component of medical care and treatment, it is important to understand how drugs are used, and the factors driving drug costs in Medicaid.
Appendices
Appendix A: Tables
| Table A1: Top 10 Drug Groups by Prescriptions | ||||
| Rank | 2014 | 2015 | 2016 | 2017 |
| 1 | Analgesics – Opioid(40,443,041) | Antidepressants(44,868,553) | Antidepressants(49,299,537) | Antidepressants(52,208,872) |
| 2 | Antiasthmatic andBronchodilator Agents(40,076,215) | Antiasthmatic andBronchodilator Agents(43,465,120) | Antiasthmatic andBronchodilator Agents(46,392,776) | Antiasthmatic andBronchodilator Agents(47,221,760) |
| 3 | Antidepressants(38,134,482) | Analgesics – Opioid(42,878,656) | Analgesics – Opioid(42,797,301) | Anticonvulsants(38,473,276) |
| 4 | Anticonvulsants(29,111,977) | Anticonvulsants(33,644,651) | Anticonvulsants(36,913,446) | Analgesics – Opioid(38,445,789) |
| 5 | Antihypertensives(26,825,330) | Antihypertensives(31,427,118) | Antihypertensives(34,158,826) | Antihypertensives(34,870,056) |
| 6 | Dermatologicals(24,751,860) | Analgesics -Anti-Inflammatory(28,900,169) | Analgesics -Anti-Inflammatory(31,058,834) | Analgesics -Anti-Inflammatory(31,546,029) |
| 7 | Analgesics -Anti-Inflammatory(24,618,998) | Dermatologicals(26,805,736) | Antidiabetics(29,694,134) | Antidiabetics(30,972,939) |
| 8 | Antihistamines(23,315,441) | Antidiabetics(26,338,009) | Ulcer Drugs(28,268,099) | Ulcer Drugs(28,551,449) |
| 9 | Ulcer Drugs(23,035,113) | Ulcer Drugs(26,314,817) | Antihistamines(28,089,627) | Antihistamines(28,509,398) |
| 10 | Antidiabetics(21,860,462) | Antihistamines(25,973,412) | Dermatologicals(27,921,469) | Dermatologicals(28,089,695) |
| Source: Kaiser Family Foundation analysis of Medicaid State Drug Utilization Data, 2014-2017; Wolters Kluwer Clinical Drug Information, Inc., January 2018. | ||||
| Table A2: Top 10 Drug Groups by Medicaid Paid Amount | ||||
| Rank | 2014 | 2015 | 2016 | 2017 |
| 1 | Antivirals($5,634,419,735) | Antivirals($7,604,610,681) | Antivirals($8,986,987,908) | Antivirals($8,645,443,492) |
| 2 | Antipsychotics/Antimanic Agents($5,219,140,280) | Antipsychotics/Antimanic Agents($5,954,459,891) | Antidiabetics($5,612,449,234) | Antidiabetics($6,163,521,823) |
| 3 | Antiasthmatic &Bronchodilator Agents($3,946,968,379) | Antidiabetics($4,543,030,175) | Antipsychotics/Antimanic Agents($5,291,224,179) | Antiasthmatic & Bronchodilator Agents($5,246,389,751) |
| 4 | ADHD/Anti-Narcolepsy/Anti-Obesity/ Anorexiants($3,325,666,946) | Antiasthmatic &Bronchodilator Agents($4,509,339,296) | Antiasthmatic & Bronchodilator Agents($5,081,859,758) | Antipsychotics/Antimanic Agents($4,675,185,444) |
| 5 | Antidiabetics($3,224,765,165) | ADHD/Anti-Narcolepsy/Anti-Obesity/ Anorexiants($3,668,785,052) | ADHD/Anti-Narcolepsy/Anti-Obesity/ Anorexiants($3,702,032,122) | ADHD/Anti-Narcolepsy/Anti-Obesity/ Anorexiants($3,629,296,232) |
| 6 | Anticonvulsants($1,973,858,661) | Anticonvulsants($2,481,702,094) | Anticonvulsants($2,833,182,272) | Antineoplastics &Adjunctive Therapies($3,200,282,451) |
| 7 | Antineoplastics &Adjunctive Therapies($1,777,171,748) | Antineoplastics &Adjunctive Therapies($2,268,353,599) | Antineoplastics & Adjunctive Therapies($2,784,098,702) | Anticonvulsants($3,068,292,420) |
| 8 | Analgesics – Opioid($1,699,532,425) | Analgesics – Opioid($1,951,254,619) | Analgesics -Anti-Inflammatory($2,519,896,812) | Analgesics -Anti-Inflammatory($2,989,000,836) |
| 9 | Dermatologicals($1,412,206,537) | Dermatologicals($1,886,913,962) | Dermatologicals($2,071,058,258) | Dermatologicals($2,007,038,332) |
| 10 | Hematological Agents – Misc.($1,346,289,358) | Analgesics -Anti-Inflammatory($1,769,811,192) | Analgesics – Opioid($1,997,426,544) | Hematological Agents – Misc.($1,876,126,156) |
| Note: Medicaid spending does not include rebates.Source: Kaiser Family Foundation analysis of Medicaid State Drug Utilization Data, 2014-2017; Wolters Kluwer Clinical Drug Information, Inc., January 2018. | ||||
Appendix B: Methodology
This analysis of Medicaid prescription drug utilization and spending trends, we used 2014 through 2017 State Drug Utilization Data (SDUD), downloaded in early January 2019, merged with data from Wolters Kluwer Clinical Information, Inc (“WKCDI”).38 The SDUD is publicly available data provided as part of the Medicaid Drug Rebate Program. It provides data on the number of prescriptions, Medicaid spending before rebates, and cost-sharing for rebate-eligible Medicaid outpatient drugs. At the time of download, 2017 data were the most recent full year of data available. The WKCDI data is from January 2018. The use of WKCDI data does not represent and should not be characterized as a WKCDI endorsement of any data, findings, or other content presented in this report.
The SDUD and the WKCDI data were merged at the NDC-level to consistently identify the drug name, as well as to incorporate brand versus generic status and the WKCDI Therapeutic Classifications System’s drug group. Single-source and multi-source, originator drugs were classified as brand drugs. If a drug was available as both a brand and a generic, it was categorized as a brand when summarizing how many of the most costly drugs were brands and how many were generics. Using the Center for Drug Evaluation and Research List of Licensed Biological Products and the Center for Biologics Evaluation and Research List of Licensed Biological Products39 as of March 2018, biologics in the SDUD were identified based on drug name.
Limitations
The SDUD provides spending and utilization data by NDC, quarter, managed care or fee-for-service, and state. It also provides this data summarized for the whole country. Starting in 2016, CMS has suppressed data cells with fewer than 11 prescriptions, citing the Federal Privacy Act and the HIPAA Privacy Rule.40 Because less data is suppressed at the national versus state level, this analysis used the national data. Comparing 2015 data available prior to the methodology change to 2015 data after the methodology change, this data suppression at the national level does not dramatically alter findings at the macro level as shown in this brief. It does alter analyses examining the most costly drug per prescription, but this type of analysis is beyond the scope of this brief.
This analysis does not include rebates because this data is unavailable to the public at the NDC level. Rebates have a considerable effect on Medicaid drug spending overall, lowering net spending, but this effect varies at the drug level as different drugs receive different rebates. Additionally, although Medicaid beneficiaries largely self-administer drugs that are prescribed in an outpatient setting, medical practitioners must administer some drugs. Although states are instructed to collect drug rebates on physician-administered outpatient drugs that are not billed as a bundled service, research has shown that not all states do so.41 Because biologics and other specialty drugs are often physician-administered, it is possible that the data reflects lower Medicaid spending and utilization of certain drugs of this kind.
Endnotes
- Kaiser Family Foundation analysis of National Health Expenditure Accounts for calendar year 2017, https://www.cms.gov/Research-Statistics-Data-and-Systems/Statistics-Trends-and-Reports/NationalHealthExpendData/NationalHealthAccountsHistorical.html. ↩︎
- “Medicaid Payment for Outpatient Prescription Drugs,” (Washington, DC, MACPAC, May 2018), https://www.macpac.gov/wp-content/uploads/2015/09/Medicaid-Payment-for-Outpatient-Prescription-Drugs.pdf. ↩︎
- Katherine Young and Rachel Garfield, “Snapshots of Recent State Initiatives in Medicaid Prescription Drug Cost Control,” (Washington, DC: Kaiser Family Foundation, February 2018), https://modern.kff.org/medicaid/issue-brief/snapshots-of-recent-state-initiatives-in-medicaid-prescription-drug-cost-control/. ↩︎
- Brian Bruen and Katherine Young, What Drives Spending and Utilization on Medicaid Drug Benefits in States, (Washington, DC: Kaiser Family Foundation, December 2014), http://files.kff.org/attachment/brief-what-drives-spending-and-utilization-on-medicaid-drug-benefits. ↩︎
- 42 USC § 1396r-8(a)(1). ↩︎
- “Medicaid Drug Rebate Program,” CMS, https://www.medicaid.gov/medicaid/prescription-drugs/medicaid-drug-rebate-program/index.html. ↩︎
- MACStats: Medicaid and CHIP Data Book, MACPAC, December 2018, “Exhibit 28: Medicaid Gross Spending and Rebates for Drug by Delivery System, FY 2017 (millions)”, https://www.macpac.gov/wp-content/uploads/2018/12/December-2018-MACStats-Data-Book.pdf. ↩︎
- Since January 1, 2006, Medicare has provided outpatient drugs to its beneficiaries, including Medicare and Medicaid dual enrollees through Medicare Part D. ↩︎
- See “Medicaid Expansion: Behavioral Health Treatment Use in Selected States in 2014,” GAO, June 2017, https://www.gao.gov/products/GAO-17-529. ↩︎
- “Medicaid Enrollment and Spending on HIV/AIDS, FY 2013,” Kaiser Family Foundation State Health Facts, https://modern.kff.org/hivaids/state-indicator/enrollment-spending-on-hiv/?currentTimeframe=0&sortModel=%7B%22colId%22:%22Location%22,%22sort%22:%22asc%22%7D. ↩︎
- “Medicaid and HIV,” October 2016, Washington, DC: Kaiser Family Foundation, https://modern.kff.org/hivaids/fact-sheet/medicaid-and-hiv/. ↩︎
- U.S. Congress, Senate, Committee on Finance, The Price of Sovaldi and Its Impact on the U.S. Health Care System, 114th Congress, 1st session, 2015, http://www.finance.senate.gov/imo/media/doc/1%20The%20Price%20of%20Sovaldi%20and%20Its%20Impact%20on%20the%20U.S.%20Health%20Care%20System%20(Full%20Report).pdf. ↩︎
- In December 2013, the FDA approved Gilead Sciences’ breakthrough drug Sovaldi, which essentially cures certain genotypes of hepatitis C with few side effects. Since then, the FDA has approved additional hepatitis C drugs from Gilead and three other companies, and all genotypes of hepatitis C are now essentially curable. Although some states are now reporting that they are able to secure meaningful supplemental rebates due to competition, the price of the hepatitis C drugs were initially prohibitively expensive, even with the statutory rebate. Kathleen Gifford, Eileen Ellis, Barbara Coulter Edwards, Aimee Lashbrook, Elizabeth Hinton, Larisa Antonisse, Robin Rudowitz, States Focus on Quality and Outcomes Amid Waiver Changes: Results from a 50-State Medicaid Budget Survey for State Fiscal Years 2018 and 2019, (Washington, DC: Kaiser Family Foundation, October 2018), https://modern.kff.org/medicaid/report/states-focus-on-quality-and-outcomes-amid-waiver-changes-results-from-a-50-state-medicaid-budget-survey-for-state-fiscal-years-2018-and-2019/. ↩︎
- For non-elderly adults opioid addiction rates by insurance status, see Julia Zur, 6 Things to Know about Uninsured Adults with Opioid Addiction, (Washington, DC, Kaiser Family Foundation, May 2017), https://modern.kff.org/uninsured/fact-sheet/6-things-to-know-about-uninsured-adults-with-opioid-addiction/. For discussion of opioid addiction among the elderly, see, e.g., Joe Davidson, “Unseen face of the opioid epidemic: drug abuse among the elderly grows,” Washington Post, May 25, 2018, https://www.washingtonpost.com/news/powerpost/wp/2018/05/25/unseen-face-of-the-opioid-epidemic-drug-abuse-among-the-elderly-grows/?utm_term=.3badd9bd9fde. ↩︎
- Buprenorphine, Naltrexone, and Methadone are drugs used in Medication Assisted Treatment for opioid addiction. Buprenorphine and Methadone are both classified as Opioid Analgesics, as they both also treat pain. However, Methadone is only prescribed when used to treat pain, and is administered when used to treat addiction. As a result, the methadone prescriptions in the SDUD are presumed to be for the treatment of pain. Naltrexone is classified as an Antidote and Specific Antagonist. See Lisa Clemans-Cope, Marni Epstein, and Genevieve M. Kenney, “Rapid Growth in Medicaid Spending on Medications to Treat Opioid Use Disorder and Overdose,” (Washington, DC, Urban Institute, June 2017), https://www.urban.org/sites/default/files/publication/91521/2001386-rapid-growth-in-medicaid-spending-on-medications-to-treat-opioid-use-disorder-and-overdose_3.pdf. ↩︎
- “Insulin: A Lifesaving Drug Too Often Out of Reach,” Congressional Diabetes Caucus, November 2018, https://diabetescaucus-degette.house.gov/sites/diabetescaucus.house.gov/files/Congressional%20Diabetes%20Caucus%20Insulin%20Inquiry%20Whitepaper%20FINAL%20VERSION.pdf. ↩︎
- Insulin is a biologic drug that has been regulated as a small molecule drug. In March 2020, it will be regulated as biologic drug, which will allow for manufacturers to produce insulin biosimilars. “FDA ‘Confident’ that Interchangeable Insulin Will Be Available After March 2020,” FDANews Drug Daily Bulletin, December 21, 2018, https://www.fdanews.com/articles/189628-fda-confident-that-interchangeable-insulin-will-be-available-after-march-2020. ↩︎
- Nicholas Florko, “Gottlieb blasts high insulin prices, touts far-off new rules he says will spur competition in that market,” Stat News, December 11, 2018, https://www.statnews.com/2018/12/11/gottlieb-blasts-high-insulin-prices-touts-new-rules/. ↩︎
- The price doubled since 2012, having previously tripled between 2002 and 2013. “Insulin: A Lifesaving Drug Too Often Out of Reach,” op. cit. ↩︎
- Ed Silverman, “Bernie Sanders calls for federal investigation of insulin makers for price collusion,” Stat News, November 3, 2016, https://www.statnews.com/2016/11/03/sanders-insulin-investigation/. ↩︎
- Medicaid Drug Utilization Review State Comparison/Summary Report FFY 2014 Annual Report, Prescription Drug Fee-For Service Programs, CMS, September 2015, https://www.medicaid.gov/medicaid-chip-program-information/by-topics/prescription-drugs/downloads/2014-dur-summary-report.pdf; Medicaid Drug Utilization Review State Comparison/Summary Report FFY 2015 Annual Report, Prescription Drug Fee-For-Service Programs, CMS, December 2016, https://www.medicaid.gov/medicaid-chip-program-information/by-topics/prescription-drugs/downloads/2015-dur-summary-report.pdf; Medicaid Drug Utilization Review State Comparison/Summary Report FFY 2016 Annual Report, Prescription Drug Fee-For-Service Programs, CMS, October 2017, https://www.medicaid.gov/medicaid-chip-program-information/by-topics/prescription-drugs/downloads/2016-dur-summary-report.pdf; Medicaid Drug Utilization Review State Comparison/Summary Report FFY 2017 Annual Report, Prescription Drug Fee-For-Service Programs, CMS, October 2018, https://www.medicaid.gov/medicaid/prescription-drugs/downloads/drug-utilization-review/2017-dur-summary-report.pdf. See also “Attachment 4 – Generic Drug Substitution Policies” in state DUR Reports, https://www.medicaid.gov/medicaid/prescription-drugs/drug-utilization-review/annual-reports/index.html. ↩︎
- Of the states that required more the restrictive requirements, a majority required preauthorization to enable a pharmacist to provide a brand drug when a generic was available. States included other requirements, such as requiring the submission of a MedWatch Form and requiring a medical reason to override the use of a generic, and some implement more than one restrictive requirement. Ibid. ↩︎
- “Medicine Use and Spending in the U.S: A Review of 2017 and Outlook to 2022,” IQVIA Institute for Human Data Science, April 2018, https://www.iqvia.com/-/media/iqvia/pdfs/institute-reports/medicine-use-and-spending-in-the-us-a-review-of-2017-and-outlook-to-2022.pdf?_=1542647406341, p. 7. ↩︎
- A manufacturer obtains FDA licensing for a biologic through a Biologics License Application (BLA) as opposed to an NDA or an ANDA. See Judith Johnson, “Biologics and Biosimilars: Background and Key Issues,” Congressional Research Services, Updated October 27, 2017, https://crsreports.congress.gov/product/pdf/R/R44620. ↩︎
- Ibid. ↩︎
- See Andrew Mulcahy, Zachary Predmore, and Soeren Mattke, “The Cost Savings Potential of Biosimilar Drugs in the United States,” (Rand Corporation, 2014), https://www.rand.org/content/dam/rand/pubs/perspectives/PE100/PE127/RAND_PE127.pdf. ↩︎
- Gifford, Ellis, Edwards, Lashbrook, Hinton, Antonisse, Rudowitz, op. cit. ↩︎
- Ibid. ↩︎
- “Insulin: A Lifesaving Drug Too Often Out of Reach,” op. cit. See also Ed Silverman, “Senators press insurers for reams of pricing and rebate info on insulin,” Stat News, November 21, 2018, https://www.statnews.com/pharmalot/2018/11/21/senators-insulin-letters-pricing-rebates/. ↩︎
- Silverman, 11/21/18, op. cit. ↩︎
- Young and Garfield, op. cit. ↩︎
- Jennifer Reck, “Oklahoma Signs the Nation’s First State Medicaid Value-Based Contracts for Rx Drugs,” September 25 2018, NASHP, https://nashp.org/oklahoma-signs-first-medicaid-value-based-contracts-for-rx-drugs/. ↩︎
- Carolyn Y. Johnson, “Louisiana adopts ‘Netflix’ model to pay for hepatitis C drugs,” Washington Post, January 10, 2019, https://www.washingtonpost.com/health/2019/01/10/louisiana-adopts-netflix-model-pay-hepatitis-c-drugs/?utm_term=.b962a75edc5d. ↩︎
- “Patient Affordability Value and Efficiency Act,” https://www.cassidy.senate.gov/imo/media/doc/PAVE%20Act.pdf. ↩︎
- Beginning in June 2017, the FDA has maintained a list of off-patent, off-exclusivity drugs lacking generic competition. Also in June 2017, the FDA announced it would expedite ANDA reviews until there were three generics on the market for a given brand. The agency is also intending on issuing guidance in the future addressing other activities that diminish generic competition. “FDA Tackles Drug Competition to Improve Patient Access,” FDA News Release, June 27, 2017, https://www.fda.gov/newsevents/newsroom/pressannouncements/ucm564725.htm and Henry Waxman, Bill Corr, Kristi Martin, Sophia Duong, “What Commissioner Gottlieb’s FDA is Doing to Lower Prescription Drug Prices and Steps Congress Can Take to Help,” April 2018, https://www.commonwealthfund.org/sites/default/files/documents/___media_files_publications_issue_brief_2018_apr_waxman_gottlieb_plan_fda_ib.pdf. ↩︎
- Aware of the importance of biologics when considering drug costs, the FDA released the “Biologics Action Plan” in July 2018, which includes items such as providing guidance to improve biosimilar labeling and to provide clarity for manufacturers to demonstrate interchangeability, as well as providing education to health care professionals to explain concepts such as biosimilars and interchangeability “Biosimilars Action Plan: Balancing Innovation and Competition,” FDA, July 2018. See also “FDA Releases Biosimilar Action Plan,” http://www.centerforbiosimilras.com/news/fda-releases-biosimilar-action-plan. ↩︎
- Zachary Brennan, “FDA Sets Record for Number of Generic Drug Approvals Again,” October 11, 2018, https://www.raps.org/news-and-articles/news-articles/2018/10/fda-sets-record-number-of-generic-drug-approvals-a. ↩︎
- Copyright 2018, Wolters Kluwer Clinical Drug Information, Inc. ↩︎
- “CDER List of Licensed Biological Products,” FDA, Center for Drug Evaluation and Research, accessed March 2018, http://www.fda.gov/Drugs/DevelopmentApprovalProcess/HowDrugsareDevelopedandApproved/ApprovalApplications/TherapeuticBiologicApplications/Biosimilars/ucm411418.htm “CBER List of Licensed Biological Products” FDA, Center for Biologics Evaluation and Research, accessed March 2018, http://www.fda.gov/Drugs/DevelopmentApprovalProcess/HowDrugsareDevelopedandApproved/ApprovalApplications/TherapeuticBi ologicApplications/Biosimilars/ucm411418.htm. ↩︎
- “State Drug Utilization Data (SDUD) FAQs,” CMS, https://www.medicaid.gov/medicaid/prescription-drugs/state-drug-utilization-data/state-drug-utilization-data-faq/index.html. ↩︎
- “States Collection of Medicaid Rebates for Physician Administered Drugs,” (Washington, DC, U.S. Department of Health and Human Services- Office of Inspector General, June 2011), http://oig.hhs.gov/oei/reports/oei-03-09-00410.pdf. ↩︎