The Rising Cost of Living Longer: Analysis of Medicare Spending by Age for Beneficiaries in Traditional Medicare
Introduction
A companion article to this report, entitled “Medicare Per Capita Spending By Age And Service: New Data Highlights Oldest Beneficiaries” has been published in the journal Health Affairs.
In the context of ongoing discussions about the federal budget and national debt, policymakers, experts, and the media have called attention to the nation’s growing aging population and the implications for Medicare and the federal budget. At the same time, geriatricians and other providers who care for older patients are giving greater attention to the question of how best to meet the needs of an aging population. Between 2010 and 2050, the United States population ages 65 and older will nearly double, the population ages 80 and older will nearly triple, and the number of nonagenarians and centenarians—people in their 90s and 100s—will quadruple.1 The aging of the population has important implications for future Medicare spending because beneficiaries ages 80 and older account for a disproportionate share of Medicare expenditures. According to the Congressional Budget Office, population aging is expected to account for a larger share of spending growth on the nation’s major health care programs through 2039 than either “excess spending growth” or subsidies for the coverage expansions provided under the Affordable Care Act.2
To inform discussions about Medicare’s role in providing coverage for an aging population and to assess the relationship between Medicare spending and advancing age, this report takes an in-depth look at patterns of Medicare spending by age, overall and by type of service.3 Using the most current Medicare spending data available for beneficiaries in traditional Medicare in 2011 and trends since 2000, the analysis explores the following questions:
- To what extent does Medicare per capita spending rise with age among beneficiaries in traditional Medicare, and at what age does per capita spending reach its peak before starting to decline?
- How does per capita spending for specific Medicare-covered services vary by age for beneficiaries in traditional Medicare over age 65, and how have these patterns changed over time?
- Has Medicare per capita spending for older beneficiaries (ages 80 and older) been increasing over time, after controlling for inflation?
- What is the pattern of per capita spending by age among decedents, and how does spending on decedents affect the pattern of per capita spending among traditional Medicare beneficiaries overall?
This analysis is based on data from a 5 percent sample of Medicare claims from the Chronic Conditions Data Warehouse (CCW) of the Centers for Medicare & Medicaid Services (CMS) from 2000 to 2011 (the most recent year available when this analysis was conducted) that includes all Medicare-covered claims for services covered under Parts A, B, and D. The analysis excludes beneficiaries who are age 65 because some of these beneficiaries are enrolled for less than a full year; therefore, a full year of Medicare spending data is not available for all people at this year of age. The analysis focuses on Medicare beneficiaries over age 65 rather than younger adults who qualify for Medicare because of a permanent disability to develop a better understanding of the relationship between Medicare spending and advancing age.
This study examines patterns of Medicare spending among beneficiaries in traditional Medicare rather than in Medicare Advantage plans because comparable data on Medicare spending by service are not available for this population (Medicare spending for Medicare Advantage enrollees takes the form of monthly capitation payments which are not based on actual service utilization4 ). Because we lack comparable data for the 25 percent of beneficiaries enrolled in Medicare Advantage in 2011, it is not possible to assess whether patterns of service use and spending in traditional Medicare apply to the Medicare population overall. More information about the data, methods, and limitations can be found in the Methodology.
Key Findings
Medicare Per Capita Spending By Age Among Traditional Medicare Beneficiaries Over Age 65 in 2011 and Trends, 2000-2011
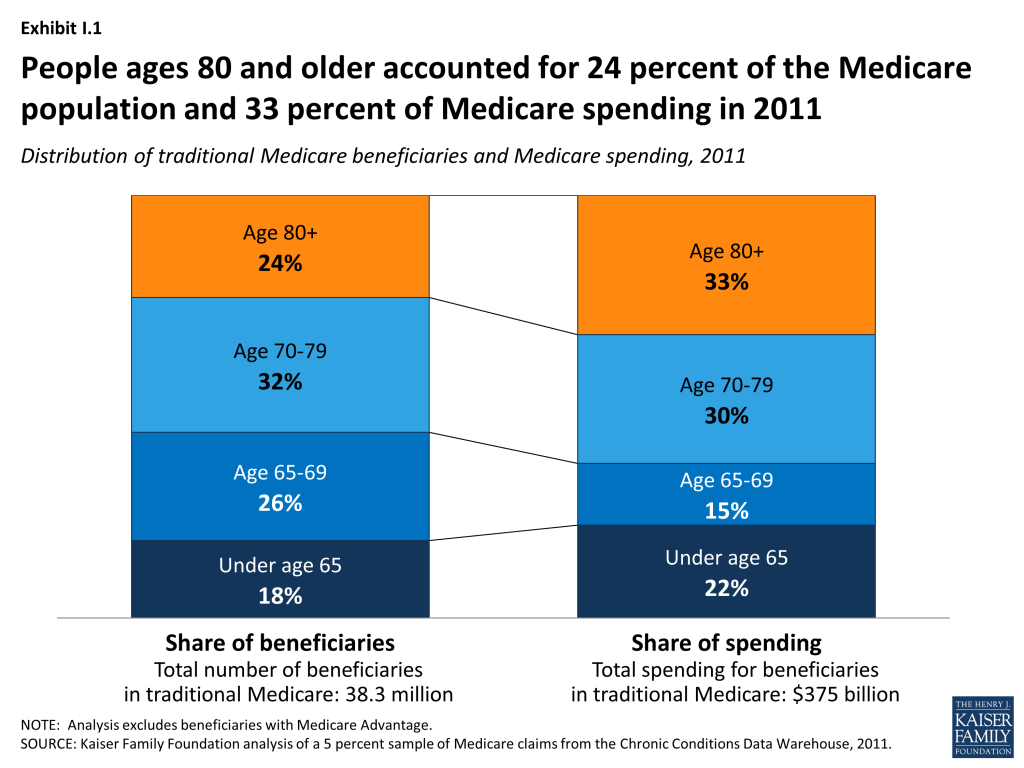
- Medicare’s octogenarians, nonagenarians, and centenarians account for a disproportionate share of Medicare spending. In 2011, beneficiaries ages 80 and older comprised 24 percent of the traditional Medicare population, but 33 percent of total Medicare spending on this population (Exhibit I.1). In contrast, beneficiaries between the ages of 65 and 69 comprised 26 percent of the traditional Medicare population, but just 15 percent of total Medicare spending.
- In 2011, overall Medicare per capita spending increased with age, peaked at age 96, and then declined gradually for the relatively small number of beneficiaries at older ages (Exhibit I.2). Average Medicare per capita spending in 2011 more than doubled between age 70 ($7,566) and age 96 ($16,145).
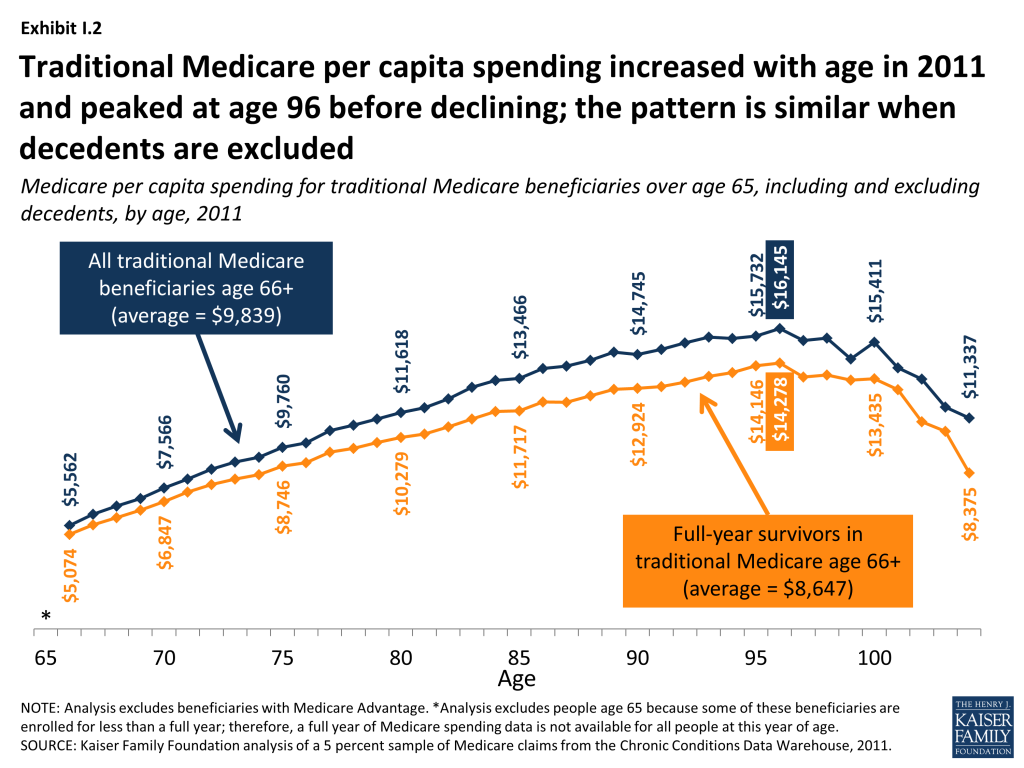
- The increase in Medicare per capita spending as beneficiaries age can be partially, but not completely, explained by the high cost of end-of-life care. Medicare per capita spending among survivors in 2011 (excluding beneficiaries who died during the year) also rises with age and peaks at age 96 ($14,278) before falling—but the averages are higher when decedents are included (Exhibit I.2).
- The pattern of Medicare per capita spending for beneficiaries who died in 2011 is markedly different; it declined steadily with age, falling from $43,000 among 70-year-olds to under $20,000 among centenarians. Yet because of higher death rates among older beneficiaries, average per capita spending among beneficiaries who die at older ages has a greater influence on the estimates of average spending among all beneficiaries at older ages.
- Between 2000 and 2011, Medicare per capita spending peaked at older ages, and was higher at the peak age in 2011 than in 2000, after controlling for inflation. Medicare per capita spending peaked at age 92 in 2000 ($9,557 in inflation-adjusted 2011 dollars), rising to age 96 by 2011 ($15,015 excluding Part D spending and $16,145 including Part D spending).
- Over time, the difference in Medicare per capita spending between beneficiaries ages 80 and older and younger beneficiaries has widened. In 2011, Medicare per capita spending was 2.5 times greater for 85-year-olds ($13,466) and 3 times greater for 95-year-olds ($15,732) than for 66-year-olds ($5,562).
- Between 2000 and 2011, Medicare per capita spending grew faster for beneficiaries ages 90 and older than for younger beneficiaries over age 65, both including and excluding spending on the Part D prescription drug benefit beginning in 2006. Including Part D spending, per capita spending grew at an average annual rate of 5.8 percent for beneficiaries ages 66 to 69 over these years, rising to 7.3 percent among beneficiaries ages 90 and older.
Patterns in Traditional Medicare Per Capita Spending for Selected Medicare-covered Services in 2011 and trends, 2000-2011
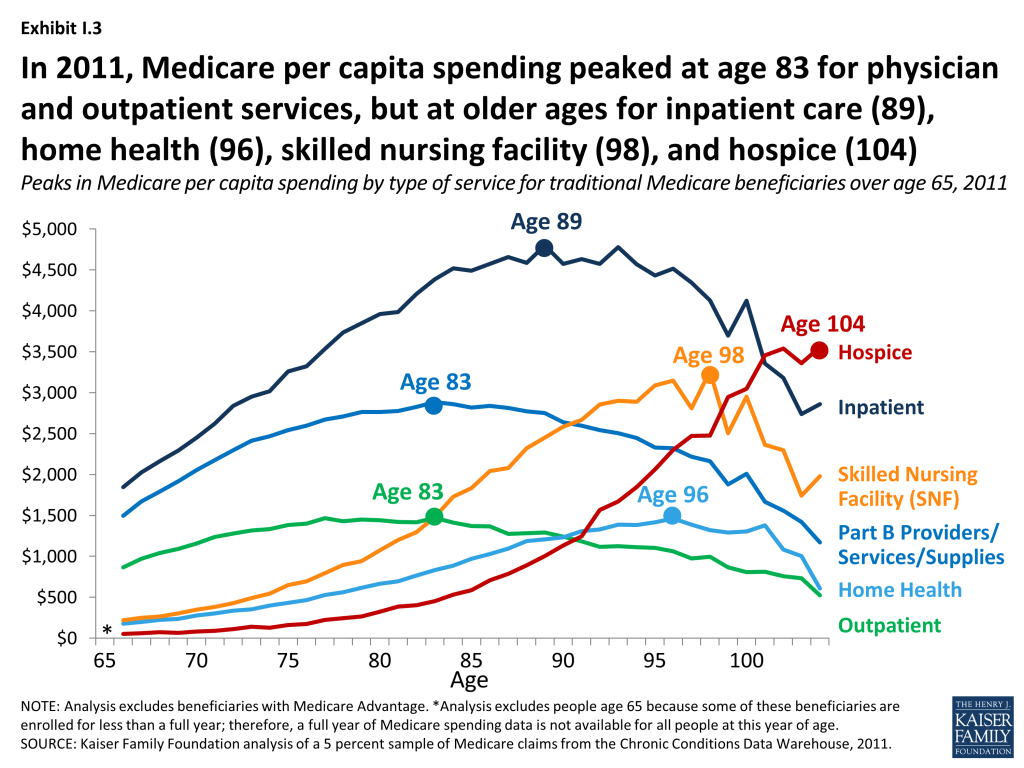
- The amount of average Medicare per capita spending on many Medicare-covered services in 2011 generally increased with age for beneficiaries in their 70s and 80s and then began to decline for older beneficiaries; the main exceptions were skilled nursing facility (SNF) and home health per capita spending, which increased for beneficiaries in their 90s before declining, and hospice spending which generally increased with age through the 90s and beyond (Exhibits I.2 and I.3). In contrast, per capita Part D drug spending was roughly constant among beneficiaries in their 60s, 70s, 80s, and 90s.
- In 2011, Medicare per capita spending on hospital inpatient services increased more than 2.5 times from $1,848 among 66-year-olds to $4,799 among 89-year-olds before declining among older beneficiaries. While per capita inpatient spending peaks at age 89, spending on inpatient care is relatively similar for beneficiaries between the ages of 84 and 97 (plateauing at around $4,500 per beneficiary).
- Despite a gradual reduction in Medicare per capita spending for Part B providers, services, and supplies for beneficiaries beginning in their mid to late 80s, per capita spending continues to climb into the mid-90s due to persistent levels of inpatient hospital spending and a sharp rise in skilled nursing facility and hospice spending in the late 80s and 90s. Between ages 86 and 96, Medicare per capita spending on skilled nursing facility services increased by more 50 percent (from $2,043 to $3,149) while per capita spending on hospice tripled (from $706 to $2,299).
- The relatively high per capita spending among beneficiaries in their mid-to late-90s in 2011 is influenced by skilled nursing facility (SNF), hospice, and (to a lesser extent) home health spending; excluding spending on these services, overall per capita spending peaks at age 89.
- Inpatient hospital care accounted for the largest share of per capita spending among traditional Medicare beneficiaries ages 66 and older in 2011, with the exception of centenarians for whom hospice spending comprised the largest share of their total Medicare per capita spending. As beneficiaries grow older, per capita spending on physician services accounts for a declining share of per capita costs.
Implications
This analysis shows Medicare per person spending rising steadily with age, more than doubling between ages 70 and 95 in 2011, and peaking at age 96, before declining for the relatively small number of beneficiaries at relatively older ages. The cost of care for Medicare beneficiaries who died in 2011 contributes to higher average per capita Medicare costs at all ages, but does not alter the pattern of per capita spending nor does it affect the peak age of Medicare spending in 2011. And over time, Medicare per capita spending has peaked at older ages, from age 92 in 2000 to age 96 in 2011, based on inflation-adjusted dollars.
As adults live into their 80s and beyond, they are more likely to live with multiple chronic conditions and functional limitations, and this combination (compared to having chronic conditions only) is associated with a greater likelihood of emergency department visits and inpatient hospitalizations as well as higher Medicare spending for inpatient hospital, skilled nursing facility, and home health services.5 Thus, it is not surprising that Medicare per capita spending is higher, on average, for older beneficiaries compared to those in their 60s and 70s. At the same time, the pattern of increasing per capita spending until beneficiaries are in their mid-90s raises questions as to whether beneficiaries are getting the appropriate mix of services as they age and whether more could be done to improve the management and delivery of medical care for aging Medicare beneficiaries.
The Affordable Care Act (ACA) launched several payment and delivery system reforms that could alter patterns of care and spending for people on Medicare. Several of these initiatives aim to maintain or improve the quality of patient care and lower costs by reducing unnecessary care, managing care for high-need, “at risk” patients, and treating beneficiaries in the most appropriate (least cost) setting.6 The ACA also included provisions that aim to reduce unnecessary, preventable hospitalizations, better manage transitions following hospitalizations, and improve care management for beneficiaries who are dually eligible for Medicare and Medicaid.7 Recently, the Centers for Medicare & Medicaid Services (CMS) announced it would provide payments to physicians who manage care for beneficiaries with two or more chronic conditions.8 These efforts potentially could lower costs and improve care for Medicare patients, including the oldest old.
Consistent with other studies documenting higher costs for patients at the end of life, this analysis shows that Medicare per capita spending was nearly 4-times greater among beneficiaries who died in 2011, on average, than among those who lived the entire year. Yet the analysis also shows that Medicare per capita spending among decedents declines with age, suggesting that patients, families, and providers may be opting for less intensive and less costly end-of-life interventions for beneficiaries as they grow older. This possibility is consistent with the finding that average per capita spending on hospice services among beneficiaries in traditional Medicare increases with age, due to both a larger share of beneficiaries electing hospice at older ages and higher per capita hospice costs for older than younger Medicare beneficiaries who elect hospice care.
As the U.S. population ages, the increase in the number of people on Medicare and the aging of the Medicare population are expected to increase both total and per capita Medicare spending. The increase in per capita spending by age not only affects Medicare, but other payers as well. In fact, other studies have documented increases in both Medicaid and out-of-pocket spending by age, primarily attributable to the cost of long-term services and supports that are not covered by Medicare.9 ,10 Further work is needed to better understand the social, medical, and long-term care needs of older Americans and how best to address those needs. Focusing on ways to improve the management and coordination of care for high-need, high-cost patients, many of whom are among Medicare’s oldest beneficiaries, will be essential to meet the needs of an aging population.
Report: Section 1: Medicare Per Capita Spending By Age Among Traditional Medicare Beneficiaries Over Age 65, 2011 And Trends, 2000-2011
- Between 2010 and 2050, the population ages 65 and older will double, from about 40 million to 84 million people. The number of octogenarians (people ages 80 and older) will nearly triple over these years from about 11 million to about 31 million, while the number of nonagenarians and centenarians (those in their 90s and 100s) is projected to quadruple from 2 million to 8 million by 2050. 1
- Medicare’s octogenarians, nonagenarians, and centenarians account for a disproportionate share of Medicare spending. In 2011, beneficiaries ages 80 and older comprised 24 percent of the Medicare population but 33 percent of total Medicare spending. In contrast, beneficiaries between the ages of 65 and 69 comprised 26 percent of the Medicare population, but just 15 percent of total Medicare spending.11 2
- Among Medicare beneficiaries over age 65, Medicare per capita spending rises gradually with age and peaks at age 96, before declining. In 2011, average per capita Medicare spending nearly tripled between age 66 ($5,562) and age 96 ($16,145), and then fell gradually for the relatively small number of seniors who lived to older ages.12 3
- Medicare per capita spending rises with age, even when the analysis excludes all beneficiaries who died during the year. Medicare per capita spending among Medicare beneficiaries over age 65 who survived the full year in 2011 (excluding decedents) also rises with age and peaks at age 96 ($14,278). 4
- The increase in Medicare per capita spending by age for all Medicare beneficiaries over age 65 is not entirely attributable to end-of-life care nor to higher death rates among older beneficiaries. Medicare per capita spending is considerably higher for people who die during the year than people who survive the entire year ($33,486 versus $8,647 in 2011) and accounts for a disproportionate share of Medicare spending, yet the increase in spending by age is not entirely due to higher spending at the end of life.13 ,14 In fact, Medicare spending for beneficiaries who died during the year declined steadily with age in 2011, from a high of about $43,000 among 70-year-old decedents, to about $20,000 among centenarians who died that year.15 5 The decline in Medicare per capita spending by age among beneficiaries who died during 2011 is largely attributable to a decline in inpatient spending (see Section 2, Exhibits 2.12 and 2.13 and Table 2 for details on spending by type of service among decedents). Yet because of higher death rates among older beneficiaries (rising from 2 percent of 70-year-olds to 13 percent of 90-year-olds and 29 percent of 100-year-olds), average per capita spending among beneficiaries who die at older ages has a greater influence on the estimates of average spending among beneficiaries overall at older ages.16
- Between 2000 and 2011, the age at which Medicare per capita spending reached its peak increased from age 92 to age 96. At all ages, Medicare per capita spending was higher in 2011 than in 2000, including adjustments for inflation and the introduction of the Part D prescription drug benefit. In 2000, Medicare per capita spending peaked at $9,557 (in 2011 dollars) at age 92, while in 2011, Medicare per capita spending peaked at $16,145 (including Part D spending; $15,015 excluding Part D spending) at age 96. 6
- The difference in Medicare per capita spending between beneficiaries ages 80 and older and younger beneficiaries over age 65 has grown wider over time. For example, in 2011, Medicare per capita spending was 2.5 times greater for 85-year-olds ($13,466) and 3 times greater for 95-year-olds ($15,732) than for 66-year-olds ($5,562). These ratios have increased since 2000, when Medicare per capita spending was 2.3 times greater both for 85-year-olds ($8,959) and for 95-year-olds ($9,139) than for 66-year-olds ($3,908). 7
- Medicare per capita spending grew faster for beneficiaries ages 90 and older than for younger beneficiaries over age 65 between 2000 and 2011. When spending on the Part D drug benefit is included beginning in 2006, per capita spending grew at an average annual rate of 5.8 percent for beneficiaries ages 66 to 69 between 2000 and 2011, rising to 7.3 percent among beneficiaries ages 90 and older. (When Part D spending is excluded, the average annual growth rates are somewhat lower for each age group but the trend by age is similar.) 8 During this period, Medicare per capita spending for beneficiaries ages 90 and older increased from $8,546 in 2000 (in 2011 dollars) to $14,217 in 2011 (including Part D spending), an increase of 66 percent over these years. This increase was greater than the 43 percent increase among beneficiaries in their 70s and the 51 percent increase among those in their 80s.9
Report: Section 2: Patterns In Traditional Medicare Per Capita Spending For Selected Medicare-covered Services In 2011 And Trends, 2000-2011
- Medicare per capita spending for various Medicare-covered services peaked at different ages in 2011. For example, Medicare per capita spending for inpatient care peaked at age 89, while per capita spending for both Part B providers/services/supplies and hospital outpatient services peaked at age 83. For skilled nursing facility, home health, and hospice services, spending reached its highest level among the oldest old beneficiaries: ages 98, 96, and 104, respectively. 1
- The relatively high per capita spending among beneficiaries in their mid-to late-90s in 2011 is influenced by skilled nursing facility (SNF), hospice, and (to a lesser extent) home health spending; excluding spending on these services, overall per capita spending peaks at age 89.
- The amount of average Medicare per capita spending on most types of services generally rises and then falls with age, with the exception of hospice spending, which peaks among the oldest beneficiaries, and Part D prescription drug spending which is roughly similar among beneficiaries at different ages. 2 For example, in 2011:
- Medicare per capita spending for inpatient hospital care increased more than 2.5 times from a low of $1,848 among 66-year-olds to a high of $4,799 among 89-year-olds, and then decreased somewhat to $4,432 for 95-year-olds and $4,122 for 100-year-olds. While inpatient spending peaked at age 89 in 2011, spending on inpatient care was relatively similar for beneficiaries between the ages of 84 and 97 (plateauing at around $4,500).
- Medicare per capita spending for Part B providers, services, and supplies roughly doubled from $1,368 at age 66 to a high of $2,670 at age 83, before declining.
- Despite a gradual reduction in Medicare per capita spending for Part B providers, services, and supplies for beneficiaries beginning in their mid to late 80s, per capita spending continues to climb into the mid-90s due to persistent levels of inpatient hospital spending and a sharp rise in skilled nursing facility and hospice spending in the late 80s and 90s.
- Between ages 86 and 96, Medicare per capita spending on skilled nursing facility services increased by more 50 percent (from $2,043 to $3,149) while per capita spending on hospice tripled (from $706 to $2,299).
- The increase in Medicare per capita spending on skilled nursing facility, home health, and hospice services at older ages is attributable to both a larger share of older beneficiaries using these services compared to younger beneficiaries and higher per capita costs for older users of these services compared to younger users.
- The distribution of Medicare per capita spending on different types of Medicare-covered service varied by age in 2011. 3
- Inpatient hospital spending was the largest component of total Medicare per capita spending for beneficiaries at all ages over age 65 in 2011, except for centenarians, for whom hospice spending comprised the largest share of total per capita spending.
- Between the ages of 70 and 95, Medicare spending on Part B providers/services/supplies declined as a share of total per capita spending from 27 percent to 15 percent, while spending on skilled nursing facility services quadrupled as a share of total per capita spending, rising from 5 percent at age 70 to 20 percent at age 95. Between ages 70 and 95, spending on home health services doubled as a share of total per capita spending, from 4 percent to 9 percent, and spending on hospice services increased from 1 percent of total per capita spending at age 70 to 13 percent at age 95.
- Between 2000 and 2011, Medicare per capita spending increased with age, both overall and by type of service. For example:
- In both 2000 and 2011, Medicare per capita spending for inpatient hospital care increased with age, peaking for beneficiaries in their late 80s and early 90s. The per capita spending increase between 2000 and 2011 for inpatient care was relatively modest for most beneficiaries over age 65 compared to the increase in per capita spending for other types of services, except for the centenarians who account for a very small share of the population (~200,000 beneficiaries). 4
- The spending pattern for Medicare per capita spending for Part B providers, services, and supplies in 2011 is similar to what it was in 2000—increasing with age and peaking for beneficiaries in their early 80s. Medicare per capita spending on Part B providers, services, and supplies was about 30 percent higher in 2011 than in 2000 for beneficiaries at all ages, after adjusting for inflation. 5
- Medicare per capita spending on hospital outpatient services more than doubled at all ages between 2000 and 2011, after controlling for inflation. In both 2000 and 2011, Medicare per capita spending on hospital outpatient services peaked for beneficiaries in their late 70s and early 80s, but was considerably higher at all ages in 2011 than in 2000. 6
- In 2011, Medicare per capita spending on skilled nursing facility, home health, and hospice services increased at older ages, and the increase in per capita spending on these services by age was somewhat steeper in 2011 than in 2000. For example, in 2011, between ages 85 and 95, Medicare per capita spending increased from $1,832 to $3,088 for skilled nursing facility services, from $969 to $1,415 for home health services, and from $588 to $2,063 for hospice care. After controlling for inflation, Medicare per capita spending on skilled nursing facility services for 95-year-olds was about two times greater in 2011 than in 2000 ($3,088 versus $1,576), about two times greater for home health services ($1,415 versus $721), and nearly five times greater for hospice care in 2011 than in 2000 ($2,063 versus $414). 7 8 9
- In both 2000 and 2011, Medicare per capita spending for Part B drugs reached its peak for beneficiaries in their late 70s and early 80s, before declining. Per capita spending on Part B drugs was 50 percent higher or more at all ages in 2011 than in 2000, after controlling for inflation. 10
- In contrast to other services where Medicare per capita spending in 2011 increased fairly steadily with age, Medicare per capita spending on prescription drugs covered under Part D was relatively constant across different years of age, but dropped off sharply for beneficiaries beginning at around age 100. (Trend data for 2000 is not available because the Part D benefit started in 2006.) 11
- The decline in Medicare per capita spending by age among beneficiaries who died during 2011 is largely attributable to a decline in inpatient spending. For example, Medicare per capita spending on inpatient services among beneficiaries who died in 2011 was $24,508 for 70-year-olds but $11,446 among 9o-year-olds. Among beneficiaries over age 65 who died in 2011, Medicare per capita spending for hospice care increased gradually with age, and accounted for a larger share of Medicare per capita spending at older ages; per capita hospice spending was $2,252 for decedents age 70 and $3,821 for decedents age 90. 12 13
Tricia Neuman and Juliette Cubanski are with the Kaiser Family Foundation; Jennifer Huang was formerly with the Foundation. Anthony Damico is an independent consultant.
Methodology
Description of the data. This analysis is based on data from a random 5 percent sample of Medicare beneficiaries from the Chronic Condition Data Warehouse (CCW) of the Centers for Medicare & Medicaid Services (CMS) from 2000 to 2011. The CCW includes Medicare administrative enrollment for all Medicare beneficiaries and claims data for beneficiaries enrolled in traditional Medicare; encounter data is not available for beneficiaries enrolled in Medicare Advantage plans. The CCW also contains all Part D events (prescription drug fill records) from the start of the Part D benefit in 2006, regardless of whether the beneficiary was enrolled in a Medicare Advantage plan or a stand-alone prescription drug plan. This analysis is based on data from the Cost and Use segment of the CCW, which contains summarized patient-level utilization information, by care setting for the calendar year of the data file. It also includes Medicare and beneficiary payment information overall and by setting. The following types of services and settings are included in this file: hospital outpatient, acute inpatient, non-acute inpatient, skilled nursing facility, hospice, home health, physician office services, ambulatory surgery center, evaluation and management, anesthesia, dialysis, imaging, tests, durable medical equipment, Part B drugs, other Part B procedures, other Part B claims, and Part D drugs.
Sample. The analysis focuses on beneficiaries over age 65 in traditional Medicare, excluding beneficiaries enrolled in Medicare Advantage and those who are under age 65. Beneficiaries age 65 were excluded from the analysis of per capita spending because the analysis is based on a comparison of full-year per capita Medicare spending at each age and many beneficiaries age 65 are enrolled in Medicare for less than a full year, depending on their month of enrollment in Medicare; therefore a full year of Medicare spending data is not available for all people at this age. The number of unweighted cases in 2011 declined from 96,517 66-year-olds (weighted n = 1,930,340) to 245 104-year-olds (weighted n = 4,900). The analysis excludes spending for beneficiaries enrolled in Medicare Advantage plans because Medicare spending on this population takes the form of a monthly capitation payment to private plans and is not based on actual service utilization. The analysis excludes spending for beneficiaries under age 65 who qualify for Medicare because of a permanent disability because this analysis is focused on spending patterns by age among older beneficiaries.
Methods. For this analysis, we calculated Medicare per capita spending for beneficiaries at each year of age overall and by type of service. Age was determined as of December 31 in each year of the analysis (2000-2011). If the beneficiary died, the age was determined based on age at the time of death. We aggregated spending on certain types of services into larger categories. Spending on Part B providers/services/supplies includes all spending on Part B physician services, other Part B carriers, durable medical equipment, tests, imaging, other procedures, dialysis, anesthesia, evaluation and management, and ambulatory surgery center services. Spending on hospital inpatient services includes acute inpatient care and other non-acute inpatient services. When we refer to post-acute care, we are referring to skilled nursing facility and home health services.
To adjust Medicare per capita spending estimates for the years 2000 to 2010 to 2011 dollars, we used the Bureau of Labor Statistics’ Consumer Price Index (CPI) Inflation calculator.17 The CPI inflation calculator uses the average Consumer Price Index for a given calendar year. These data represent changes in prices of all goods and services purchased for consumption by urban households.
Limitations. This study describes but does not explain the pattern of Medicare per capita spending by age, and is not designed to assess factors related to the recent slow growth in total and per capita Medicare spending. Because the 5 percent sample includes Medicare spending but not spending among other payers, this analysis does not examine how Medicaid and other payers’ spending varies by age, in relation to Medicare spending. The 5 percent sample does not include patient characteristics, such as functional impairment, so the analysis does not control for covariates that could help explain patterns in spending and service use.
Our results reflect patterns of spending among traditional Medicare beneficiaries, but not the total Medicare population. Because we lack comparable data for the 25 percent of beneficiaries enrolled in Medicare Advantage in 2011, it is not possible to assess whether patterns of service use and spending in traditional Medicare apply to the Medicare population overall.
Appendix Tables
| Table 1: Number of Traditional Medicare Beneficiaries over Age 65,Overall and for Survivors and Decedents, by Age, 2011 | ||||||
| Overall | Survivors | Decedents | ||||
| AGE | Unweighted | Weighted | Unweighted | Weighted | Unweighted | Weighted |
| All 66+ | 1,439,676 | 28,793,520 | 1,370,351 | 27,407,020 | 69,325 | 1,386,500 |
| 66 | 96,517 | 1,930,340 | 95,109 | 1,902,180 | 1,408 | 28,160 |
| 67 | 93,560 | 1,871,200 | 92,080 | 1,841,600 | 1,480 | 29,600 |
| 68 | 93,353 | 1,867,060 | 91,694 | 1,833,880 | 1,659 | 33,180 |
| 69 | 88,334 | 1,766,680 | 86,847 | 1,736,940 | 1,487 | 29,740 |
| 70 | 77,273 | 1,545,460 | 75,733 | 1,514,660 | 1,540 | 30,800 |
| 71 | 71,692 | 1,433,840 | 70,208 | 1,404,160 | 1,484 | 29,680 |
| 72 | 67,395 | 1,347,900 | 65,707 | 1,314,140 | 1,688 | 33,760 |
| 73 | 66,584 | 1,331,680 | 64,726 | 1,294,520 | 1,858 | 37,160 |
| 74 | 61,984 | 1,239,680 | 60,292 | 1,205,840 | 1,692 | 33,840 |
| 75 | 58,943 | 1,178,860 | 57,053 | 1,141,060 | 1,890 | 37,800 |
| 76 | 56,197 | 1,123,940 | 54,233 | 1,084,660 | 1,964 | 39,280 |
| 77 | 53,008 | 1,060,160 | 51,061 | 1,021,220 | 1,947 | 38,940 |
| 78 | 49,220 | 984,400 | 47,134 | 942,680 | 2,086 | 41,720 |
| 79 | 48,423 | 968,460 | 46,152 | 923,040 | 2,271 | 45,420 |
| 80 | 46,595 | 931,900 | 44,149 | 882,980 | 2,446 | 48,920 |
| 81 | 46,054 | 921,080 | 43,404 | 868,080 | 2,650 | 53,000 |
| 82 | 42,425 | 848,500 | 39,803 | 796,060 | 2,622 | 52,440 |
| 83 | 40,799 | 815,980 | 37,914 | 758,280 | 2,885 | 57,700 |
| 84 | 39,115 | 782,300 | 36,185 | 723,700 | 2,930 | 58,600 |
| 85 | 35,526 | 710,520 | 32,525 | 650,500 | 3,001 | 60,020 |
| 86 | 32,763 | 655,260 | 29,627 | 592,540 | 3,136 | 62,720 |
| 87 | 30,218 | 604,360 | 27,145 | 542,900 | 3,073 | 61,460 |
| 88 | 26,613 | 532,260 | 23,644 | 472,880 | 2,969 | 59,380 |
| 89 | 23,587 | 471,740 | 20,676 | 413,520 | 2,911 | 58,220 |
| 90 | 20,870 | 417,400 | 18,108 | 362,160 | 2,762 | 55,240 |
| 91 | 17,094 | 341,880 | 14,538 | 290,760 | 2,556 | 51,120 |
| 92 | 13,071 | 261,420 | 10,959 | 219,180 | 2,112 | 42,240 |
| 93 | 11,084 | 221,680 | 9,159 | 183,180 | 1,925 | 38,500 |
| 94 | 8,472 | 169,440 | 6,879 | 137,580 | 1,593 | 31,860 |
| 95 | 6,512 | 130,240 | 5,196 | 103,920 | 1,316 | 26,320 |
| 96 | 4,941 | 98,820 | 3,871 | 77,420 | 1,070 | 21,400 |
| 97 | 3,688 | 73,760 | 2,809 | 56,180 | 879 | 17,580 |
| 98 | 2,651 | 53,020 | 2,026 | 40,520 | 625 | 12,500 |
| 99 | 1,903 | 38,060 | 1,386 | 27,720 | 517 | 10,340 |
| 100 | 1,198 | 23,960 | 854 | 17,080 | 344 | 6,880 |
| 101 | 819 | 16,380 | 608 | 12,160 | 211 | 4,220 |
| 102 | 557 | 11,140 | 399 | 7,980 | 158 | 3,160 |
| 103 | 393 | 7,860 | 279 | 5,580 | 114 | 2,280 |
| 104 | 245 | 4,900 | 179 | 3,580 | 66 | 1,320 |
| NOTE: Analysis includes beneficiaries in traditional Medicare only (excludes beneficiaries with Medicare Advantage).SOURCE: Kaiser Family Foundation analysis of a 5 percent sample of Medicare claims from the CMS Chronic Conditions Data Warehouse, 2011. | ||||||
| Table 2: Amount and Distribution of Medicare Per Capita Spending Overall and By Type of Servicefor Traditional Medicare Beneficiaries over Age 65, by Age, 2011 | ||||||||||||||||
| TOTAL PER CAPITA | Inpatient hospital | Outpatient hospital | Part B providers/ services/ supplies | Part B and D prescription drugs | Skilled nursing facility | Home health | Hospice | |||||||||
| AGE | $ | % | $ | % | $ | % | $ | % | $ | % | $ | % | $ | % | $ | % |
| All 66+ | $9,839 | 100% | $3,230 | 33% | $1,239 | 13% | $2,336 | 24% | $1,255 | 13% | $911 | 9% | $538 | 5% | $331 | 3% |
| 66 | 5,562 | 100 | 1,848 | 33 | 868 | 16 | 1,494 | 27 | 903 | 16 | 219 | 4 | 176 | 3 | 53 | 1 |
| 67 | 6,163 | 100 | 2,025 | 33 | 972 | 16 | 1,671 | 27 | 989 | 16 | 247 | 4 | 199 | 3 | 60 | 1 |
| 68 | 6,605 | 100 | 2,163 | 33 | 1,043 | 16 | 1,794 | 27 | 1,047 | 16 | 264 | 4 | 222 | 3 | 72 | 1 |
| 69 | 6,998 | 100 | 2,292 | 33 | 1,093 | 16 | 1,919 | 27 | 1,088 | 16 | 304 | 4 | 236 | 3 | 67 | 1 |
| 70 | 7,566 | 100 | 2,450 | 32 | 1,159 | 15 | 2,054 | 27 | 1,191 | 16 | 349 | 5 | 279 | 4 | 84 | 1 |
| 71 | 8,046 | 100 | 2,623 | 33 | 1,239 | 15 | 2,177 | 27 | 1,232 | 15 | 383 | 5 | 302 | 4 | 89 | 1 |
| 72 | 8,577 | 100 | 2,841 | 33 | 1,279 | 15 | 2,296 | 27 | 1,290 | 15 | 428 | 5 | 335 | 4 | 109 | 1 |
| 73 | 8,963 | 100 | 2,951 | 33 | 1,316 | 15 | 2,415 | 27 | 1,297 | 14 | 490 | 5 | 355 | 4 | 139 | 2 |
| 74 | 9,217 | 100 | 3,019 | 33 | 1,333 | 14 | 2,467 | 27 | 1,329 | 14 | 543 | 6 | 399 | 4 | 126 | 1 |
| 75 | 9,760 | 100 | 3,259 | 33 | 1,382 | 14 | 2,543 | 26 | 1,333 | 14 | 648 | 7 | 432 | 4 | 162 | 2 |
| 76 | 9,993 | 100 | 3,321 | 33 | 1,398 | 14 | 2,596 | 26 | 1,344 | 13 | 695 | 7 | 465 | 5 | 173 | 2 |
| 77 | 10,656 | 100 | 3,536 | 33 | 1,465 | 14 | 2,673 | 25 | 1,437 | 13 | 796 | 7 | 526 | 5 | 223 | 2 |
| 78 | 10,951 | 100 | 3,734 | 34 | 1,429 | 13 | 2,711 | 25 | 1,376 | 13 | 896 | 8 | 562 | 5 | 244 | 2 |
| 79 | 11,282 | 100 | 3,850 | 34 | 1,449 | 13 | 2,763 | 24 | 1,399 | 12 | 941 | 8 | 614 | 5 | 266 | 2 |
| 80 | 11,618 | 100 | 3,962 | 34 | 1,440 | 12 | 2,763 | 24 | 1,394 | 12 | 1,073 | 9 | 664 | 6 | 322 | 3 |
| 81 | 11,883 | 100 | 3,985 | 34 | 1,420 | 12 | 2,776 | 23 | 1,420 | 12 | 1,198 | 10 | 697 | 6 | 388 | 3 |
| 82 | 12,358 | 100 | 4,208 | 34 | 1,419 | 11 | 2,825 | 23 | 1,441 | 12 | 1,297 | 10 | 766 | 6 | 402 | 3 |
| 83 | 12,978 | 100 | 4,388 | 34 | 1,469 | 11 | 2,884 | 22 | 1,467 | 11 | 1,483 | 11 | 832 | 6 | 455 | 4 |
| 84 | 13,353 | 100 | 4,521 | 34 | 1,414 | 11 | 2,860 | 21 | 1,413 | 11 | 1,730 | 13 | 885 | 7 | 530 | 4 |
| 85 | 13,466 | 100 | 4,490 | 33 | 1,372 | 10 | 2,818 | 21 | 1,396 | 10 | 1,832 | 14 | 969 | 7 | 588 | 4 |
| 86 | 13,987 | 100 | 4,575 | 33 | 1,365 | 10 | 2,838 | 20 | 1,430 | 10 | 2,043 | 15 | 1,030 | 7 | 706 | 5 |
| 87 | 14,116 | 100 | 4,657 | 33 | 1,276 | 9 | 2,815 | 20 | 1,408 | 10 | 2,078 | 15 | 1,096 | 8 | 785 | 6 |
| 88 | 14,423 | 100 | 4,585 | 32 | 1,281 | 9 | 2,773 | 19 | 1,386 | 10 | 2,320 | 16 | 1,188 | 8 | 891 | 6 |
| 89 | 14,881 | 100 | 4,799 | 32 | 1,290 | 9 | 2,752 | 18 | 1,374 | 9 | 2,451 | 16 | 1,209 | 8 | 1,005 | 7 |
| 90 | 14,745 | 100 | 4,573 | 31 | 1,242 | 8 | 2,640 | 18 | 1,344 | 9 | 2,583 | 18 | 1,233 | 8 | 1,132 | 8 |
| 91 | 15,011 | 100 | 4,633 | 31 | 1,183 | 8 | 2,599 | 17 | 1,376 | 9 | 2,667 | 18 | 1,307 | 9 | 1,246 | 8 |
| 92 | 15,361 | 100 | 4,575 | 30 | 1,117 | 7 | 2,542 | 17 | 1,375 | 9 | 2,857 | 19 | 1,329 | 9 | 1,567 | 10 |
| 93 | 15,682 | 100 | 4,778 | 30 | 1,126 | 7 | 2,505 | 16 | 1,313 | 8 | 2,900 | 18 | 1,389 | 9 | 1,671 | 11 |
| 94 | 15,602 | 100 | 4,571 | 29 | 1,111 | 7 | 2,446 | 16 | 1,353 | 9 | 2,890 | 19 | 1,384 | 9 | 1,847 | 12 |
| 95 | 15,732 | 100 | 4,432 | 28 | 1,104 | 7 | 2,329 | 15 | 1,302 | 8 | 3,088 | 20 | 1,415 | 9 | 2,063 | 13 |
| 96 | 16,145 | 100 | 4,514 | 28 | 1,062 | 7 | 2,322 | 14 | 1,337 | 8 | 3,149 | 20 | 1,462 | 9 | 2,299 | 14 |
| 97 | 15,490 | 100 | 4,346 | 28 | 976 | 6 | 2,218 | 14 | 1,279 | 8 | 2,809 | 18 | 1,387 | 9 | 2,474 | 16 |
| 98 | 15,620 | 100 | 4,129 | 26 | 995 | 6 | 2,165 | 14 | 1,270 | 8 | 3,263 | 21 | 1,321 | 8 | 2,477 | 16 |
| 99 | 14,497 | 100 | 3,697 | 26 | 864 | 6 | 1,881 | 13 | 1,312 | 9 | 2,506 | 17 | 1,291 | 9 | 2,947 | 20 |
| 100 | 15,411 | 100 | 4,122 | 27 | 808 | 5 | 2,007 | 13 | 1,168 | 8 | 2,953 | 19 | 1,304 | 8 | 3,049 | 20 |
| 101 | 14,034 | 100 | 3,358 | 24 | 814 | 6 | 1,667 | 12 | 994 | 7 | 2,363 | 17 | 1,381 | 10 | 3,458 | 25 |
| 102 | 13,427 | 100 | 3,181 | 24 | 758 | 6 | 1,559 | 12 | 1,009 | 8 | 2,298 | 17 | 1,081 | 8 | 3,541 | 26 |
| 103 | 11,919 | 100 | 2,741 | 23 | 732 | 6 | 1,421 | 12 | 914 | 8 | 1,744 | 15 | 1,005 | 8 | 3,362 | 28 |
| 104 | 11,337 | 100 | 2,861 | 25 | 526 | 5 | 1,171 | 10 | 630 | 6 | 1,982 | 17 | 610 | 5 | 3,558 | 31 |
| NOTE: Analysis includes beneficiaries in traditional Medicare only (excludes beneficiaries with Medicare Advantage).SOURCE: Kaiser Family Foundation analysis of a 5 percent sample of Medicare claims from the CMS Chronic Conditions Data Warehouse, 2011. | ||||||||||||||||
| Table 3: Amount and Distribution of Medicare Per Capita Spending Overall and By Type of Servicefor Decedents in Traditional Medicare over Age 65, by Age, 2011 | ||||||||||||||||
| TOTAL PER CAPITA | Inpatient hospital | Outpatient hospital | Part B providers/ services/ supplies | Part B and D prescription drugs | Skilled nursing facility | Home health | Hospice | |||||||||
| AGE | $ | % | $ | % | $ | % | $ | % | $ | % | $ | % | $ | % | $ | % |
| All 66+ | $33,486 | 100% | $16,998 | 51% | $1,998 | 6% | $4,485 | 13% | $1,582 | 5% | $3,944 | 12% | $1,245 | 4% | $3,235 | 10% |
| 66 | 38,529 | 100 | 22,209 | 58 | 3,134 | 8 | 5,686 | 15 | 2,356 | 6 | 2,051 | 5 | 1,086 | 3 | 2,007 | 5 |
| 67 | 42,136 | 100 | 24,748 | 59 | 3,435 | 8 | 6,137 | 15 | 2,500 | 6 | 2,223 | 5 | 920 | 2 | 2,172 | 5 |
| 68 | 41,462 | 100 | 23,920 | 58 | 3,308 | 8 | 5,981 | 14 | 2,648 | 6 | 2,328 | 6 | 987 | 2 | 2,290 | 6 |
| 69 | 42,564 | 100 | 24,651 | 58 | 3,822 | 9 | 6,028 | 14 | 2,285 | 5 | 2,547 | 6 | 1,057 | 2 | 2,173 | 5 |
| 70 | 42,933 | 100 | 24,508 | 57 | 3,426 | 8 | 6,173 | 14 | 2,728 | 6 | 2,711 | 6 | 1,135 | 3 | 2,252 | 5 |
| 71 | 41,226 | 100 | 23,471 | 57 | 3,118 | 8 | 6,132 | 15 | 2,763 | 7 | 2,576 | 6 | 1,030 | 2 | 2,135 | 5 |
| 72 | 40,382 | 100 | 23,336 | 58 | 2,922 | 7 | 5,918 | 15 | 2,380 | 6 | 2,604 | 6 | 1,013 | 3 | 2,208 | 5 |
| 73 | 40,506 | 100 | 22,793 | 56 | 3,056 | 8 | 5,926 | 15 | 2,185 | 5 | 2,994 | 7 | 1,144 | 3 | 2,408 | 6 |
| 74 | 42,077 | 100 | 22,898 | 54 | 3,017 | 7 | 6,207 | 15 | 2,307 | 5 | 3,650 | 9 | 1,250 | 3 | 2,748 | 7 |
| 75 | 40,372 | 100 | 22,410 | 56 | 2,916 | 7 | 5,627 | 14 | 2,031 | 5 | 3,439 | 9 | 1,232 | 3 | 2,717 | 7 |
| 76 | 39,242 | 100 | 21,375 | 54 | 2,640 | 7 | 5,687 | 14 | 2,220 | 6 | 3,364 | 9 | 1,101 | 3 | 2,855 | 7 |
| 77 | 41,141 | 100 | 22,296 | 54 | 2,713 | 7 | 5,833 | 14 | 2,292 | 6 | 3,756 | 9 | 1,404 | 3 | 2,847 | 7 |
| 78 | 39,344 | 100 | 21,153 | 54 | 2,558 | 7 | 5,532 | 14 | 1,907 | 5 | 4,105 | 10 | 1,214 | 3 | 2,877 | 7 |
| 79 | 36,959 | 100 | 19,919 | 54 | 2,382 | 6 | 5,070 | 14 | 1,867 | 5 | 3,642 | 10 | 1,309 | 4 | 2,771 | 7 |
| 80 | 35,794 | 100 | 19,075 | 53 | 2,126 | 6 | 4,930 | 14 | 1,612 | 5 | 3,773 | 11 | 1,317 | 4 | 2,960 | 8 |
| 81 | 35,092 | 100 | 18,059 | 51 | 2,025 | 6 | 4,829 | 14 | 1,629 | 5 | 4,002 | 11 | 1,406 | 4 | 3,142 | 9 |
| 82 | 35,025 | 100 | 18,444 | 53 | 1,965 | 6 | 4,696 | 13 | 1,353 | 4 | 4,230 | 12 | 1,216 | 3 | 3,120 | 9 |
| 83 | 35,256 | 100 | 18,326 | 52 | 2,002 | 6 | 4,660 | 13 | 1,445 | 4 | 4,550 | 13 | 1,280 | 4 | 2,992 | 8 |
| 84 | 34,051 | 100 | 17,016 | 50 | 1,861 | 5 | 4,513 | 13 | 1,390 | 4 | 4,772 | 14 | 1,367 | 4 | 3,131 | 9 |
| 85 | 32,431 | 100 | 15,958 | 49 | 1,626 | 5 | 4,201 | 13 | 1,243 | 4 | 4,668 | 14 | 1,373 | 4 | 3,361 | 10 |
| 86 | 30,994 | 100 | 14,826 | 48 | 1,419 | 5 | 4,032 | 13 | 1,124 | 4 | 4,678 | 15 | 1,341 | 4 | 3,575 | 12 |
| 87 | 31,306 | 100 | 14,753 | 47 | 1,487 | 5 | 4,034 | 13 | 1,280 | 4 | 4,809 | 15 | 1,342 | 4 | 3,602 | 12 |
| 88 | 29,486 | 100 | 13,680 | 46 | 1,312 | 4 | 3,718 | 13 | 1,160 | 4 | 4,749 | 16 | 1,343 | 5 | 3,524 | 12 |
| 89 | 29,148 | 100 | 13,415 | 46 | 1,363 | 5 | 3,560 | 12 | 1,047 | 4 | 4,816 | 17 | 1,295 | 4 | 3,651 | 13 |
| 90 | 26,687 | 100 | 11,446 | 43 | 1,330 | 5 | 3,314 | 12 | 1,066 | 4 | 4,314 | 16 | 1,396 | 5 | 3,821 | 14 |
| 91 | 26,382 | 100 | 11,083 | 42 | 1,148 | 4 | 3,213 | 12 | 1,120 | 4 | 4,589 | 17 | 1,301 | 5 | 3,928 | 15 |
| 92 | 26,240 | 100 | 10,871 | 41 | 1,071 | 4 | 2,970 | 11 | 1,029 | 4 | 4,890 | 19 | 1,295 | 5 | 4,114 | 16 |
| 93 | 25,716 | 100 | 10,900 | 42 | 1,087 | 4 | 2,988 | 12 | 885 | 3 | 4,468 | 17 | 1,255 | 5 | 4,135 | 16 |
| 94 | 23,508 | 100 | 9,386 | 40 | 1,050 | 4 | 2,679 | 11 | 950 | 4 | 4,043 | 17 | 1,255 | 5 | 4,144 | 18 |
| 95 | 21,993 | 100 | 8,085 | 37 | 883 | 4 | 2,424 | 11 | 926 | 4 | 4,004 | 18 | 1,162 | 5 | 4,510 | 21 |
| 96 | 22,897 | 100 | 8,878 | 39 | 846 | 4 | 2,580 | 11 | 970 | 4 | 3,974 | 17 | 1,226 | 5 | 4,424 | 19 |
| 97 | 21,716 | 100 | 8,139 | 37 | 845 | 4 | 2,429 | 11 | 908 | 4 | 3,745 | 17 | 1,249 | 6 | 4,400 | 20 |
| 98 | 22,033 | 100 | 7,969 | 36 | 789 | 4 | 2,442 | 11 | 1,092 | 5 | 4,099 | 19 | 1,179 | 5 | 4,464 | 20 |
| 99 | 17,518 | 100 | 6,056 | 35 | 712 | 4 | 1,812 | 10 | 818 | 5 | 2,945 | 17 | 682 | 4 | 4,494 | 26 |
| 100 | 20,318 | 100 | 7,080 | 35 | 623 | 3 | 2,144 | 11 | 707 | 3 | 4,269 | 21 | 931 | 5 | 4,563 | 22 |
| 101 | 17,454 | 100 | 5,775 | 33 | 816 | 5 | 1,928 | 11 | 667 | 4 | 2,277 | 13 | 1,133 | 6 | 4,856 | 28 |
| 102 | 19,238 | 100 | 6,205 | 32 | 779 | 4 | 1,783 | 9 | 800 | 4 | 2,464 | 13 | 1,012 | 5 | 6,195 | 32 |
| 103 | 15,099 | 100 | 4,913 | 33 | 577 | 4 | 1,578 | 10 | 864 | 6 | 2,148 | 14 | 931 | 6 | 4,088 | 27 |
| 104 | 19,372 | 100 | 6,512 | 34 | 477 | 2 | 1,871 | 10 | 629 | 3 | 3,348 | 17 | 800 | 4 | 5,735 | 30 |
| NOTE: Analysis includes beneficiaries in traditional Medicare only (excludes beneficiaries with Medicare Advantage).SOURCE: Kaiser Family Foundation analysis of a 5 percent sample of Medicare claims from the CMS Chronic Conditions Data Warehouse, 2011. | ||||||||||||||||
Endnotes
- The population age 80 and older was 11.3 million in 2010 and is projected to grow to 30.9 million in 2050. The population age 90 and older was 1.9 million in 2010 and is projected to grow to 8.0 million in 2050. 2010 population estimates are from U.S. Census Bureau. Population Division. Vintage 2011: National Tables. Table 1. Annual Estimates of the Resident Population by Sex and Five-Year Age Group for the United States: April 1, 2010 to July 1, 2011 (NC-EST2011-01); 2012 May; https://www.census.gov/popest/data/national/asrh/2011/tables/NC-EST2011-01.xls. 2050 population estimates are from U.S. Census Bureau, Population Division. 2012 National Population Projections: Summary Tables. Projections of the Population by Age and Sex for the United States: 2015 to 2060 (NP2012-T12). Middle series; 2012 Dec; https://www.census.gov/population/projections/files/summary/NP2012-T12.xls. ↩︎
- Between 2014 and 2050, the Medicare population is projected to grow from 54 to 93 million beneficiaries, and during this time period, net Medicare spending is expected to rise from 3.0% of GDP to 5.5% in 2050; see Congressional Budget Office, “The 2014 Long-Term Budget Outlook,” available at http://www.cbo.gov/publication/45471. ↩︎
- This report is being released along with a companion article in the journal Health Affairs; see Patricia Neuman, Juliette Cubanski, and Anthony Damico, “Medicare Per Capita Spending By Age And Service: New Data Highlights Oldest Beneficiaries,” Health Affairs Web First January 2015; in print February 2015. ↩︎
- For a more detailed description of the methodology used by Medicare to pay private plans, see Medicare Payment Advisory Commission, “Medicare Advantage Program Payment System,” October 2013, http://www.medpac.gov/documents/MedPAC_Payment_Basics_13_MA.pdf. ↩︎
- Harriet Komisar and Judy Feder, “HarTransforming Care for Medicare Beneficiaries with Chronic Conditions and Long-Term Care Needs: Coordinating Care Across All Services,” Georgetown University, October 2011, available at http://www.cahpf.org/docuserfiles/georgetown_trnsfrming_care.pdf. ↩︎
- Many of these initiatives are being run out of the newly-created Innovation Center within the Centers for Medicare & Medicaid Services (CMS); see “About the CMS Innovation Center,” http://innovation.cms.gov/About/index.html. ↩︎
- Congressional Budget Office, “Dual-Eligible Beneficiaries of Medicare and Medicaid: Characteristics, Health Care Spending, and Evolving Policies,” June 2013, available at http://www.cbo.gov/publication/44308. ↩︎
- Centers for Medicare & Medicaid Services, “Medicare Program; Revisions to Payment Policies under the Physician Fee Schedule, Clinical Laboratory Fee Schedule, Access to Identifiable Data for the Center for Medicare and Medicaid Innovation Models & Other Revisions to Part B for CY 2015,” available at http://www.ofr.gov/OFRUpload/OFRData/2014-26183_PI.pdf. ↩︎
- Analysis of Medicaid per enrollee spending by age group is available from Centers for Medicare & Medicaid Services, Table 25, Medicaid Per-enrollee Spending by Gender and Age Group, Calendar Years 2002, 2004, 2006, 2008, 2010, available at http://www.cms.gov/Research-Statistics-Data-and-Systems/Statistics-Trends-and-Reports/NationalHealthExpendData/Downloads/2010GenderandAgeTables.pdf. ↩︎
- Analysis of out-of-pocket spending by age group is available from Juliette Cubanski, Christina Swoope, Anthony Damico, and Tricia Neuman, “How Much is Enough How Much Is Enough? Out-of-Pocket Spending Among Medicare Beneficiaries: A Chartbook,” Kaiser Family Foundation, July 2014, available at https://modern.kff.org/health-costs/report/how-much-is-enough-out-of-pocket-spending-among-medicare-beneficiaries-a-chartbook/. ↩︎
- These estimates have changed little since 2000. In 2000, beneficiaries ages 80 and over comprised 25 percent of the Medicare population and 33 percent of total Medicare spending; beneficiaries between the ages of 65 and 69 comprised 22 percent of the Medicare population, but just 14 percent of total Medicare spending. ↩︎
- These findings are generally consistent with data reported by the Congressional Budget Office (CBO) showing Medicare per capita spending for services covered under Parts A and B for beneficiaries enrolled under traditional Medicare rising from $4,500 for 66-year-olds to $8,500 for 75-year-olds and $12,500 for those ages 85 and older; see CBO, “The 2014 Long-Term Budget Outlook,” July 2014, available at http://www.cbo.gov/publication/45471. Unlike CBO, our analysis includes Part D spending. Our results also are consistent with analysis showing Medicare costs for beneficiaries age 65 and older rise until around age 90, when they start to decline; see Dale Yamamoto, “Health Care Costs—From Birth to Death,” Society of Actuaries, June 2013, available at http://www.healthcostinstitute.org/files/Age-Curve-Study_0.pdf. ↩︎
- In 2011, 4.8 percent of beneficiaries in traditional Medicare ages 66 and over died during the year; their spending accounted for 17.5 percent of traditional Medicare spending for beneficiaries in this age group. ↩︎
- For an analysis of Medicare spending in the last year of life, see Steve Calfo, Jonathan Smith, and Mark Zezza, “Last Year of Life Study,” Centers for Medicare & Medicaid Services Office of the Actuary, available at https://www.cms.gov/Research-Statistics-Data-and-Systems/Research/ActuarialStudies/downloads/Last_Year_of_Life.pdf. ↩︎
- We examined the hypothesis that the decline in per capita spending by age among decedents could be attributed to fewer months of Medicare spending among older than younger decedents; that is, whether lower per capita spending among older than younger decedents could be due to the oldest beneficiaries surviving fewer months than younger beneficiaries. However, we did not observe such a pattern. On average, decedents of all ages lived about six months in the year, with virtually no variation across ages that could explain the decline in spending among decedents by age. Due to data constraints, we were unable to look at spending among decedents in the last 12 months of life. ↩︎
- For example, among 70-year-olds, average Medicare per capita spending is more than six times greater for beneficiaries who died in 2011 than among beneficiaries who survived ($42,933 versus $6,847); however, just 2 percent of 70-year olds died that year, so the relatively high cost of 70-year-olds who died in 2011 increases the overall average only modestly ($7,566 for 70-year-olds overall versus $6,847 for survivors only, a difference of $719). In contrast, among 90-year-olds, average Medicare per capita spending was two times greater among beneficiaries who died than survived in 2011 ($26,687 vs. $12,924), but because 13 percent of 90-year-olds died that year, the decedents raised average per capita spending by $1,821 ($14,745 versus $12,924 for survivors). ↩︎
- Available at http://www.bls.gov/data/inflation_calculator.htm. ↩︎