Survey of Non-Group Health Insurance Enrollees, Wave 3
Introduction
This survey is the third in a series that seeks to shed light on the experiences and opinions of those purchasing their own health insurance in the non-group market. The Affordable Care Act (ACA) has had a significant impact on this group, through new rules that standardized benefits and guaranteed coverage for those with pre-existing conditions, and through the establishment of income-based federal financial assistance to those buying insurance through new health insurance Exchanges or Marketplaces created by the law.
Starting on January 1st, 2014, all newly purchased non-group coverage has had to follow new rules under the ACA (i.e. “ACA-compliant”). This survey, conducted February 9 – March 26, 2016, after the close of the law’s third open enrollment period, focuses on individuals who purchased ACA-compliant coverage, whether inside or outside of a Marketplace. The survey also includes individuals who are currently enrolled in “non-ACA compliant” plans (those purchased before March 2010 that were grandfathered in and those purchased before October 2013 that were allowed to continue under a federal transition policy at the discretion of states and insurers); however, few people remain in non-compliant plans and the sample size does not allow their results to be reported separately.1
This report details findings from the latest survey and draws trends and comparisons using data from the first and second surveys in the series, conducted at the end of each of the previous enrollment periods in 2014 and 2015. It also draws some comparisons to the experiences and opinions of people with employer-sponsored insurance through data collected on a separate series of surveys, the Kaiser Health Tracking Polls.2
Key Findings
Basic Demographics of the Non-Group Market
Looking at the non-group market as a whole, nearly two-thirds of enrollees (64 percent) report being in a Marketplace plan.3 This is similar to the share who had Marketplace plans in 2015 (59 percent) and an increase from 2014 (48 percent). Currently, about one in five enrollees (19 percent) report being in an ACA-compliant, non-Marketplace plan purchased from a broker or insurance company, and 12 percent report having pre-ACA, non-compliant plans.4
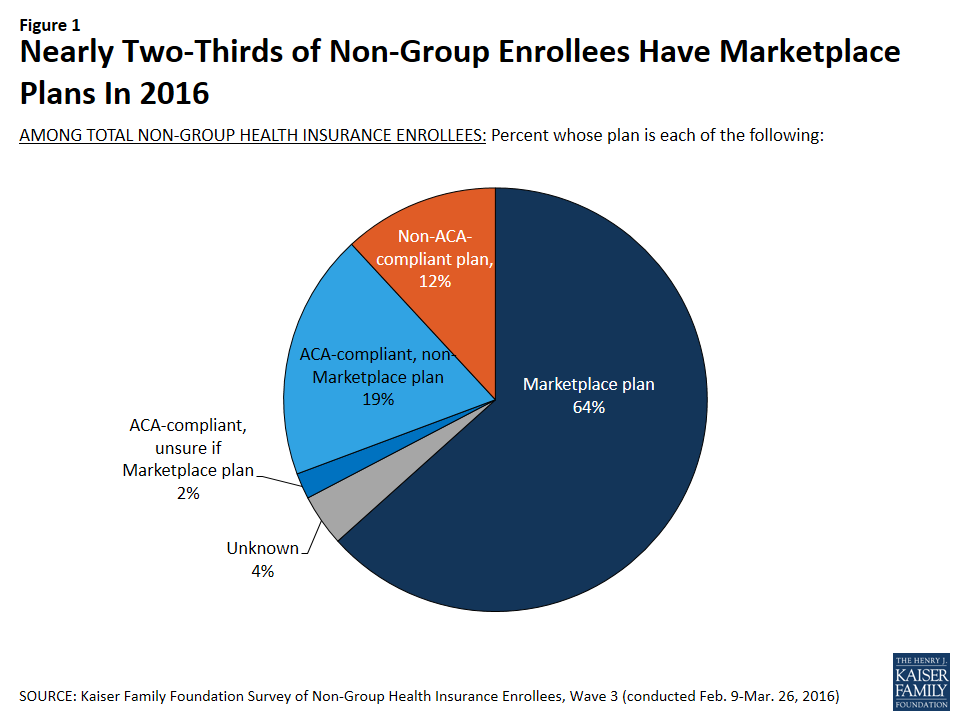
Figure 1: Nearly Two-Thirds of Non-Group Enrollees Have Marketplace Plans In 2016
One concern raised about the ACA’s guarantee of coverage for those with pre-existing conditions was whether enough healthy people would enroll to offset higher claims from less healthy people enrolling in new coverage because insurers could no longer exclude them. The expectation was that sicker people would enroll initially because they were certain they needed coverage, with the hope that an increasing number of healthier people would sign up over time. The share of people who say they are in fair or poor health has been fairly consistent through the first three open enrollment periods, with most changes from year to year within the survey’s margin of sampling error.
| Table 1: Self-Reported Health Status of Non-Group Enrollees | ||||||
| In general, would you say your health is excellent, very good, good, fair, or poor? | ALL ACA-COMPLIANT PLANS | MARKETPLACE PLANS ONLY | ||||
| 2014 | 2015 | 2016 | 2014 | 2015 | 2016 | |
| NET Excellent/Very good/Good | 82% | 85% | 80% | 79% | 85% | 78% |
| Excellent | 22 | 24 | 22 | 21 | 23 | 19 |
| Very good | 29 | 33 | 31 | 27 | 34 | 32 |
| Good | 31 | 28 | 27 | 31 | 28 | 27 |
| NET Fair/Poor | 17 | 15 | 20 | 20 | 15 | 22 |
| Fair | 13 | 11 | 15 | 16 | 10 | 16 |
| Poor | 4 | 4 | 5 | 4 | 4 | 6 |
| NOTE: Don’t know/ Refused responses not shown. | ||||||
Most individuals with non-group coverage don’t have access to coverage from an employer, either because they are self-employed (31 percent), not employed (28 percent), or their employer does not offer a health plan (21 percent). Among the 18 percent who work for an employer that offers coverage, most are either not eligible to enroll in their employer’s plan (5 percent are not currently eligible and 1 percent are in an eligibility waiting period), or say it’s less expensive to buy their own coverage than to pay the premium for their employer plan (6 percent). Three percent say they’re not happy with the plan their employer offers.
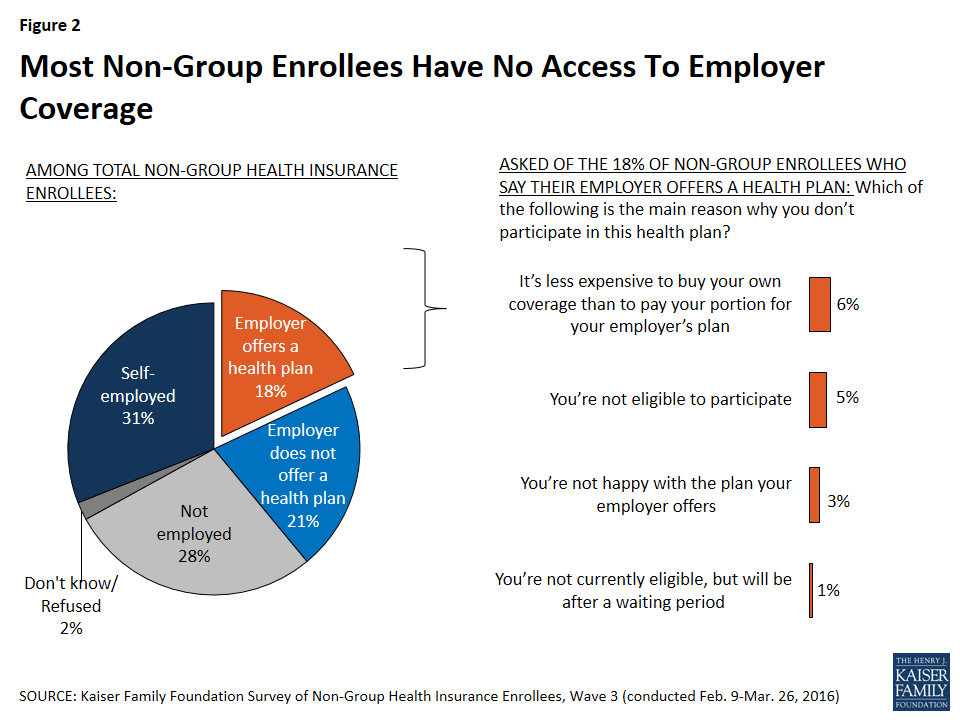
Figure 2: Most Non-Group Enrollees Have No Access To Employer Coverage
A somewhat higher share of non-group enrollees now report being in plans with high deductibles than did so in 2015. In the current survey, about half (49 percent) of those with ACA-compliant non-group coverage say their plan has an annual individual deductible of at least $1,500 or a family deductible of at least $3,000, up from just over a third (36 percent) last year. Those with Marketplace plans are somewhat less likely to report having a high deductible (46 percent, compared with 61 percent of those in ACA-compliant non-Marketplace plans), likely because many Marketplace enrollees qualify for cost-sharing subsidies that lower their deductible.5

Figure 3: More Non-Group Enrollees Report Being in High-Deductible Health Plans in 2016 than in 2015
Health Plan Ratings and Satisfaction with Coverage
The majority of enrollees in ACA-compliant non-group plans give their overall coverage a positive rating, with 14 percent calling their plan “excellent” and about half (52 percent) saying it is “good.” However, the share rating their coverage as “not so good” or “poor” is higher in 2016 (31 percent) than it was in the two previous waves of the survey (20 percent in 2014 and 21 percent in 2015). Non-group enrollees have consistently given their plans lower ratings than their counterparts in employer-sponsored plans, however among those with employer coverage, the share rating their coverage as “not so good” or “poor” is also higher in 2016 than it was in previous years. It is also notable that those with Marketplace plans are less likely to give their plans low ratings than those with ACA-compliant plans purchased outside the Marketplace (29 percent versus 38 percent).
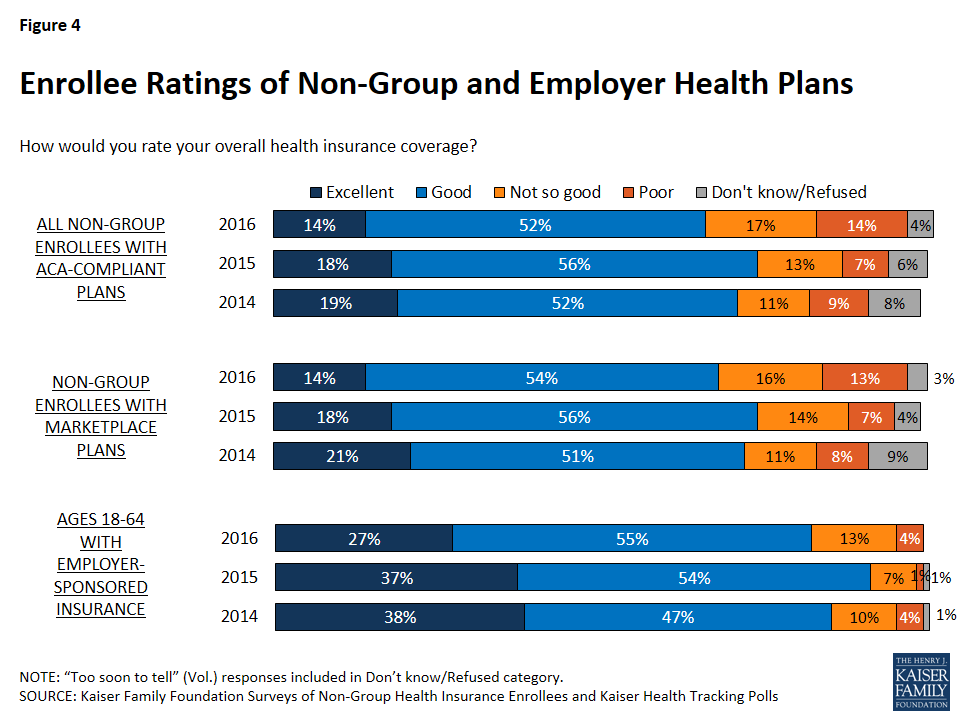
Figure 4: Enrollee Ratings of Non-Group and Employer Health Plans
Similar to the trend in overall plan ratings, the current survey finds those with ACA-compliant non-group plans are less likely than in previous years to say their coverage is an “excellent” or “good” value for what they pay for it. Just over half (54 percent) now rate the value of their coverage as “only fair” or “poor” (up from 42 percent in 2015 and 39 percent in 2014). Individuals with Marketplace coverage are more likely to give their plan a positive rating than those with ACA-compliant, non-Marketplace plans (48 percent versus 35 percent). Those with employer-sponsored coverage, who generally pay a lower portion of their premium, are more likely than those with non-group coverage to see their plan as at least a “good” value for the money, but the share of this group saying the value is “only fair” or “poor” has also increased, from 28 percent in 2014 to 40 percent in 2016.
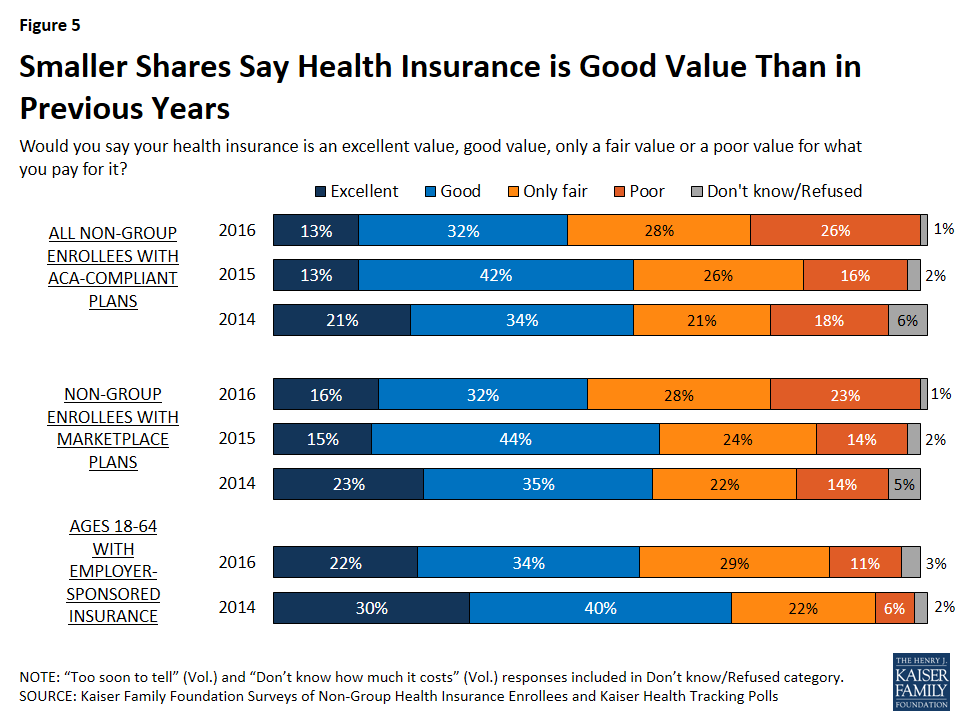
Figure 5: Smaller Shares Say Health Insurance is Good Value Than in Previous Years
Looking beyond overall plan ratings, most people with ACA-compliant non-group coverage say they are satisfied with various elements of their plans. Despite media coverage of narrowing provider networks, three-quarters of those with ACA-compliant non-group plans say they’re “very” or “somewhat” satisfied with their plan’s choice of hospitals (75 percent) and primary care providers (75 percent), and about six in ten (61 percent) say the same about the choice of specialists. Satisfaction levels are similar when looking just at those enrolled in Marketplace plans.
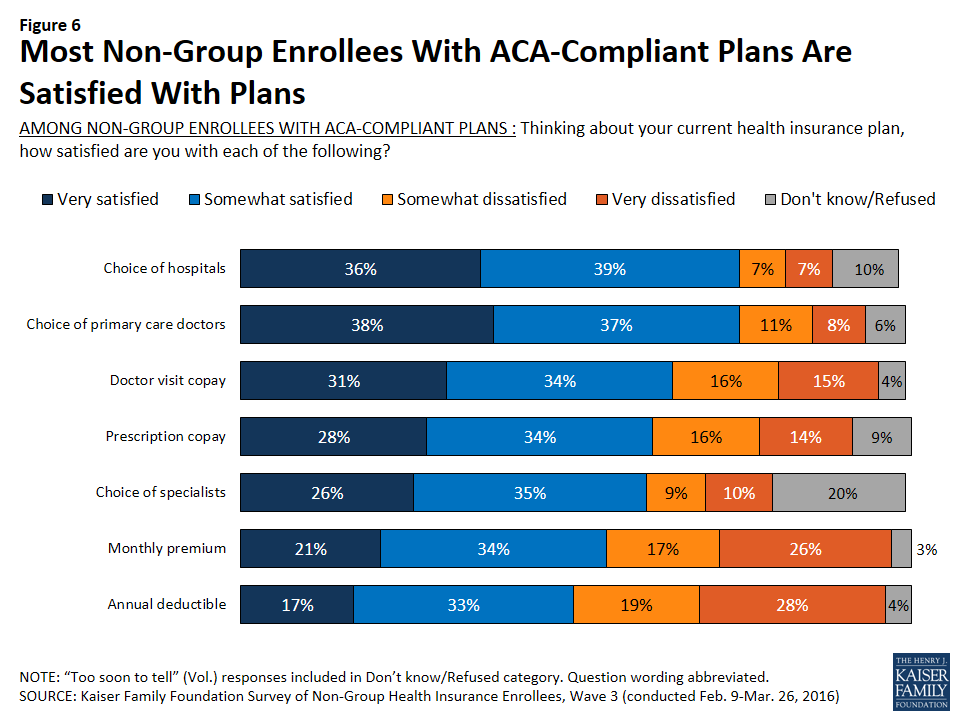
Figure 6: Most Non-Group Enrollees With ACA-Compliant Plans Are Satisfied With Plans

Figure 7: Most Marketplace Enrollees Satisfied With Plans
A majority of enrollees also say they are satisfied with their plan’s premium (54 percent of all those in ACA-compliant plans and 59 percent of those in Marketplace plans), and about half say the same about their deductible (50 percent of ACA-compliant enrollees and 51 percent of Marketplace enrollees). However, satisfaction with premiums and deductibles has declined since 2014. Nearly half now say they are dissatisfied with their plan’s annual deductible (47 percent among all those ACA-compliant plans and 46 percent in Marketplace plans), and four in ten are dissatisfied with their monthly premium (43 percent and 40 percent, respectively).
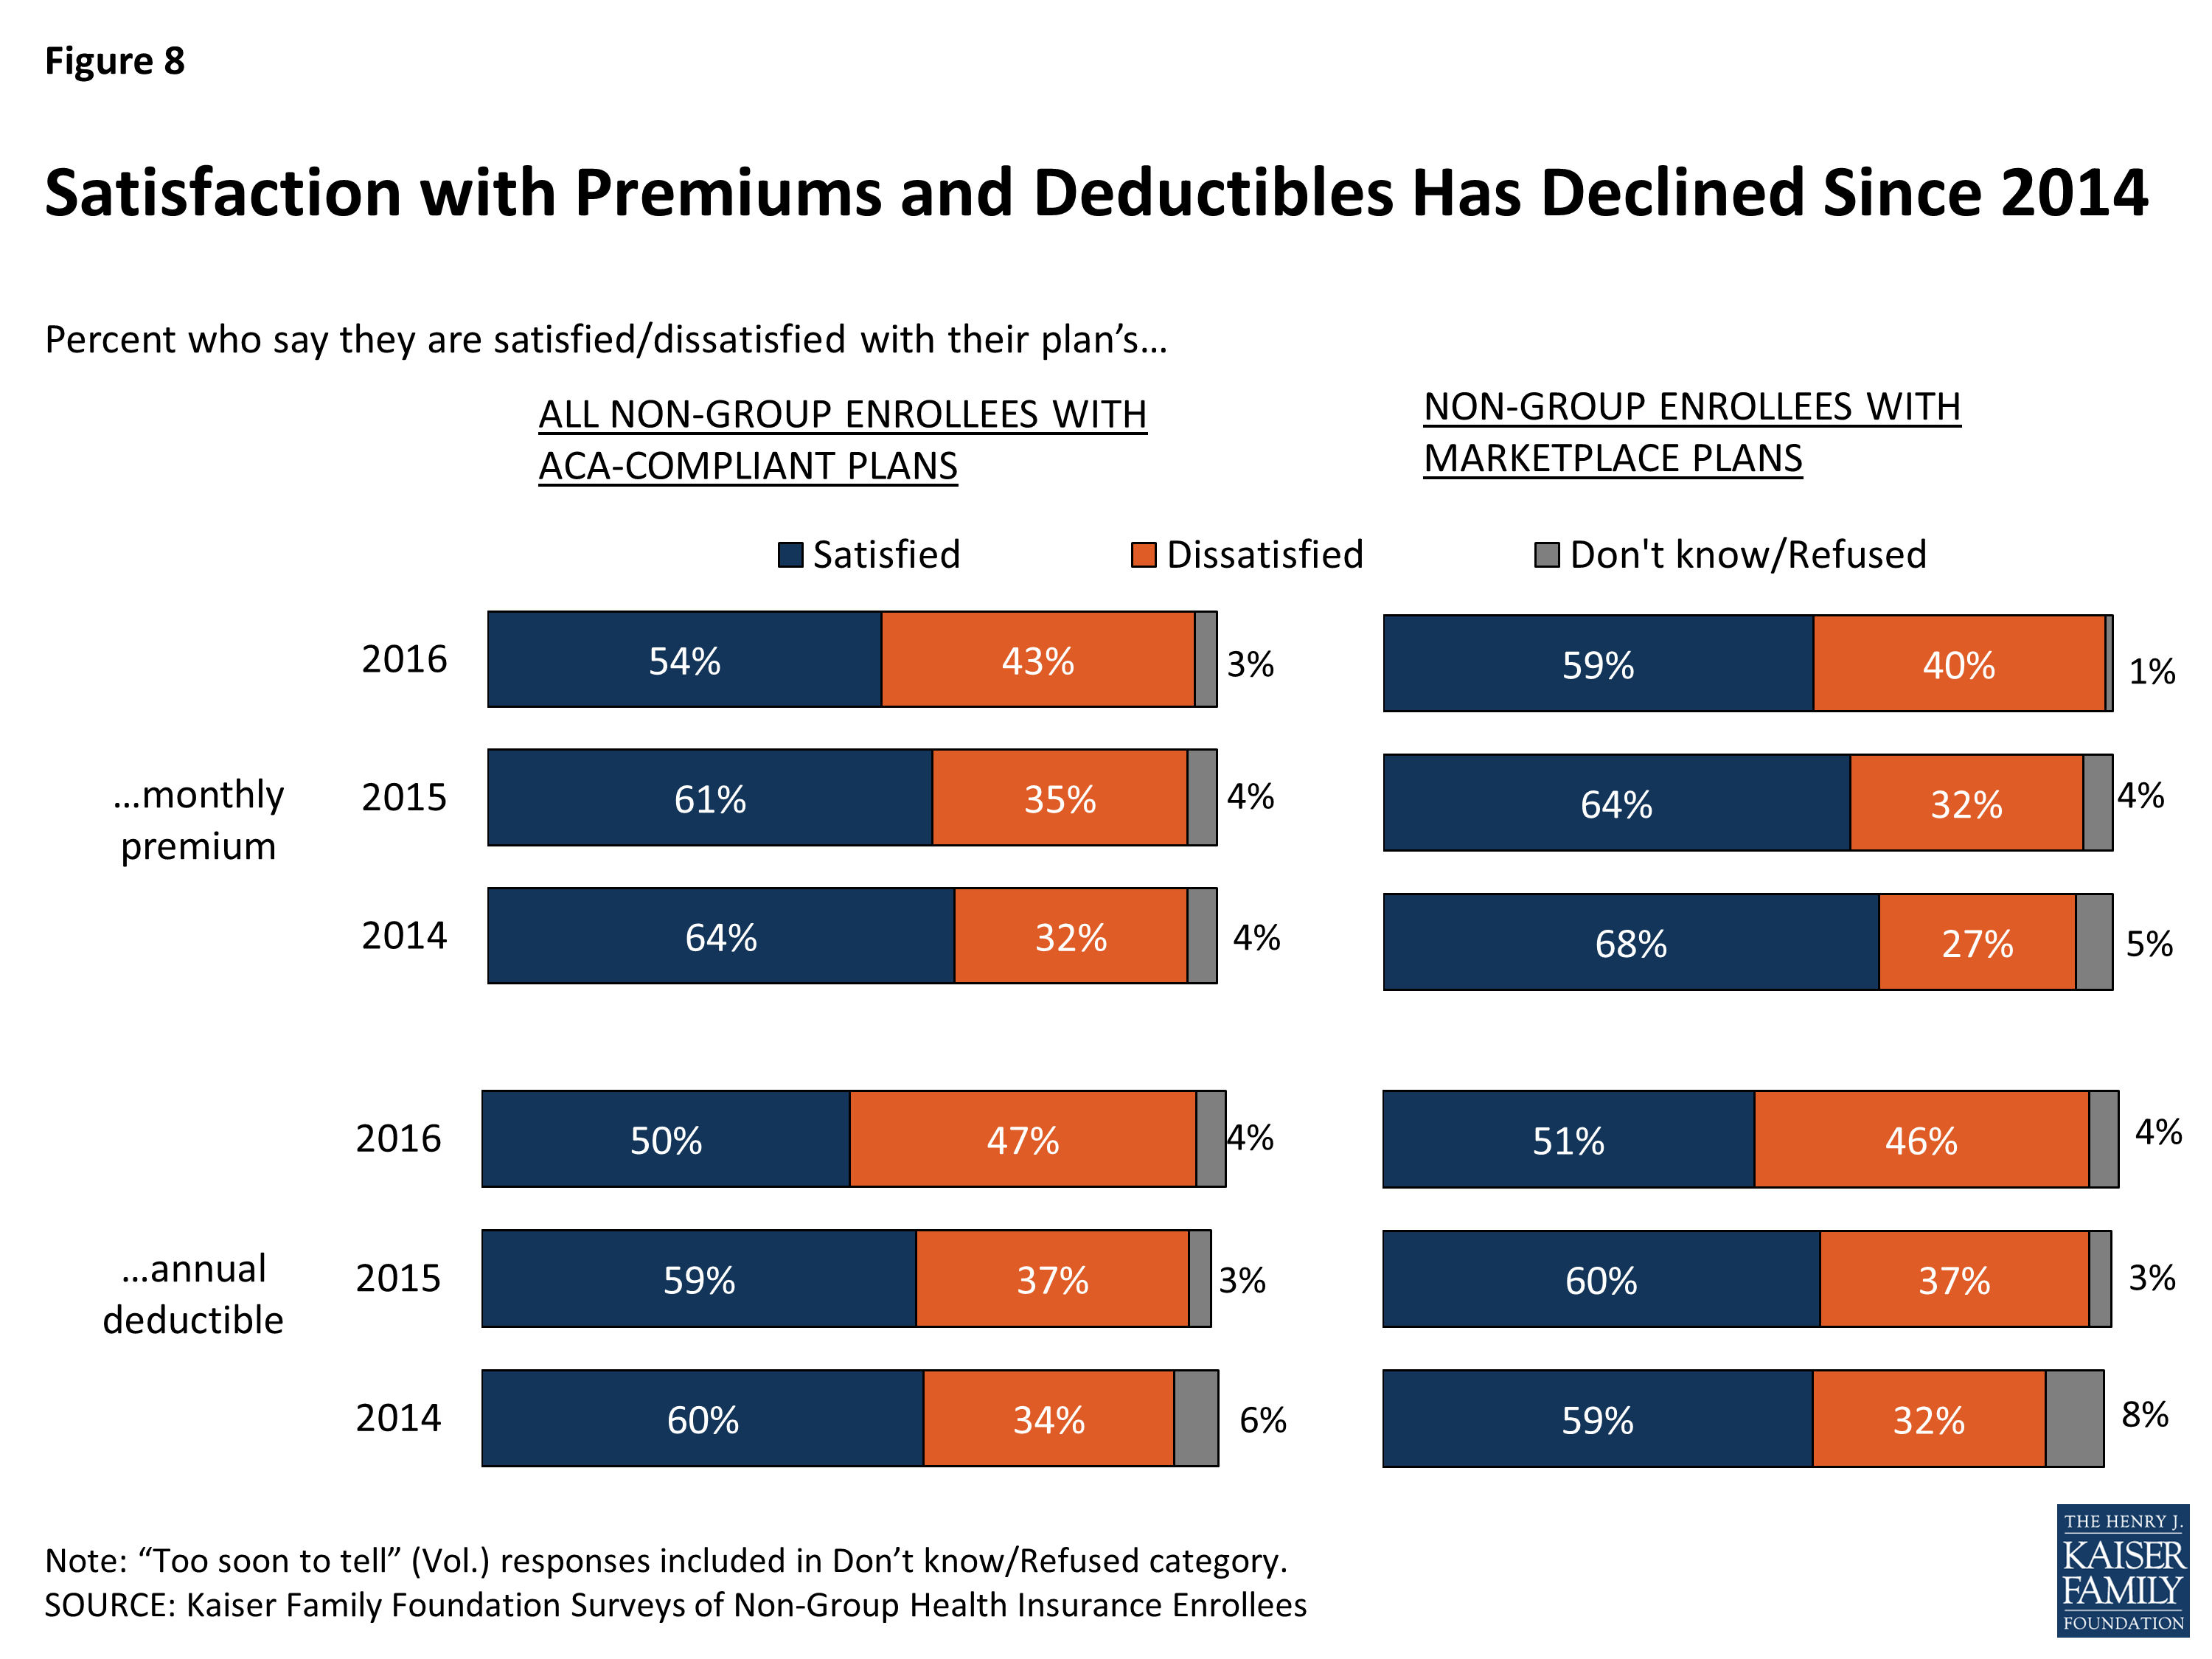
Figure 8: Satisfaction with Premiums and Deductibles Has Declined Since 2014
Each of these trends toward more negative ratings of non-group coverage may be related to the fact that more enrollees now report being in high-deductible plans (as noted above, 49 percent of those with ACA-compliant plans now have a high-deductible plan, up from 36 percent in 2015). The latest survey finds that those with high-deductible plans give their coverage lower ratings overall and are less likely than their counterparts in lower-deductible plans to say they are satisfied not only with their deductible, but also with their copays and premiums.
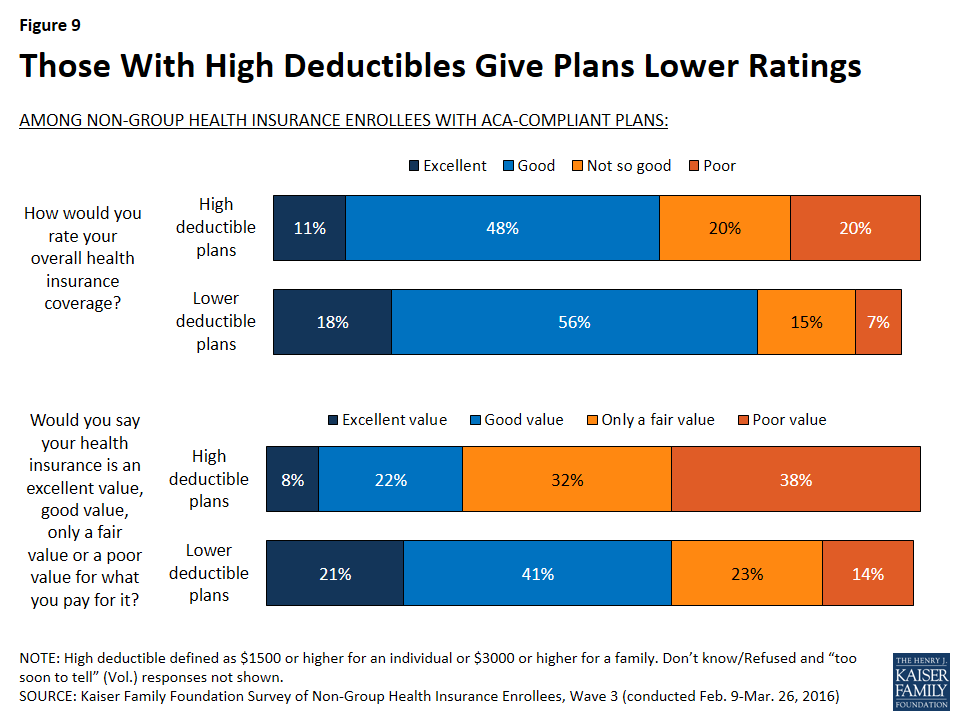
Figure 9: Those With High Deductibles Give Plans Lower Ratings
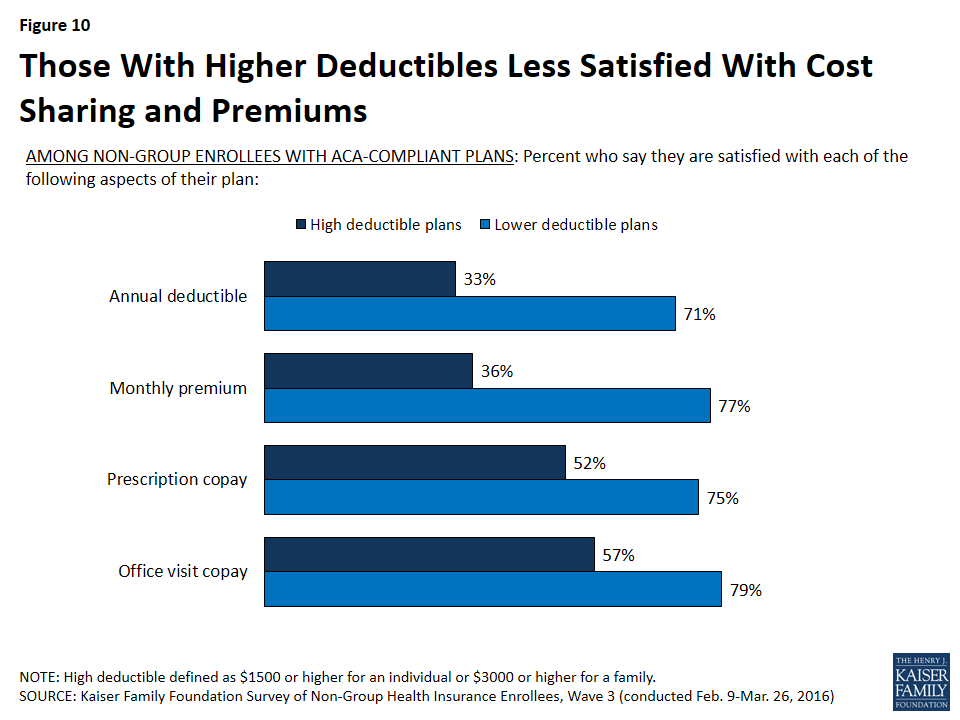
Figure 10: Those With Higher Deductibles Less Satisfied With Cost Sharing and Premiums
Financial Protection of Health Insurance
About half (51 percent) of non-group enrollees with ACA-compliant plans say they feel well-protected by their health insurance; however, the share saying they feel vulnerable to high medical bills has risen over the past two years, from 36 percent in 2014 to 45 percent in the current survey. Again, it’s notable that while those with employer coverage are more likely than non-group enrollees with ACA-compliant plans to say they feel well-protected, this group has also seen a similar increase in the share saying they feel vulnerable (from 26 percent in 2014 to 36 percent today).
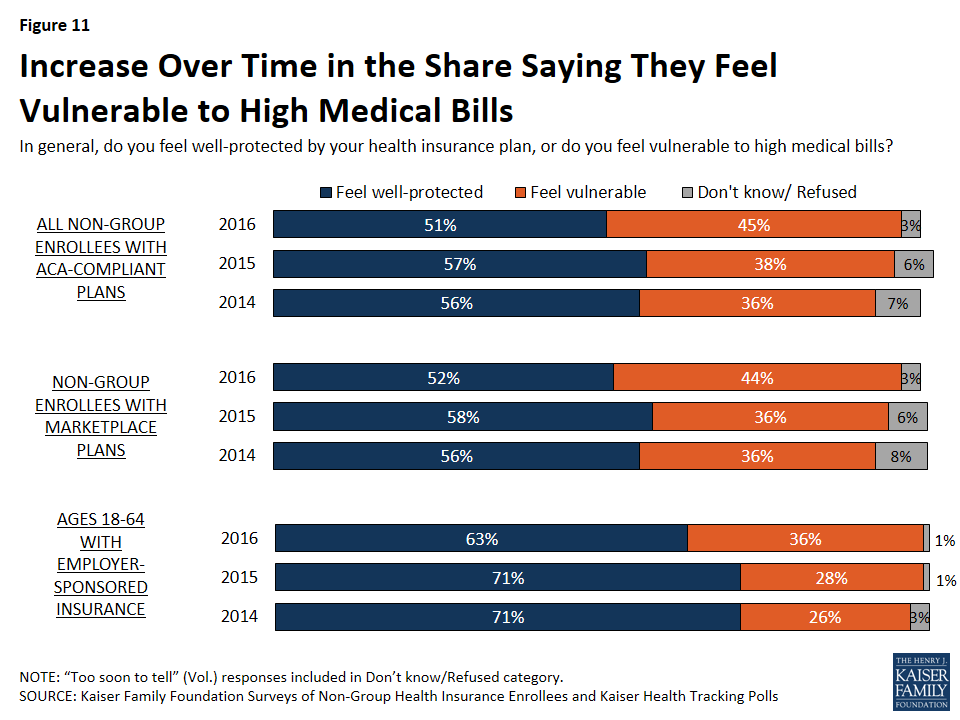
Figure 11: Increase Over Time in the Share Saying They Feel Vulnerable to High Medical Bills
People with ACA-compliant non-group coverage generally report more tenuous financial circumstances than people who get insurance through their jobs. Those with ACA-compliant non-group plans are less likely than those with employer plans to say they “live comfortably” (32 percent versus 44 percent), and more likely to say they either “just meet basic expenses” or “don’t have enough to meet basic expenses” (34 percent versus 23 percent).
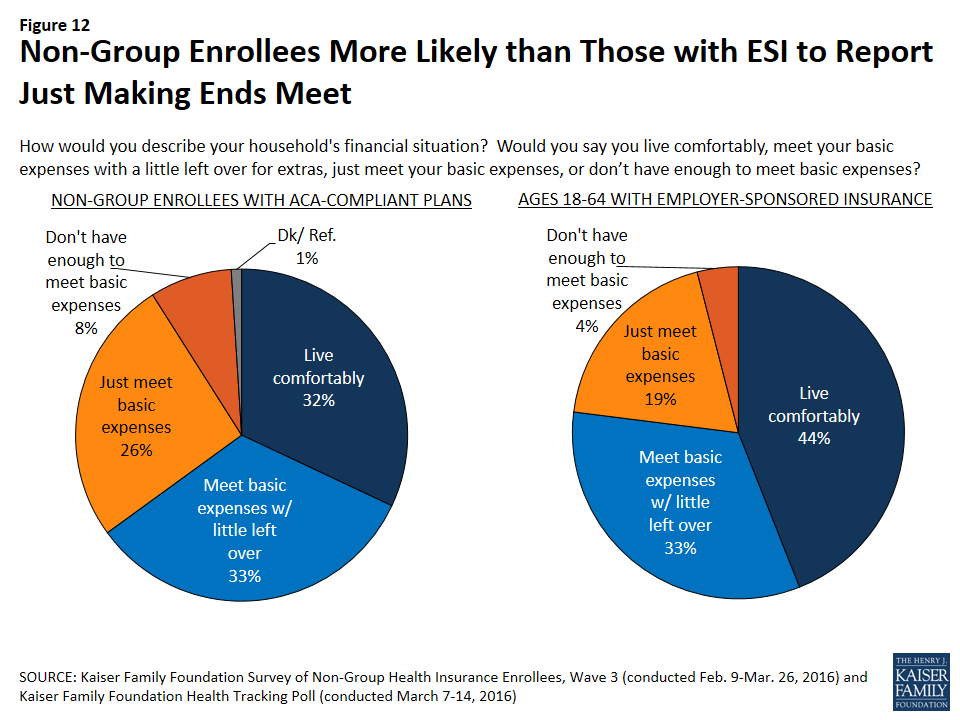
Figure 12: Non-Group Enrollees More Likely than Those with ESI to Report Just Making Ends Meet
Given this, it’s no surprise that difficulty affording health care costs ranks among several other categories of expenses that non-group enrollees say they find it difficult to afford. Half (50 percent) of those with ACA-compliant plans say it is difficult for them to afford the out-of-pocket health care costs not covered by insurance, and a similar share (46 percent) say it’s difficult to afford their monthly premiums (nearly identical to the 45 percent who said so in 2014). A similar percentage (51 percent) says it is difficult for them to afford paying off debt, while a much larger share (71 percent) reports difficulty saving money for retirement, education, and other purposes. Ranking lower in terms of difficulty, a third (33 percent) say they find it difficult to afford basic necessities like food, housing, and utilities.
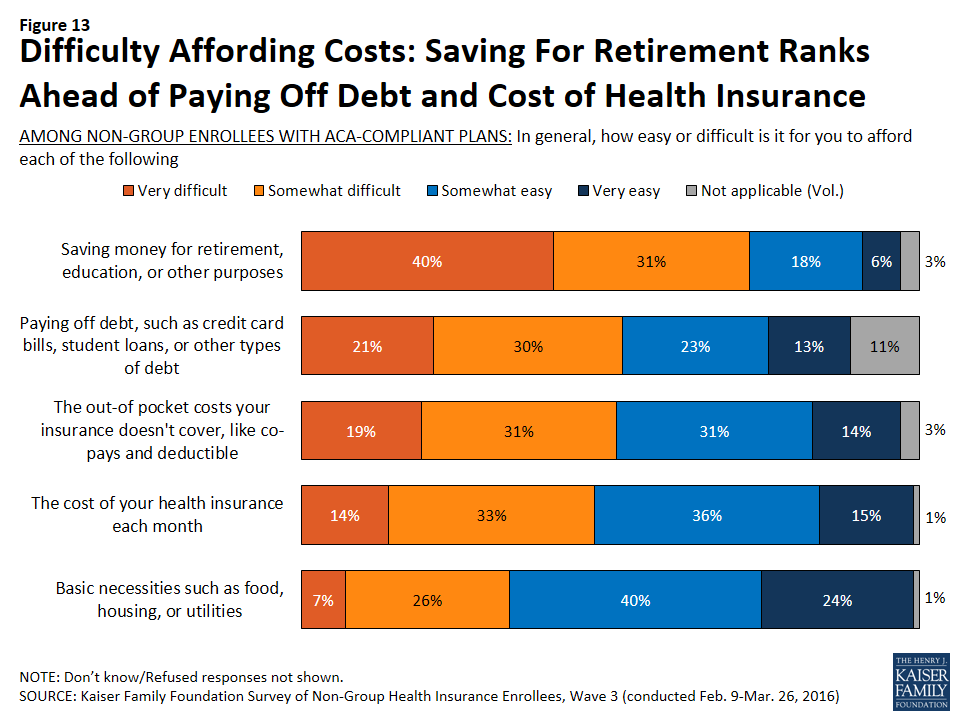
Figure 13: Difficulty Affording Costs: Saving For Retirement Ranks Ahead of Paying Off Debt and Cost of Health Insurance
Not surprisingly, those whose plans have higher deductibles are more likely than those with lower deductibles to say it is difficult for them to afford their out-of-pocket health care costs (58 percent versus 43 percent). This is despite the fact that those with high-deductible plans report higher incomes on average than those whose plans have lower deductibles.
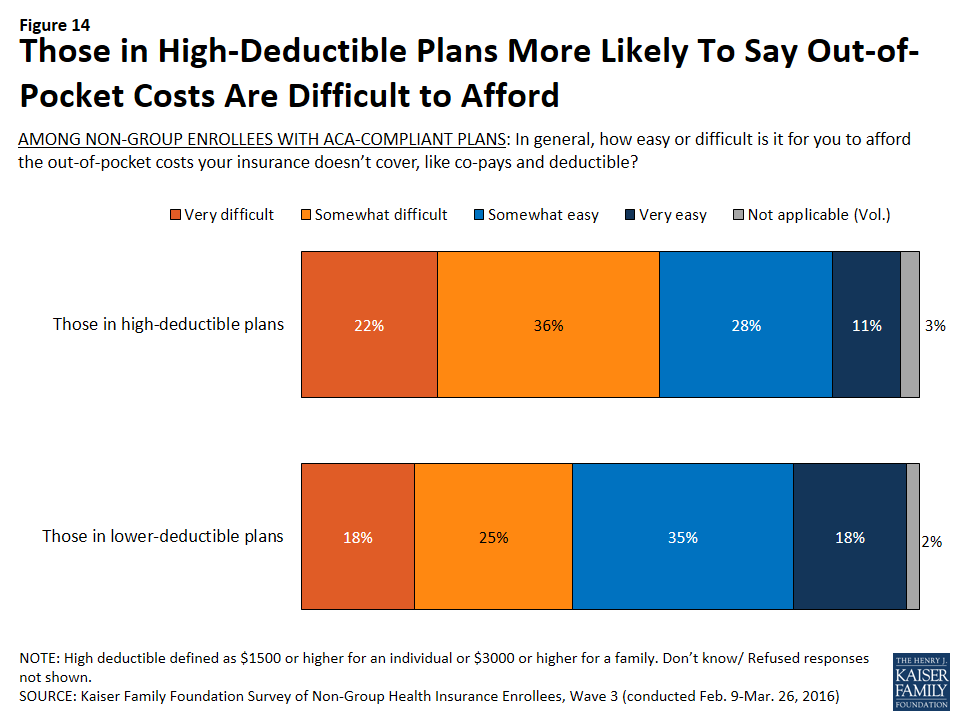
Figure 14: Those in High-Deductible Plans More Likely To Say Out-of-Pocket Costs Are Difficult to Afford
Plan Utilization and Reported Problems
Among those with ACA-compliant plans who’ve had non-group coverage for at least 12 months, a third (33 percent) can be classified as “heavier” utilizers, saying they have used their insurance more than 10 times in the past 12 months to visit a doctor or fill a prescription. Most enrollees (54 percent) say they’ve used their plans between 1 and 10 times, and 13 percent say they haven’t used their plans at all.

Figure 15: One-Third of Those Who Have Had ACA-Compliant Plans For at Least a Year Have Used Their Insurance More Than 10 Times
Among those who’ve had ACA-compliant non-group coverage for at least a year, many report having problems with their plans. Most commonly, just over a third (36 percent) say their plan paid less than they expected for a bill, about a quarter (26 percent) say their plan wouldn’t cover or required a very expensive copay for a drug prescribed by their doctor, one in five (21 percent) say they were surprised to find their plan wouldn’t pay anything for care they thought was covered, and a similar share (20 percent) say that a particular doctor they wanted to see wasn’t covered by their plan. Fewer say they wanted to visit a hospital that wasn’t covered (10 percent) or that they reached the limit on what their insurance would pay for treatment of a specific illness or injury (4 percent). About half (52 percent) report having at least one of these problems.
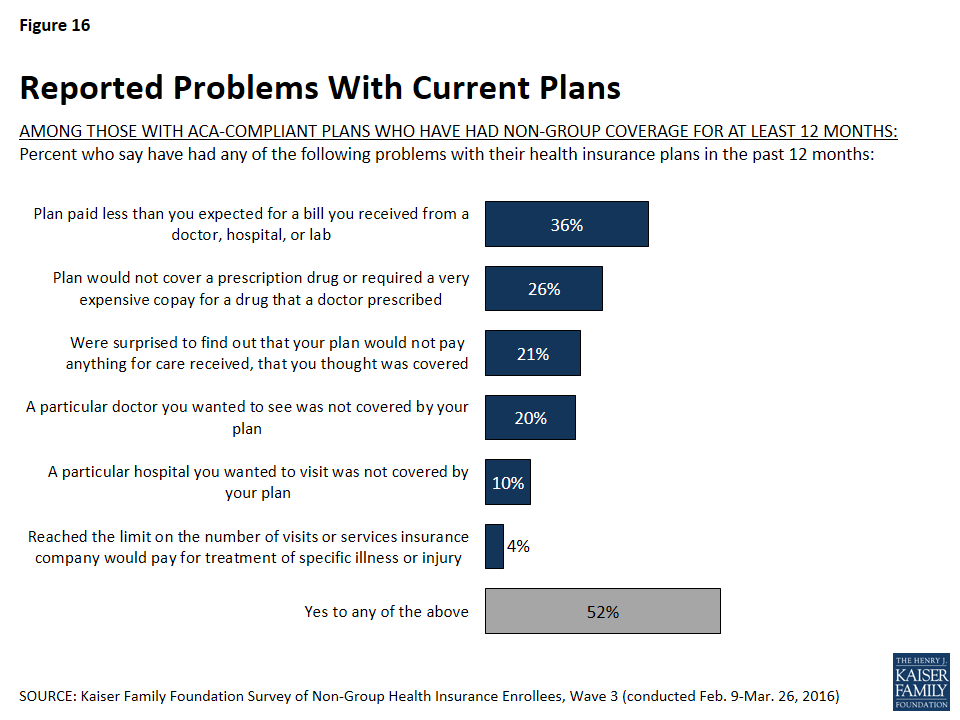
Figure 16: Reported Problems With Current Plans
Those who are heavier utilizers of health insurance are more likely than their counterparts to report some of these problems, including their plan paying less than they expected for a bill (47 percent versus 31 percent), their plan not covering a prescription or requiring a very expensive copay (37 percent versus 20 percent). Heavy utilizers are also more likely to report problems paying medical bills in the past 12 months (31 percent versus 16 percent).
| Table 2: Heavy Utilizers More Likely to Report Problems With Their Plans Than Light Utilizers | |||
| AMONG THOSE WITH ACA-COMPLIANT PLANS WHO HAVE HAD NON-GROUP COVERAGE FOR AT LEAST 12 MONTHS: Percent who say: | Total | Heavy Utilizers | Light Utilizers |
| Their plan paid less than they expected for a medical bill | 36% | 47% | 31% |
| Their plan would not cover or required a very expensive copay for a prescription drug prescribed by a doctor | 26 | 37 | 20 |
| They have had problems paying medical bills in the past 12 months | 21 | 31 | 16 |
| NOTE: “Heavy utilizers” are classified as those who say they have used their insurance more than 10 times in the past 12 months | |||
In addition to problems with their plans, one in five (20 percent) of those who’ve had ACA-compliant coverage for at least a year say there was a time in the last 12 months when they or another family member covered by their plan needed medical care but did not get it because of the cost. Nearly as many (16 percent) say there was a time in the past year when they did not fill a prescription because of the cost.
The survey also finds a lack of awareness about new rules for coverage introduced by the ACA. Among all those with ACA-compliant coverage, fewer than half (47 percent) know that preventive services are covered completely by their plans, while a third (33 percent) think that copays or deductibles apply to preventive services and one in five (20 percent) are not sure. Among those in high-deductible plans, awareness is even lower: 41 know that preventive services are covered with no cost-sharing.
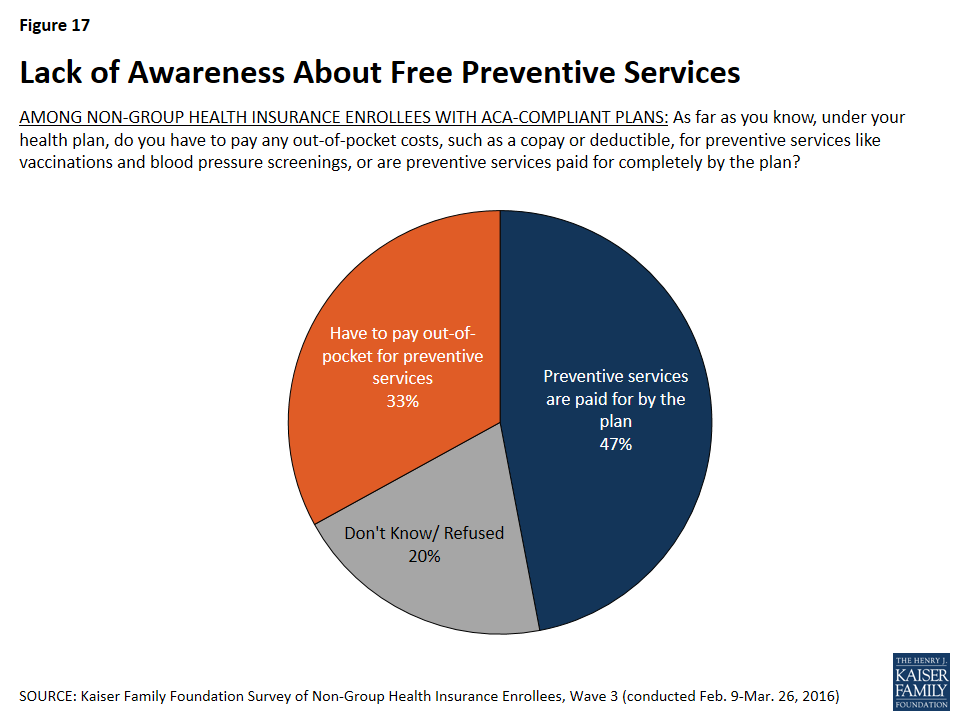
Figure 17: Lack of Awareness About Free Preventive Services
Health Plan Switching
Looking at all those with ACA-compliant non-group plans, three in ten (30 percent) are new to the non-group market this year, and 44 percent report renewing a 2015 plan. Twenty-five percent of all those in ACA-compliant plans, and 23 percent of those in Marketplace plans, say they chose a new plan in the latest open enrollment period.6
Most of those who switched plans either said the plan they had last year was cancelled (11 percent of all those with ACA-compliant plans) or that they found a plan with a lower monthly premium than they would have had to pay to renew their existing plan (8 percent). Smaller shares said they wanted a plan with a lower deductible (4 percent) or that they wanted a plan with a broader choice of providers or one that covered a specific provider (3 percent).
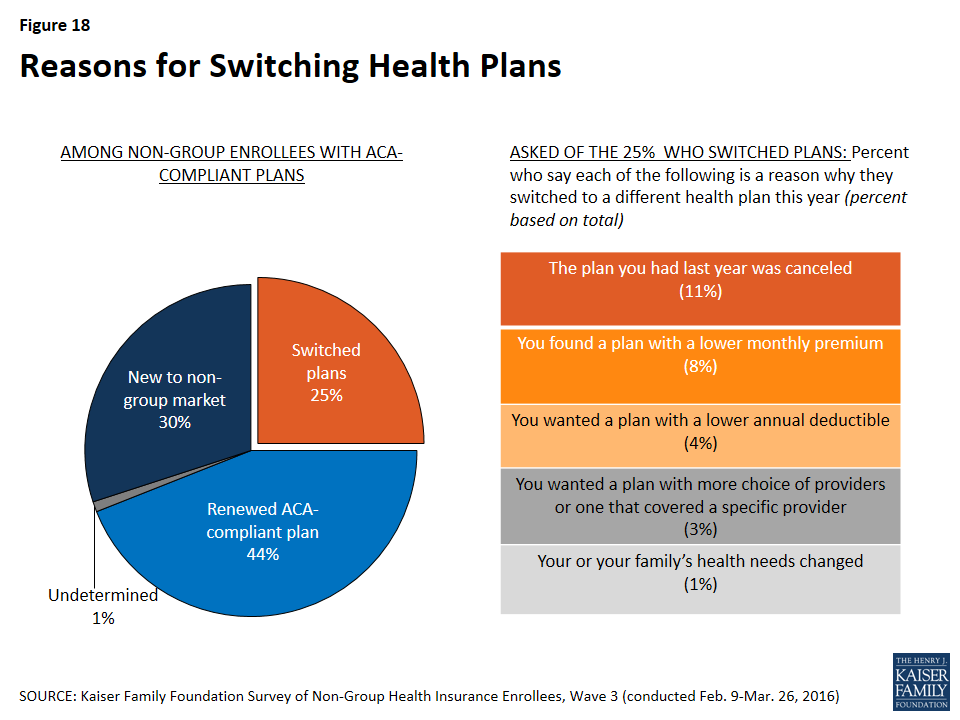
Figure 18: Reasons for Switching Health Plans
Among those who switched plans in the most recent enrollment period, there is not an overwhelming consensus that their new plan is better or worse than their old plan. Roughly equal shares say their new plan is better (25 percent) and worse (28 percent), with about a third saying it is better in some ways and worse in others (35 percent).
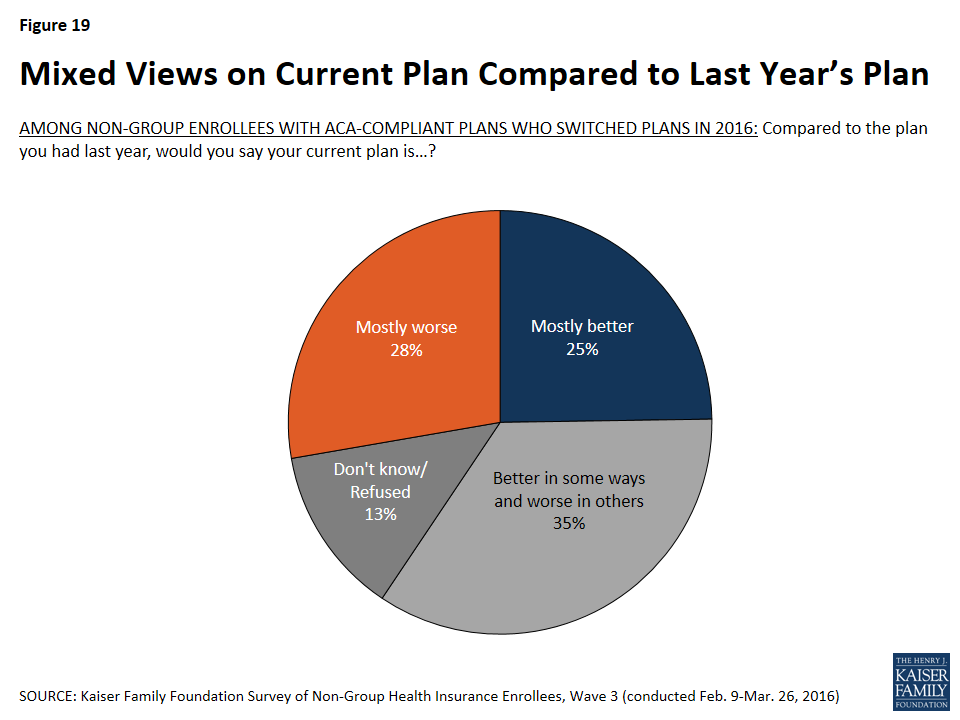
Figure 19: Mixed Views on Current Plan Compared to Last Year’s Plan
Similarly, large shares of plan switchers say their new plan is about the same as their old plan in terms of the choice of doctors and hospitals (55 percent) and the level of financial protection offered by the plan (47 percent). However, the share saying their new plan is worse on each of these measures is larger than the share saying it’s better: 23 percent say their new plan offers less choice of providers compared with 13 percent who say it offers more choice, and 34 percent say their new plan provides less financial protection compared with 16 percent who say it provides more. The picture is also mixed but tilting negative on value for the money: one-third say their new plan offers about the same value for the money as their old plan, but more see their plan as a worse value (37 percent) than a better one (27 percent).
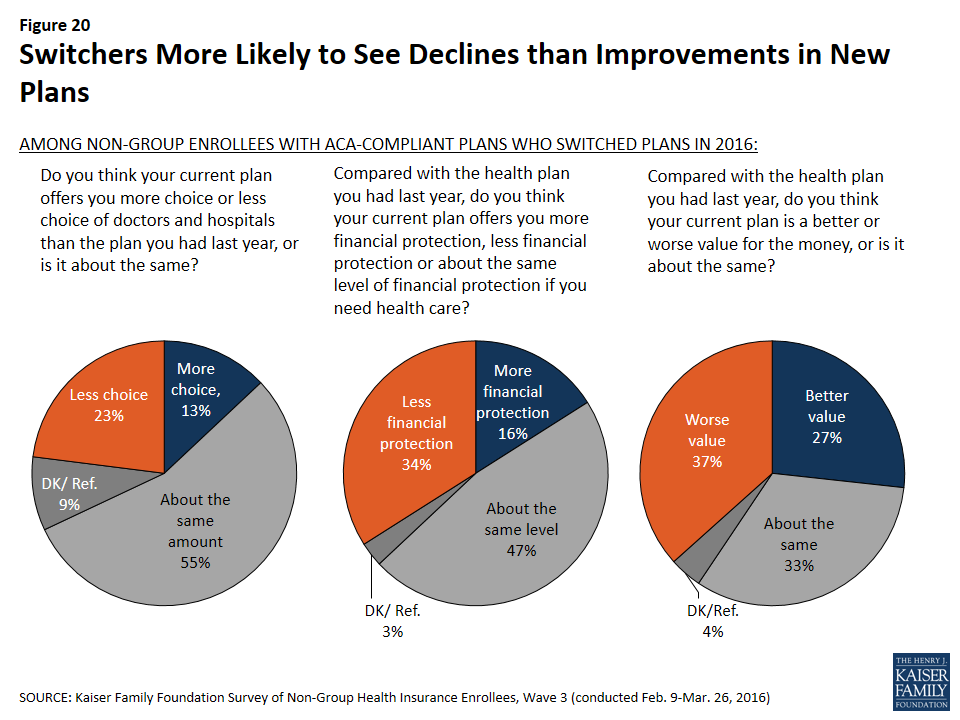
Figure 20: Switchers More Likely to See Declines than Improvements in New Plans
Experiences with Shopping and Renewing Coverage
Among those with Marketplace coverage, most say that when they were shopping for their current plan, it was easy to compare premiums, cost-sharing, and provider networks, and to find a policy to meet their needs. While most measures of the shopping experience are similar to 2015, among those with Marketplace plans, the share saying it was difficult to set up an account with the marketplace decreased from 34 percent in 2014 to 25 percent this year.
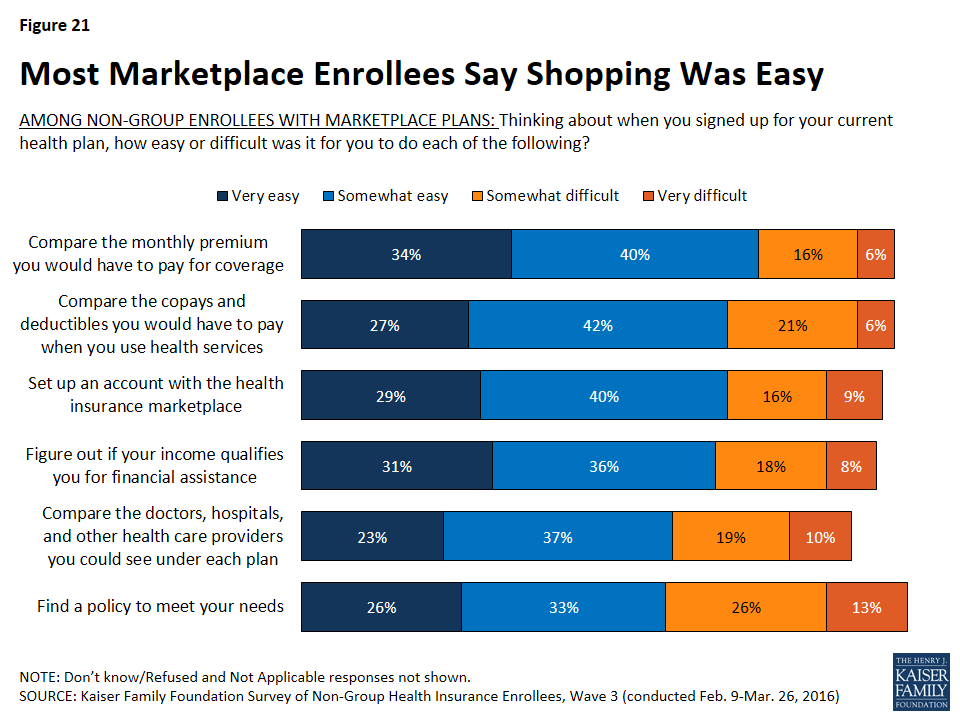
Figure 21: Most Marketplace Enrollees Say Shopping Was Easy
When asked about the most important factors in choosing a plan, non-group enrollees in ACA compliant plans are more likely to cite costs than other factors. The monthly premium cost of the plan (36 percent) was rated most frequently as an “extremely important” factor in plan choice, followed by the amount of deductibles and copays (28 percent). About one in five each said the range of benefits covered (22 percent) and the choice of doctors and hospitals (19 percent) were “extremely important” factors, while very few (5 percent) said the same about recommendations from friends and family.
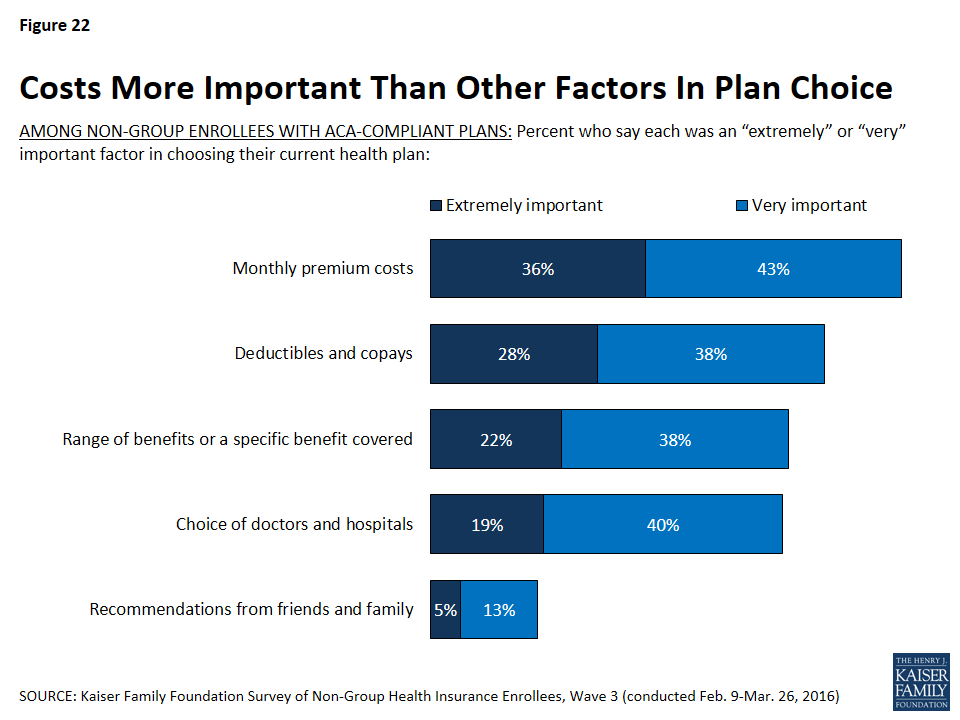
Figure 22: Costs More Important Than Other Factors In Plan Choice
Among those with ACA-compliant plans, four in ten (39 percent) say they got help with the enrollment or renewal process this year, while about six in ten (59 percent) either auto-renewed or completed the process on their own. These rates are similar to 2015, when 44 percent reported getting help with the enrollment process. Those who are new to the non-group market this year and those who switched plans for 2016 are more likely to say they got help with the enrollment process than those who renewed a 2015 plan (45 percent, 55 percent, and 27 percent respectively). Among all those who got help with enrollment, the most frequently-reported source of assistance was health insurance brokers or agents (15 percent, including 34 percent of those who switched plans), followed by navigators and other enrollment assistance programs (8 percent), family members or friends (7 percent), and health plan representatives (6 percent).
| Table 3: About Four in Ten Non-Group Enrollees Report Getting Help With Enrollment Process | ||||
| Total | New to non-group market | Switched plans for 2016 | Renewed 2015 plan | |
| Someone helped you | 39% | 45% | 55% | 27% |
| Health insurance broker/agent | 15 | 14 | 34 | 6 |
| Navigator/enrollment assistance program | 8 | 11 | 7 | 6 |
| Family member/friend | 7 | 8 | 7 | 6 |
| Health plan representative | 6 | 6 | 5 | 6 |
| Community/county health worker | 1 | 2 | <1 | 1 |
| Someone else | 3 | 3 | 2 | 3 |
| Completed the process on your own | 57 | 53 | 45 | 66 |
| Auto-renewed (Vol.) | 2 | — | — | 4 |
| Don’t know/Refused | 2 | 2 | 1 | 2 |
Opinions of the Affordable Care Act Among Those with Non-group Coverage
As in previous waves of the survey, and as is true among the general population, overall views of the Affordable Care Act among those with non-group coverage are largely divided, with 46 percent saying they have a favorable view of the law and 48 percent unfavorable. Even among this population – whose views one might expect to be divided more on the basis of experience – the biggest differences in opinion are along partisan lines, with 75 percent of Democrats having a favorable view of the law, 79 percent of Republicans expressing an unfavorable view, and independents divided (40 percent favorable, 44 percent unfavorable). Those with Marketplace coverage are more likely to have a favorable view of the law than those with ACA-compliant, non-Marketplace coverage (54 percent versus 34 percent).
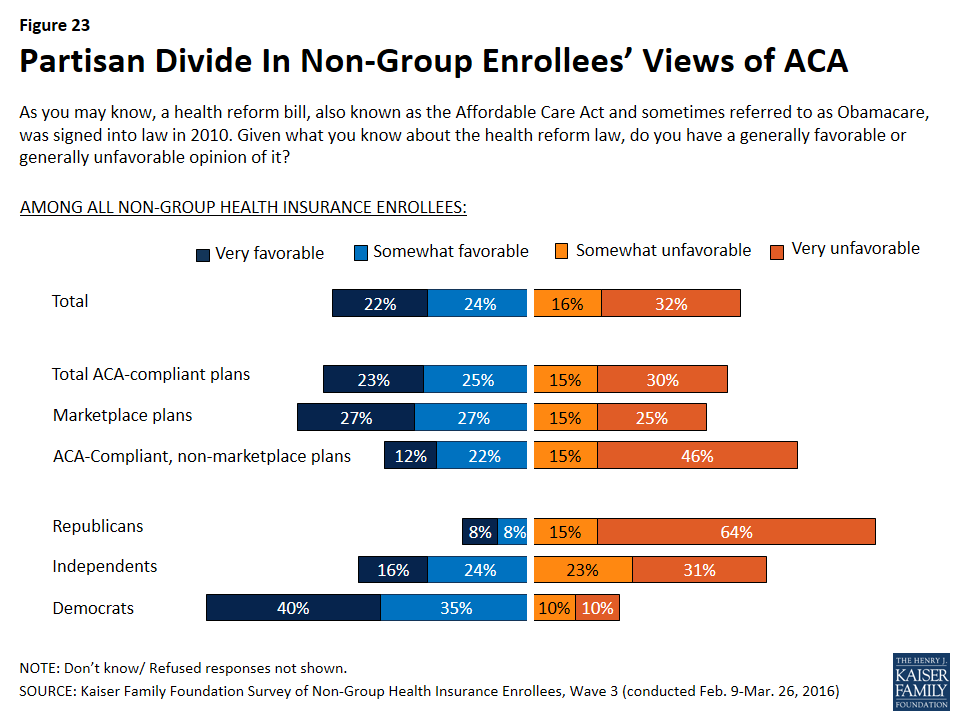
Figure 23: Partisan Divide In Non-Group Enrollees’ Views of ACA
When non-group enrollees overall (including those in both ACA-compliant and non-compliant plans) are asked how they feel the ACA has affected them personally, equal shares say they’ve benefited from the law and been negatively affected by it (40 percent each). The share feeling they’ve benefited from the law is the same as in 2015, but the share feeling they’ve been negatively impacted is up 7 percentage points from 33 percent last year. Similar to last year, the largest divide in how people feel the law has impacted them is partisan, with Democrats overwhelmingly feeling they’ve benefited and Republicans overwhelmingly feeling they’ve been negatively affected. Other differences are evident, too: those in lower-deductible plans, those in Marketplace plans, and those who report getting a tax credit to help pay their premium are more likely to feel they’ve benefited from the law, while those in higher-deductible plans, those not receiving a tax credit, and those with non-Marketplace plans are more likely to feel they’ve been negatively affected.
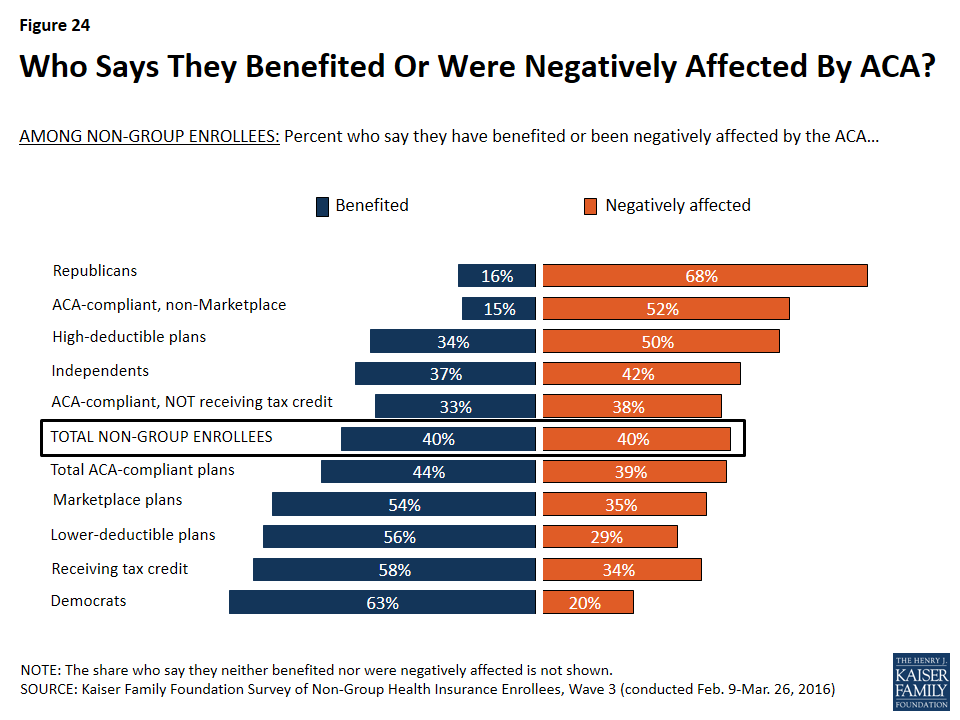
Figure 24: Who Says They Benefited Or Were Negatively Affected By ACA?
Discussion
The ACA significantly transformed the non-group insurance market, making it accessible to people who are sick and more affordable for people with lower incomes. Now in its third year of implementation, the ACA has led to substantial increases in non-group enrollment, with 12.7 million people signing up in the recent open enrollment period for 2016. However, enrollment growth appears to be slowing, raising concerns about the potential to attract additional healthy people to the insurance risk pool.7
This series of three surveys of non-group enrollees under the ACA reveals the gains that have been made and the challenges that still remain.
The process for signing up in the Marketplaces is generally seen as easy, and has improved since the early technical problems. Enrollees are largely satisfied with their coverage, including the choice of doctors and hospitals, which is typically narrower than in employer-sponsored health plans. And, many enrollees have been shopping for coverage and switching plans to save money.
At the same time, the share of enrollees who see their plan as a good value has been declining, reflecting growing dissatisfaction with premiums and cost-sharing. Some enrollees who have had their plan for a year or more report expensive drug copays, as well as surprise medical bills and other unexpected expenses they thought their plan covered.
These are important signals to track to identify potential gaps in consumer understanding of how their plans work and the adequacy and transparency of coverage. These trends also could affect the potential for Marketplaces to attract new enrollees – particularly people who are currently healthy – and retain existing consumers.