Profile of Medicare Beneficiaries by Race and Ethnicity: A Chartpack
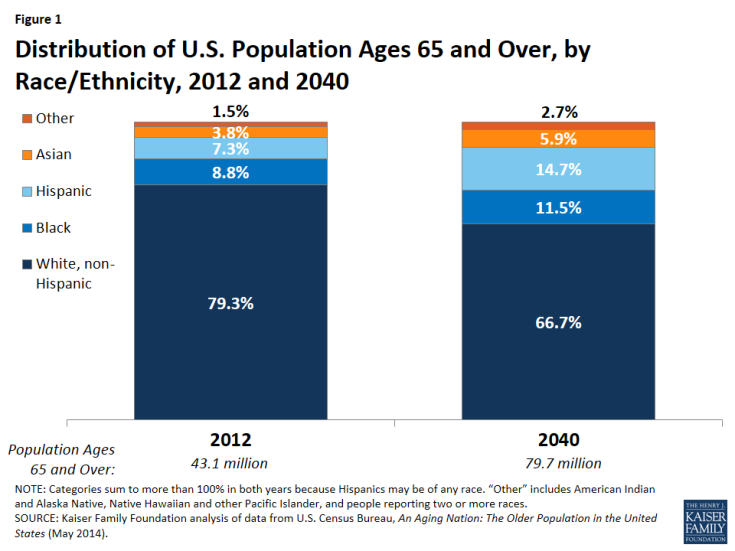
Distribution of U.S. Population Ages 65 and Over by Race/Ethnicity, 2012 and 2040
In 2012, 79.3 percent of U.S. adults ages 65 and over were white non-Hispanic, 8.8 percent were black, 7.3 percent were Hispanic, 3.8 percent were Asian, and 1.5 percent were other races (Figure 1).1 The racial and ethnic profile of people ages 65 and over is expected to shift over time. By 2040, non-Hispanic whites are projected to comprise a smaller share (66.7%) of the population ages 65 and over, while the share of Hispanics is projected to double to 14.7 percent. The share of the U.S. population ages 65 and over who are black and Asian is also projected to increase.
The distribution of all Medicare beneficiaries, including seniors and people under age 65, by race and ethnicity varies considerably across the country (Table 1). In 7 states (Alabama, Georgia, Louisiana, Maryland, Mississippi, North Carolina, and South Carolina), at least 20 percent of all Medicare beneficiaries are black—at least twice the national average—while in Washington, D.C., 68 percent of beneficiaries are black. The 5 states with the highest share of Hispanic beneficiaries are California, Florida, New Mexico, New York, and Texas.
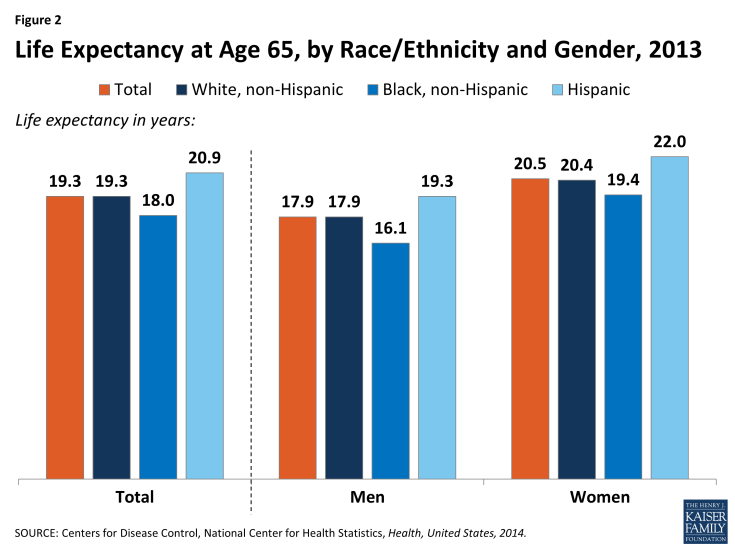
Life Expectancy at Age 65, by Race/Ethnicity and Gender, 2013
Adults in the U.S. who lived to age 65 in 2013 could expect to live another 19.3 years, on average (Figure 2). This reflects a five-year improvement in life expectancy since 1960, prior to the enactment of Medicare. Life expectancy at age 65 varies by race and ethnicity, and is lower for blacks at age 65 than for whites (18.0 years versus 19.3 years) and highest for Hispanic adults (20.9 years). This is the case despite the relatively low socioeconomic status of the Hispanic population, and has been attributed to low rates of smoking and other healthy behaviors among first-generation Hispanics.2,3 This life expectancy advantage among Hispanics is not expected to continue into the future, however, due to higher rates of smoking and obesity among second- and third- generation Hispanic adults.4 Among people in all three groups, life expectancy at age 65 is higher for women than men.
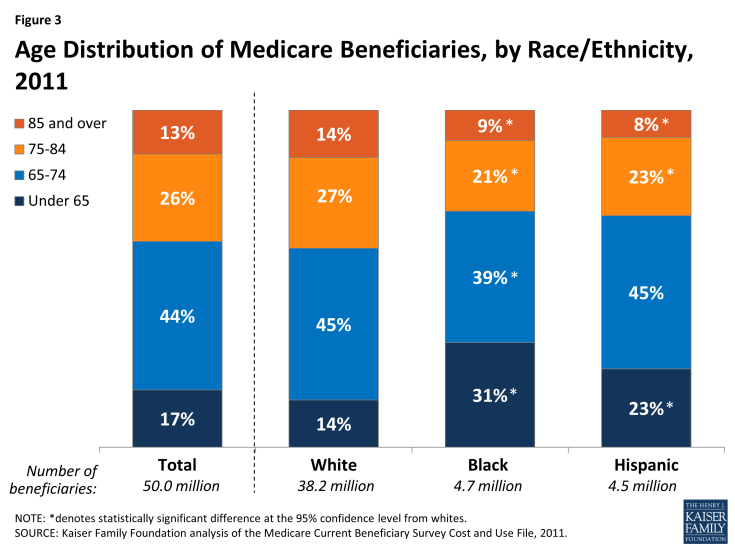
Age Distribution of Medicare Beneficiaries, by Race/Ethnicity, 2011
The majority (83%) of Medicare beneficiaries are ages 65 and older, and another 17 percent are younger than age 65 and qualify for Medicare because of a long-term disability (Figure 3, Table 2). A much larger share of black (31%) and Hispanic beneficiaries (23%) than white beneficiaries (14%) are under age 65 and living with a permanent disability. Conversely, a smaller share of black (9%) and Hispanic beneficiaries (8%) than white beneficiaries (14%) are ages 85 and over.
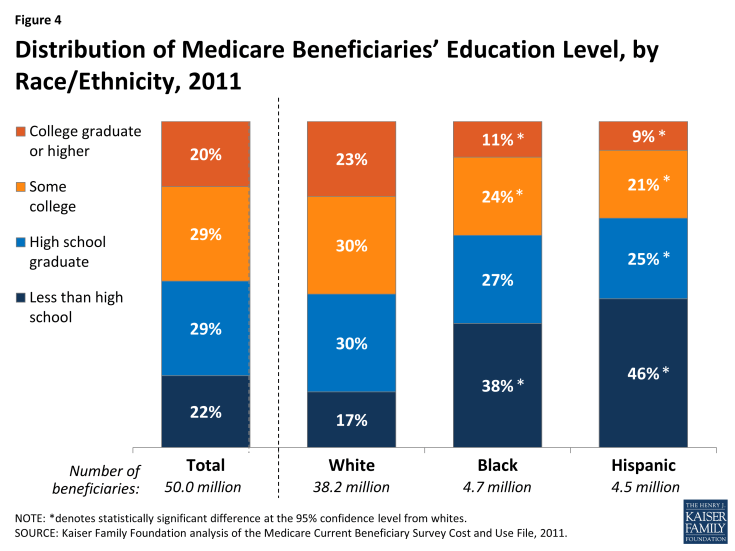
Distribution of Medicare Beneficiaries’ Education Level, by Race/Ethnicity, 2011
The education level of Medicare beneficiaries varies by race and ethnicity, with a significantly larger share of black and Hispanic beneficiaries than white beneficiaries having less than a high school education (38%, 46%, and 17%, respectively) (Figure 4, Table 2). Smaller shares of black and Hispanic beneficiaries than white beneficiaries have some college education (24%, 21%, and 30%, respectively) or a college degree (11%, 9%, and 23%, respectively).
Official and Supplemental Poverty Rates Among Adults Ages 65 and Over, by Race/Ethnicity, 2014
The rate of poverty is much higher among black and Hispanic adults ages 65 and over than among white older adults, whether measured by the official poverty measure or the Supplemental Poverty Measure (SPM) (Figure 5). The SPM differs from the official poverty measure in a number of ways, and takes into account available financial resources including liabilities (e.g., taxes), the value of in-kind benefits (e.g., food stamps), out-of-pocket medical spending (which is generally higher among older adults), geographic variation in housing expenses, and other factors.5 Under the official poverty measure, about one in five black (19%) and Hispanic (18%) seniors were living in poverty in 2014, compared to just 8 percent of white adults ages 65 and over. Rates of poverty for all three groups were higher under the SPM in 2014, with 28 percent of Hispanic seniors, 23 percent of black seniors, and 12 percent of white seniors living below the SPM poverty thresholds that year. A significantly larger share of Hispanic (65%) and black (60%) seniors than white seniors (38%) lived below 200 percent of poverty under the SPM.
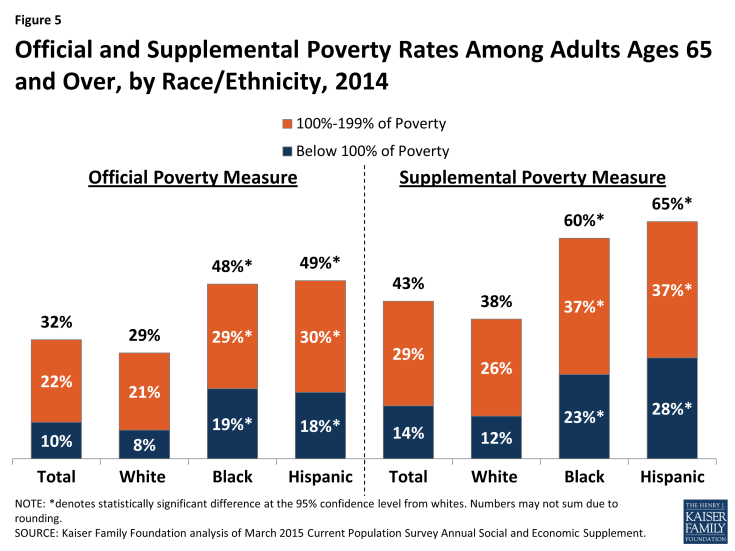
Figure 5: Official and Supplemental Poverty Rates Among Adults Ages 65 and Over, by Race/Ethnicity, 2014
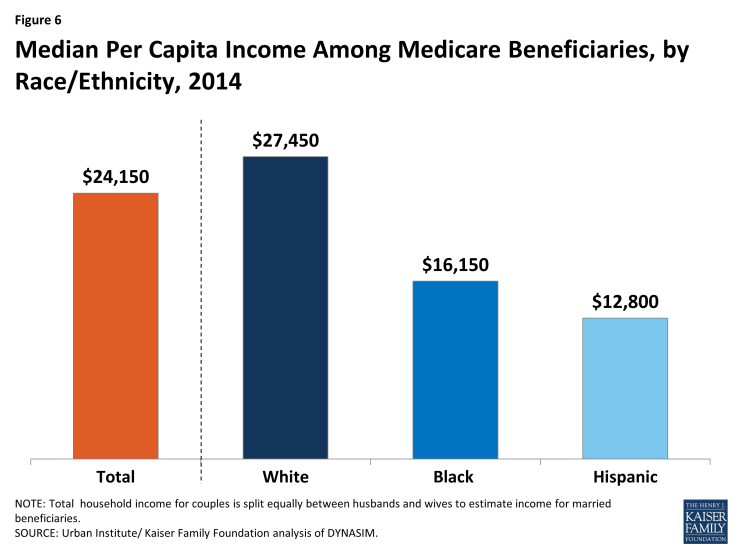
Median Per Capita Income Among Medicare Beneficiaries, by Race/Ethnicity, 2014
In 2014, half of all Medicare beneficiaries had incomes below $24,150 (Figure 6). Median per capita income was substantially lower for black and Hispanic Medicare beneficiaries ($16,150 and $12,800, respectively) than for white beneficiaries ($27,450).6
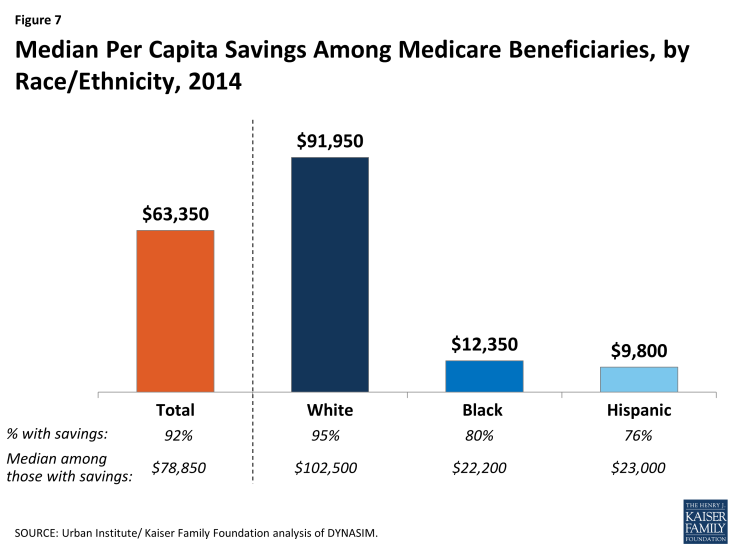
Median Per Capita Savings Among Medicare Beneficiaries, by Race/Ethnicity, 2014
In 2014, half of all Medicare beneficiaries had less than $63,350 in savings, but the amount of median per capita savings was seven times greater for white beneficiaries ($91,950) than black or Hispanic beneficiaries ($12,350 and $9,800, respectively) (Figure 7).7 Nearly all Medicare beneficiaries had some amount of savings (92%), but savings rates were higher among white beneficiaries (95%) than among black and Hispanic beneficiaries (80% and 76%, respectively). Among those with any savings, the median savings amount was roughly five times higher for white beneficiaries ($102,500) than for black and Hispanic beneficiaries ($22,200 and $23,000, respectively).
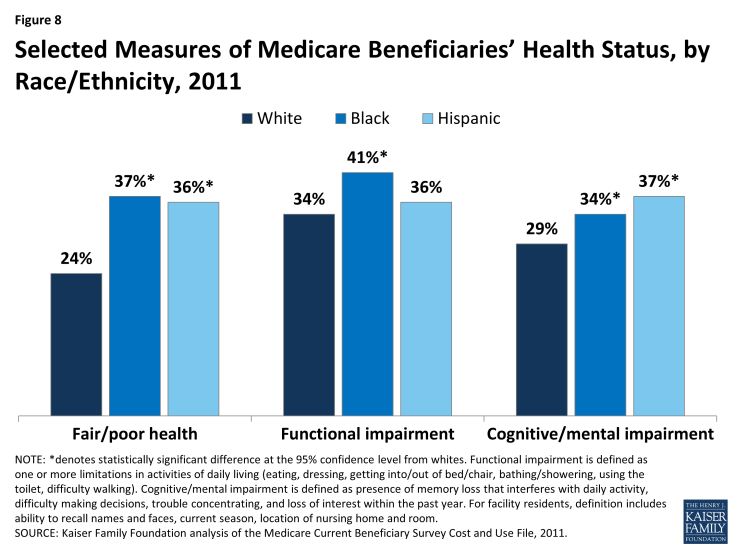
Selected Measures of Medicare Beneficiaries’ Health Status, by Race/Ethnicity, 2011
Measures of Medicare beneficiaries’ health status differ for beneficiaries of different racial and ethnic groups (Figure 8; Table 3). For example, more than one third of all black and Hispanic Medicare beneficiaries (37% and 36%, respectively) report being in fair or poor health, compared to roughly one fourth (24%) of white beneficiaries. About four in 10 black beneficiaries (41%) lives with a functional impairment, defined as having one or more limitations in activities of daily living (ADLs) such as eating or bathing, a larger share than Hispanic and white beneficiaries with functional impairments (36% and 34%, respectively). A larger share of Hispanic (37%) and black (34%) beneficiaries than white beneficiaries (29%) has a cognitive or mental impairment. Poorer health status among black and Hispanic beneficiaries may reflect the disproportionate share of beneficiaries under age 65 with permanent disabilities in these groups, as shown earlier (see Figure 3).
Prevalence of Selected Diseases/Chronic Conditions Among Medicare Beneficiaries, by Race/Ethnicity, 2011
The prevalence of chronic conditions among Medicare beneficiaries varies widely by racial and ethnic groups and by age (Figure 9; Table 3). Hypertension is common among all Medicare beneficiaries, but a larger share of black (79%) and Hispanic (73%) beneficiaries have hypertension than white beneficiaries (66%). Conversely, heart conditions, such as hardening of the arteries, angina, myocardial infarction, and congestive heart failure, are more common among white beneficiaries (41%) than among black or Hispanic beneficiaries (34% and 32%, respectively). A significantly larger share of black and Hispanic beneficiaries than white beneficiaries have diabetes (38%, 38%, and 23%, respectively), while the prevalence of depression is highest among Hispanic beneficiaries (35%) than among white or black beneficiaries. Cancer, osteoporosis, and stroke also show varying prevalence rates across different racial and ethnic groups, with rates of cancer and osteoporosis highest for white beneficiaries, and strokes affecting a larger share of black than white beneficiaries. Additionally, research has shown that the prevalence of Alzheimer’s disease increases with age, and among beneficiaries ages 85 and over, is highest among Hispanic (44%) and black (29%) beneficiaries than among white beneficiaries (22%).8
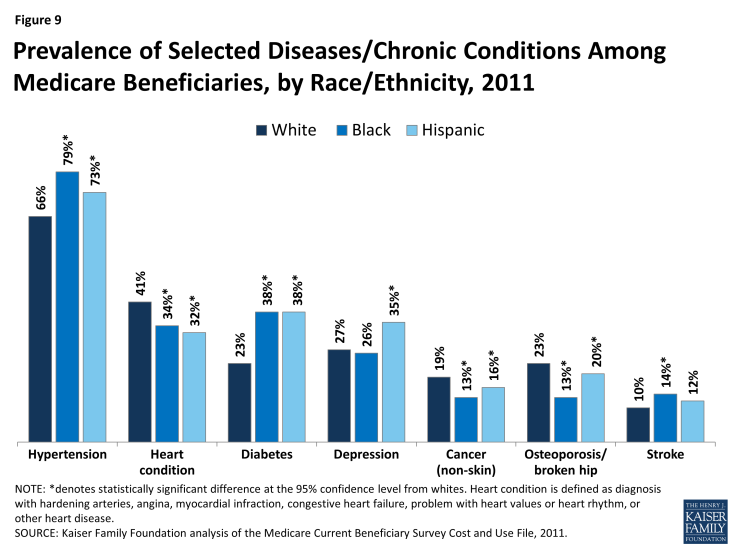
Figure 9: Prevalence of Selected Diseases/Chronic Conditions Among Medicare Beneficiaries, by Race/Ethnicity, 2011
Medicare Advantage and Sources of Supplemental Coverage Among Medicare Beneficiaries, by Race/Ethnicity, 2011
In 2011, about three in 10 (28%) Medicare beneficiaries overall were enrolled in a Medicare Advantage plan, such as an HMO or PPO, but enrollment rates were significantly higher among Hispanic beneficiaries (45%) than among black (29%) or white (26%) beneficiaries (Figure 10).
Most Medicare beneficiaries had some form of supplemental insurance coverage to help cover Medicare’s cost-sharing requirements and fill in gaps in Medicare’s benefit package, but sources of coverage varied across racial and ethnic groups. Medicaid plays a key role in supplementing Medicare for low-income Medicare beneficiaries, covering a much larger share of black (28%) and Hispanic (22%) beneficiaries than white (11%) beneficiaries. In contrast, employer-sponsored coverage is the primary source of supplemental coverage for white beneficiaries (32%) and another 17 percent have Medigap policies; both supplemental insurance types cover smaller shares of black and Hispanic beneficiaries. While a relatively small share (14%) of beneficiaries overall lacked any source of supplemental coverage in 2011, nearly one in five (19%) black beneficiaries had no form of supplemental coverage in 2011, potentially exposing them to higher out-of-pocket costs.
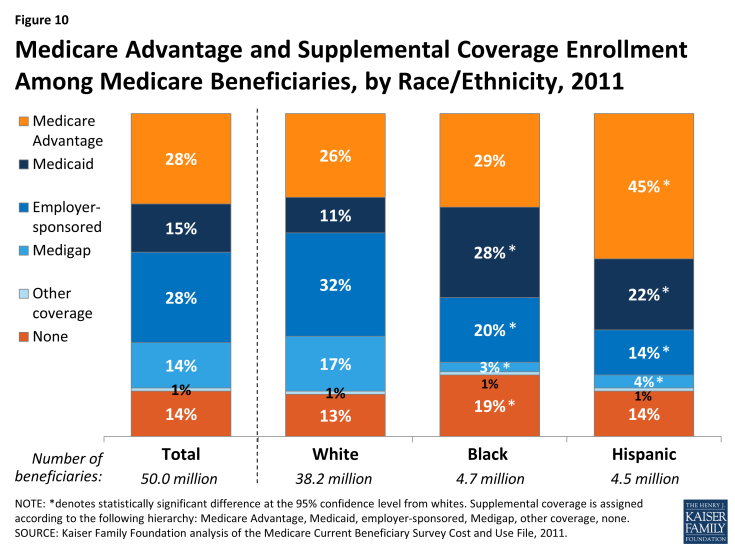
Figure 10: Prevalence of Selected Diseases/Chronic Conditions Among Medicare Beneficiaries, by Race/Ethnicity, 2011
Distribution of Race/Ethnicity of Medicare Beneficiaries Enrolled in Traditional Medicare and Medicare Advantage, 2011
Hispanic beneficiaries comprised 9 percent of the total Medicare population in 2011, but a disproportionate share (15%) of enrollees in Medicare Advantage plans (Figure 11). Relatively high Medicare Advantage enrollment among Hispanic beneficiaries is in part attributable to geography, with larger shares of Hispanic beneficiaries living in states with relatively high Medicare Advantage penetration (e.g., Florida and California).9 Black beneficiaries comprise about one in 10 Medicare beneficiaries in both traditional Medicare and Medicare Advantage. A smaller share of white beneficiaries are enrolled in Medicare Advantage (71%) than in traditional Medicare (79%).
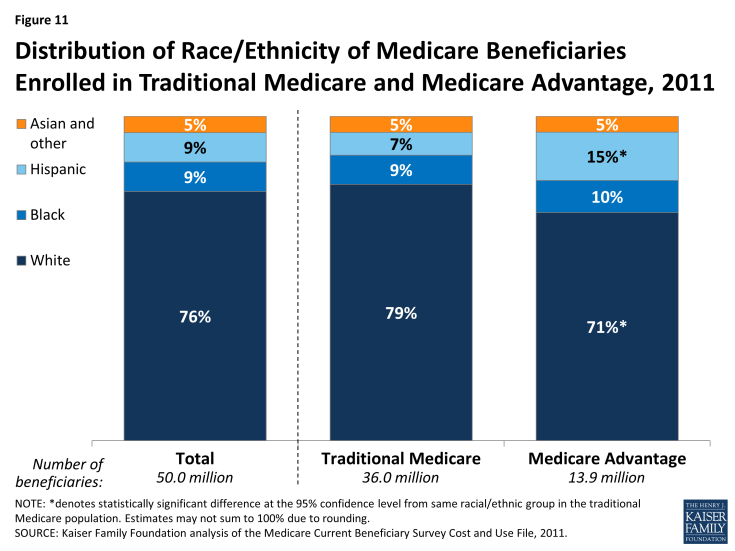
Figure 11: Distribution of Race/Ethnicity of Medicare Beneficiaries Enrolled in Traditional Medicare and Medicare Advantage, 2011
Distribution of Race/Ethnicity of Medicare Beneficiaries By Medicaid Enrollment (Dually Eligible), 2011
Nearly 10 million Medicare beneficiaries with low incomes and modest savings receive additional assistance from the Medicaid program, which includes premium assistance and may include cost-sharing assistance for Medicare-covered services along with extra benefits Medicare does not cover, such as dental and long-term services and supports (Figure 12). The dually eligible beneficiary population has a very different racial and ethnic composition than the non-dually eligible population. Black and Hispanic beneficiaries comprise 15 percent of non-dually eligible beneficiaries, but one third (33%) of beneficiaries who are dually eligible for Medicare and Medicaid, consistent with these groups having generally lower incomes and fewer resources than white beneficiaries.
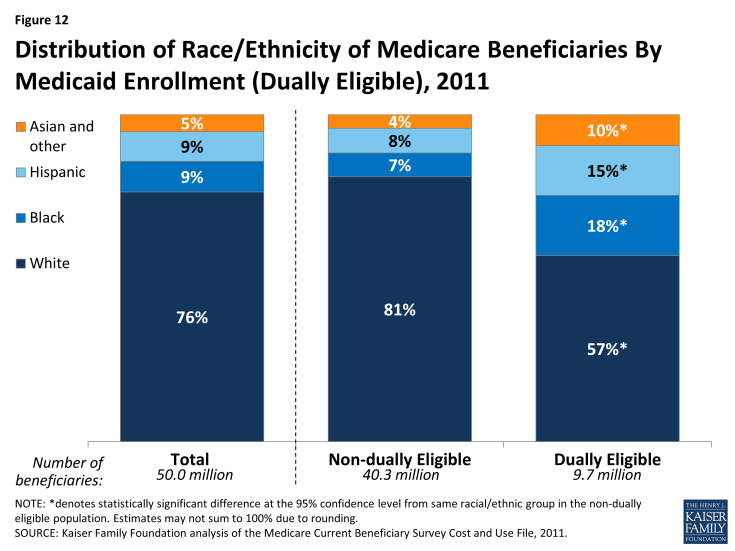
Figure 12: Distribution of Race/Ethnicity of Medicare Beneficiaries By Medicaid Enrollment (Dually Eligible), 2011
Percent of Medicare Beneficiaries with Part D Prescription Drug Coverage and Low Income Subsidies (LIS), 2011
The Medicare Part D prescription drug benefit is an important source of drug coverage for Medicare beneficiaries. More than half of all Medicare beneficiaries (57%) were enrolled in a Part D drug plan in 2011, but a larger share of black (66%) and Hispanic (71%) beneficiaries than white beneficiaries (55%) had Part D drug coverage (Figure 13). A smaller share of white beneficiaries may be enrolled in Part D than other beneficiaries because they are more likely to have drug coverage through an employer-sponsored plan (see Figure 10). Medicare beneficiaries with low income and modest assets may qualify for additional financial premium and cost-sharing assistance through the Part D low-income subsidy (LIS) program. Nearly half of all black beneficiaries (46%) and more than one third of all Hispanic beneficiaries (38%) receive LIS under Part D, larger than the share of white beneficiaries with LIS (17%), due to lower levels of income and assets among black and Hispanic beneficiaries.
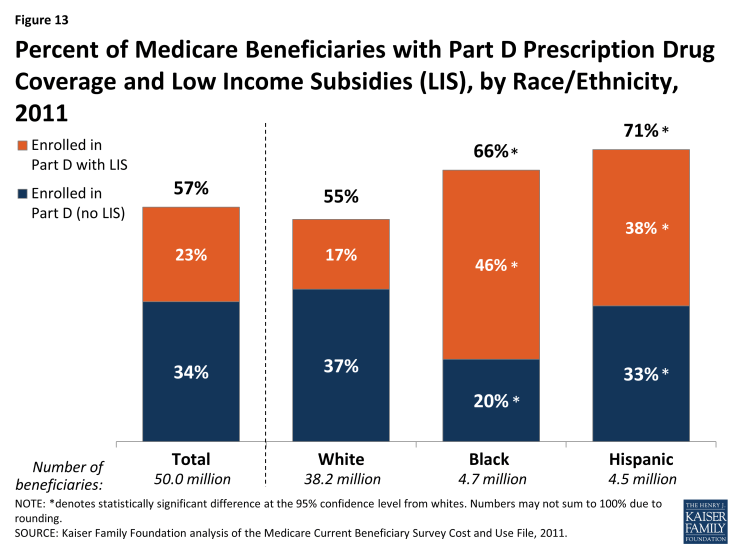
Figure 13: Percent of Medicare Beneficiaries with Part D Prescription Drug Coverage and Low Income Subsidies (LIS), by Race/Ethnicity, 2011
Percent of Medicare Beneficiaries Reporting Problems with Access to Care, by Race/Ethnicity, 2013
Overall, Medicare beneficiaries have broad access to physicians, hospitals, and other health care providers, and report generally low rates of problems across a number of access measures. Some variation is seen, however, by race and ethnicity (Figure 14; Table 4). A slightly larger share of Hispanic (8%) than white beneficiaries (4%) report not having a usual source of care to go to when they are sick or seeking medical advice, while a somewhat larger share of black and Hispanic beneficiaries (7% and 9%, respectively) report trouble getting needed care than whites (5%).
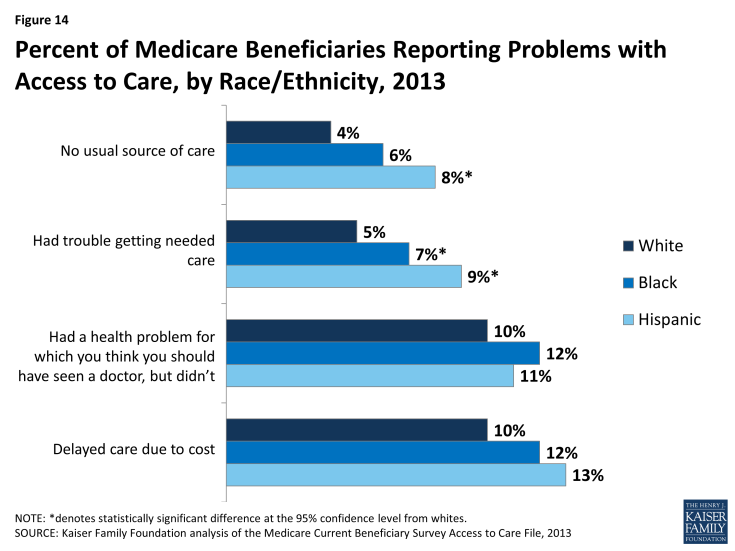
Figure 14: Percent of Medicare Beneficiaries Reporting Problems with Access to Care, by Race/Ethnicity, 2013
Percent of Medicare Beneficiaries with One or More Physician Office Visits and with Any Dental Events During the Year, by Race/Ethnicity, 2011
The majority of all beneficiaries in traditional Medicare saw a physician in 2011, with a somewhat larger share of white beneficiaries (80%) having a physician office visit than black or Hispanic beneficiaries (71% and 68%, respectively) (Figure 15; Table 5). In contrast, less than half of all beneficiaries in traditional Medicare had any dental events during the year, but larger differences by race and ethnicity are observed for using dental services. Nearly half of white beneficiaries (47%) had a dental event during the year, a significantly larger share than among black (27%) and Hispanic (30%) beneficiaries.10 The smaller share of beneficiaries seeing a dentist during the year than a physician is likely due to the lack of coverage under traditional Medicare for routine dental care (including checkups, fillings, dentures, and root canals) and the out-of-pocket costs associated with dental care.11
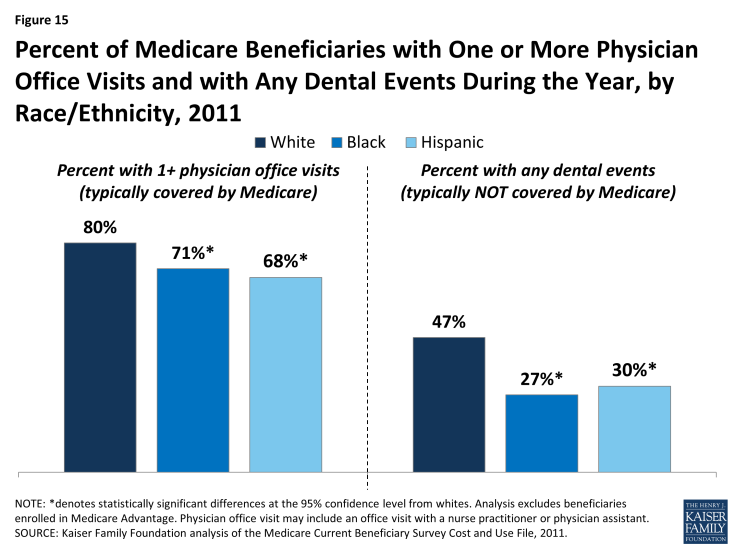
Figure 15: Percent of Medicare Beneficiaries with One or More Physician Office Visits and with Any Dental Events During the Year, by Race/Ethnicity, 2011
Percent of Medicare Beneficiaries with an Inpatient Hospital Stay and with an Emergency Department Visit During the Year, by Race/Ethnicity and Self-reported Health Status, 2011
Among beneficiaries enrolled in traditional Medicare, some differences by race and ethnicity are observed in the share of beneficiaries with one or more inpatient hospital stays and emergency department visits in the year (Figure 16; Table 5). For instance, a smaller share of Hispanic beneficiaries had an inpatient hospital stay in 2011 than white beneficiaries (15% versus 19%), and a larger share of black beneficiaries had one or more emergency department visits in the year compared with whites (37% versus 28%). This variation is likely related to overall differences in health status by race and ethnicity, as discussed earlier. That is, as health status worsens, higher rates of hospitalizations are to be expected. In fact, no statistically significant differences between whites and people of color are seen in the share of beneficiaries reporting fair or poor health who had at least one inpatient hospitalization or emergency department visit. In contrast, among beneficiaries in relatively better health (defined as excellent, very good, or good self-reported health status), a larger share of black beneficiaries (30%) had an emergency department visit compared to white beneficiaries (22%); and a smaller share of Hispanic beneficiaries had an inpatient hospital stay (8%) than white beneficiaries (15%).
Additionally, a larger share of black beneficiaries than white beneficiaries had two or more hospital stays during the year in 2011 (10% versus 6%) (Table 5)—a difference also observed among beneficiaries in fair or poor health (18% of black beneficiaries versus 13% of white beneficiaries). Hospital readmissions, which have been found to be higher among black beneficiaries, may be a factor in these results.12,13
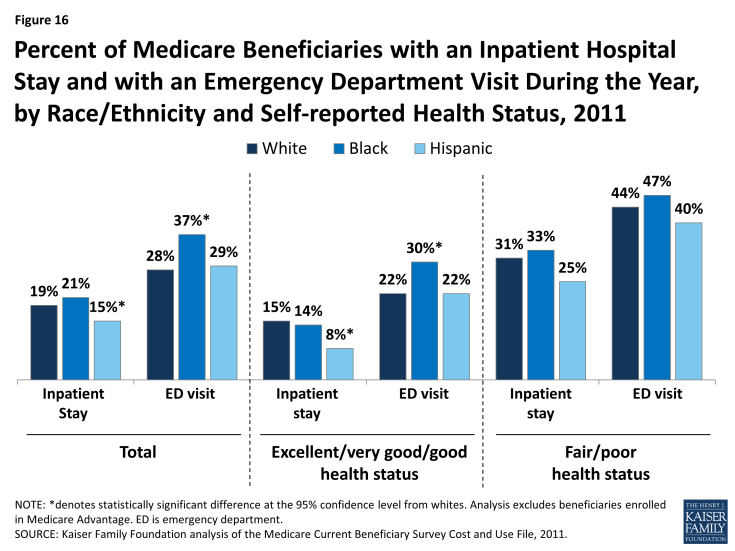
Figure 16: Percent of Medicare Beneficiaries with an Inpatient Hospital Stay and with an Emergency Department Visit During the Year, by Race/Ethnicity and Self-reported Health Status, 2011
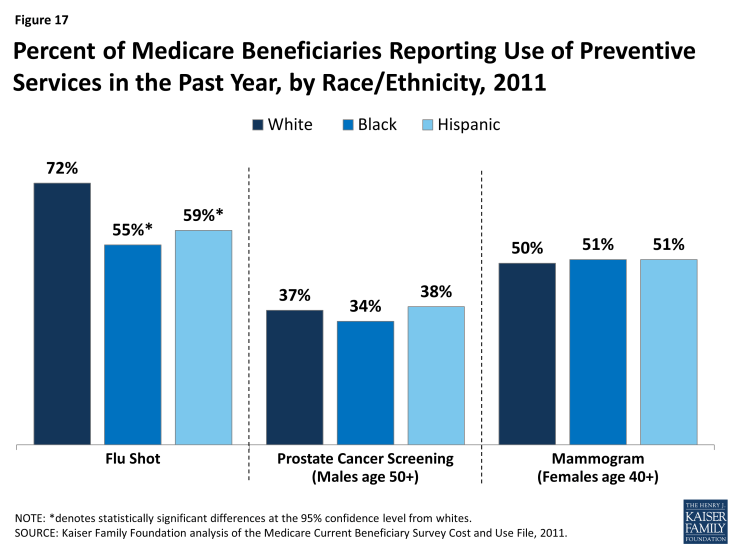
Percent of Medicare Beneficiaries Reporting Use of Preventive Services in the Past Year, by Race/Ethnicity, 2011
Medicare covers routine preventive services, such as annual wellness exams and immunizations. In 2011, the share of beneficiaries receiving an influenza vaccination in the past year was higher among white beneficiaries (72%) than among black (55%) and Hispanic beneficiaries (59%) (Figure 17). Overall, more than one-third (37%) of male beneficiaries ages 50 and older reported receiving a prostate cancer screening in 2011, with no statistically significant differences by race or ethnicity. And half (50%) of all female beneficiaries ages 40 and older reported receiving a mammogram in the past year, with no significant differences by race or ethnicity. Previous research has identified racial and ethnic disparities in receipt of mammograms, but more recent research suggests that this gap has narrowed, consistent with the findings presented here.14

