Medicare Part D: A First Look at Prescription Drug Plans in 2017
Appendix 1: Information about Medicare Part D Stand-alone Prescription Drug Plans (PDPs) by State
| Table A1: Number of PDPs by State, 2006-2017 | |||||||||||||
| STATE/ TERRITORY | 2006 | 2007 | 2008 | 2009 | 2010 | 2011 | 2012 | 2013 | 2014 | 2015 | 2016 | 2017 | 2016-2017 change |
| U.S. Total | 1,429 | 1,875 | 1,824 | 1,689 | 1,576 | 1,109 | 1,041 | 1,031 | 1,169 | 1,001 | 886 | 746 | -140 |
| Alabama | 41 | 56 | 53 | 49 | 46 | 34 | 32 | 33 | 35 | 30 | 27 | 24 | -3 |
| Alaska | 27 | 45 | 47 | 45 | 41 | 29 | 25 | 23 | 28 | 24 | 19 | 18 | -1 |
| Arizona | 43 | 53 | 51 | 49 | 46 | 30 | 30 | 29 | 34 | 30 | 26 | 22 | -4 |
| Arkansas | 40 | 58 | 55 | 52 | 49 | 34 | 30 | 30 | 34 | 29 | 26 | 22 | -4 |
| California | 47 | 55 | 56 | 51 | 47 | 33 | 33 | 32 | 36 | 32 | 28 | 24 | -4 |
| Colorado | 43 | 55 | 55 | 53 | 48 | 31 | 28 | 29 | 34 | 30 | 26 | 23 | -3 |
| Connecticut | 44 | 51 | 51 | 47 | 48 | 34 | 30 | 30 | 33 | 27 | 26 | 21 | -5 |
| Delaware | 47 | 55 | 52 | 48 | 45 | 33 | 31 | 29 | 36 | 27 | 24 | 20 | -4 |
| District of Columbia | 47 | 55 | 52 | 48 | 45 | 33 | 31 | 29 | 36 | 27 | 24 | 20 | -4 |
| Florida | 43 | 57 | 58 | 54 | 49 | 32 | 33 | 34 | 35 | 27 | 22 | 20 | -2 |
| Georgia | 42 | 55 | 54 | 50 | 45 | 32 | 30 | 30 | 34 | 30 | 27 | 23 | -4 |
| Hawaii | 29 | 46 | 49 | 47 | 41 | 28 | 25 | 23 | 29 | 25 | 21 | 19 | -2 |
| Idaho | 44 | 56 | 54 | 51 | 48 | 35 | 33 | 32 | 37 | 31 | 28 | 24 | -4 |
| Illinois | 42 | 56 | 53 | 49 | 46 | 35 | 33 | 32 | 38 | 33 | 28 | 23 | -5 |
| Indiana | 42 | 53 | 52 | 48 | 44 | 32 | 31 | 31 | 35 | 31 | 28 | 23 | -5 |
| Iowa | 41 | 53 | 52 | 48 | 46 | 33 | 33 | 32 | 34 | 30 | 26 | 22 | -4 |
| Kansas | 40 | 53 | 52 | 48 | 46 | 33 | 31 | 30 | 33 | 29 | 25 | 22 | -3 |
| Kentucky | 42 | 53 | 52 | 48 | 44 | 32 | 31 | 31 | 35 | 31 | 28 | 23 | -5 |
| Louisiana | 39 | 52 | 50 | 47 | 45 | 32 | 30 | 30 | 33 | 28 | 25 | 20 | -5 |
| Maine | 41 | 53 | 53 | 46 | 43 | 30 | 28 | 28 | 32 | 28 | 27 | 23 | -4 |
| Maryland | 47 | 55 | 52 | 48 | 45 | 33 | 31 | 29 | 36 | 27 | 24 | 20 | -4 |
| Massachusetts | 44 | 51 | 51 | 47 | 48 | 34 | 30 | 30 | 33 | 27 | 26 | 21 | -5 |
| Michigan | 40 | 54 | 55 | 51 | 46 | 35 | 34 | 33 | 36 | 31 | 28 | 23 | -5 |
| Minnesota | 41 | 53 | 52 | 48 | 46 | 33 | 33 | 32 | 34 | 30 | 26 | 22 | -4 |
| Mississippi | 38 | 52 | 49 | 47 | 45 | 32 | 30 | 29 | 33 | 28 | 24 | 19 | -5 |
| Missouri | 41 | 53 | 52 | 48 | 45 | 32 | 30 | 31 | 35 | 31 | 28 | 23 | -5 |
| Montana | 41 | 53 | 52 | 48 | 46 | 33 | 33 | 32 | 34 | 30 | 26 | 22 | -4 |
| Nebraska | 41 | 53 | 52 | 48 | 46 | 33 | 33 | 32 | 34 | 30 | 26 | 22 | -4 |
| Nevada | 44 | 54 | 53 | 49 | 46 | 31 | 29 | 29 | 34 | 32 | 28 | 23 | -5 |
| New Hampshire | 41 | 53 | 53 | 46 | 43 | 30 | 28 | 28 | 32 | 28 | 27 | 23 | -4 |
| New Jersey | 44 | 57 | 57 | 52 | 47 | 33 | 30 | 29 | 34 | 29 | 25 | 21 | -4 |
| New Mexico | 43 | 57 | 55 | 50 | 47 | 32 | 30 | 30 | 36 | 31 | 27 | 23 | -4 |
| New York | 46 | 61 | 55 | 51 | 50 | 33 | 29 | 28 | 31 | 25 | 22 | 19 | -3 |
| North Carolina | 38 | 51 | 52 | 49 | 47 | 33 | 30 | 30 | 34 | 29 | 26 | 22 | -4 |
| North Dakota | 41 | 53 | 52 | 48 | 46 | 33 | 33 | 32 | 34 | 30 | 26 | 22 | -4 |
| Ohio | 43 | 60 | 58 | 49 | 46 | 34 | 33 | 33 | 37 | 31 | 27 | 22 | -5 |
| Oklahoma | 42 | 56 | 52 | 49 | 46 | 33 | 30 | 30 | 36 | 31 | 27 | 22 | -5 |
| Oregon | 45 | 57 | 55 | 48 | 44 | 32 | 30 | 30 | 35 | 30 | 26 | 21 | -5 |
| Pennsylvania | 52 | 66 | 63 | 57 | 55 | 38 | 36 | 38 | 39 | 29 | 29 | 24 | -5 |
| Rhode Island | 44 | 51 | 51 | 47 | 48 | 34 | 30 | 30 | 33 | 27 | 26 | 21 | -5 |
| South Carolina | 45 | 59 | 56 | 53 | 47 | 34 | 32 | 31 | 35 | 31 | 27 | 21 | -6 |
| South Dakota | 41 | 53 | 52 | 48 | 46 | 33 | 33 | 32 | 34 | 30 | 26 | 22 | -4 |
| Tennessee | 41 | 56 | 53 | 49 | 46 | 34 | 32 | 33 | 35 | 30 | 27 | 24 | -3 |
| Texas | 47 | 60 | 56 | 53 | 50 | 33 | 33 | 32 | 36 | 32 | 28 | 23 | -5 |
| Utah | 44 | 56 | 54 | 51 | 48 | 35 | 33 | 32 | 37 | 31 | 28 | 24 | -4 |
| Vermont | 44 | 51 | 51 | 47 | 48 | 34 | 30 | 30 | 33 | 27 | 26 | 21 | -5 |
| Virginia | 41 | 53 | 52 | 48 | 44 | 32 | 30 | 31 | 35 | 31 | 28 | 23 | -5 |
| Washington | 45 | 57 | 55 | 48 | 44 | 32 | 30 | 30 | 35 | 30 | 26 | 21 | -5 |
| West Virginia | 52 | 66 | 63 | 57 | 55 | 38 | 36 | 38 | 39 | 29 | 29 | 24 | -5 |
| Wisconsin | 45 | 54 | 57 | 53 | 48 | 32 | 29 | 30 | 33 | 29 | 27 | 24 | -3 |
| Wyoming | 41 | 53 | 52 | 48 | 46 | 33 | 33 | 32 | 34 | 30 | 26 | 22 | -4 |
| TERRITORY | |||||||||||||
| American Samoa | 1 | 3 | 4 | 4 | 3 | 2 | 1 | 1 | 1 | 1 | 1 | 1 | — |
| Guam | 1 | 3 | 4 | 4 | 3 | 2 | 1 | 1 | 1 | 2 | 2 | 2 | — |
| Northern Mariana Islands | 1 | 3 | 4 | 4 | 3 | 2 | 1 | 1 | 1 | 1 | 1 | 1 | — |
| Puerto Rico | 10 | 28 | 34 | 33 | 29 | 17 | 16 | 16 | 13 | 7 | 6 | 6 | — |
| Virgin Islands | 4 | 6 | 7 | 7 | 6 | 4 | 3 | 1 | 1 | 1 | 1 | 1 | — |
| NOTE: PDP is prescription drug plan. 2017 counts include 68 plans under sanction and closed to new enrollees as of September 2016. “–“ indicates no change in plan availability. SOURCE: Georgetown/Kaiser Family Foundation analysis of Centers for Medicare & Medicaid Services 2006-2017 Part D plan files. |
|||||||||||||
| Table A2: Monthly Premiums for PDPs by State, 2017 | ||||
| STATE/TERRITORY | Minimum Premium | Maximum Premium | Weighted Average Premium | % Change, 2016-2017 |
| U.S. Total | $14.60 | $179.00 | $42.18 | 9% |
| Alabama | $17.00 | $118.00 | $42.17 | 7% |
| Alaska | $17.00 | $108.30 | $41.05 | 2% |
| Arizona | $17.00 | $115.10 | $43.26 | 18% |
| Arkansas | $15.70 | $134.00 | $33.70 | 7% |
| California | $17.00 | $159.80 | $47.24 | 20% |
| Colorado | $17.00 | $179.00 | $40.75 | 6% |
| Connecticut | $14.60 | $127.70 | $41.30 | 8% |
| Delaware | $14.60 | $125.70 | $41.78 | 7% |
| District of Columbia | $14.60 | $125.70 | $41.78 | 7% |
| Florida | $17.00 | $172.00 | $45.04 | 6% |
| Georgia | $14.60 | $167.30 | $39.68 | 9% |
| Hawaii | $17.00 | $75.20 | $33.83 | 9% |
| Idaho | $17.00 | $159.30 | $42.88 | 7% |
| Illinois | $17.00 | $163.70 | $43.82 | 10% |
| Indiana | $15.00 | $152.60 | $39.91 | 7% |
| Iowa | $17.00 | $101.80 | $35.77 | 5% |
| Kansas | $17.00 | $151.30 | $41.25 | 10% |
| Kentucky | $15.00 | $152.60 | $39.91 | 7% |
| Louisiana | $17.00 | $111.60 | $36.98 | 10% |
| Maine | $14.60 | $144.70 | $41.33 | 11% |
| Maryland | $14.60 | $125.70 | $41.78 | 7% |
| Massachusetts | $14.60 | $127.70 | $41.30 | 8% |
| Michigan | $14.60 | $124.80 | $42.43 | 7% |
| Minnesota | $17.00 | $101.80 | $35.77 | 5% |
| Mississippi | $17.00 | $97.90 | $36.88 | 9% |
| Missouri | $17.00 | $149.20 | $39.97 | 13% |
| Montana | $17.00 | $101.80 | $35.77 | 5% |
| Nebraska | $17.00 | $101.80 | $35.77 | 5% |
| Nevada | $17.00 | $157.10 | $41.27 | 11% |
| New Hampshire | $14.60 | $144.70 | $41.33 | 11% |
| New Jersey | $17.00 | $121.00 | $50.95 | 11% |
| New Mexico | $17.00 | $151.30 | $31.27 | 13% |
| New York | $14.60 | $106.40 | $46.20 | 12% |
| North Carolina | $14.60 | $124.00 | $43.44 | 10% |
| North Dakota | $17.00 | $101.80 | $35.77 | 5% |
| Ohio | $14.60 | $157.40 | $39.43 | 12% |
| Oklahoma | $17.00 | $166.80 | $41.83 | 7% |
| Oregon | $14.60 | $163.00 | $39.17 | 5% |
| Pennsylvania | $14.60 | $170.60 | $41.42 | 7% |
| Rhode Island | $14.60 | $127.70 | $41.30 | 8% |
| South Carolina | $14.60 | $120.50 | $39.06 | 3% |
| South Dakota | $17.00 | $101.80 | $35.77 | 5% |
| Tennessee | $17.00 | $118.00 | $42.17 | 7% |
| Texas | $17.00 | $170.50 | $41.62 | 5% |
| Utah | $17.00 | $159.30 | $42.88 | 7% |
| Vermont | $14.60 | $127.70 | $41.30 | 8% |
| Virginia | $17.00 | $151.50 | $44.58 | 10% |
| Washington | $14.60 | $163.00 | $39.17 | 5% |
| West Virginia | $14.60 | $170.60 | $41.42 | 7% |
| Wisconsin | $17.00 | $155.70 | $43.68 | 8% |
| Wyoming | $17.00 | $101.80 | $35.77 | 5% |
| TERRITORY | ||||
| American Samoa | $33.20 | $33.20 | $33.20 | 30% |
| Guam | $41.70 | $46.60 | $41.74 | 45% |
| Northern Mariana Islands | $38.50 | $38.50 | $38.50 | 102% |
| Puerto Rico | $12.90 | $74.50 | $46.55 | 14% |
| Virgin Islands | $41.50 | $41.50 | $41.50 | 9% |
| NOTE: PDP is prescription drug plan. Includes 68 plans under sanction and closed to new enrollees as of September 2016. Average monthly premium is weighted by 2015 enrollments for the region in which the state is located. Terminated plans are excluded in calculation of premium change. SOURCE: Georgetown/Kaiser Family Foundation analysis of Centers for Medicare & Medicaid Services 2016-2017 Part D plan files. |
||||
| Table A3: Number of PDPs Below Low-Income Subsidy Benchmark by State, 2006-2017 | |||||||||||||
| STATE | 2006 | 2007 | 2008 | 2009 | 2010 | 2011 | 2012 | 2013 | 2014 | 2015 | 2016 | 2017 | 2016-2017 change |
| U.S. Total | 409 | 640 | 495 | 308 | 307 | 332 | 327 | 331 | 352 | 283 | 226 | 231 | +5 |
| Alabama | 9 | 17 | 15 | 12 | 9 | 11 | 12 | 13 | 11 | 12 | 8 | 7 | -1 |
| Alaska | 8 | 17 | 15 | 7 | 6 | 5 | 4 | 7 | 11 | 7 | 6 | 5 | -1 |
| Arizona | 6 | 10 | 7 | 2 | 8 | 9 | 10 | 10 | 11 | 12 | 10 | 10 | — |
| Arkansas | 13 | 23 | 18 | 12 | 15 | 17 | 15 | 15 | 12 | 6 | 4 | 5 | +1 |
| California | 10 | 14 | 9 | 6 | 7 | 5 | 6 | 6 | 9 | 6 | 6 | 6 | — |
| Colorado | 10 | 19 | 12 | 8 | 6 | 7 | 5 | 4 | 5 | 7 | 6 | 7 | +1 |
| Connecticut | 11 | 20 | 14 | 12 | 13 | 12 | 10 | 6 | 8 | 5 | 6 | 7 | +1 |
| Delaware | 15 | 21 | 18 | 11 | 11 | 12 | 13 | 13 | 13 | 10 | 9 | 10 | +1 |
| District of Columbia | 15 | 21 | 18 | 11 | 11 | 12 | 13 | 13 | 13 | 10 | 9 | 10 | +1 |
| Florida | 6 | 10 | 8 | 5 | 5 | 4 | 3 | 2 | 5 | 4 | 3 | 3 | — |
| Georgia | 14 | 21 | 18 | 11 | 8 | 14 | 12 | 13 | 9 | 8 | 5 | 4 | -1 |
| Hawaii | 8 | 18 | 10 | 5 | 7 | 6 | 10 | 10 | 4 | 9 | 2 | 5 | +3 |
| Idaho | 14 | 20 | 14 | 9 | 9 | 11 | 12 | 10 | 13 | 12 | 10 | 9 | -1 |
| Illinois | 15 | 23 | 19 | 12 | 10 | 10 | 10 | 10 | 14 | 10 | 9 | 9 | — |
| Indiana | 13 | 19 | 17 | 12 | 9 | 14 | 13 | 11 | 15 | 10 | 7 | 7 | — |
| Iowa | 14 | 20 | 16 | 9 | 8 | 10 | 9 | 8 | 10 | 5 | 5 | 6 | +1 |
| Kansas | 11 | 20 | 17 | 10 | 9 | 12 | 10 | 10 | 13 | 7 | 5 | 5 | — |
| Kentucky | 13 | 19 | 17 | 12 | 9 | 14 | 13 | 11 | 15 | 10 | 7 | 7 | — |
| Louisiana | 11 | 12 | 10 | 7 | 13 | 10 | 12 | 14 | 14 | 11 | 7 | 7 | — |
| Maine | 14 | 21 | 18 | 5 | 4 | 7 | 8 | 10 | 7 | 9 | 9 | 8 | -1 |
| Maryland | 15 | 21 | 18 | 11 | 11 | 12 | 13 | 13 | 13 | 10 | 9 | 10 | +1 |
| Massachusetts | 11 | 20 | 14 | 12 | 13 | 12 | 10 | 6 | 8 | 5 | 6 | 7 | +1 |
| Michigan | 14 | 26 | 17 | 11 | 9 | 12 | 12 | 10 | 13 | 10 | 8 | 8 | — |
| Minnesota | 14 | 20 | 16 | 9 | 8 | 10 | 9 | 8 | 10 | 5 | 5 | 6 | +1 |
| Mississippi | 12 | 21 | 15 | 13 | 10 | 14 | 12 | 13 | 13 | 9 | 6 | 7 | +1 |
| Missouri | 10 | 15 | 13 | 6 | 13 | 5 | 8 | 8 | 8 | 6 | 4 | 4 | — |
| Montana | 14 | 20 | 16 | 9 | 8 | 10 | 9 | 8 | 10 | 5 | 5 | 6 | +1 |
| Nebraska | 14 | 20 | 16 | 9 | 8 | 10 | 9 | 8 | 10 | 5 | 5 | 6 | +1 |
| Nevada | 7 | 9 | 5 | 1 | 5 | 4 | 2 | 2 | 4 | 4 | 4 | 4 | — |
| New Hampshire | 14 | 21 | 18 | 5 | 4 | 7 | 8 | 10 | 7 | 9 | 9 | 8 | -1 |
| New Jersey | 14 | 20 | 18 | 7 | 6 | 6 | 9 | 10 | 12 | 10 | 8 | 8 | — |
| New Mexico | 8 | 14 | 11 | 7 | 8 | 8 | 6 | 7 | 7 | 7 | 8 | 9 | +1 |
| New York | 15 | 16 | 15 | 9 | 11 | 11 | 12 | 12 | 8 | 8 | 8 | 8 | — |
| North Carolina | 13 | 21 | 17 | 11 | 8 | 11 | 9 | 8 | 10 | 8 | 7 | 7 | — |
| North Dakota | 14 | 20 | 16 | 9 | 8 | 10 | 9 | 8 | 10 | 5 | 5 | 6 | +1 |
| Ohio | 10 | 22 | 15 | 6 | 5 | 8 | 8 | 8 | 12 | 8 | 5 | 6 | +1 |
| Oklahoma | 12 | 20 | 13 | 8 | 10 | 10 | 9 | 11 | 12 | 10 | 6 | 7 | +1 |
| Oregon | 15 | 20 | 15 | 7 | 9 | 8 | 9 | 10 | 12 | 10 | 9 | 8 | -1 |
| Pennsylvania | 15 | 26 | 18 | 9 | 11 | 12 | 12 | 14 | 13 | 9 | 10 | 9 | -1 |
| Rhode Island | 11 | 20 | 14 | 12 | 13 | 12 | 10 | 6 | 8 | 5 | 6 | 7 | +1 |
| South Carolina | 16 | 26 | 20 | 15 | 13 | 15 | 12 | 14 | 8 | 7 | 4 | 6 | +2 |
| South Dakota | 14 | 20 | 16 | 9 | 8 | 10 | 9 | 8 | 10 | 5 | 5 | 6 | +1 |
| Tennessee | 9 | 17 | 15 | 12 | 9 | 11 | 12 | 13 | 11 | 12 | 8 | 7 | -1 |
| Texas | 16 | 19 | 15 | 14 | 11 | 12 | 13 | 12 | 11 | 10 | 8 | 6 | -2 |
| Utah | 14 | 20 | 14 | 9 | 9 | 11 | 12 | 10 | 13 | 12 | 10 | 9 | -1 |
| Vermont | 11 | 20 | 14 | 12 | 13 | 12 | 10 | 6 | 8 | 5 | 6 | 7 | +1 |
| Virginia | 16 | 21 | 17 | 13 | 11 | 10 | 10 | 10 | 13 | 9 | 7 | 7 | — |
| Washington | 15 | 20 | 15 | 7 | 9 | 8 | 9 | 10 | 12 | 10 | 9 | 8 | -1 |
| West Virginia | 15 | 26 | 18 | 9 | 11 | 12 | 12 | 14 | 13 | 9 | 10 | 9 | -1 |
| Wisconsin | 14 | 21 | 16 | 16 | 10 | 10 | 10 | 10 | 12 | 8 | 7 | 7 | — |
| Wyoming | 14 | 20 | 16 | 9 | 8 | 10 | 9 | 8 | 10 | 5 | 5 | 6 | +1 |
| NOTE: Benchmark plans are not shown for the territories because low-income beneficiaries residing in the territories are not eligible for the low-income subsidy. 2017 counts includes 25 benchmark plans under sanction and closed to new enrollees as of September 2016. SOURCE: Georgetown/Kaiser Family Foundation analysis of Centers for Medicare & Medicaid Services 2006-2017 Part D plan files. |
|||||||||||||
Appendix 2: Medicare Part D Standard Benefit Parameters, 2006-2017
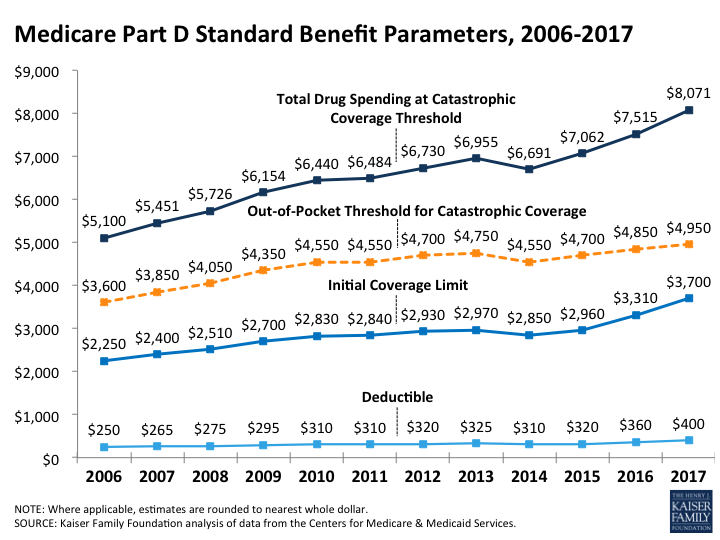
Medicare Part D Standard Benefit Parameters, 2006-2017