To Switch or Not to Switch: Are Medicare Beneficiaries Switching Drug Plans To Save Money?
Issue Brief
STUDY HIGHLIGHTS
Each year during the Medicare Part D annual enrollment period that runs between October 15 and December 7, people on Medicare have the opportunity to review and compare the plan options available to them and switch plans if they choose. This analysis examines rates of plan switching among Part D enrollees between 2006 and 2010, focusing on enrollees who do not receive the program’s Low-Income Subsidy. The study finds that relatively few people on Medicare have used the annual opportunity to switch Part D prescription drug plans (PDPs) voluntarily—even though those who do switch often lower their out-of-pocket costs as a result of changing plans. Key findings from this study are:
- A small share of all Medicare Part D enrollees voluntarily switch plans during the annual enrollment period—13 percent, averaged across four enrollment periods.
- Seven out of ten Medicare beneficiaries enrolled in stand-alone PDPs during all four annual open enrollment periods from 2006 to 2010 did not voluntarily switch plans in any of the four enrollment periods.
- The relatively small share of PDP enrollees who switched plans at some point between 2006 and 2010 were more likely than those who did not switch to end up in a plan that lowered their premiums. Nearly half (46 percent) of enrollees who switched plans saw their premiums fall by at least 5 percent the following year, compared to 8 percent of those who did not switch plans. But those who switched plans were only slightly more likely than those who did not switch to face lower out-of-pocket costs for drugs during the year.
- Relatively large premium increases for a PDP from one year to the next were associated with higher rates of plan switching between 2006 and 2010; but most enrollees with relatively large premium increases (such as $10 or more per month) did not switch plans in any of the four annual enrollment periods.
- Enrollees in PDPs that increased deductibles or dropped coverage of brand-name drugs in the coverage gap were more likely to switch out of these plans than enrollees in PDPs that did not change their benefit design.
.
INTRODUCTION
The Medicare Part D program is structured as a marketplace for prescription drug coverage where all Medicare beneficiaries must be enrolled in a private plan to receive Medicare’s prescription drug benefit. Ideally, beneficiaries will research the array of available drug plans and choose the one that best meets their needs, and further review and compare their options each year during the annual open enrollment period. The annual open enrollment period provides Part D enrollees with an opportunity to review any changes in their current plan, compare the coverage and costs of plans in their area in light of their current drug needs, and assess whether or not to stay in their plan or switch to another plan that would cover the drugs they need at a lower cost. In general, unless enrollees make an active choice to switch plans, they will remain in the same plan from one year to the next.1
The Part D program, which started in 2006, has reduced the share of Medicare beneficiaries without drug coverage, and provided beneficiaries a choice among many plans offered in their area. In 2013, for example, the average Part D enrollee has a choice of 31 stand-alone prescription drug plans (PDPs) and about 20 Medicare Advantage prescription (MA-PD) drug plans.2 Part D plans vary in a number of ways that can affect beneficiaries’ out-of-pocket costs, including premiums, cost-sharing amounts, formulary coverage, gap coverage, deductibles, and utilization management approaches. To assist people on Medicare with comparing and choosing plans, CMS offers an online Plan Finder tool that calculates the expected total cost for any plan for a given drug regimen.
Only a small fraction of enrollees, however, are enrolled in the lowest-cost Part D plan available to them, based on the specific drugs they take.3 Therefore, many Part D enrollees incur higher out-of-pocket costs than would be the case with a different plan selection. This is true especially in situations where the plan premium is not a good indicator of overall value, such as plans that include coverage for generic drugs in the coverage gap or plans with no deductible.4 Part D enrollees often have difficulty with the plan selection process and find the decision-making complicated, especially because of the large number of available plans.5
Each year, Medicare Part D plans can and do make changes in their premiums and in benefit design parameters that affect the total out-of-pocket costs enrollees will pay. While some plans make changes that reflect broad trends in the Part D market, other plans make changes (such as premium increases well above the overall trend) that affect their position in the marketplace. Yet, in a recent survey, only six in ten seniors said they (or someone on their behalf) review their plan options every year; one-fourth said they rarely or never do so.6 Some plan enrollees could be better off financially by reacting to these changes and selecting a different plan, and not doing so can increase the cost difference between the chosen plan and other available alternatives. According to one recent paper, the combined impact of inertia for those staying put and suboptimal choices made by those who do change plans means that the cost of not engaging in the plan review process at all or not choosing the highest-value plan has increased over time.7
This purpose of this study is to determine the extent to which Part D enrollees voluntarily switch plans from one year to the next, and to identify plan and beneficiary characteristics that are associated with higher or lower rates of switching. The study examines enrollment dynamics in Part D during the annual enrollment periods between 2006 and 2010 for beneficiaries who are not enrolled in the program’s Low-Income Subsidy (LIS), focusing primarily on enrollees in stand-alone PDPs. We exclude LIS enrollees entirely and MA-PD plan enrollees from most of the analysis because the enrollment dynamics and factors affecting plan switches are different for these two markets and populations.8 Our study makes a unique and important contribution to understanding of the Part D marketplace because it is the first to take an in-depth look at enrollment dynamics across multiple years since the start of the program and examine plan features associated with higher rates of plan switching. In doing so, it goes beyond the analysis recently published by the Medicare Payment Advisory Commission (MedPAC).9 These findings have implications for efforts to increase the level of private plan participation in the broader Medicare program.
.
DATA AND METHODS
The analysis for this study is based on a 5-percent random sample of Medicare beneficiaries, obtained from the Centers for Medicare & Medicaid Services (CMS), for each year from 2006 to 2010. The sample dataset includes information on the characteristics of beneficiaries and Part D plan information (encrypted at the level of the contract ID and plan ID).
From the five one-year samples, we matched non-LIS beneficiaries across years to build samples of beneficiaries who were enrolled in Part D for each of four two-year periods (2006-07, 2007-08, 2008-09, and 2009-10) and another sample of beneficiaries who were enrolled in the program for the entire 2006-10 period. For the analysis of overall switching rates, sub-samples were created for those who were enrolled in a PDP in the first year of each two-year cycle and those in a MA-PD plan in the first year; most of the analysis reported here uses the PDP sample. For the analysis examining the impact of plan characteristics, we further subset the two-year samples to include only PDP enrollees who remained in a PDP in the second year. Similarly, the five-year sample was restricted to those in PDPs the entire time.
In each two-year sample, we define a plan switch based on enrollment in a different plan in January of the second year, compared to December of the first year, thus focusing on changes in the annual enrollment period; switches in the five-year sample were defined similarly. We do not count plan switches that are involuntary under the following two circumstances: (1) a plan enrollee whose plan changes, but the old plan and the new plan are matched (“crosswalked”) by the plan sponsor, and the enrollee is therefore automatically transferred to the crosswalked plan; and (2) a plan enrollee whose plan exits the program without any crosswalked plan and who therefore must select a new plan to remain in Part D.
For a more detailed discussion of the data and methods, including other limitations, see Appendix 1: Study Methodology. Findings on the impact of individual enrollee characteristics (age, sex, race,10 original reason for Medicare entitlement, and geographic location), measures of beneficiary health status (number of chronic conditions and total Medicare expenditures), and drug spending are available in Appendix 2: Data Tables.
.
KEY FINDINGS
A small share of all Medicare Part D enrollees voluntarily switch plans during the annual enrollment period.
Most Part D enrollees (87 percent, averaged across four enrollment periods), whether in PDPs or MA-PD plans, made no change in their selected plan during any particular year’s annual enrollment period (Exhibit 1).11 Despite the fact that plans typically adjust premiums each year and some also make substantial changes to their benefit designs (gap coverage, deductibles, cost sharing, and formulary coverage), most beneficiaries do not change their current plan. On average, about 1.7 million Part D enrollees out of 13.4 million non-LIS Part D enrollees switched plans voluntarily in each annual enrollment period between 2006 and 2010.
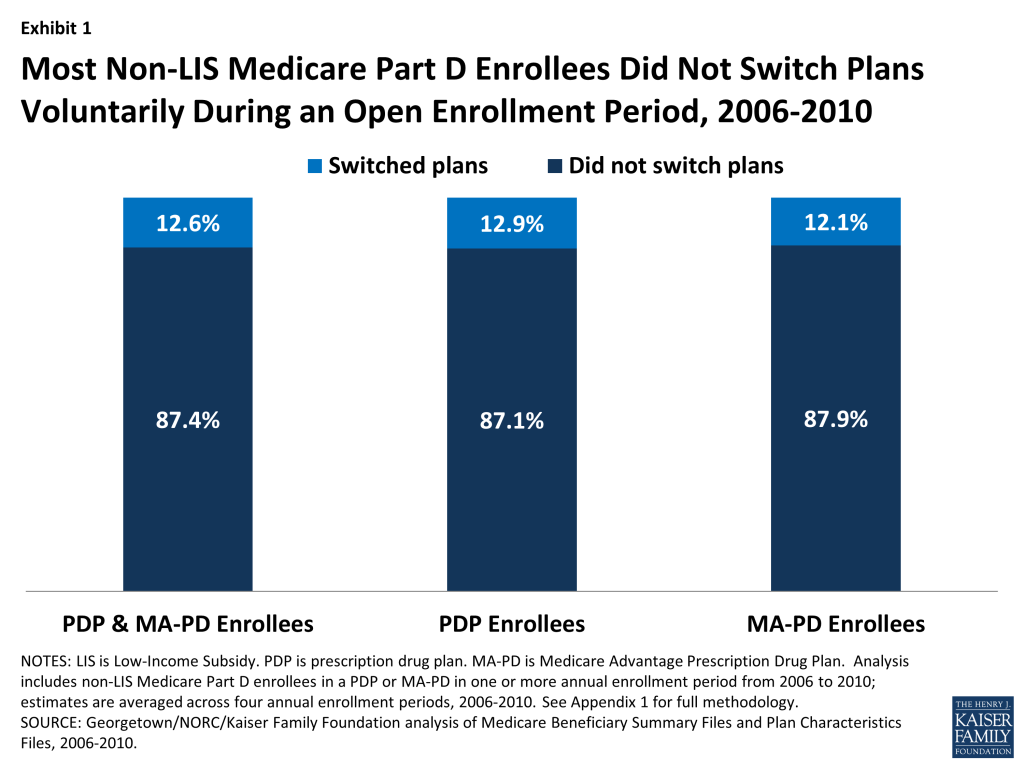
The percent of enrollees staying in the same plan from one year to the next was nearly the same for PDPs and MA-PD plans (Exhibit 1). Of those beneficiaries enrolled in stand-alone PDPs in any given year between 2006 and 2010, the vast majority (87 percent, on average) stayed in the same PDP from one year to the next. A virtually identical share of beneficiaries enrolled in Medicare Advantage prescription drug plans during these years (88 percent, on average) stayed in the same MA-PD plan from one year to the next.
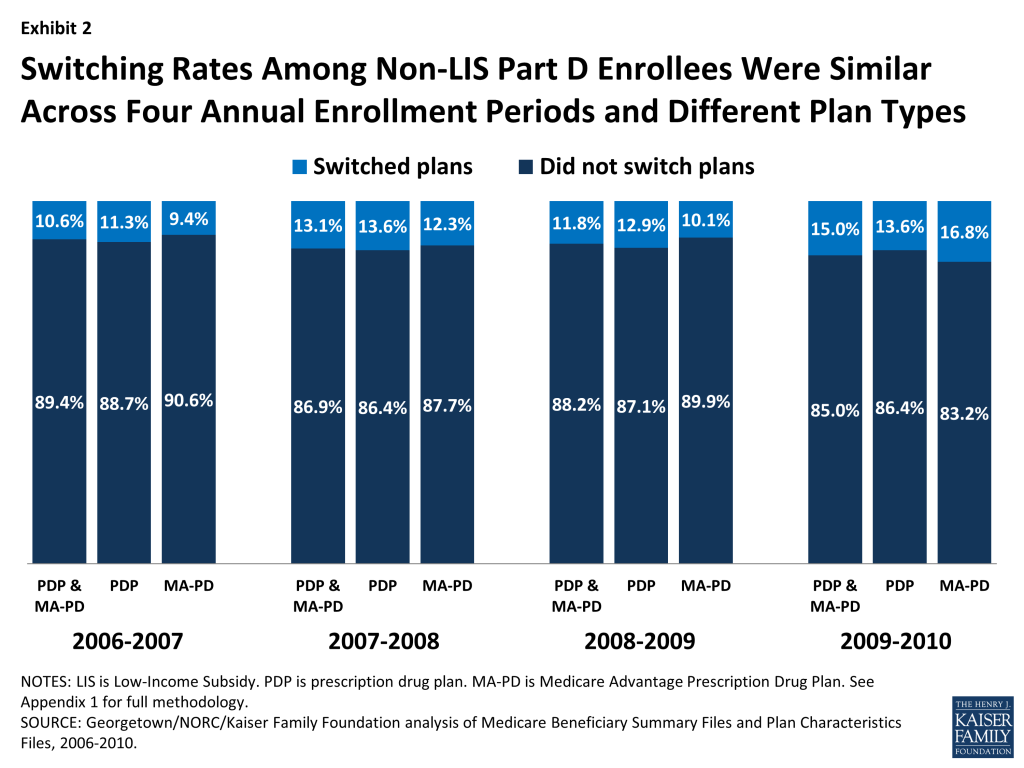
Switching rates have varied little from year to year (Exhibit 2). There was slightly greater stability in the first annual enrollment period (2006-07), perhaps because it came soon after the original selection of drug plans. There was slightly more switching among MA-PD enrollees in 2010, which may reflect changes unique to the Medicare Advantage market unrelated to the drug benefit, including changes in the availability of private fee-for-service plans.12
There were relatively few differences in the rate of switching by beneficiary characteristics. For example, women switched plans slightly more often than men, and those with more chronic health conditions or with higher drug spending were somewhat more likely to switch plans. Enrollees ages 64 to 74 were slightly more likely to switch than those ages 85 and older. But the observed differences in switching rates based on these characteristics are small and not always consistent from one annual enrollment period to the next. Switching rates varied more across PDP regions, ranging from nearly 20 percent, on average, in the New Jersey and Pennsylvania-West Virginia regions to about 5 percent in New Mexico and Hawaii. The participation of local PDPs and the presence of state pharmacy assistance programs could be partial factors in explaining regional differences. Tables illustrating these comparisons are available in Appendix 2.
Seven out of ten Medicare beneficiaries enrolled in stand-alone PDPs during all four annual open enrollment periods from 2006 to 2010 did not voluntarily switch plans in any of the four enrollment periods.
A large majority (72 percent) of Part D enrollees who were in PDPs continuously over the program’s first five years made no voluntary switch in any of the program’s first four annual enrollment periods (Exhibit 3).13 Another two in ten (19 percent) switched once over the five-year period. A similarly large share (71 percent) of MA-PD plan enrollees never made a switch in any of the enrollment periods.
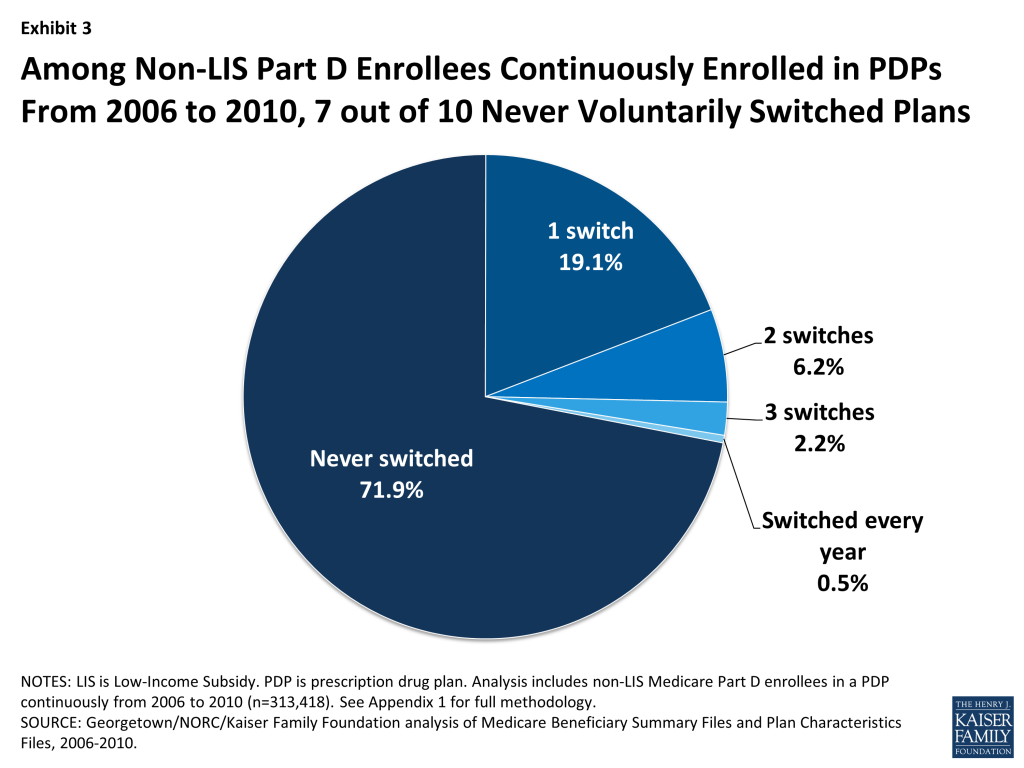
Of the five-year Part D enrollees who did switch PDPs at least once during the four enrollment periods, about two of every three made only a single switch. A small subset of PDP enrollees (about 3 percent) made frequent use of the opportunity to select a new PDP by switching plans in at least three of the first four annual enrollment periods, if not every year.
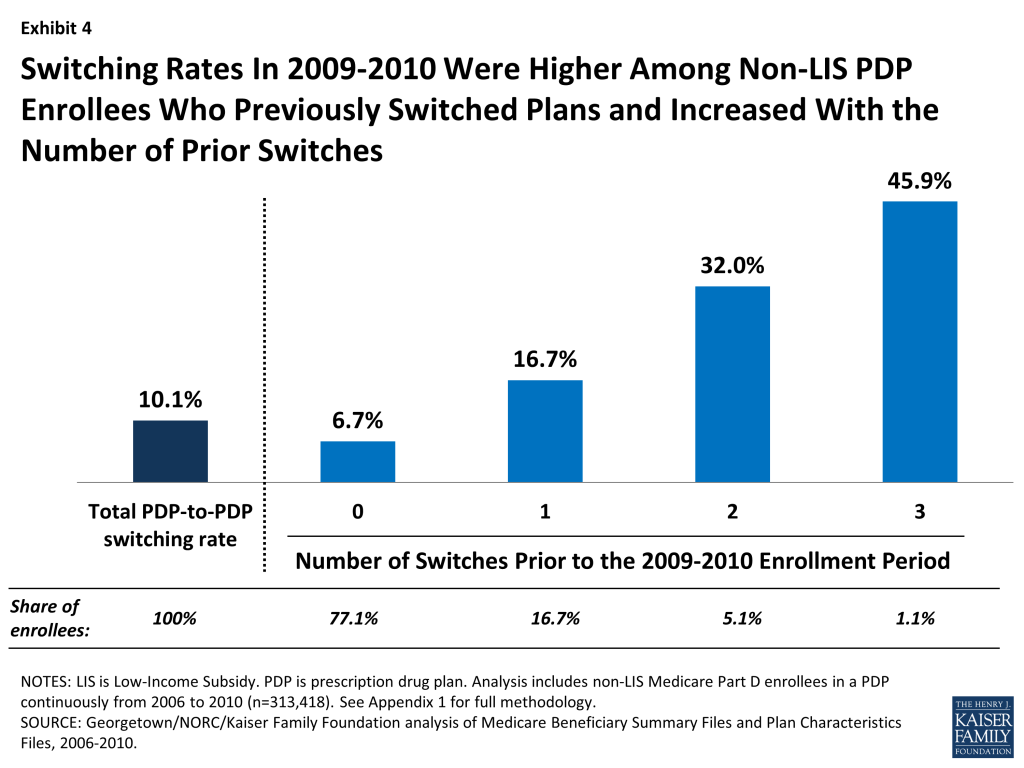
PDP enrollees were more than twice as likely to select a different PDP if they had made a switch in at least one previous year (Exhibit 4). Nearly one in five (17 percent) PDP enrollees who had switched plans in one previous annual enrollment period switched plans in 2010, compared to only 7 percent of PDP enrollees who had not switched in any previous enrollment period. Nearly half (46 percent) of those with three prior switches, and one-third (32 percent) of those with two prior switches, again chose a new PDP in 2010.
It is not possible to tell from administrative data how many enrollees who did not switch plans researched their options and made an active decision to stay in their original plan. However, these results suggest that some Part D enrollees are more engaged than others in reviewing their plan options every year and making active decisions about their plan choices.
The relatively small share of PDP enrollees who switched plans at some point between 2006 and 2010 were more likely than those who did not switch to end up in a plan that lowered their costs.
Those PDP enrollees who switched to a different PDP tended to face lower costs as a result, yet the effect was greater in terms of reducing the amount they spent on premiums than reducing their total out-of-pocket costs (Exhibit 5). Both switchers and non-switchers alike may face changes in their premiums from one year to the next. During the 2008 annual enrollment period, for example, 92 percent of PDP enrollees faced higher premiums in 2009 if they did not change PDPs, and 27 percent faced an increase of at least $10 per month.14 Our analysis shows that 46 percent of those who switched plans (averaged across the four annual enrollment periods) reduced their premiums by 5 percent or more as a result of switching, whereas only 8 percent of those who did not switch plans experienced the same reduction in their premium. Conversely, 78 percent of those who did not switch plans paid a premium at least 5 percent higher than the year before, compared to only 46 percent of those who did switch plans.
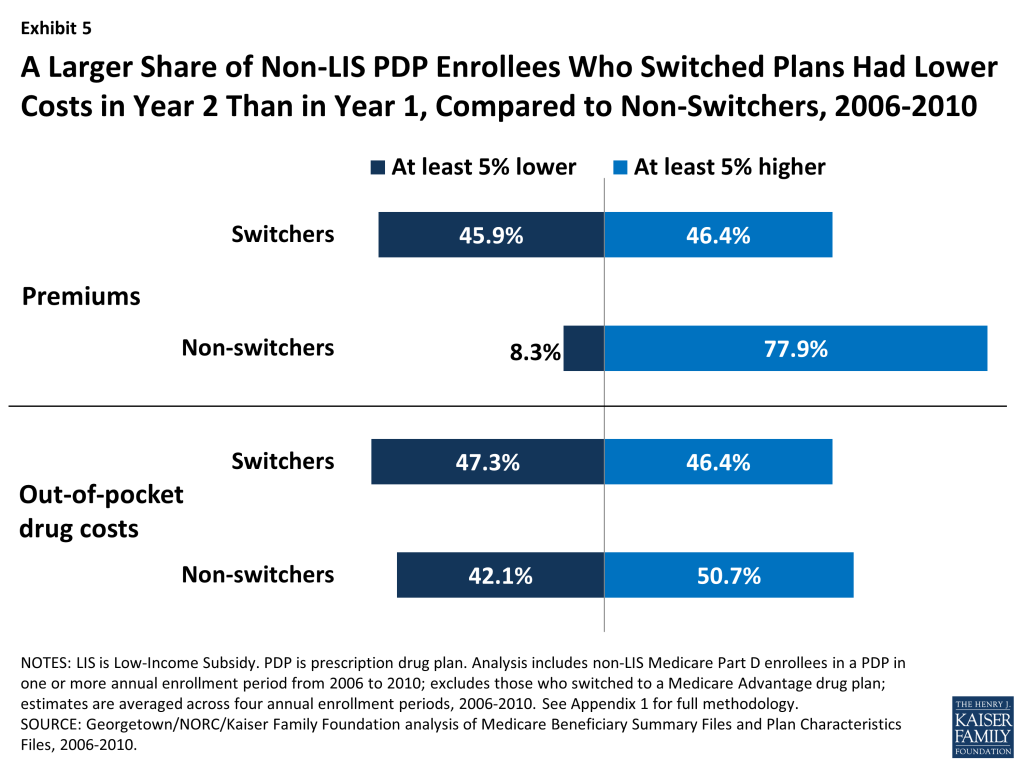
By contrast, PDP enrollees who switched plans were only slightly more likely than those who did not switch to experience a reduction in the amount they paid out of pocket for drugs during the year (Exhibit 5). In the second year, 47 percent of switchers, compared to 42 percent of non-switchers, lowered their out-of-pocket drug costs (including deductibles, copayments, coinsurance, and costs in the gap, but not premiums) by at least 5 percent. Differences in formularies or cost sharing—whether in a continuing plan or a new plan—were one reason for changes in these costs, but costs also rise and fall as a result of the need for different drugs from one year to the next. If switchers were more likely than non-switchers to experience changes in their prescription drug needs, it would bias this comparison.
Based on a combined measure of total out-of-pocket spending, including premiums and cost sharing for drugs, 44 percent of switchers had overall costs that were at least 5 percent lower, whereas only 28 percent of non-switchers experienced the same level of cost reduction.
The findings from these comparisons are consistent with a conclusion that Part D enrollees achieved lower costs when they selected a different plan during the annual enrollment period. But the findings also suggest that plan choice is driven more by premium changes than by a comparison of total out-of-pocket costs. At least two other recent studies have used Part D administrative and claims data to offer evidence on this distinction and concluded that Part D enrollees overvalue premiums in their plan selection decisions.15 The online Plan Finder offers enrollees the opportunity to look beyond premiums and identify plans with lower overall out-of-pocket costs, to the extent that their drug needs do not change from one year to the next.16 But survey data show that among the small share of beneficiaries who say they themselves have gone online and used the Internet, most have not visited the Plan Finder website (though someone else may have done so for them).17
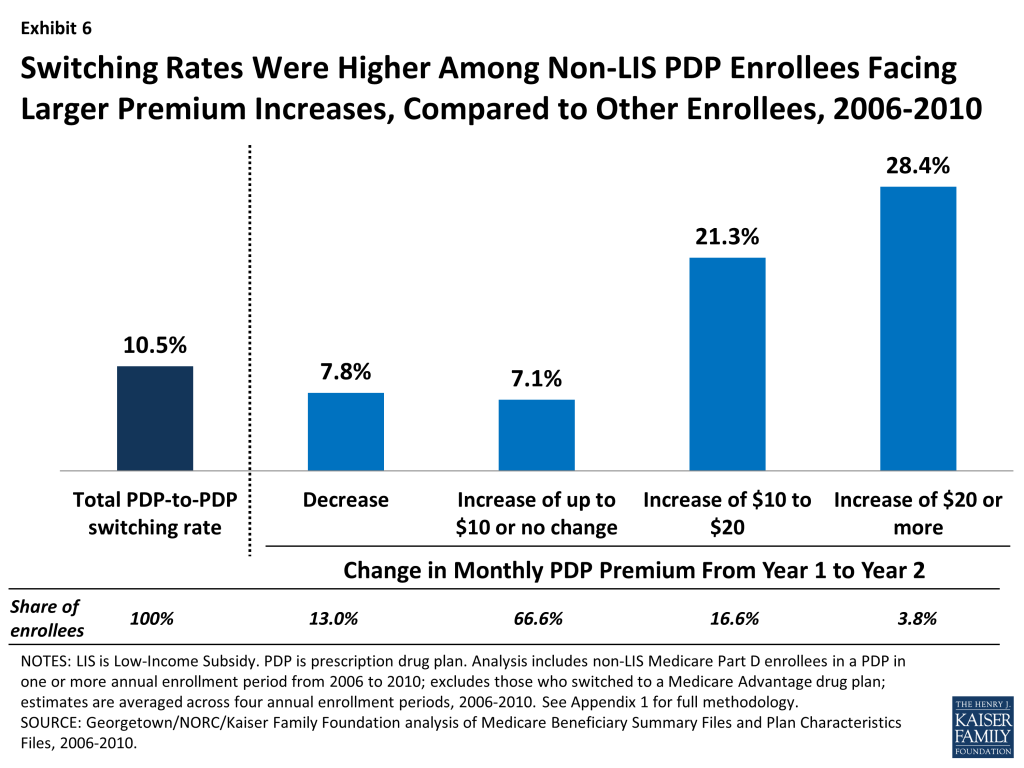
Relatively large premium increases for a PDP from one year to the next were associated with higher rates of plan switching between 2006 and 2010; but most enrollees with relatively large premium increases did not switch plans in any given year.
Non-LIS Part D enrollees typically see an increase in their plan’s premium if they remain in the same plan from one year to the next. As noted above, 92 percent of PDP enrollees faced higher premiums in 2009 compared to 2008 if they did not switch to a different PDP.18 Most Part D enrollees have PDPs available to them that would charge a lower premium, although the lower-premium PDPs do not always produce lower overall out-of-pocket costs.
PDP enrollees facing a monthly premium increase of $20 or more switched at two to four times the average rate overall. Still, over two-thirds of enrollees in PDPs that raised premiums by at least $20 stayed in that PDP the following year. PDP enrollees who faced especially large monthly premium increases were more likely to change PDPs than those facing lower premium increases (Exhibit 6). For example, 28 percent of PDP enrollees facing a monthly premium increase of at least $20 switched PDPs during the annual enrollment period (averaged across the four enrollment periods between 2006 and 2010). By contrast, only 7 percent of those facing a more modest premium increase (up to $10 or no change in their premium) switched PDPs, while 8 percent of those facing a premium decrease switched PDPs. Still, a significant majority of enrollees stayed with the same PDP regardless of the premium change they were facing in their current plan.
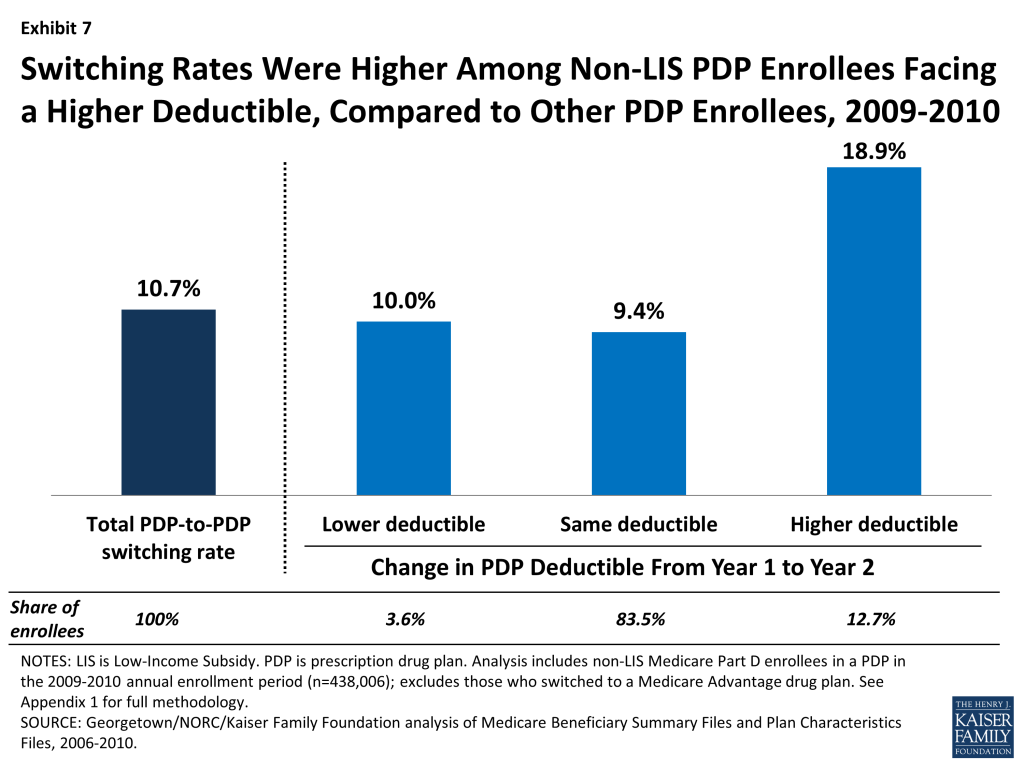
Enrollees in PDPs that made changes to their benefit designs, such as increasing deductibles or dropping coverage of brand-name drugs in the gap, were more likely to switch plans than enrollees in PDPs that did not change their benefit design.
Most PDPs retain the same basic benefit design from one year to the next: PDPs with coverage in the gap retain that coverage, those with deductibles continue to use deductibles, and those using cost-sharing tiers continue doing so. But in every year, some plans do make changes to their benefit designs. For example, about one in six PDPs made changes to their deductibles between 2009 and 2010, and a smaller subset of PDPs dropped coverage that they had offered for brand-name drugs in the coverage gap in the years from 2006 to 2008.
Through their plan choices, Part D enrollees who switched plans demonstrated a preference for PDPs with no deductibles or relatively small deductibles. Although most plans tend to make no change in their benefit design from year to year with regard to the deductible, there were more notable changes between 2009 and 2010. In 2009, about 13 percent of PDP enrollees were in plans that were adding or raising the deductible for the 2010 plan year, and another 4 percent were in plans that were lowering or eliminating the deductible. Among PDPs that were increasing the deductible between 2009 and 2010, the weighted average increase in the deductible was $120 (the maximum deductible in 2010 was $310).
PDP enrollees in plans that increased or added a deductible for 2010 were about twice as likely to switch PDPs as those in plans that did not change how deductibles were used or that lowered or eliminated deductibles (Exhibit 7). Furthermore, enrollees in PDPs retaining an existing deductible in 2010 were much more likely to switch to another plan than those in PDPs with no deductible.19 Other evidence supports the idea that beneficiaries tend to overpay (in terms of premiums) for plans without a deductible.20
Enrollees in plans that dropped coverage of brand-name drugs in the gap in the first two years of the program were more likely to switch plans than enrollees in plans that made no changes to gap coverage, although only a very small share of the PDP population had this generous gap coverage of brand-name drugs, and only a handful of PDPs offered it (Exhibit 8). In 2006 and 2007, most of the small number of PDPs that offered some coverage for brand-name drugs in the coverage gap faced costly adverse selection, whereby the more extensive gap coverage was worth the higher premium only for those who expected to reach the coverage gap. As a result, nearly all of these PDPs elected to modify or drop that coverage (or left the market) for either the 2007 or 2008 plan year.
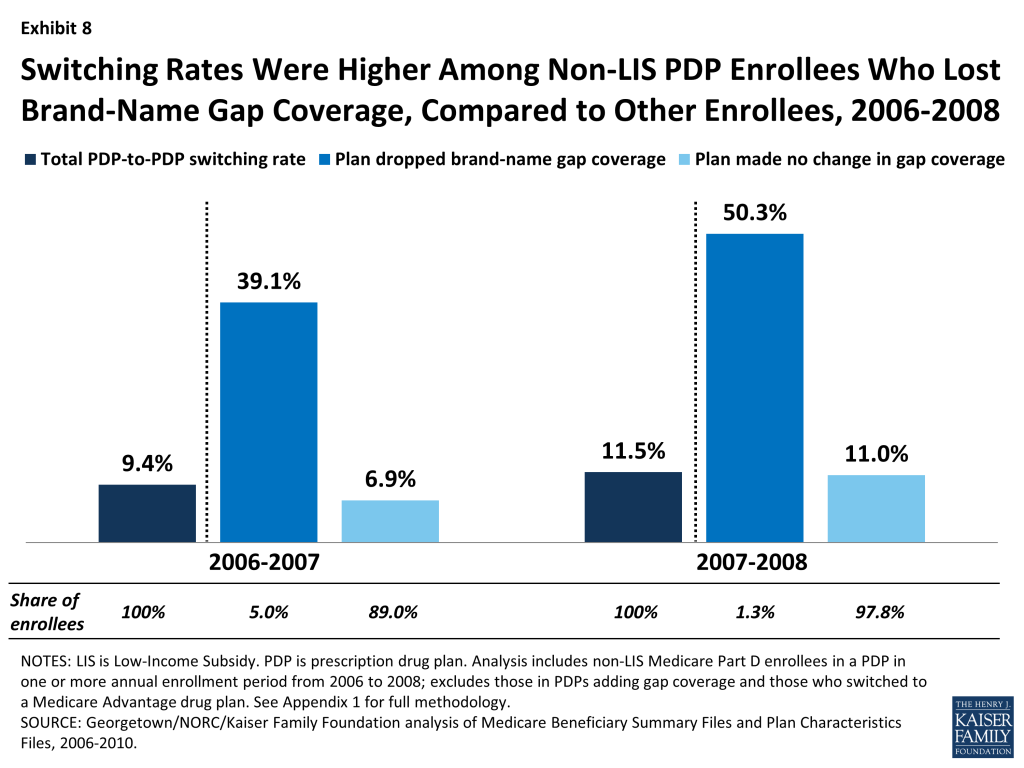
Enrollees whose plans were dropping coverage of brand-name drugs in the gap at the end of 2006 or 2007 switched PDPs at a rate four times greater than the average rate of switching among PDP enrollees. A large share of enrollees in this situation (39 percent in 2006 and 50 percent in 2007) switched out of their plans in those two enrollment cycles, compared to a smaller share (7 percent in 2006 and 11 percent in 2007) of those enrolled in PDPs that made no change in their gap coverage. These counts do not include enrollees forced to pick a new plan because their PDP exited the program entirely. Through the process of adverse selection leading to a “death spiral,” the availability of PDPs with generous gap coverage for brand-name drugs mostly disappeared by 2008.21
DISCUSSION
Our analysis shows that most Part D enrollees did not change their selection of a plan from one year to the next during the annual enrollment period for Medicare prescription drug coverage. Even over a five-year period, most did not change plans outside of special circumstances, such as when a plan sponsor reorganized plan offerings or acquired another company’s plans. The low rate of plan switching in Part D is similar or somewhat higher than those in some other settings, where choice of plans may be more consequential since it involves a full array of health services and may require switching doctors rather than pharmacies. For example, in the Federal Employees Health Benefit Program, about 12 percent of federal employees switched plans annually between 1996 and 2001.22 A similar rate of switching (13 percent) has been reported for all nonelderly Americans with employer-sponsored health insurance, although that rate includes involuntary switching resulting from changes in jobs or in employer plan offerings.23 In some other settings, switching rates have been lower than in Part D. For example, the switching rate in the Massachusetts Commonwealth Care/Health Connector ranged from 2.5 percent to 6.9 percent between 2009 and 2013.24 Although there are no recent published studies of switching in Medicare Advantage, a 1996 survey of Medicare managed care enrollees found that about 7 percent had switched from one Medicare Advantage plan to another in the previous year, and a 2000 survey found that only 4 percent switched Medicare Advantage plans.25
The evidence presented here and in other studies suggests that many Part D enrollees could lower their costs by engaging annually in the process of reviewing and comparing their plan options during the annual enrollment period, and when appropriate, switching to a lower-cost plan.26 The reasons for the low level of switching in Part D are not clear. In one view, enrollment stability could be a sign of enrollees’ satisfaction with their plans. Another view is that beneficiaries avoid “rocking the boat,” by staying in their current plans, preferring the status quo (even at a higher cost) over the unknowns of a new plan.27 Alternatively, the low rate of switching plans could indicate that Medicare beneficiaries are not fully engaged in the Part D program’s choice-based system and that the task of reviewing and comparing plans in the face of many different options may be too difficult or may not seem worth the effort. This view is supported by some qualitative evidence from polls and focus groups, where beneficiaries have reported that they would prefer less choice and a simpler system.28 This view is also supported by behavioral economics research which suggests that decision makers who face a wide range of choices have more difficulty making decisions, make poorer choices, and may in fact fail to make any decision whatsoever.29
Our analysis suggests that higher premiums, higher deductibles, and less generous coverage in the gap are associated with higher than average PDP switching rates, but even with these changes, only a small share of Part D enrollees switched away from PDPs that raised premiums, increased deductibles, or dropped brand gap coverage. Enrollees who switched PDPs were more likely to face lower premiums than those who did not. However, switching plans was much less likely to lead to a reduction in the overall amount that enrollees pay out of pocket for their drugs (excluding premiums). This finding suggests that even those enrollees who undertake the task of reviewing their plan options may not be fully aware of the tools available that would help them compare total costs. For example, if a beneficiary enters their drug regimen into the Plan Finder website developed by CMS, the program will calculate total costs for all plans in the beneficiary’s area and array them in order from least to most costly—simplifying the information the beneficiary needs to review. Some observers have suggested that more availability of one-on-one counseling or more targeted information provided regularly to Part D enrollees could reduce the transaction costs associated with switching plans.30
To the extent that Part D enrollees do not regularly evaluate their plan options or select a new plan even in the face of higher costs, the competitive model inherent to Part D may fall short of expectations. Policymakers may want to consider ways to simplify the required decision making for beneficiaries and provide better decision-support tools. CMS has taken some key steps in the last few years by reducing the number of competing plans and requiring that multiple plan offerings by the same plan sponsor have meaningful differences. CMS has also taken steps since the start of the program to improve the quality of available plan information with enhancements to the online Plan Finder and the availability of better performance measures in the star rating system. Nevertheless, many beneficiaries do not take advantage of these tools on a regular basis, and some are reluctant to initiate research into alternate plan selections because they underestimate the potential savings they could achieve.31 This suggests that more could be done to reduce the number of plan offerings and make it easier for beneficiaries to compare plans, thereby improving the environment for reviewing and selecting plans.32
Our findings have implications beyond Part D, as policymakers debate options for broader Medicare restructuring, including options that would increase the role of private plans in Medicare. The evidence to date from Part D suggests that most beneficiaries, once enrolled, tend to stick with the plans they have chosen, even when they are faced with relatively large premium increases. While this tendency likely reflects a mix of both satisfaction with the status quo and some reluctance to examine alternatives or make a change, it also points to a disconnect between theory and reality in this and potentially other choice-based systems for Medicare. In the face of evidence suggesting that plans will retain most of their enrollees regardless of premium increases or modifications to other plan features, plan sponsors may have less incentive to keep costs down. The result could be higher costs for both beneficiaries and the federal government, because under the structure of Part D, where both the government’s share of the premium and the beneficiary’s premium amount are derived from the average of plan bids, these costs go up as plan bids increase. Results of our study raise questions about the degree to which beneficiaries are willing or able to let cost be their ultimate guide in choosing a plan. As a result, the competitive signal is not sent to plan sponsors, and beneficiaries could miss out on an opportunity to achieve savings.
This issue brief was authored by Jack Hoadley and Laura Summer of Georgetown University; Elizabeth Hargrave of NORC at the University of Chicago; and Juliette Cubanski and Tricia Neuman of the Kaiser Family Foundation.
The authors thank Amanda Tzy-Chyi Yu, Jean-Ezra Yeung, Tianne Wu, and Samuel Stromberg at NORC at the University of Chicago for programming services; Christopher Powers at CMS for assistance in the data acquisition process; Gretchen Jacobson at the Kaiser Family Foundation and Tom Rice at UCLA for additional input and review.
Appendix
APPENDIX 1: STUDY METHODOLOGY
The analysis for this study is based on a 5-percent random sample of Medicare beneficiaries, obtained from the Centers for Medicare & Medicaid Services (CMS), for each year from 2006 to 2010. The sample dataset includes information on the characteristics of beneficiaries from the Master Beneficiary Summary File and Part D plan information from the Part D Plan Characteristics Files (encrypted at the level of the contract ID and plan ID).
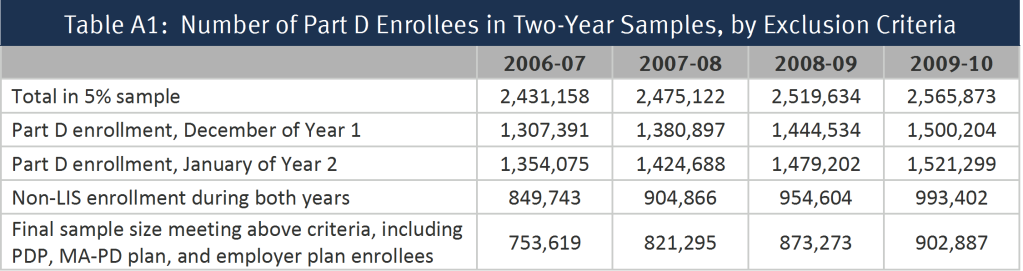
From the one-year samples, we matched beneficiaries across years to build a series of samples of beneficiaries who were enrolled in the Part D program for each of four two-year periods (2006-07, 2007-08, 2008-09, and 2009-10) (Table A1). To be included in a two-year sample, beneficiaries (1) must have participated in Part D in both December of the first year of a two-year pair and January of the second year and (2) must have been non-LIS in all months for which they were enrolled in a drug plan. Anyone who died prior to January of the second year is excluded from the analysis. By measuring enrollment in December of year one, we focus the study only on switches occurring in the annual enrollment period. This rule also allows inclusion of beneficiaries who entered the program during the full annual enrollment period for 2006, which extended from November 15, 2005 until May 15, 2006.
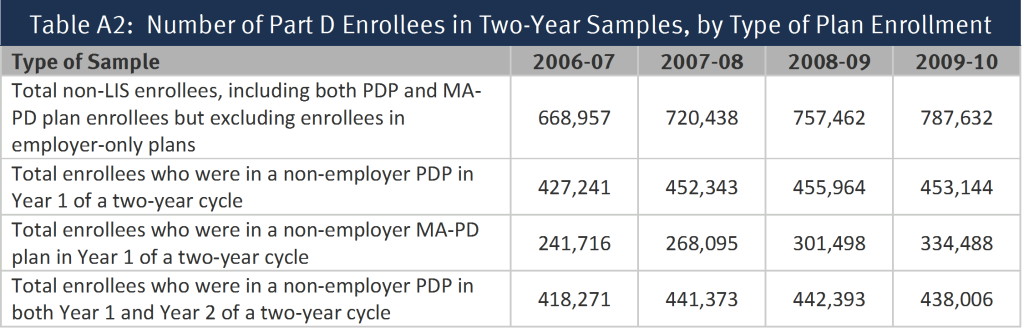
Separate sub-samples were created for those who were enrolled in a stand-along prescription drug plan (PDP) in the first year of each two-year cycle and those who were enrolled in a Medicare Advantage prescription drug (MA-PD) plan in the first year; most of the analysis reported here is based on the PDP sample (Table A2). Part D enrollees in employer-only plans were excluded from the analysis. For the segments of the analysis examining the impact of individual and plan characteristics, we further subset the sample to include only PDP enrollees who remained in a PDP in the second year. By excluding Part D enrollees who are in MA-PD plans before or after the annual enrollment period, we avoid the complications of the larger array of factors related to plan switching in the Medicare Advantage market. This last reduction to the sample eliminates those switching from a PDP to an MA-PD plan, therefore the rate of switching is reduced from 12.9 percent (averaged across the four annual enrollment periods) of the sample of all enrollees in a PDP entering the annual enrollment period to 10.5 percent of enrollees in PDPs both before and after.
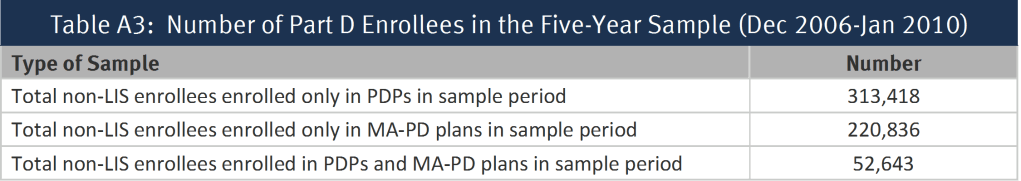
We built another sample of beneficiaries who were enrolled in the program for the entire 2006-2010 period (Table A3). To be included in the five-year sample, beneficiaries (1) must have participated in Part D continuously from December 2006 through January 2010 and (2) must have been non-LIS during all these months. We further subset the sample into three groups: those enrolled in PDPs throughout all 38 months of this time period, those enrolled in MA-PD plans for all 38 months, and those enrolled in some combination of PDPs and MA drug plans during the period.
For the non-LIS Part D enrollees in each two-year sample, we define a plan switch based on enrollment in a different plan in January of the second year, compared to December of the first year (plan elections made at any time during the annual enrollment period are effective on January 1). This approach is the same as that which MedPAC uses to assess the rate of Part D plan switching.33 The use of December-to-January to measure change in plans as the definition of a plan switch restricts the analysis to switching that occurs during the annual enrollment period that ends in December of each year, and excludes any plan switching that occurs in the additional open enrollment period available to Part D enrollees at the beginning of the year or other mid-year plan switches. The policy in effect between 2006 and 2010 allowed enrollees the opportunity to make one additional change in health plans in January, February, or March, as long as the change did not involve adding or dropping drug coverage.34 Measuring plan switches that occurred between December of year 1 and January of year 2 means that changes made in this additional open enrollment period were not captured in our analysis. In addition, enrollees may switch plans at any time during the year in special circumstances, such as moving to a new address with different plan options or moving into or out of an institution. As a result, our analysis has underestimated the overall rate of plan switching by some unknown degree. However, an examination of enrollment data in CMS’s monthly enrollment reports suggests that the use of these additional opportunities to switch plans is relatively low and their inclusion would not have a sizeable effect on the overall rates of plan switching measured here.
We do not count plan switches that are involuntary under the following two circumstances: (1) a plan enrollee whose plan (as designated by the contract ID and plan ID combination) changes, but where the old plan and the new plan are matched (“crosswalked”) and who accepts the automatic transfer to the crosswalked plan;35 and (2) any plan enrollee whose plan exits the program without any crosswalked plan and who therefore must select a new plan to remain in Part D.36 For the five-year sample, switches were defined in a comparable manner, taking into account only voluntary switches that occurred between December of one year and January of the next year.
Because the switching analysis presented here is based on individual decisions, the sample of beneficiaries for the analysis of each two-year file excludes newly eligible beneficiaries, beneficiaries who died during the relevant time period, and others who did not participate in Part D in both years. In addition, this analysis excludes from the estimate of switching rates various types of involuntary switches. As a result, the results reported here cannot be used to project the total net enrollment change from one year to the next. The net enrollment change is a product of how many people switch plans voluntarily, those who switch involuntarily as a result of plan exits, new enrollees to Part D, and those who have died or disenrolled from Part D.
The encryption of plan identifiers imposes some limitations on our study. Some plan sponsors operate under multiple contract numbers, often because they acquire the contract number from another plan sponsor through a corporate merger or acquisition. As a result, we cannot reliably distinguish between switches within plans offered by the same sponsor and those across plan sponsors. In addition, the use of encrypted plan identifiers makes it difficult to analyze plan characteristics that are not reported in the plan characteristics files. For example, we cannot look at externally derived measures of plan benefit designs or plan formularies, beyond measures included in the plan characteristics files (especially premiums, gap coverage, and deductibles).
Another limitation, especially for looking at the impact of plan characteristics, is that plans may change in multiple ways from one year to the next. As a result, it may be difficult to determine when a switch is more associated with one factor (such as a premium increase) or another (such as a deductible increase) when many beneficiaries in the sample are enrolled in the same plan. For example, some beneficiaries facing an increased deductible face the same premium change because they are in the same plan. This situation makes it more difficult to disentangle the effects of different plan characteristics and to interpret statistical significance tests. To mitigate this concern, we focused the analysis of changes in plan characteristics on years when changes were more common and where differences in switching rates were larger. We also put the variables measuring changes in plan premiums, deductibles, and gap coverage in a multivariate logistic regression, which should control for simultaneous plan changes. Parameters for all three types of benefit change were statistically significant, and the estimated odds ratios showed that the magnitude of the relationships was substantial.
In addition, the study is limited to the plan and beneficiary characteristics in the Medicare Beneficiary Summary File. We did not obtain for this study the prescription drug events (claims) for beneficiaries or claims from Medicare Parts A and B. Thus, we cannot calculate beneficiary risk scores or use measures of drug spending or other Medicare spending beyond the summary measures available in the Master Beneficiary Summary File. In addition, no measures of income or education are available, and the coding of race and ethnicity (as presented in Appendix 2, Exhibits A1 and A4) in the Medicare files raises issues.37 First, race and ethnicity are not divided into separate variables. For example, Hispanic beneficiaries who are black may be listed as Hispanic but not as black. Second, information on race is self-identified, typically either when someone first applies for a Social Security number or first applies for benefits (with some updating from a postcard survey). To address issues of accuracy and bias in the coding (especially for Hispanic and Asian/Pacific Islander beneficiaries), CMS has a second variable based on an imputation algorithm that largely relies on surnames and increases the number of beneficiaries coded as Hispanic or Asian/Pacific Islander.38 We have used the second variable for the tables in Appendix 2. However, the results based on race and ethnicity should be used with caution.
.
APPENDIX 2: DATA TABLES
Endnotes
- Enrollees whose current plan is scheduled to exit the market at the end of the year may be transferred to a new plan if the same sponsor has other plans in the program.u00a0 Otherwise, they are required to select new plans in order to remain in the program.u00a0 In addition, some plan enrollees who receive the programu2019s Low-Income Subsidy (LIS) are transferred to a new plan if their current plans no longer qualify as zero-premium plans for LIS beneficiaries. ↩︎
- Jack Hoadley, Laura Summer, Elizabeth Hargrave, and Juliette Cubanski, u201cMedicare Part D Prescription Drug Plans: The Marketplace in 2013 and Key Trends, 2006-2013,u201d Kaiser Family Foundation, forthcoming. ↩︎
- Yaniv Hanoch, Thomas Rice, Janet Cummings, and Stacey Wood, How Much Choice is too Much? The Case of the Medicare Prescription Drug Benefit,u201d HSR 44(4):1157-1168, August 2009; Jeffrey R. Kling, Sendhil Mullainathan, et al., u201cComparison Friction: Experimental Evidence from Medicare Drug Plans,u201d Quarterly Journal of Economics 127(1): 199-235, January 2012.; Jason T. Abaluck and Jonathan Gruber, u201cChoice Inconsistencies among the Elderly: Evidence from Plan Choice in the Medicare Part D Program,u201d American Economic Review 101(4): 1180-1210, June 2011; Florian Heiss, Adam Leive, Daniel McFadden, and Joachim Winter, u201cPlan Selection in Medicare Part D: Evidence from Administrative Datau201d (No. w18166), National Bureau of Economic Research, 2012. ↩︎
- Chou Zhou and Yuting Zhang, u201cThe Vast Majority of Medicare Part D Beneficiaries Still Donu2019t Choose the Cheapest Plans That Meet Their Medication Needs,u201d Heath Affairs 31(10): 2259-2265, October 2012; Jason Abaluck and Jonathan Gruber, u201cEvolving Choice Inconsistencies in Choice of Prescription Drug Insurance,u201d National Bureau of Economic Research Working Paper 19163, June 2013. ↩︎
- Jennifer M. Polinski, Aman Bhandari, Uzaib Y. Saya, et al., u201cMedicare Beneficiariesu2019 Knowledge of and Choices Regarding Part D, 2005 to the Present,u201d Journal of the American Geriatrics Society, 58(5): 950u2013966, May 2010; Hanoch et al. (2009).u00a0 One other study agrees that decision costs are greater with more options, but finds that benefits also increase. M. Kate Bundorf and Helena Szrek, u201cChoice Set Size and Decision Making: The Case of Medicare Part D Prescription Drug Plans,u201d Medical Decision Making, 30(5): 582-593, September/October 2010. ↩︎
- Kaiser Family Foundation, u201cKey Findings from the Kaiser Family Foundation 2012 National Survey of Seniors: Seniorsu2019 Knowledge and Experience with Medicareu2019s Open Enrollment Period and Choosing a Plan,u201d October 2012, available at http://modern.kff.org/medicare/issue-brief/seniors-knowledge-and-experience-with-medicares-open/. ↩︎
- Abaluck and Gruber (2013).u00a0 Another study suggested that Part D enrollees dramatically improved their plan choices in the programu2019s second year.u00a0 But because this study uses data from only a single plan manager with a limited range of plan offerings, it is not generalizable to the broader Part D population. Jonathan D. Ketcham, Claudio Lucarelli, et al., u201cSinking, Swimming, or Learning to Swim in Medicare Part D,u201d American Economic Review 102(6): 2639-2673, 2012. ↩︎
- Some LIS beneficiaries whose plans will no longer qualify as benchmark plans in the new year, are randomly reassigned to benchmark plans during the annual enrollment period.u00a0 Because the plan choice dynamics are different for LIS beneficiaries, they will be the subject of a separate analysis. ↩︎
- Medicare Payment Advisory Commission, Report to the Congress: Medicare Payment Policy, March 2013; Shinobu Suzuki, u201cMedicare Part Du2019s Competitive Design: Do Part D Enrollees Switch Plans?u201d Academy Health, June 2013. ↩︎
- See Appendix 1 for a discussion of issues with the race variable in the Medicare data used for this analysis. ↩︎
- The 13 percent switching rate exceeds the estimate reported in a CMS press release in January 2008 stating that 6 percent of all non-LIS beneficiaries enrolled in Part D who made a change between 2007 and 2008 (more recent estimates have not been released by CMS).u00a0 CMS press release, January 31, 2008.u00a0 It is unclear what methodology was used by CMS for their 6 percent estimate.u00a0 Our estimate is comparable to numbers reported recently by the MedPAC (Report to the Congress, March 2013; Shinobu Suzuki, u201cMedicare Part Du2019s Competitive Design: Do Part D Enrollees Switch Plans?u201d June 2013) and Andrew Stocking (Congressional Budget Office, u201cCompetition and Bids in Medicareu2019s Prescription Drug Program,u201d Academy Health, June 2013).u00a0 In the March 2013 report, MedPAC reported an overall Part D switching rate of 13.6 percent for 2009-10; separately by plan type, the reported switching rate for 2009-10 was 13 percent for PDPs and 15 percent for MA-PD plans. ↩︎
- Marsha Gold et al., u201cMedicare Advantage 2010 Data Spotlight: Plan Availability and Premiums,u201d Kaiser Family Foundation, November 2009; available at https://modern.kff.org/medicare/issue-brief/medicare-advantage-2010-data-spotlight-plan-availability/. ↩︎
- Despite taking no action to switch PDPs, some ended up in different PDPs because of market changes.u00a0 Several large mergers and acquisitions occurred during these years, and most plan sponsors made at least some adjustments to their array of plan offerings.u00a0 The resulting transfer of enrollees out of existing plans (excluded from the switching definition used in this analysis) meant that some non-switchers still experienced a change in plans. ↩︎
- Jack Hoadley, Jennifer Thompson, Elizabeth Hargrave, Juliette Cubanski and Tricia Neuman, u201cMedicare Part D 2009 Data Spotlight: Premiums,u201d Kaiser Family Foundation, November 2008, available at http://modern.kff.org/medicare/report/medicare-part-d-2009-data-spotlight-premiums/. ↩︎
- Heiss et al. (2012); Abaluck and Gruber (2013). ↩︎
- Marisa Elena Domino, Sally C. Stearns, Edward C. Norton, and Wei-Shi Yeh, u201cWhy Using Current Medications to Select a Medicare Part D Plan May Lead to Higher Out-of-Pocket Payments, Medical Care Research and Review 65(1): 114-126, February 2008. ↩︎
- Authorsu2019 analysis of data from the Centers for Medicare & Medicaid Services 2011 Medicare Current Beneficiary Survey Access to Care file; available at http://www.cms.gov/Research-Statistics-Data-and-Systems/Research/MCBS/index.html. ↩︎
- Hoadley et al. (2008). ↩︎
- This patternu2014that enrollees in any PDPs that retained an existing deductible were more likely to switch plans than those in PDPs with no deductibleu2014also occurred in earlier annual enrollment periods. ↩︎
- Abaluck and Gruber (2013); Heiss et al. (2012). ↩︎
- This market reappeared somewhat in 2011 when CMS allowed sponsors to offer a third PDP only if it included brand gap coverage.u00a0 In 2013, 16 percent of PDPs offer gap coverage for some brand drugs (but less extensive than the coverage offered in 2006 and 2007).u00a0 Premiums for this coverage are especially high (nearly triple that of PDPs with no gap coverage), and only 3 percent of PDP enrollees have selected these PDPs.u00a0 Jack Hoadley, Laura Summer, Elizabeth Hargrave, and Juliette Cubanski, u201cMedicare Part D Prescription Drug Plans: The Marketplace in 2013 and Key Trends, 2006-2013,u201d Kaiser Family Foundation, forthcoming; Jack Hoadley, Juliette Cubanski, et al., u201cMedicare Part D: A First Look at Part D Plan Offerings in 2013,u201d November 2012, available at https://modern.kff.org/medicare/report/medicare-part-d-first-look-at-2013-plan-offerings/. ↩︎
- Adam Atherly, Curtis S. Florence, and Kenneth E. Thorpe, u2018u2018Health Plan Switching among Members of the Federal Employees Health Benefits Program,u2019u2019 Inquiry 42(3): 255u201365, 2005. ↩︎
- Peter J. Cunningham, u201cFew Americans Switch Employer Health Plans for Better Quality, Lower Costs,u201d NIHCR Research Brief No. 12, Center for Studying Health System Change, January 2013.u00a0 Many employers do not offer a choice of health plans; those that do offer only a limited array of choices. ↩︎
- These rates also include some involuntary switchers.u00a0 u201cCommonwealth Care Quarterly Update,u201d September 2011. ↩︎
- In the 1996 survey, the switching rate is 11 percent if switches to fee-for-service Medicare are included.u00a0 Physician Payment Review Commission, u201cAccess to Care in Medicare Managed Care: Results from a 1996 Survey of Enrollees and Disenrollees,u201d Selected External Research Series, Number 7, November 1996, page 36; Marsha Gold and Natalie Justh, u201cHow Salient is Choice to Medicare Beneficiaries,u201d Monitoring Medicare+Choice: Fast Facts, Number 5, Mathematica Policy Research, January 2001. ↩︎
- Hanoch et al. (2009); Kling et al. (2012); Abaluck and Gruber (2013). ↩︎
- Elizabeth Hargrave, Bhumika Piya, Jack Hoadley, Laura Summer, and Jennifer Thompson, u201cExperiences Obtaining Drugs under Part D: Focus Groups with Beneficiaries, Physicians, and Pharmacists,u201d Contractor report submitted to the Medicare Payment Advisory Commission, March 2008. ↩︎
- Kaiser Family Foundation, u201cChartpack: Seniors and the Medicare Prescription Drug Benefit,u201d November 2006, available at https://modern.kff.org/medicare/poll-finding/chartpack-seniors-and-the-medicare-prescription-drug/; Kaiser Family Foundation, u201cKey Findings from the Kaiser Family Foundation 2012 National Survey of Seniors: Seniorsu2019 Knowledge and Experience with Medicareu2019s Open Enrollment Period and Choosing a Plan,u201d October 2012; Marc Berk, Karen Cheung, Elizabeth Eaton, et al., u201cHow Beneficiaries Learned about Medicare Drug Plans and Made Plan Choices,u201d Contractor report submitted to the Medicare Payment Advisory Commission, Aug. 2007; Florian Heiss, Daniel McFadden, and Joachim Winter, u201cWho Failed to Enroll in Medicare Part D, and Why? Early Results,u201d Health Affairs 25(5) w344-w354, 2006. ↩︎
- The broader theory is stated in Sheena Iyengar and Mark Lepper, u201cWhen Choice is Demotivating: Can One Desire Too Much of a Good Thing?u201d Journal of Personality and Social Psychology 79(6):995-1006, December 2000.u00a0 Applications to Part D are available in Hanoch et al. (2009) and Bundorf and Szrek (2008). ↩︎
- Kling et al. (2012); Richard H. Thaler and Cass R. Sunstein, Nudge: Improving Decisions about Health, Wealth, and Happiness, New Haven: Yale University Press, 2008. ↩︎
- Kaiser Family Foundation, u201cChartpack: Seniorsu2019 Early Experiences with the Medicare Prescription Drug Benefit,u201d April 2006, available at https://modern.kff.org/medicare/poll-finding/chartpack-seniors-early-experiences-with-the-medicare/; Berk et al. (2007); Kling et al. (2012). ↩︎
- Jack Hoadley, u201cMedicare Part D: Simplifying the Program and Improving the Value of Information for Beneficiaries,u201d The Commonwealth Fund, May 2008. ↩︎
- Medicare Payment Advisory Commission (MedPAC), Report to the Congress: Medicare Payment Policy, March 2013. ↩︎
- Effective in 2011, this policy was revised to allow Medicare Advantage enrollees, but not PDP enrollees, to change their plan elections during the first 45 days of a year.u00a0 Under the revised policy, they may only make a change back to traditional Medicare and a PDP and not to another Medicare Advantage plan. ↩︎
- These are mostly situations where a plan sponsor has reorganized plan offerings as a result of acquiring plans from another sponsor, dropping some of its plans, or adding new plans. ↩︎
- These situations have occurred relatively rarely in the Part D program to date. ↩︎
- Daniel R. Waldo, u201cAccuracy and Bias of Race/Ethnicity Codes in the Medicare Enrollment Database,u201d Health Care Financing Review 26(2): 61-72, Winter 2004/2005. ↩︎
- Celia Eicheldinger and Arthur Bonito, u201cMore Accurate Racial and Ethnic Codes for Medicare Administrative Data,u201d Health Care Financing Review 29(3): 27-42, Spring 2008. ↩︎