
Medicaid Enrollment & Spending Growth: FY 2015 & 2016
Introduction
Medicaid enrollment and spending are primarily affected by economic conditions and policy changes. Over the past 15 years, Medicaid enrollment increased substantially during two major recessions, reflecting the countercyclical nature of the program. During economic downturns, when individuals lose their jobs and incomes decline, more people qualify and enroll in Medicaid, which in turn drives increases in total Medicaid spending. During the most recent economic downturns, Medicaid enrollment peaked in 2002, leveled in 2006 and 2007, and then peaked again in 2009. Following economic downturns, Medicaid enrollment and spending growth may slow in the absence of other policy changes. (For additional information about Medicaid financing, the role of Medicaid in state budgets and Medicaid and the economy, see Appendix).
In each of the past five years, the economy has gradually improved and policy changes at the state and federal levels, including those in the Affordable Care Act (ACA), have been driving enrollment and spending growth. The enactment of the ACA had major implications for Medicaid eligibility, enrollment and spending across states. As enacted, all states were to expand coverage to nearly all adults with incomes up to 138 percent of the poverty level (FPL) ($16,242 per year for an individual in 2015). However, the 2012 Supreme Court ruling on the ACA effectively made the decision to implement the Medicaid coverage expansion an option for states. The ACA also required all states to implement new streamlined and coordinated application, enrollment, and renewal processes, including transitioning to a new income standard (Modified Adjusted Gross Income or MAGI) to determine Medicaid financial eligibility for non-elderly, non-disabled populations.
This report provides an overview of Medicaid enrollment and spending growth with a focus on state Fiscal Year (FY) 2015 and state Fiscal Year (FY) 2016. Findings are based on interviews and data provided by state Medicaid directors as part of the 15th annual survey of Medicaid directors in all 50 states and the District of Columbia conducted by the Kaiser Commission on Medicaid and the Uninsured (KCMU) and Health Management Associates (HMA). For a more detailed description of the Methodology used to calculate enrollment and spending growth, please see the “Methods Box” at the end of this brief.
Medicaid Enrollment and Spending FY 2015 and FY 2016
Medicaid enrollment and spending increased substantially in FY 2015, the first full year of implementation of the major ACA coverage expansions. Across all 50 states and DC, Medicaid enrollment increased on average by 13.8 percent in FY 2015, following growth of 8.3 percent the previous year. The sharp increases in these two years were driven by enrollment growth in states implementing the Medicaid expansion. Driven by growth in enrollment, total Medicaid spending increased by 13.9 percent in FY 2015. Growth in total Medicaid spending is expected to drop to 6.9 percent in FY 2016, as the initial effects of the major ACA coverage expansions are largely completed. (Figure 1) Beyond enrollment, states reported that other drivers of increases in spending are provider rate increases and the higher cost of health care, including prescription drugs. Improvements in the economy were a downward pressure on enrollment which affected spending, but downward pressure in enrollment and spending as a result of the improving economy were outweighed by the ACA coverage policy changes.

Figure 1: Economic conditions and policy changes drive growth in Medicaid enrollment and total spending.
Compared to enrollment and total spending growth, state general fund spending for Medicaid across all states grew at more modest levels in FY 2015.1 Historically, state Medicaid spending and total Medicaid spending have increased at similar rates except when there have been statutory changes in the federal Medicaid match rate (officially known as the FMAP, or Federal Medical Assistance Percentage). For example, Congress enacted temporary increases in the federal share of Medicaid during the last two economic downturns that resulted in lower growth in state Medicaid spending compared to total Medicaid spending growth. The magnitude of the federal fiscal relief included in the American Recovery and Reinvestment Act (ARRA) – over $100 billion in additional federal funds over 11 quarters through June 2011 – resulted in declines in state spending for Medicaid in 2009 and 2010. However, the expiration of this relief resulted in higher state Medicaid spending growth in FY 2012 compared to growth in federal Medicaid spending.
More recently, the change in the Medicaid match rate tied to the ACA Medicaid expansion has resulted in a divergence in growth rates for total and state Medicaid spending. For states that expand Medicaid, the federal government pays 100 percent of Medicaid costs of those newly eligible under the Medicaid expansion for calendar years 2014-2016. The federal share phases down to 95 percent in 2017, 94 percent in 2018, 93 percent in 2019 and 90 percent in 2020 and thereafter, well above traditional FMAP rates in every state.
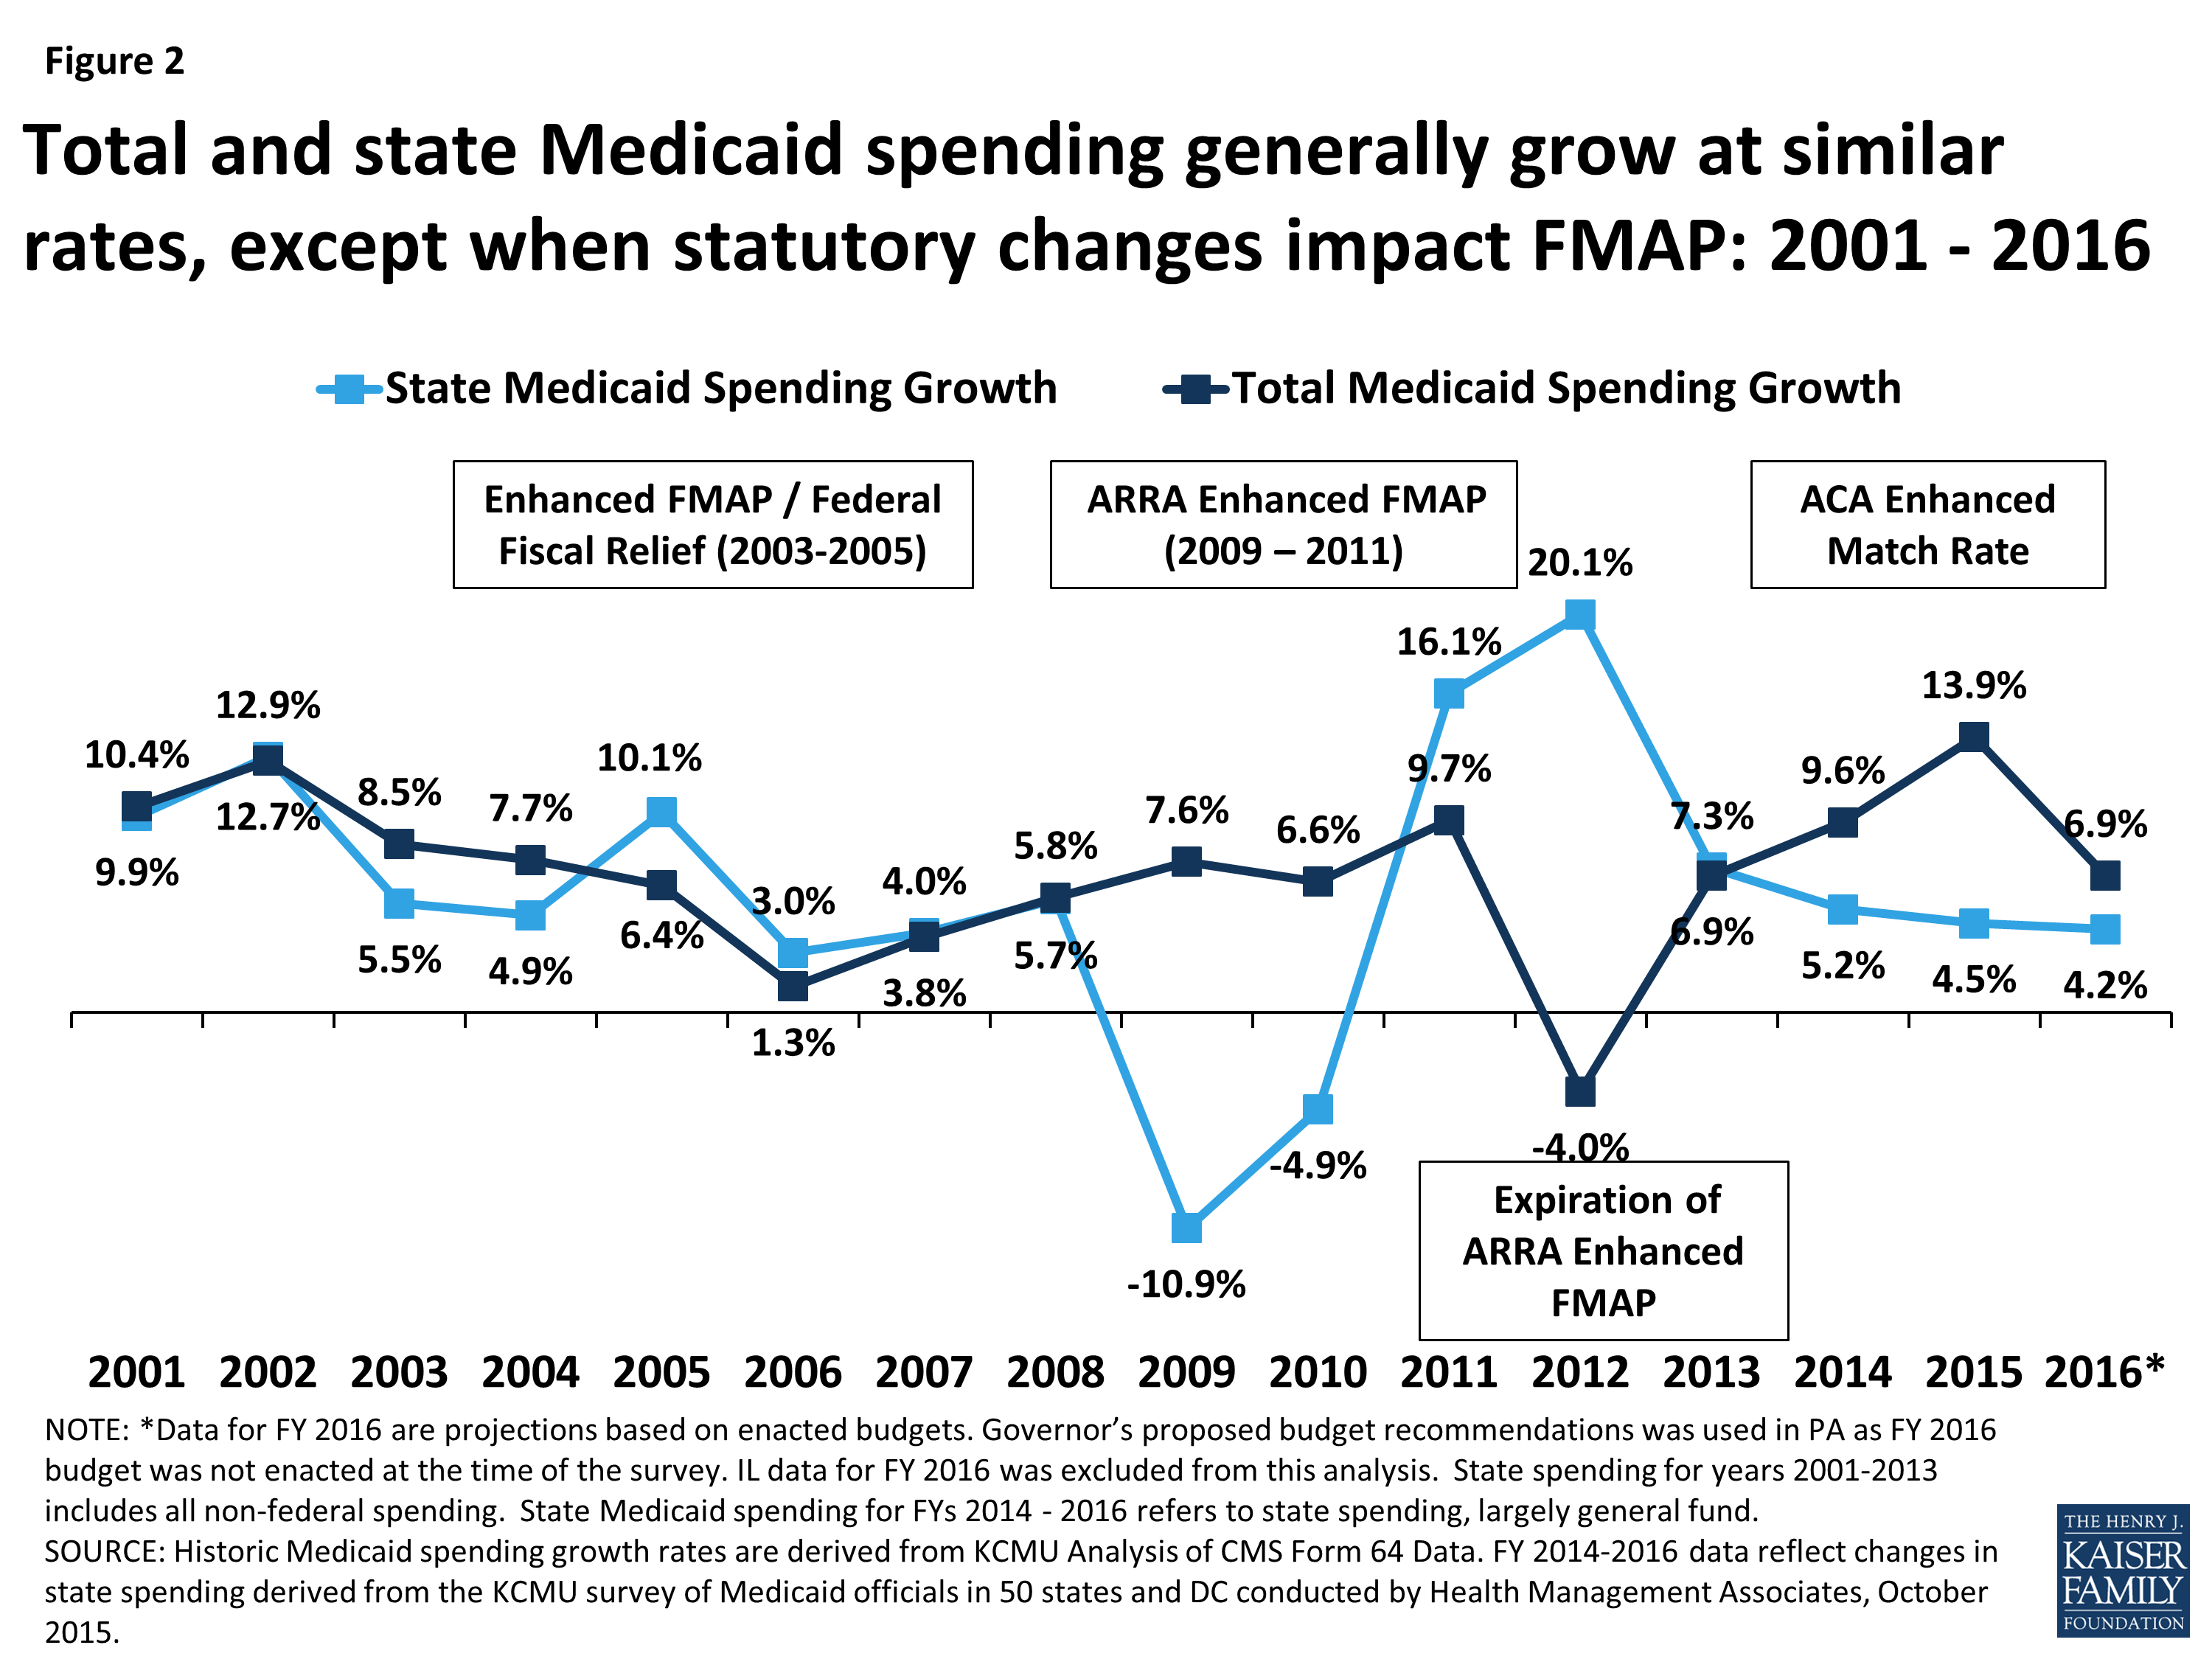
Figure 2: Total and state Medicaid spending generally grow at similar rates, except when statutory changes impact FMAP: 2001 – 2016
As a result of the 100 percent FMAP for newly eligible enrollees in expansion states, state spending for Medicaid across all states increased on average by 4.5 percent in FY 2015, compared to total Medicaid spending growth across all states of 13.9 percent. (Figure 2) State general fund Medicaid spending for FY 2015 grew at a similar rate as overall general fund growth (4.5 percent for Medicaid compared to 4.6 percent for all state general fund growth).2
State Medicaid directors were remarkably accurate in projecting enrollment and spending for FY 2015. Compared to projections included in this report last year, actual enrollment, total spending and state spending averages were on target with state projections. In each of these areas, states expect to see sharp declines in growth for FY 2016 as the full effects of the implementation of the ACA were experienced primarily in FY 2015. (Figure 3)
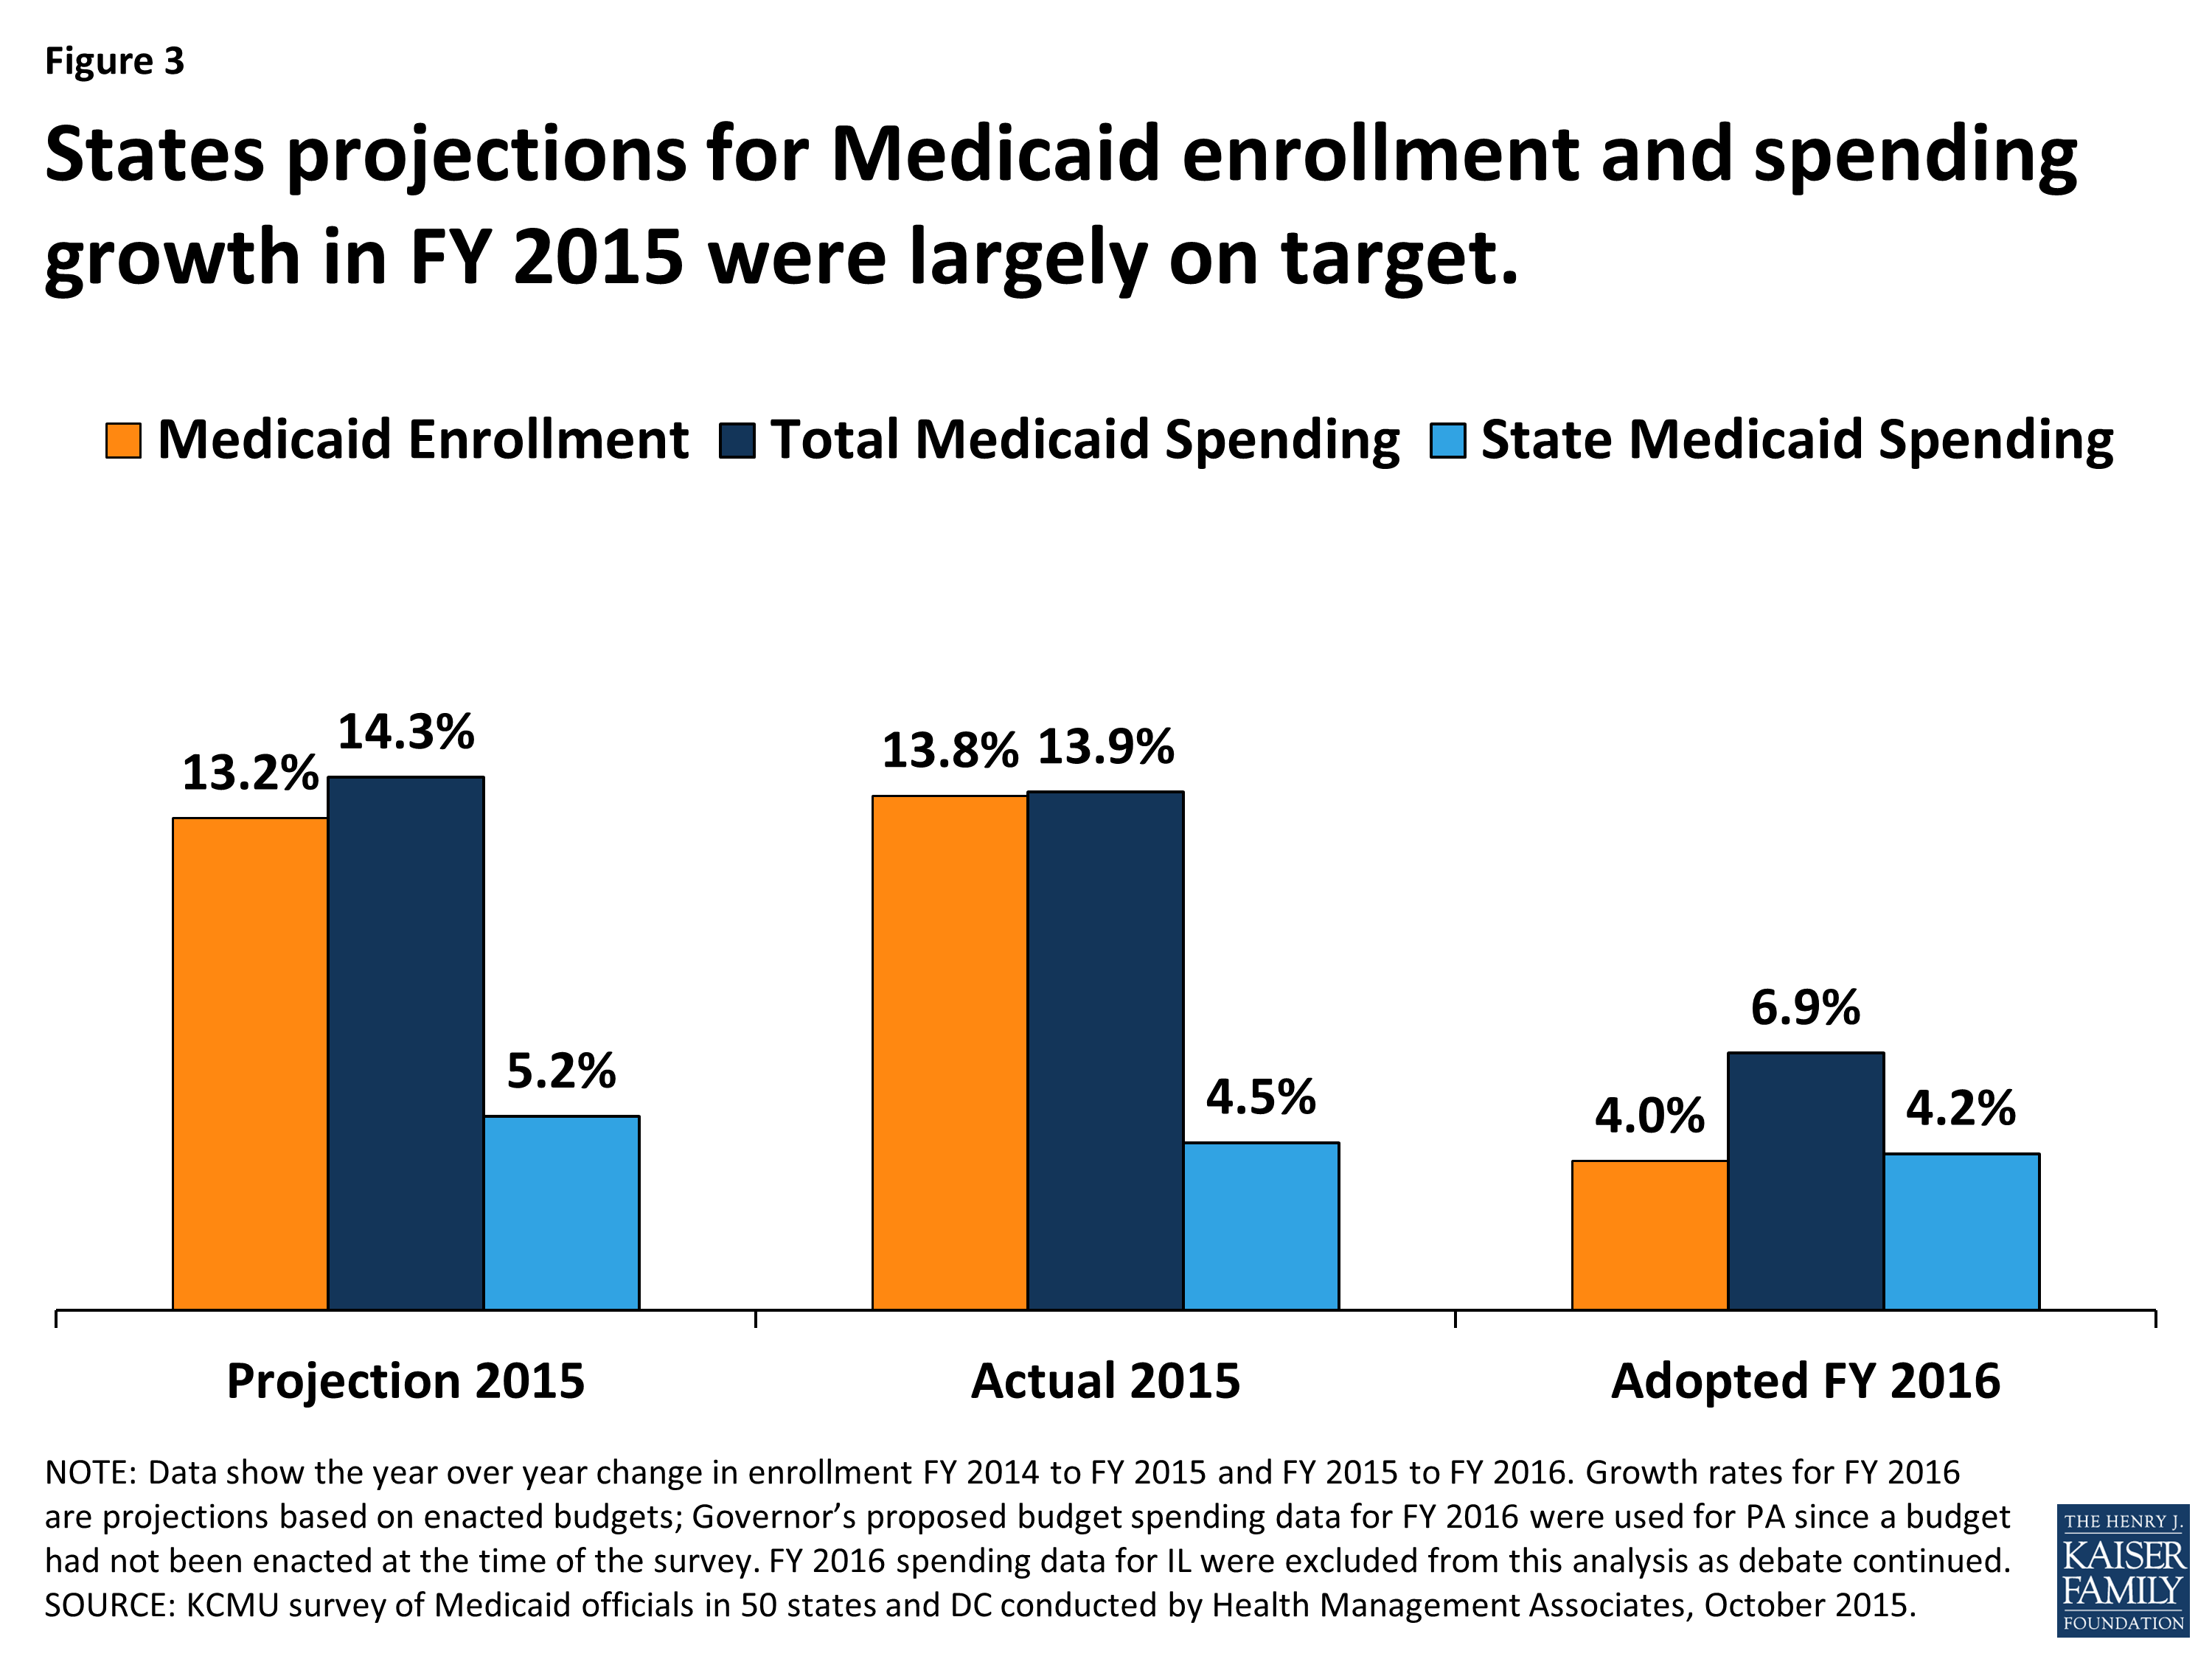
Figure 3: States projections for Medicaid enrollment and spending growth in FY 2015 were largely on target.
Looking ahead to FY 2016, total enrollment and spending growth are projected to slow. Enrollment growth is projected to average just 4.0 percent across all 50 states and DC. This would be a substantial decline from the previous two years. Some uncertainty remains for FY 2016 since, at the time of the survey, legislatures had not yet enacted a final state budget for FY 2016 in Illinois and Pennsylvania.
FY 2015: Expansion and Non-Expansion States
In FY 2015, Medicaid enrollment and total spending growth in expansion states far exceeded growth in non-expansion states. Expansion states reported enrollment and spending growth nearly three times the rate of non-expansion states. (Figure 4) A total of 29 states were implementing the ACA Medicaid expansion in FY 2015, up from the 26 states in the previous year. The three additional states that implemented the Medicaid expansion in FY 2015 were New Hampshire in August 2014, Pennsylvania in January 2015 and Indiana in February 2015.
Across the 29 states expanding Medicaid in FY 2015, enrollment increased on average by 18.0 percent and total spending by 17.7 percent. Enrollment in expansion states was driven by growth among adults qualifying under the new expansion group, although nearly all expansion states also saw increased enrollment among the elderly and two-thirds saw increased enrollment among children. Some expansion states reported declines in enrollment in the eligibility categories for pregnant women, individuals with disabilities and other non-elderly adults as individuals gained coverage under the Medicaid expansion group instead of qualifying based on categorical requirements or through more limited pathways.
Of the 29 states expanding Medicaid in FY 2015, slightly more than half (17 states) noted that enrollment initially increased faster than expected. For most states, the cost of the new enrollees was less than expected; nearly two-thirds of expansion states reported that per member per month costs for the expansion population were at or below projections.3 Across the 29 states that had implemented the ACA Medicaid expansion as of FY 2015, the rate of growth in total Medicaid spending averaged 17.7 percent, very similar to the 18.0 percent enrollment growth rate. (Figure 4)
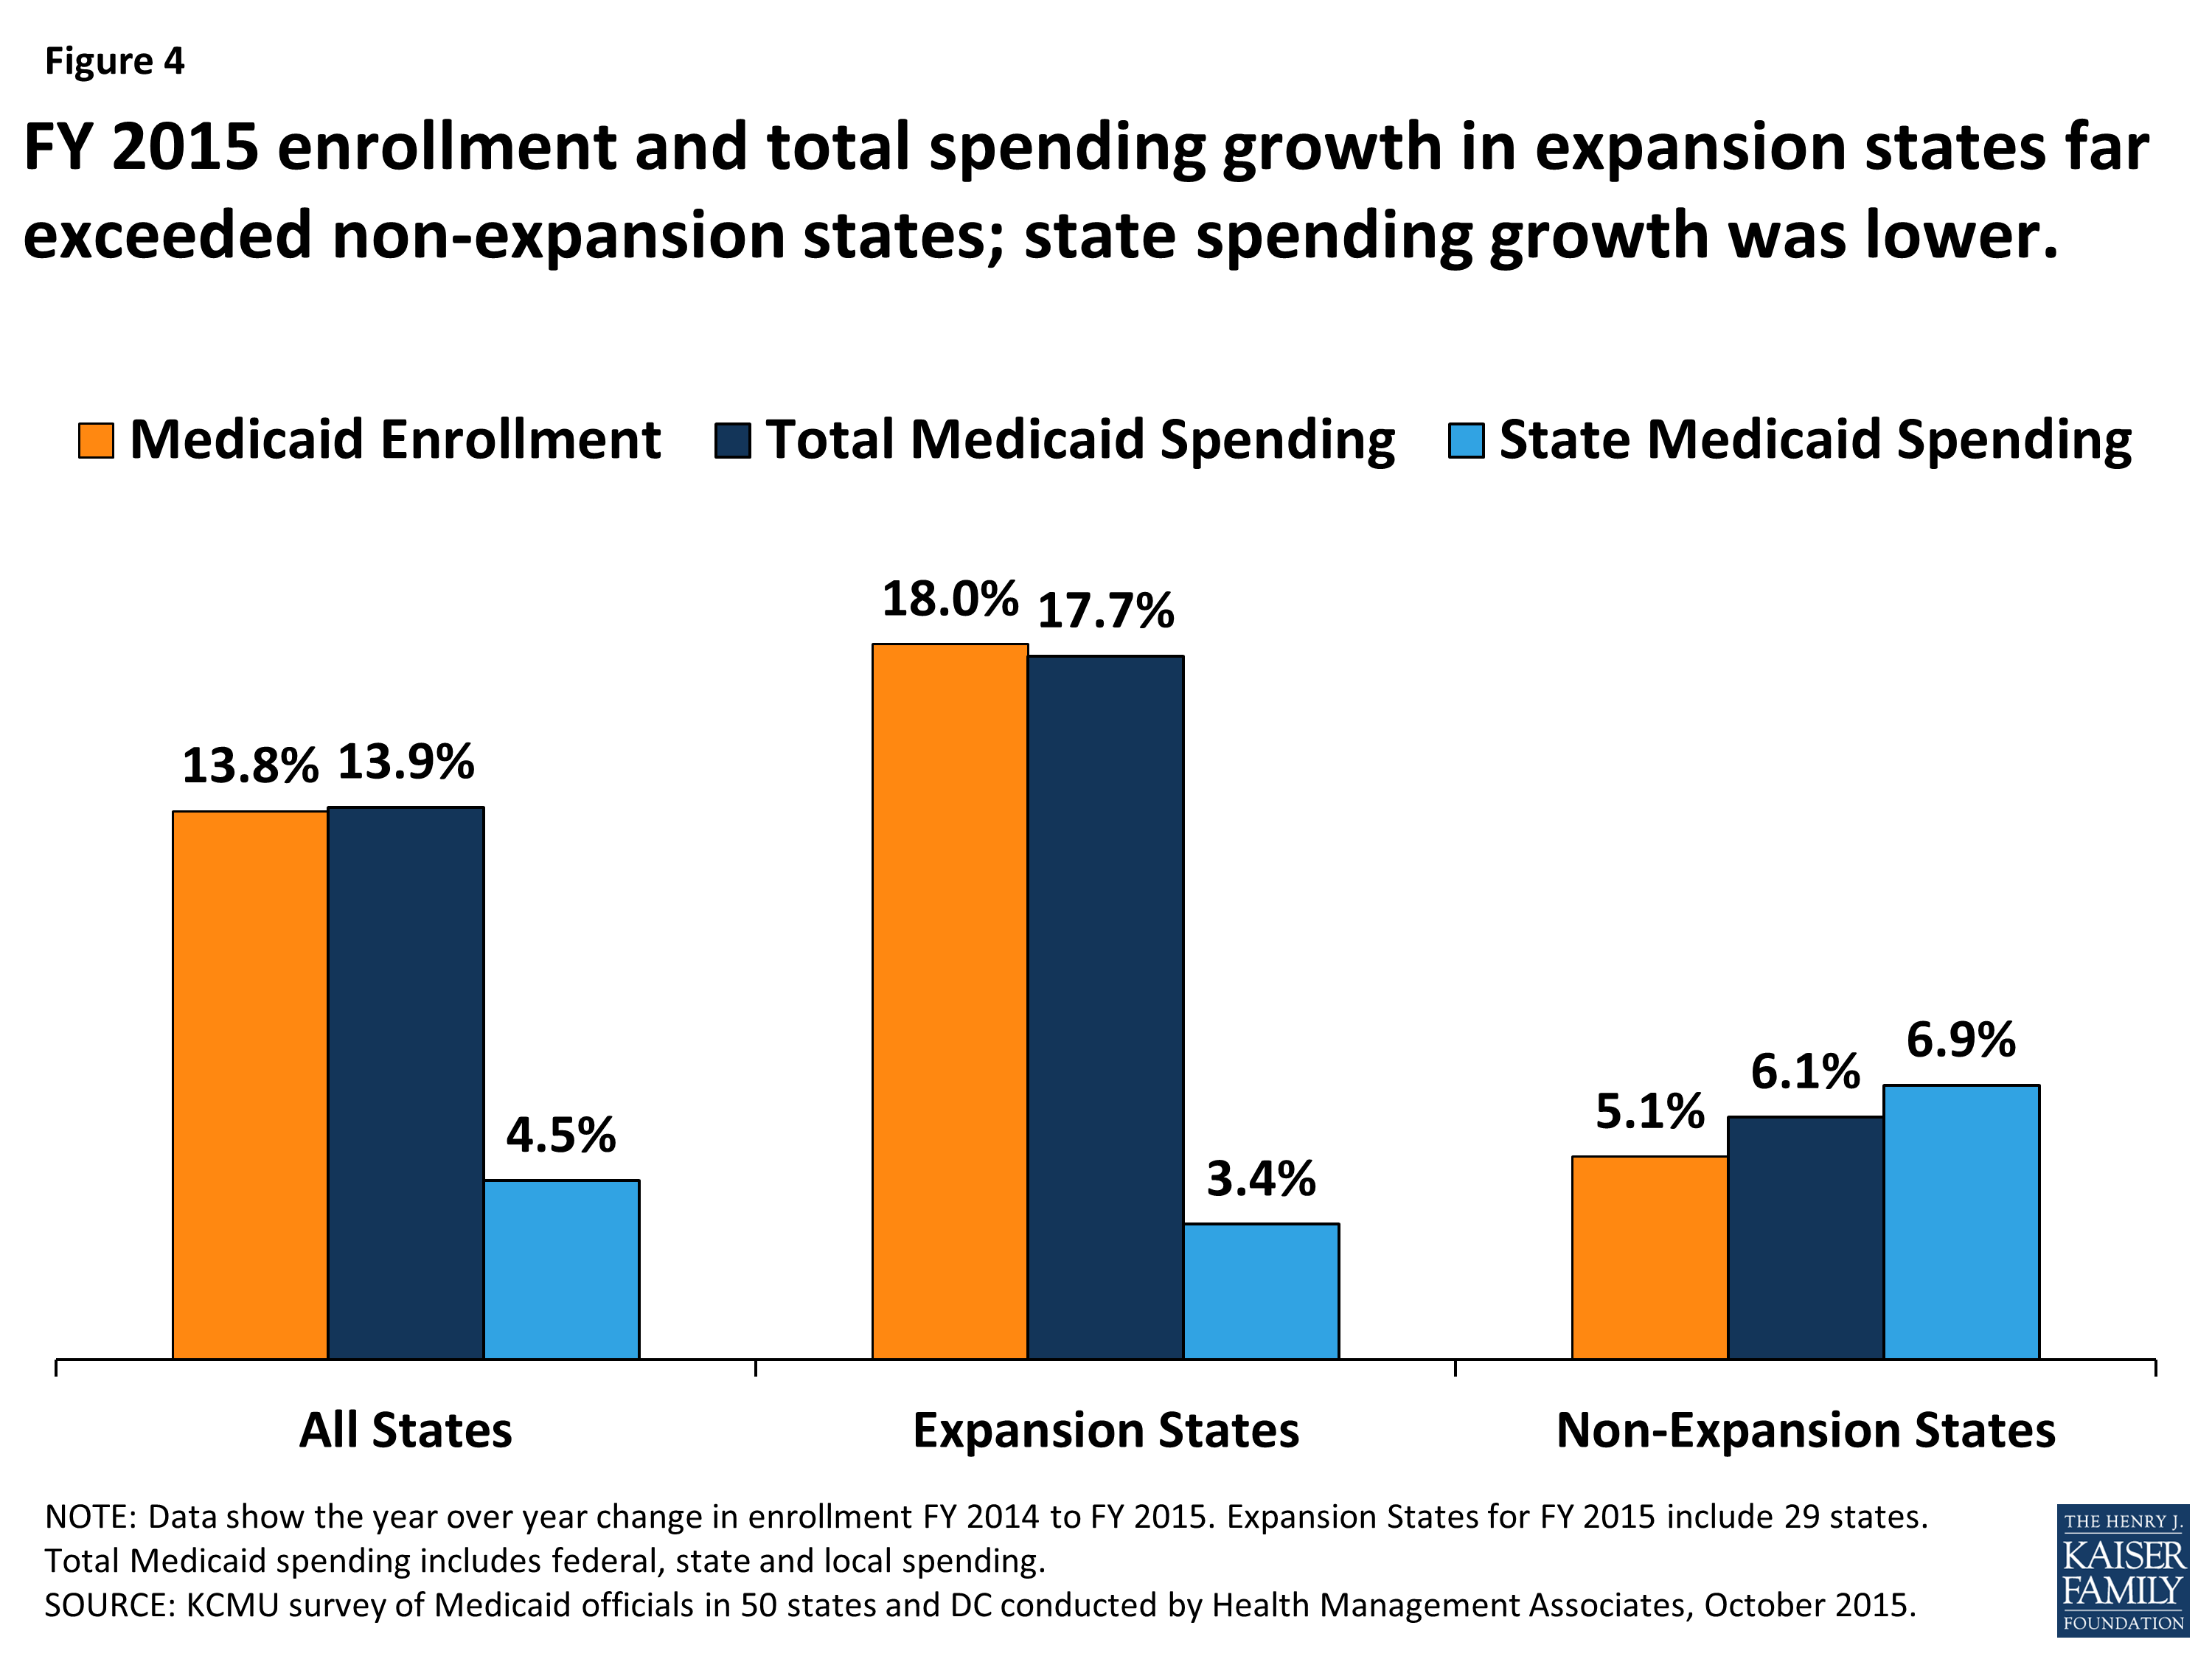
Figure 4: FY 2015 enrollment and total spending growth in expansion states far exceeded non-expansion states; state spending growth was lower.
Across the 22 non-expansion states in FY 2015, enrollment and total Medicaid spending grew 5.1 percent and 6.1 percent (respectively), much slower growth than experienced by expansion states. Increased Medicaid enrollment among “previously eligible but not enrolled” parents and children was the primary reason cited for Medicaid enrollment growth in non-expansion states in FY 2015. Additionally, total Medicaid spending increased on average by 6.1 percent across non-expansion states in FY 2015, also primarily due to growth in Medicaid enrollment. (Figure 4)
Growth in state general fund spending for Medicaid in expansion states was much slower than total Medicaid spending in FY 2015, due to the ACA enhanced FMAP. In the 29 states that had implemented the Medicaid expansion in FY 2015, state general fund spending on Medicaid increased on average by 3.4 percent (compared to total Medicaid spending growth of 17.7 percent). States that implement the Medicaid expansion receive 100 percent federal match for those made eligible by the expansion; therefore, the increase in total Medicaid spending in these states was supported primarily by the increase in federal matching funds to these states.
In FY 2015, across the 22 non-expansion states, state general fund spending on Medicaid increased by 6.9 percent on average, slightly higher than total Medicaid spending growth of 6.1 percent. (Figure 4) Differences between total and state Medicaid spending growth in non-expansion states were driven by annual formula-driven changes in the FMAP, particularly for some large non-expansion states. For example, in Texas the FMAP dropped from 58.69 percent to 58.05 percent, necessitating additional state Medicaid spending to maintain current programs.
Enacted Budgets for FY 2016: Expansion and Non-Expansion States
In FY 2016, the Medicaid enrollment growth rate is expected to slow across all states, and the variation in enrollment growth between expansion and non-expansion states is expected to narrow. (Figure 5) Slower overall growth in Medicaid enrollment in FY 2016 is anticipated because of three main factors. First, enrollment growth among those newly eligible under the ACA Medicaid expansion is moderating, after the initial surge in growth in 2014 or 2015. Second, an improving economy has contributed to less demand for Medicaid. Third, in some states, slowing enrollment is tied to the timing of annual renewals. In response to challenges states faced implementing new eligibility and enrollment systems in 2014, CMS granted waivers to a number of states (expansion and non-expansion alike) to postpone eligibility redeterminations and renewals for several months. Many states that postponed redeterminations reported that enrollment growth moderated or declined when renewal backlogs were addressed and regular renewal procedures were resumed.
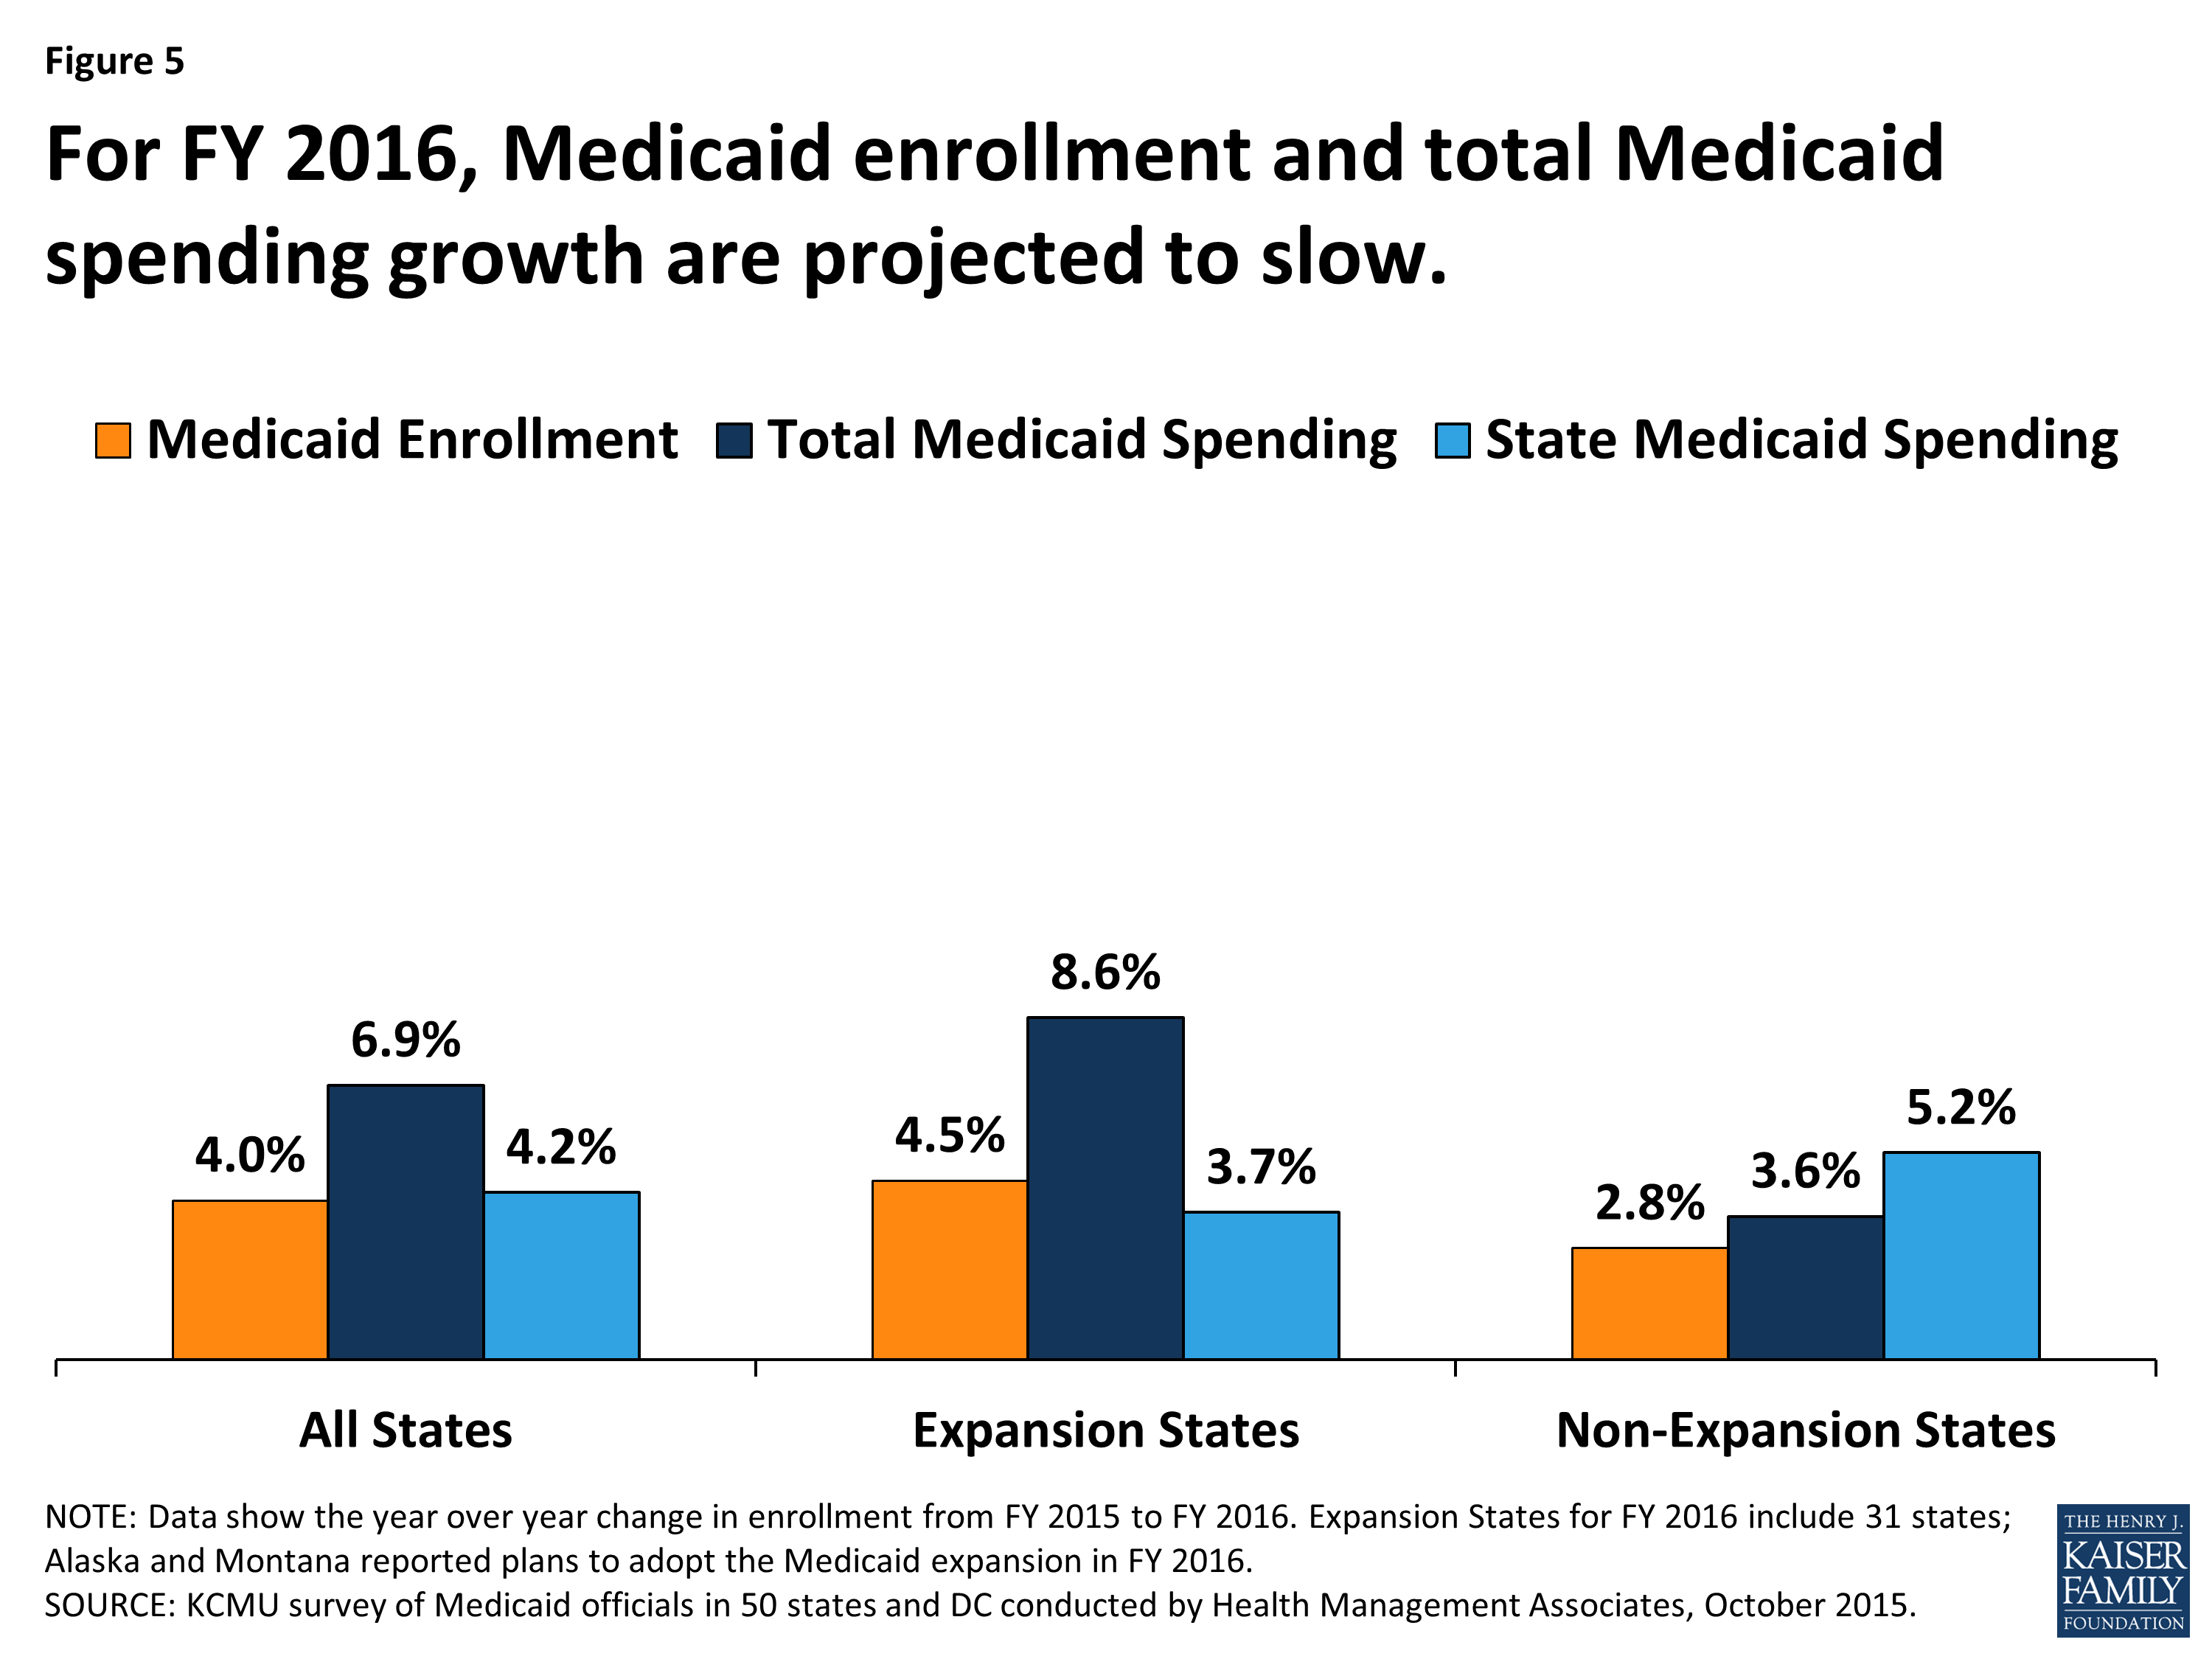
Figure 5: For FY 2016, Medicaid enrollment and total Medicaid spending growth are projected to slow.
In FY 2016, most expansion states expect Medicaid enrollment and Medicaid spending growth to slow, compared to FY 2015. In FY 2016, two additional states plan to implement the Medicaid expansion. Alaska began implementation in September 2015 and Montana plans to implement in January 2016.4 Across the 31 Medicaid expansion states, enrollment is expected to increase on average by 4.5 percent in FY 2016. New enrollment among expansion adults is projected to drive enrollment growth across all expansion states, but particularly in Alaska and Montana (newly adopting states in FY 2016) and in Indiana and Pennsylvania (states that adopted in late FY 2015). Although the other expansion states expect overall enrollment growth driven by the expansion group to continue in FY 2016, these states expect growth rates to moderate substantially compared to FY 2015.
Three states (Minnesota, Massachusetts and Oregon) project that FY 2016 enrollment will be less than FY 2015 enrollment. Minnesota reported that enrollment in Medicaid is expected to decline primarily because of the implementation of the Basic Health Plan (BHP). Under the state’s Basic Health Plan, individuals with incomes between 138% and 200% FPL previously covered under Medicaid were shifted to BHP coverage. Massachusetts projects enrollment to decline among non-elderly, non-disabled adults. Non-elderly, non-disabled adults were temporarily enrolled in Medicaid while the state resolved issues with its eligibility and enrollment system that prevented the completion of Medicaid and Marketplace eligibility determinations. Oregon also projects enrollment to decline across MAGI adults, due in part to the resumption of redeterminations. As enrollment growth is projected to slow in FY 2016, so is total Medicaid spending growth. Across the 31 expansion states, growth in total Medicaid spending in FY 2016 is projected to be 8.6 percent on average. State Medicaid spending growth in expansion states is projected to increase by less than half that rate, on average by 3.7 percent, due to the enhanced ACA match rate for newly eligible adults. (Figure 5)
Across the 20 non-expansion states in FY 2016, Medicaid enrollment is projected to increase on average by 2.8 percent and total Medicaid spending is expected to increase on average by 3.6 percent. Non-expansion states reported that they expect to continue to see some increased participation among those previously eligible but not enrolled, but the resumption of regular renewals and the improving economy are factors working to slow enrollment growth. Slowing enrollment growth is expected to result in slower total Medicaid spending growth.
Formula-driven changes to the traditional federal Medicaid match rate as well as specific issues in some large states are driving changes in state Medicaid spending projections in non-expansion states in FY 2016. Enacted budgets across the 20 non-expansion states authorized state general fund Medicaid spending increases of 5.2 percent on average, compared to average growth in total Medicaid spending of 3.6 percent. This higher growth for state spending is largely attributed to continued declines in the formula driven FMAP for Texas (a significant drop from 58.05 percent to 57.13 percent) and in other states, as well as other state-specific changes in sources of funding. For example, in Florida, another state where changes have a large effect on the weighted average, state general fund spending for Medicaid is expected to increase at a higher rate than for total spending for Medicaid due to changes in funding for its Low-Income Pool (LIP) program. Under the renewal of the Florida LIP waiver, the federal contribution declined substantially resulting in a need for a larger increase state Medicaid spending.
The Effect of the Medicaid Expansion on State Budgets
In addition to increases in health coverage and reductions in the number of uninsured, state decisions about whether to expand Medicaid have broader economic and fiscal implications.5 This year, Medicaid directors in states that implemented the expansion were asked to report if state budget savings were occurring in specific areas outside of the Medicaid program. Early evidence from some expansion states shows that additional federal Medicaid dollars can result in savings in state general fund spending both within the Medicaid budget as well as for other state programs or agencies. Although states reported that isolating the fiscal impact of expanded Medicaid eligibility from other ACA effects and/or other factors affecting health care costs can be a challenge.6 Some Medicaid directors noted that state “savings” were realized by other programs and were reinvested in those programs. Other states noted that savings were generated but did not accrue at the state-level, but did accrue at the county-level.Other Medicaid directors were not able to report whether savings accrued or not, since they were not familiar with other program budgets. However, a number of Medicaid directors did report seeing savings, suggesting these are areas to continue to watch going forward.
- Behavioral Health: Thirteen (13) states reported savings in either FY 2015 or FY 2016 as individuals who previously received state-funded behavioral health services were now receiving those services under Medicaid.
- Uncompensated Care: Six states reported savings for the state budget related to state funding for uncompensated care costs in either FY 2015 or FY 2016.
- Criminal Justice / Corrections: Fifteen (15) states reported savings related to state funding for criminal justice due to the expansion in either FY 2015 of FY 2016. Under federal law, Medicaid reimbursement is available for care provided to eligible individuals who are admitted to an inpatient facility (not on jail or prison grounds), such as a hospital, for at least 24 hours. Prior to the ACA, few states had pursued Medicaid reimbursement for these services given the limited share of the incarcerated population that could qualify for Medicaid.7 With the expansion, a larger share of the incarcerated population may qualify for Medicaid.8
- Revenue: Twelve (12) states reported either provider tax revenues or general revenues had increased in either FY 2015 or FY 2016 due to the expansion.
Conclusion and Looking Ahead
Historically, Medicaid enrollment and spending have been driven largely by economic conditions as well as state and federal policy decisions. Over the past two decades, two major recessions resulted in periods of significant growth in Medicaid program enrollment and spending, with the rate of growth slowing as the economy improved. Since 2014, the implementation of the ACA has been the primary driver of Medicaid enrollment and spending growth, particularly in states implementing the Medicaid expansion. Looking ahead to FY 2016 and beyond, enrollment and spending growth are expected to slow as the effects of the ACA eligibility changes play out both in states implementing and not implementing the ACA Medicaid expansion. Expansion states are also looking ahead to FY 2017 when new state fund dollars will be needed when the enhanced match rate for newly eligible enrollees starts to decline, dropping from 100 percent to 95 percent starting January 1, 2017 (halfway through FY 2017 for most states.) States will also continue to monitor how the ACA provisions are affecting Medicaid enrollment and spending, other areas of the state budget, overall health insurance coverage, and the health care systems in their state. Many states are also engaged in major payment and delivery system reform efforts that have implications for program performance and spending as well as the health and health care for the millions of beneficiaries served by Medicaid.
The authors express their appreciation to Dennis Roberts, who managed the database. We also thank the Medicaid directors and staff in all 50 states and the District of Columbia who completed the survey on which this brief is based.
Topics
