Medicaid Enrollment & Spending Growth: FY 2015 & 2016
Appendix: Background on Medicaid Financing
Medicaid Financing Structure
The Medicaid program is jointly funded by states and the federal government. The federal government guarantees match funds to states for qualifying Medicaid expenditures (payments states make for covered Medicaid services provided by qualified providers to eligible Medicaid enrollees.) The federal match rate (Federal Medical Assistance Percentage or FMAP) is calculated annually for each state using a formula set in the Social Security Act which is based on a state’s average personal income relative to the national average; poorer states have higher FMAPs. Personal income data are lagged, so data used for FFY 2016 FMAPs are from the three years of 2011 to 2013. According to the formula, the FMAP in FFY 2015 varies across states from a floor of 50 percent to a high of 74.2 percent. (Figure 6) This means every $1 of state spending on Medicaid is matched with at least $1 of federal funds.1
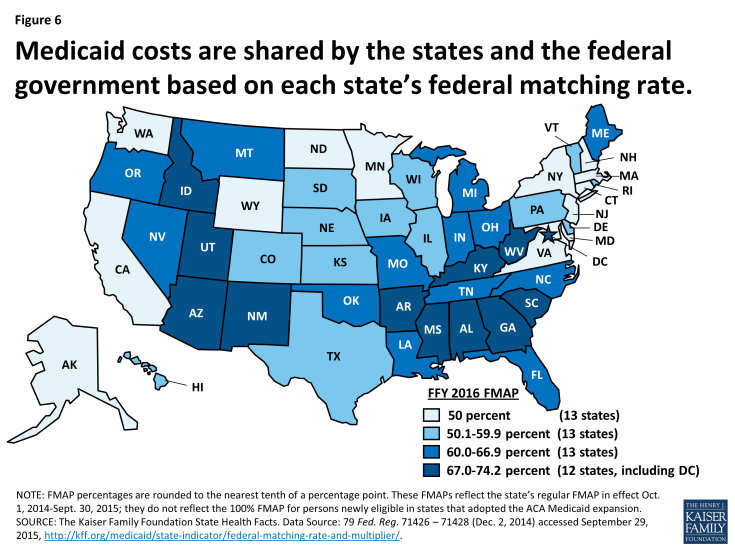
Figure 6: Medicaid costs are shared by the states and the federal government based on each state’s federal matching rate.
Medicaid’s Role in State Budgets
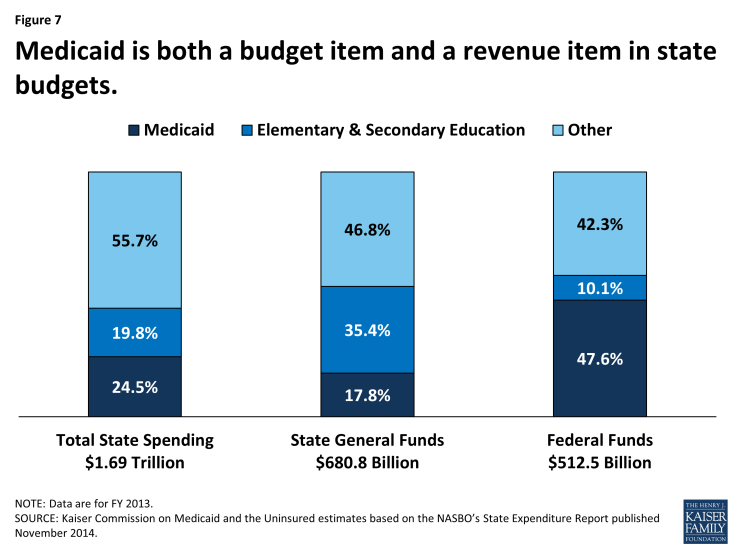
Medicaid has a unique role in state budgets because it is both an expenditure item and a source of federal revenue for states. In FY 2013, Medicaid accounted for 24.5 percent of total spending, but only 17.8 percent of all state general fund spending, a far second to spending on K-12 education (35.4 percent of state general fund spending.)2 Due to the federal match structure for Medicaid, the program is the largest source of federal funds for states, accounting 47.6 percent of all federal funds for states in FY 2013. Over the last decade, shares of general fund spending for Medicaid and K-12 education have remained fairly constant with an uptick in the share of general fund spending on Medicaid since 2010 in part due to the June 2011 expiration of the enhanced FMAP provided by under the American Recovery and Reinvestment Act (ARRA). (Figures 7 and 8)
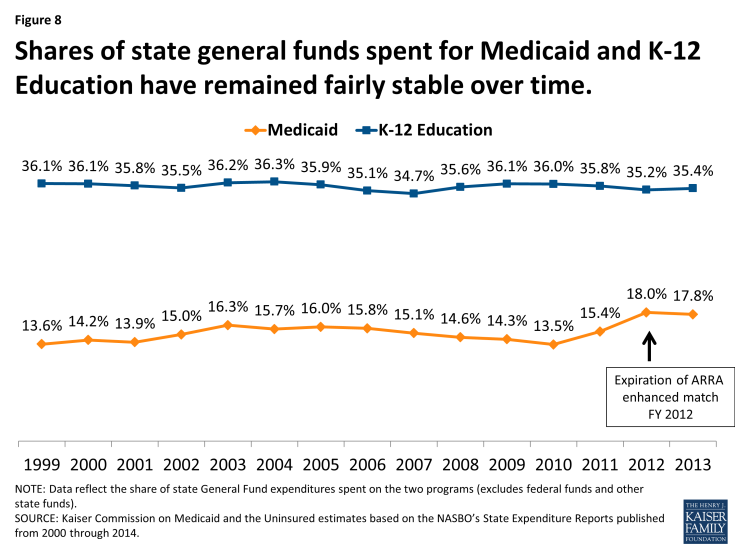
Figure 8: Shares of state general funds spent for Medicaid and K-12 Education have remained fairly stable over time.
Medicaid and the Economy
Medicaid is a countercyclical program. During economic downturns individuals lose jobs, incomes decline and more people qualify and enroll in Medicaid which increases program spending. At the same time, economic downturns negatively affect state tax revenues. This places additional pressure on state budgets as demand for other forms of assistance (i.e. food stamps and unemployment benefits) also increases. During economic downturns, states face difficulty balancing these pressures. In response, Congress has twice passed temporary increases to the FMAP rates to help support states during economic downturns, most recently in 2009 as part of the American Recovery and Reinvestment Act (ARRA.) The ARRA-enhanced match rates provided states with the largest source of federal fiscal relief, over $100 billion in additional federal funds over 11 quarters, ending in June 2011.3
As economic conditions improve, demand for Medicaid coverage moderates. State economies have seen sustained improvement following the worst recession since the Great Depression. The national unemployment rate has continued to decline, falling to 5.1 percent in September 2015, the lowest rate since April 2008.4 Over two-thirds of states had unemployment rates at or below six percent in July 2015. (Figure 9) After 67 months of private-sector job growth, there were over 4.3 million more private sector jobs in September 2015 than before the recession.5 However, an estimated 7.9 million people remain unemployed, nearly 27 percent of whom are long-term unemployed (those actively looking for work for 27+ weeks.6)
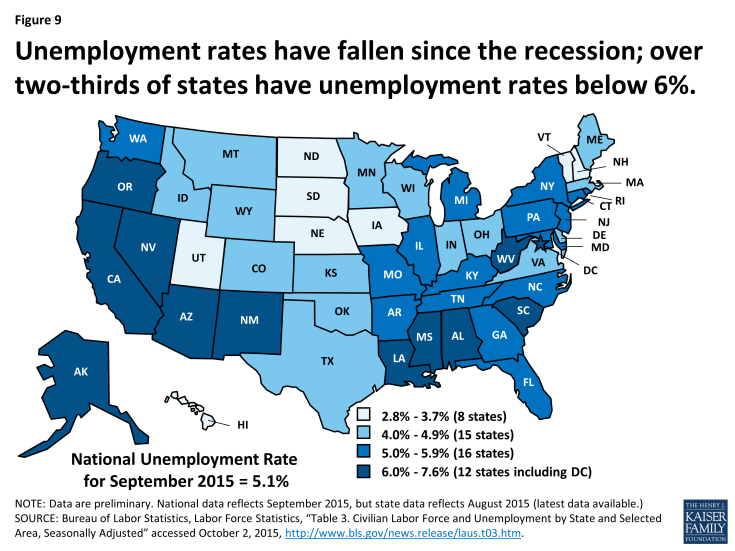
Figure 9: Unemployment rates have fallen since the recession; over two-thirds of states have unemployment rates below 6%.
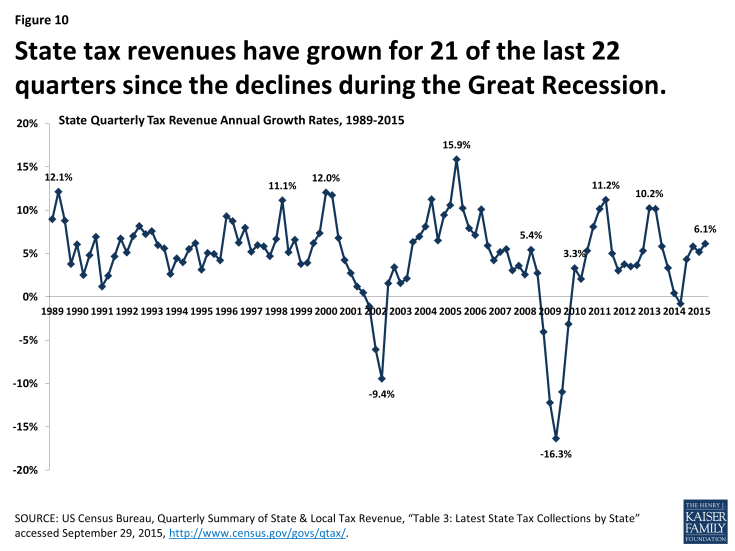
Real gross state product (GSP), a measure of state economic activity, grew by 2.2 percent from 2013 to 2014 at the national level, the fifth year of consecutive growth at the national level. All but two states (Alaska and Mississippi) experienced positive GSP growth from 2013 to 2014, ranging up to 6.3 percent.7 State revenue collections have also improved. After experiencing the sharpest decline in state tax revenues on record during the Great Recession, states had seen tax revenue growth 21 of the last 22 quarters.8 (Figure 10) The improving economic conditions have acted as a downward pressure on Medicaid enrollment growth in recent years. However, the moderating effect of the improving economic conditions has been outweighed by policy changes to expand coverage under the ACA.


