Health Coverage Among American Indian and Alaska Native and Native Hawaiian and Other Pacific Islander People
Introduction
American Indian and Alaska Native (AIAN) and Native Hawaiian and Other Pacific Islander (NHOPI) people have faced significant and longstanding disparities in health and health care, including high uninsured rates. Moreover, these groups face unique challenges in accessing health care, including geographic isolation, economic challenges, and limited access to culturally appropriate care. Although the federal government has a trust responsibility to meet the health care needs of AIAN people, the Indian Health Service (IHS) has historically been underfunded and unable to meet their health care needs. Adding to the challenges, these groups are often excluded from data and analysis due to their smaller population sizes. This limits the visibility and understanding of the challenges they face in accessing health services and inhibits efforts to address them.
Given the importance of increasing understanding of experiences among these groups as part of advancing equity, this brief provides an overview of AIAN and NHOPI people and their health coverage, as well as the implications for access to health care. It is based on KFF analysis of 2017-2021 five-year American Community Survey (ACS) data and includes data for subgroups among AIAN and NHOPI people where possible. The larger sample size of the ACS with multiple years of data allows for this subgroup analysis. However, research suggests these data may undercount some parts of these populations. See Box 1 for notes on data and methods. Key takeaways include the following:
AIAN and NHOPI people come from diverse backgrounds with unique relationships to the U.S. Many AIAN and NHOPI people identify with more than one race and ethnicity. With over 570 federally recognized tribes, AIAN people vary in their cultures and languages, which has important implications for access to health services and other federal benefits. While some live in rural areas and on or near reservations, the majority live in metropolitan areas. NHOPI people have origins in several islands in the Pacific Ocean that have varying relationships with the U.S. Among NHOPI people residing in the 50 states and DC, most live in Hawai’i and California.
AIAN and NHOPI people vary across key factors that influence health, including citizenship, English proficiency, and income. While nearly all AIAN people are U.S. citizens and are English proficient, there is significant variation among NHOPI people in citizenship and English proficiency by ethnicity, reflecting differing relationships of their areas of ethnic origin to the United States. Although the majority of nonelderly AIAN and NHOPI people are in working families, they have higher rates of poverty than White people (20% and 15% vs. 10%, respectively), with significant variation among AIAN and NHOPI subgroups. For example, among nonelderly AIAN people, those who identify as AIAN alone, AIAN and Black, and AIAN and Hispanic are significantly more likely to be low income compared to their AIAN and White counterparts.
Nonelderly AIAN (16%) and NHOPI (9%) people are more likely to be uninsured than White (7%) people, with wide variation in uninsured rates among subgroups. Among nonelderly AIAN people, uninsured rates are higher among those who identify as AIAN alone (22%) and AIAN and Hispanic (20%) than among those who identify as AIAN and White (12%). Additionally, nonelderly AIAN people who live in Alaska and the Southern Plains (23%) have higher uninsured rates compared to other regions. Among nonelderly NHOPI people, uninsured rates range from less than one in ten of Chamorro (8%), Samoan (8%), and Native Hawaiian (9%) people to nearly one in four (24%) Marshallese people.
These disparities in coverage have important implications for AIAN and NHOPI people. Higher uninsured rates among AIAN and NHOPI people contribute to barriers to accessing and utilizing care, which, in turn, can contribute to worse health outcomes. Although the IHS is the primary mechanism through which the federal government fulfills its trust responsibility to provide health care to AIAN people, it is not health insurance and has been historically underfunded and unable to meet their health care needs. As such, coverage remains important for facilitating access to care. Beyond coverage, AIAN and NHOPI people face significant geographic, cultural, and linguistic barriers to accessing health care, further widening disparities in health and health care. AIAN and NHOPI people also face challenges accessing culturally competent care. Improving data available to understand AIAN and NHOPI peoples’ health and health care experiences, engaging with communities to gather input about their priorities and needs, and community led research may further efforts to address these disparities.
Box 1: Notes on Data and Methods
This analysis is based on data from the 2017-2021 five-year American Community Survey (ACS) and includes people who identify as AIAN or NHOPI as defined by the U.S. Census. We include people who identify as AIAN or NHOPI alone or in combination with another race or ethnicity except where specified as AIAN alone or NHOPI alone. In cases where specified as AIAN alone or NHOPI alone, the data are limited to individuals who identify their race solely as AIAN or NHOPI and report non-Hispanic ethnicity.
Data are limited to people in these groups residing within the 50 states and DC. People who identify as AIAN and NHOPI who reside in areas outside the contiguous 50 states and DC, including US territories and the Federated States of Micronesia are not included in this analysis due to data limitations.
Among AIAN people, data are reported by racial and ethnic subgroup, self-attested Tribal status, and IHS region.
- The AIAN racial and ethnic subgroups include AIAN alone, AIAN and White, AIAN and Black, AIAN and Hispanic, AIAN and Asian, AIAN and two or more other races.
- Tribal affiliation is only reported among individuals who identify as AIAN alone due to data limitations and is based on whether respondents write the name of an “enrolled or principal tribe” in set aside boxes in the ACS. In this brief, individuals who report a specific Tribe are defined as Tribally affiliated and individuals who do not are classified as not Tribally affiliated.
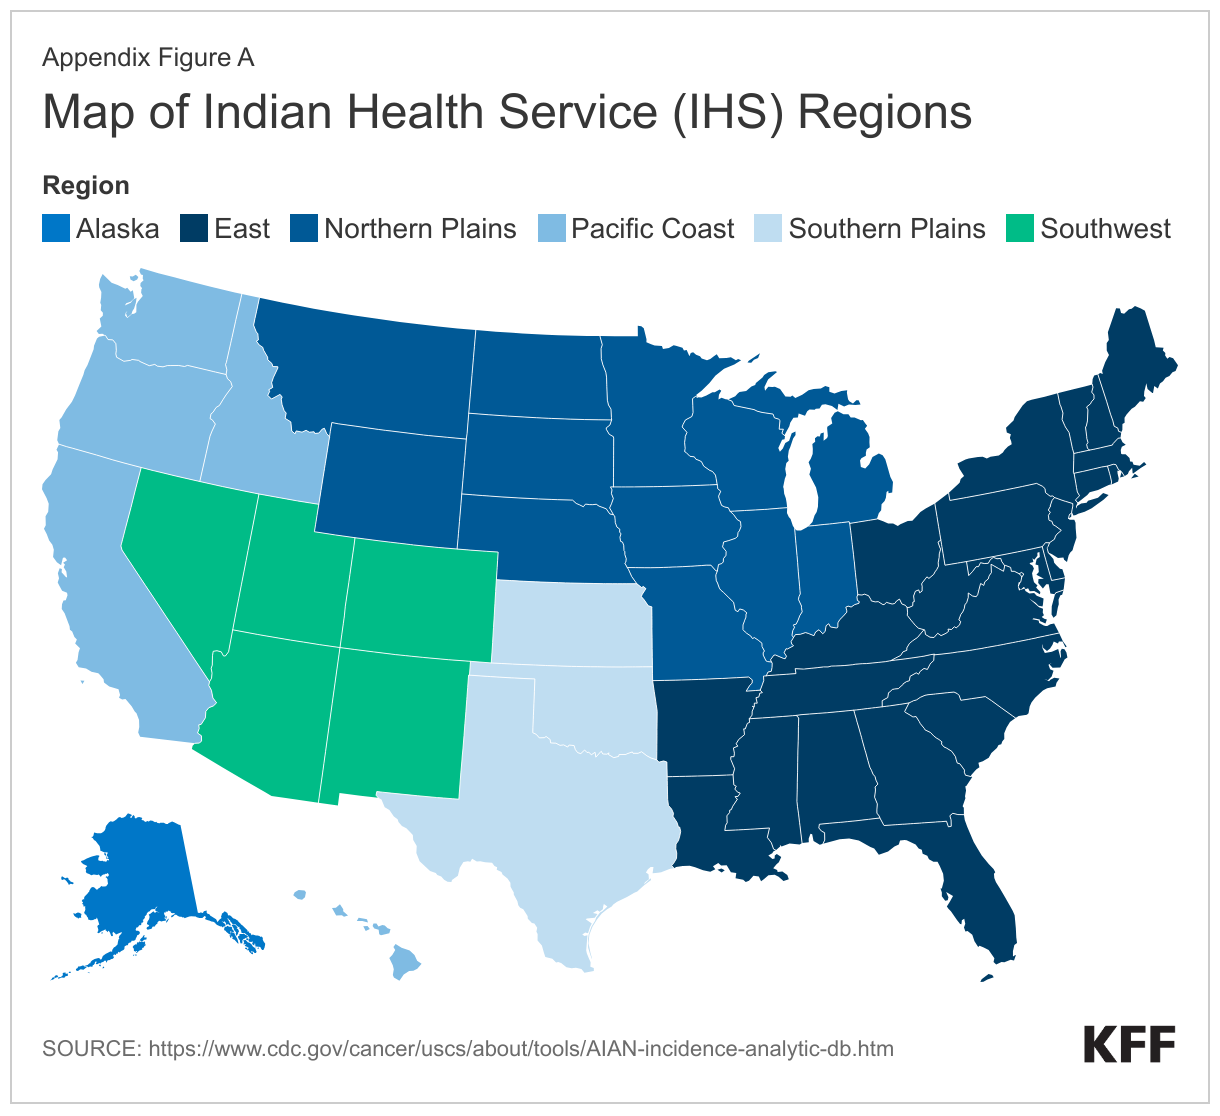
- IHS region is defined using state level groupings commonly used by some federal agencies and in published researched. This definition divides the states into six regions: East, Northern Plains, Southern Plains, Southwest, Pacific Coast, and Alaska (see Appendix 1A). While the IHS divides its services into 12 regions, the six-region definition was selected to align with the available geographies in the ACS data file.
Among NHOPI people, data are reported for ethnic identity, and geographic region. Data reported by ethnic identity are limited to NHOPI people who identify as NHOPI alone and includes people who identify as Native Hawaiian alone, Samoan alone, Tongan alone, Chamorro alone, Marshallese alone, Fijian alone, and other Pacific Islander alone. Geographic region is categorized using the Census geographic regions and include Northeast, Midwest, South, and West.
Overview of AIAN and NHOPI People in the U.S.
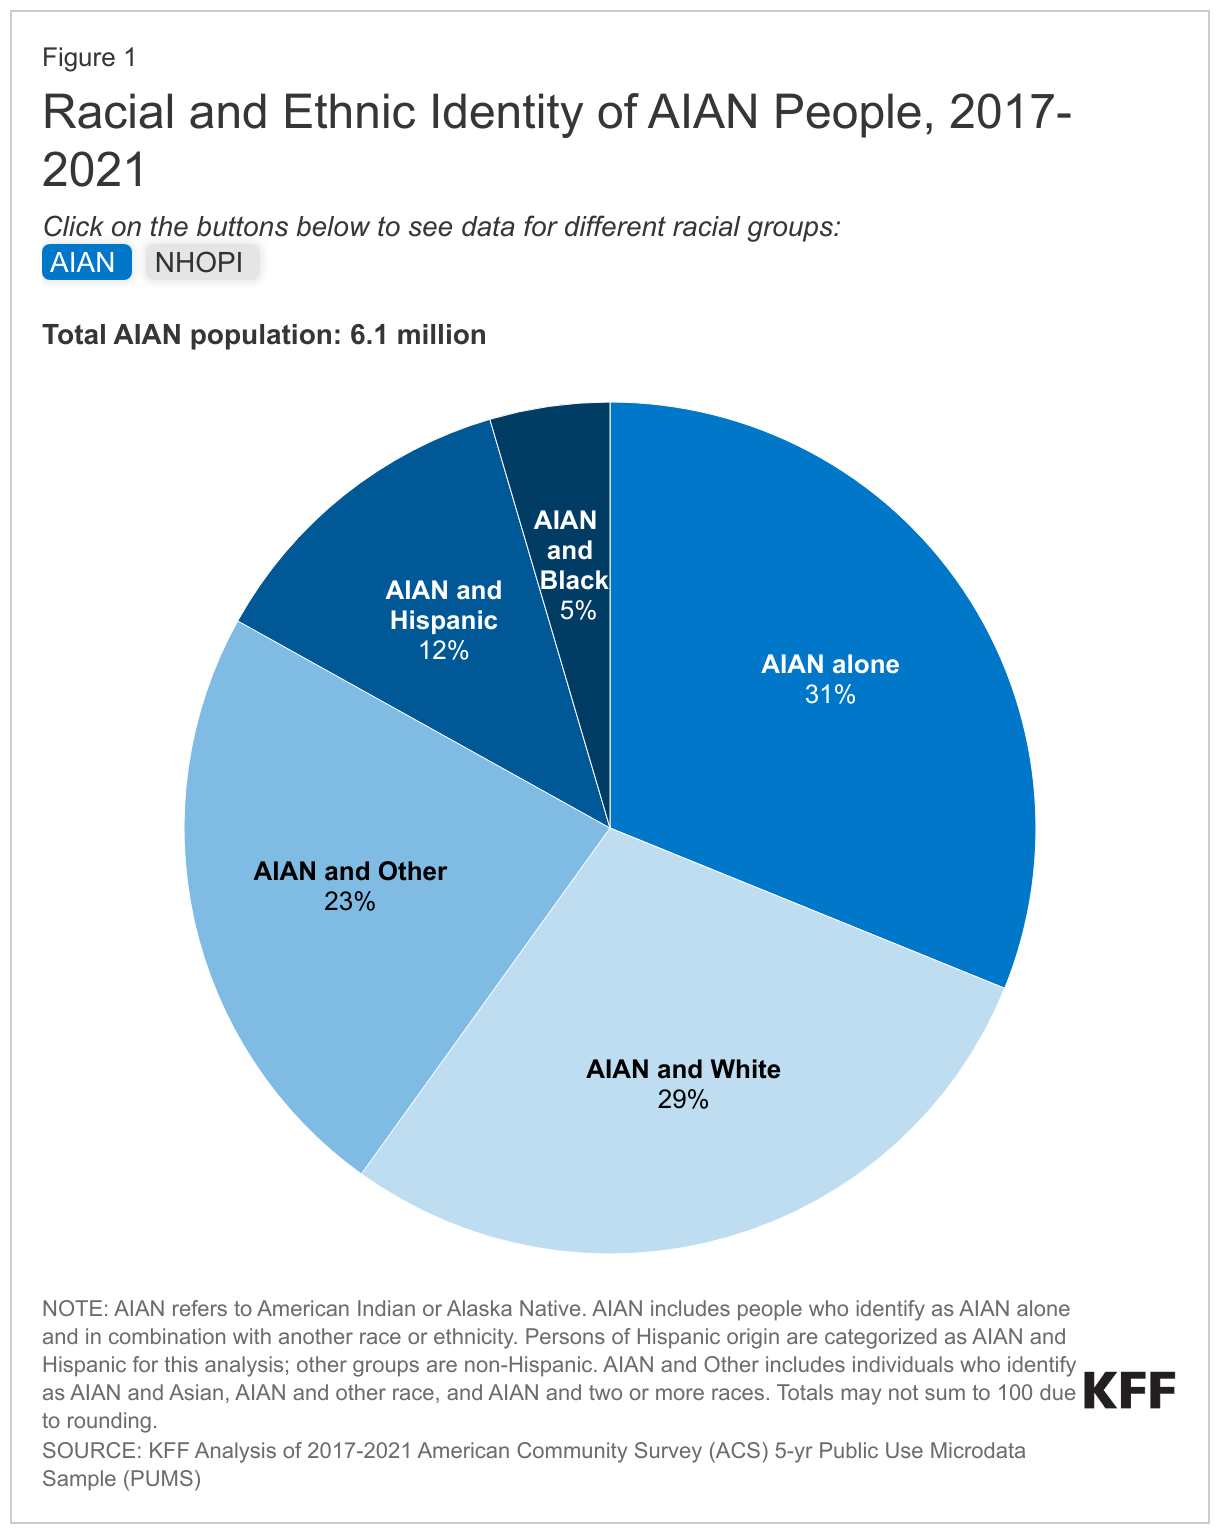
The AIAN and NHOPI populations have grown over time and become increasingly multiracial. Compared with other racial groups, AIAN and NHOPI people are more likely to identify as multiracial. Nearly one in three (31%) AIAN people identify as AIAN alone while 69% identify as AIAN and another racial or ethnic group, including 29% who say they are AIAN and White, 13% who say they are AIAN and Hispanic, and 23% who say they are AIAN and another race, including those who say they are AIAN and Black, AIAN and Asian, or AIAN and more than two other races (Figure 1). Similarly, among the nearly 1.4 million people in the U.S. who identify as NHOPI, 36% identify as NHOPI alone while nearly two in three (64%) say they are NHOPI and another racial or ethnic group, including 38% who say they are NHOPI and two or more other races, 13% who say they are NHOPI and White, 7% who say they are NHOPI and Asian, and smaller shares who report they are NHOPI and Hispanic (4%) or NHOPI and Black (1%). The numbers of AIAN and NHOPI people who identify with more than one racial or ethnic group have grown over time, likely reflecting some demographic shifts as well as changes in the design of questions used to identify race and ethnicity.
Some AIAN people are enrolled in a federally recognized Tribe or a state-recognized Tribe, and others are not enrolled in a Tribe. Tribal enrollment has important implications for access to benefits since members and descendants of members of federally recognized Tribes have broader access to certain federal programs, including the Indian Health Service. Overall, 89% of people who identify as AIAN alone indicate they are affiliated with a Tribe in the ACS data, while 11% do not identify a Tribal affiliation.
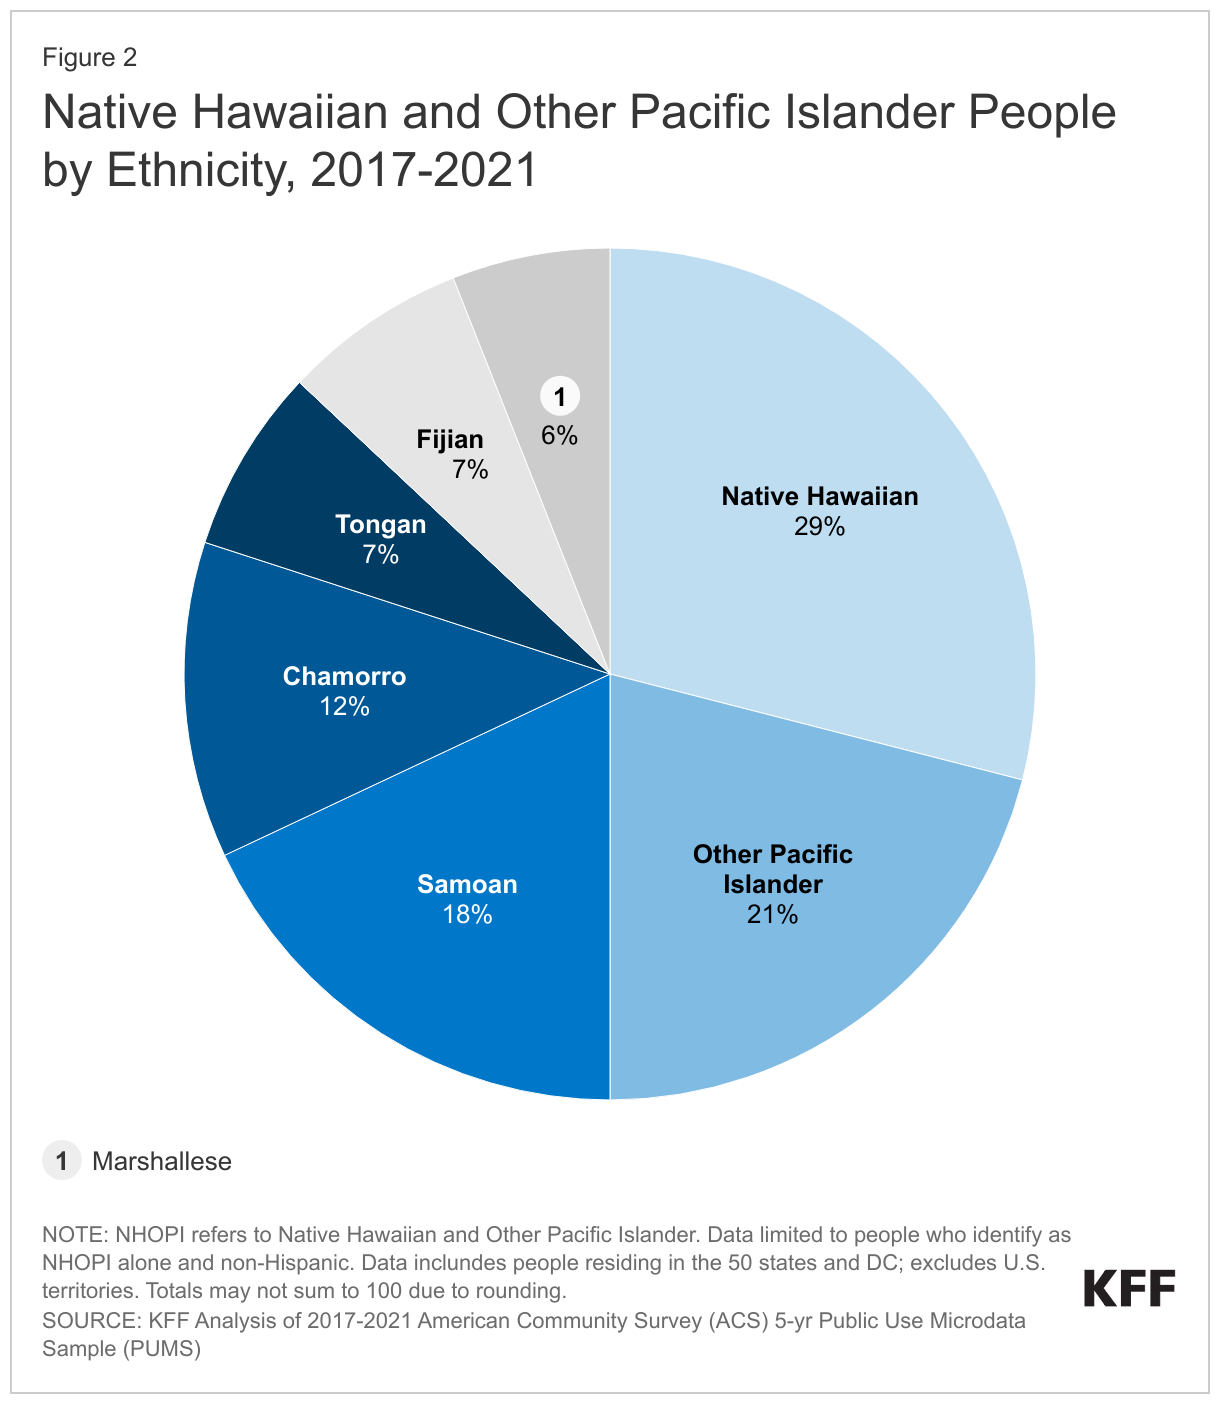
NHOPI people include diverse populations originating from several islands in the Pacific Ocean with varying relationships with the U.S. The majority of people who identify as NHOPI alone and are residing in the 50 states and DC are Native Hawaiian (31%), while another 17% are Samoan, 13% are Chamorro, and less than on in ten are Fijian, Marshallese, and Tongan (Figure 2).
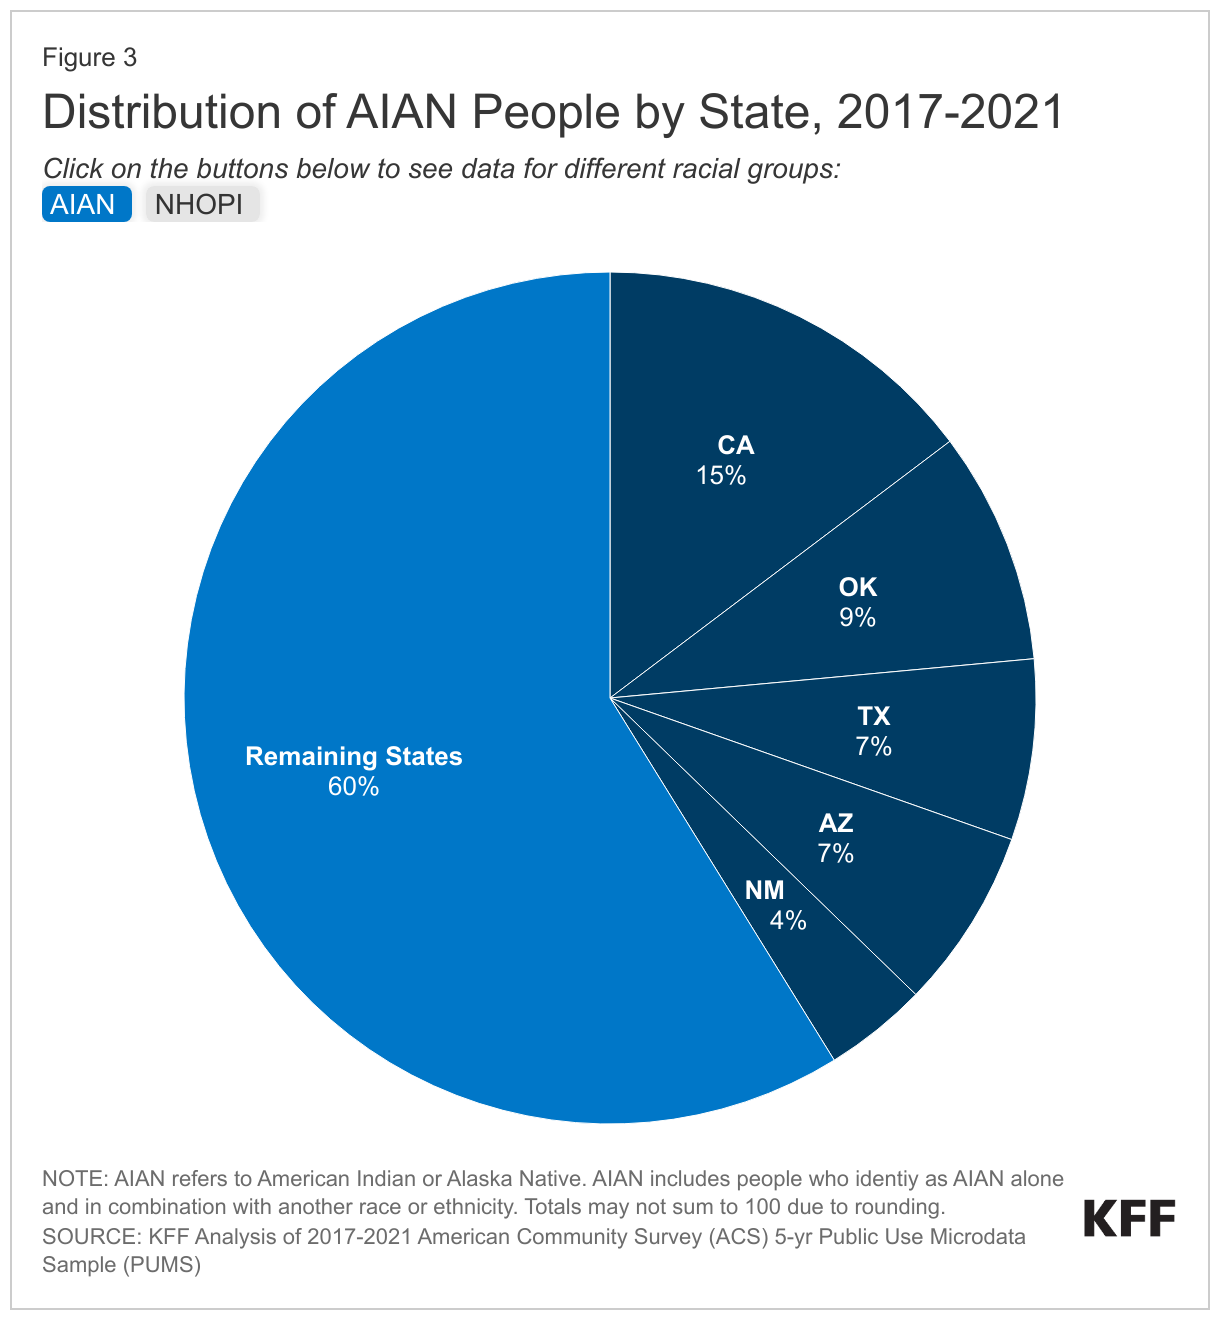
AIAN and NHOPI people live across the country but are concentrated in certain states (Figure 3). Three quarters (75%) of AIAN people live in the Southern (34%) and Western (41%) regions of the country with four in ten residing in just five states: California (15%), Oklahoma (9%), Texas (7%), Arizona (7%), and New Mexico (4%). (Among people who identify as AIAN alone, nearly half (49%) live in the Western region, with most living in Oklahoma, Arizona, and New Mexico.) While many AIAN people live in rural areas, only 13% live on reservations or land trusts. As of 2020, 60% of AIAN people live in metropolitan areas. Among NHOPI people living within the 50 states and DC, nearly half reside in Hawai’i (26%) and California (23%) (Figure 3). NHOPI people also reside outside of the states in the U.S. territories of Guam, Samoa, the Commonwealth of the Northern Mariana Islands (CNMI), and the Freely Associated States (FAS) of Micronesia, the Republic of the Marshall Islands, and the Republic of Palau. However, data available for NHOPI people living in the territories and FAS are limited.
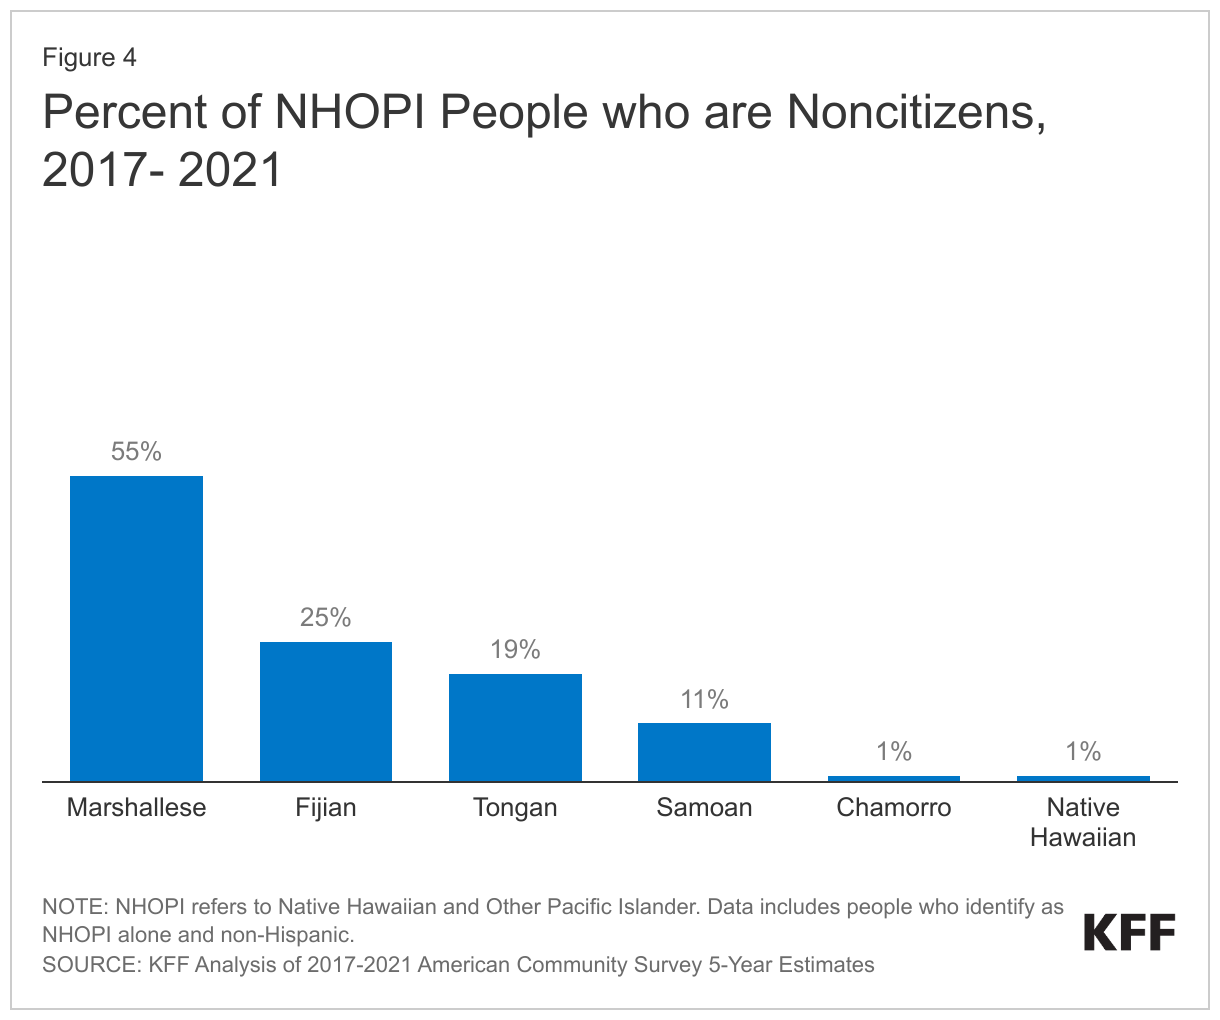
While nearly all AIAN people (96%) are U.S. citizens, citizenship status among NHOPI people residing in the U.S. varies, reflecting differences in citizenship rights across locations to which NHOPI people trace their origins. For example, nearly all Native Hawaiian and Chamorro people are U.S. citizens while over half (55%) of Marshallese, 25% of Fijian, 19% of Tongan, and 11% of Samoan people are noncitizens (Figure 4). This variation reflects differences in constitutional and birth citizenship rights across locations to which NHOPI people trace their origins. For instance, people born in Hawai’i and the U.S. territories Guam (Chamorro people) and Northern Mariana Islands are U.S. citizens by birth. However, those born in the U.S. territory American Samoa are not granted citizenship but instead are considered U.S nationals, a status that excludes them from voting and holding any government office or certain government jobs. People born in the FAS (the Marshall Islands, Micronesia, and Palau) are not conferred U.S. citizenship at birth. Instead, the FAS are independent nations that each have a Compact of Free Association (COFA) with the U.S. government. The remaining Pacific Islands -- including Tonga, Fiji, and Samoa -- are independent nations and therefore NHOPI people born in these countries are not provided U.S. citizenship at birth.
English Proficiency, Work Status and Income
Among the nonelderly population, AIAN and NHOPI people vary across key factors that influence health coverage, including English proficiency, work status and income.
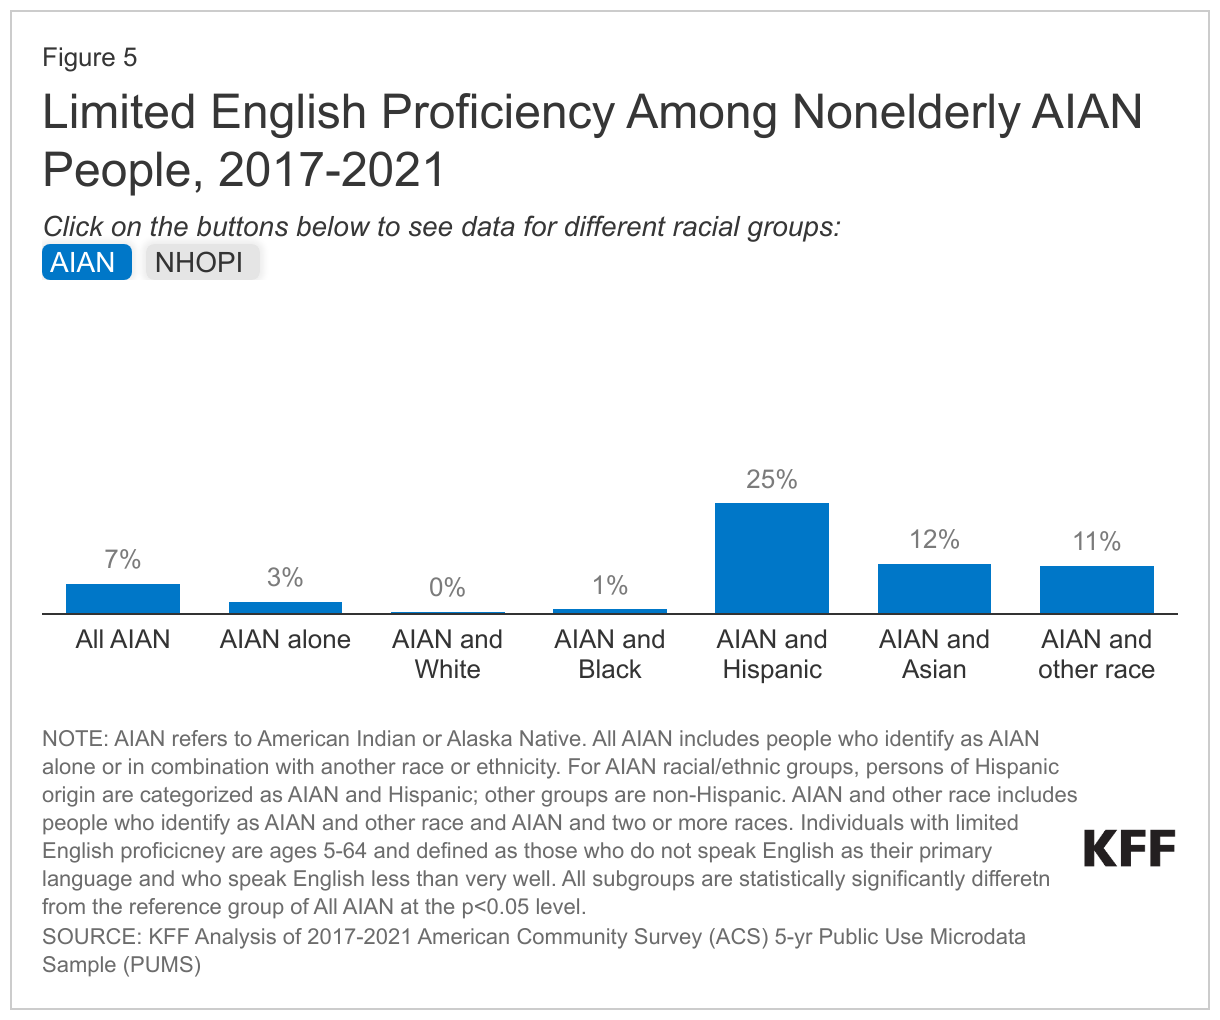
AIAN and NHOPI people are more likely to have limited English proficiency compared to their White counterparts. Nearly one in ten nonelderly AIAN (7%) people and NHOPI (7%) people report speaking English less than very well compared to 1% of White people, reflecting that these groups have their own languages that were used prior to colonization. There are wide variations in English proficiency among AIAN and NHOPI subgroups (Figure 5). Among nonelderly AIAN people, the share of people who report speaking English less than very well ranges from less than one percent for people who identify as both AIAN and White to 25% for those who identify as AIAN and Hispanic. Among NHOPI people, the share of people who report speaking English less than very well ranges from 2% for Native Hawaiian people to 35% for Marshallese people.
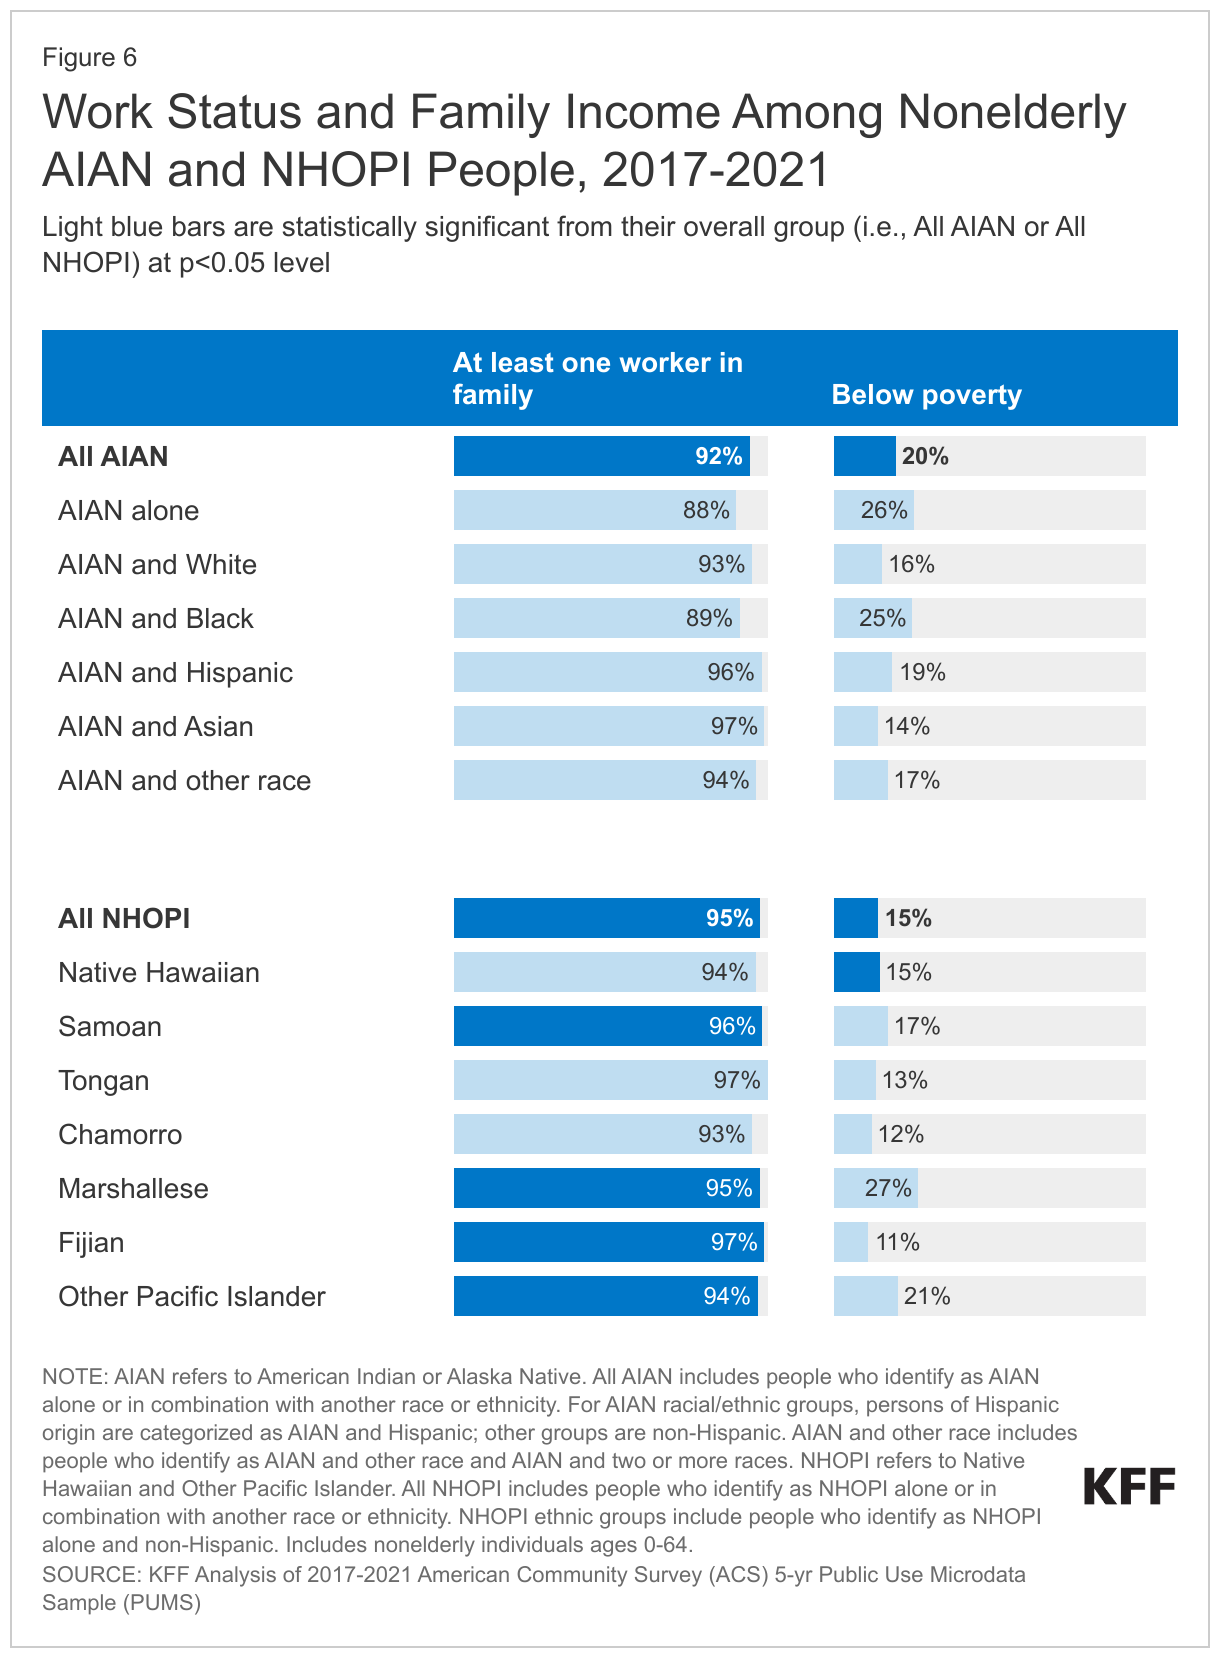
The majority of nonelderly AIAN and NHOPI people are in working families, but there is significant variation in income among AIAN and NHOPI people. More than nine in ten nonelderly NHOPI (95%) and AIAN (92%) people are in a family with at least one worker, similar to the share of nonelderly White people (95%). Although the majority are in working families, nonelderly AIAN (20%) and NHOPI (15%) people are significantly more likely to have income below the poverty level than their White counterparts (10%), reflecting disproportionate employment in lower wage jobs. Among nonelderly AIAN people, the share of households with incomes below the federal poverty level ranges from 14% among people who identify as AIAN and Asian to 26% among people who identify as AIAN alone and those who identify as AIAN and Black, largely reflecting differences in family work status (Figure 6). Among NHOPI people, the share of households with incomes below the federal poverty level ranges from over one quarter of Marshallese people (27%) to 11% among Fijian people.
Health Coverage for AIAN and NHOPI People
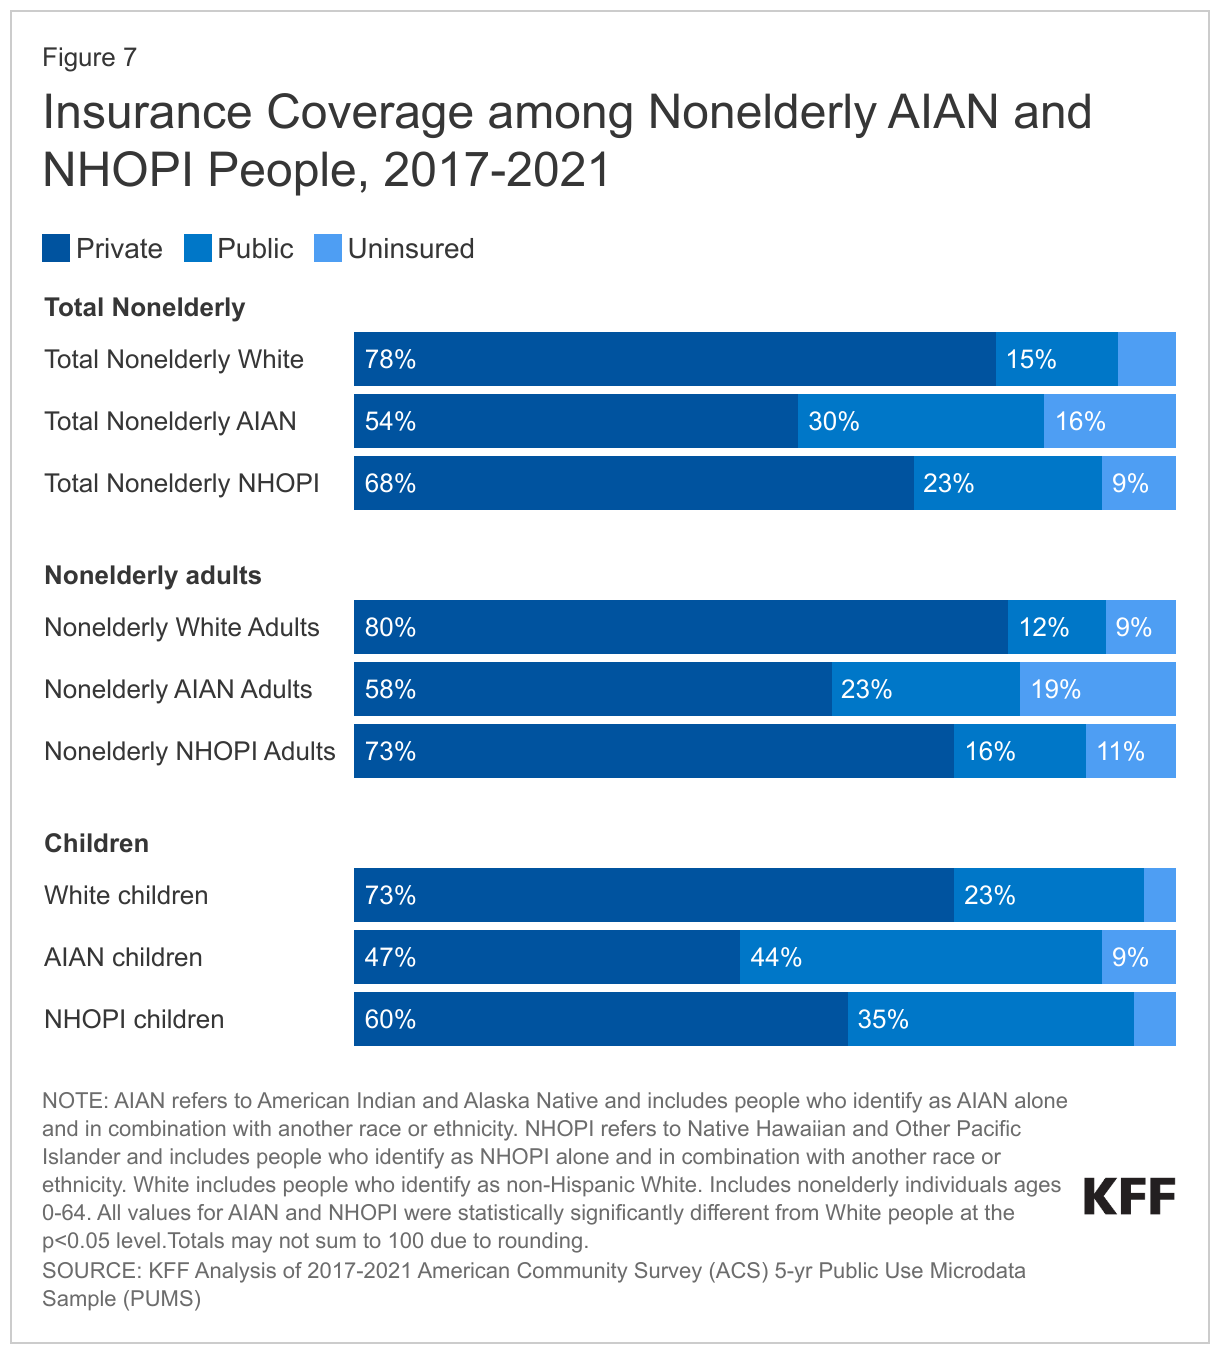
Among the nonelderly population residing in the U.S., 16% of AIAN people and 9% of NHOPI people were uninsured compared with 7% of White people (Figure 7). Both AIAN (54%) and NHOPI (68%) people have lower rates of private coverage compared to their White counterparts (78%) reflecting disproportionate employment in lower wage jobs that are less likely to offer health coverage. Medicaid coverage helps fill some of this gap in private coverage, particularly among children. Three in ten (30%) nonelderly AIAN people and nearly one quarter (23%) of nonelderly NHOPI people have Medicaid coverage compared to 15% of their White counterparts. Medicaid and the Children’s Health Insurance Program (CHIP) cover larger shares of children than adults, reflecting more expansive eligibility levels for children. Over four in ten AIAN children (44%) and 35% of NHOPI children are covered by Medicaid or CHIP. However, AIAN (9%) and NHOPI (5%) children still remain more likely to be uninsured compared with their White peers (4%), although the difference for NHOPI children is small.
Health Coverage Among AIAN People
Health coverage for AIAN people is important despite the role of the IHS (see Box 2). Under treaties and laws, the U.S. has a unique responsibility to provide certain rights, protections, and services to AIAN people, including health care. The IHS is the primary vehicle the U.S. government uses to fulfill this responsibility, although chronic underfunding and other barriers continue to limit access to care for AIAN people. The IHS provides health care and disease prevention services to AIAN people through a network of hospitals, clinics, and health stations. The services provided through the IHS consist largely of primary care and include some ancillary and specialty services. Direct services provided through IHS and Tribally operated facilities generally are limited to members or descendants of members of federally recognized Tribes who live on or near federal reservations. Urban Indian health programs serve a wider group of AIAN people. AIAN people receiving services through IHS providers are not charged or billed for the cost of their services. Although IHS provides some health services, it is not health insurance coverage. IHS has historically been underfunded and unable to meet the health care needs of AIAN people. Given its limitations, health coverage is important for facilitating access to care for AIAN people and helping support providers serving AIAN people. However, some AIAN people prefer relying on IHS for care versus enrolling in health coverage because they believe that the federal government has the responsibility to provide and fund all needed care through the IHS. Others may be unaware of the availability of other coverage options or find the enrollment process confusing or challenging.
Box 2: Overview of the Indian Health Service
The IHS provides health care and disease prevention services to AIAN people through a network of hospitals, clinics, and health stations. In addition to medical care, the IHS provides a wide range of other services, including sanitation and public health functions. In exchange for lands and resources, the federal government provides health services through facilities that are managed directly by IHS, by Tribes or Tribal organizations under contract or compact with the IHS, and urban Indian health programs. As of 2021, there are a total of 687 IHS and Tribally owned or operated facilities located mostly on or near reservations. In addition, there are 41 urban Indian programs operating in 39 sites located in cities throughout the U.S.
If facilities are unable to provide needed care, the IHS and Tribes may contract for health services from private providers through the IHS Purchased/Referred Care (PRC) program. However, due to limited funding, services through PRC are often rationed based on medical need, such as emergency care for life-threatening illnesses and injuries. Urban Indian health organizations do not participate in the PRC program and do not receive PRC funding for health services beyond the scope of what they can provide.
Direct services provided through IHS and Tribally operated facilities generally are limited to members or descendants of members of federally recognized Tribes who live on or near federal reservations. AIAN people receiving services through IHS providers are not charged or billed for the cost of their services. Urban Indian health programs serve a wider group of AIAN people, including those who are not able to access IHS or Tribally operated facilities because they do not meet eligibility criteria or because they reside outside their service areas. However, funding to urban Indian health programs is limited to 1% of the IHS budget despite the overall demographic shift of AIAN people away from reservations. To address the needs of AIAN people who live in metropolitan areas, there have been recent recommendations to fully fund urban Indian health services.
The IHS is a discretionary program with limited funding that relies on Congressional appropriations each fiscal year. This funding process contributed to uncertainty, operations challenges, and, in some cases, disruptions in care if the Congress was delayed in passing appropriations. Beginning in FY 2023, Congress enacted advanced appropriations for the IHS, which is expected to provide greater stability in funding in the event of a government shutdown by allowing IHS to request funding for the upcoming fiscal year as well as the following year. However, funding will remain constrained to appropriated amounts.
Although the IHS discretionary budget has increased over time, funds are not equally distributed across IHS facilities and remain insufficient to meet health care needs. As such, access to IHS services varies significantly across locations, and AIAN people who rely solely on IHS often lack access to needed care. Moreover, access to services through the PRC is significantly limited with IHS data showing that over 250,000 services worth an estimated $1.1 billion were denied or deferred in FY 2020. The IHS also experiences medical staff shortages and continues to have challenges recruiting and retaining health professionals.
Given that appropriations have been insufficient to enable many IHS providers to meet the needs of the populations they serve, they often rely on revenues from third party payers, including Medicare, Medicaid, the Veterans Administration, and private insurance, to help reduce shortfalls between capacity and need. Medicaid is the largest third-party payer accounting for two-thirds (67%) of total third-party revenues as of 2021. In contrast to IHS funds, Medicaid funds are not subject to annual appropriation limits and, since Medicaid claims are processed throughout the year, facilities receive Medicaid funding on an ongoing basis for covered services. As such, Medicaid revenues help facilities cover operational costs, including provider payments and infrastructure developments.
Unlike other Medicaid costs which are shared by the federal government and states, the federal government covers 100% of costs for services provided to AIAN Medicaid enrollees through an IHS or Tribally operated facility, whether operated by the IHS or on its behalf by a Tribe. Urban Indian health programs do not currently receive this 100% federal Medicaid match. The American Rescue Plan authorized 100% match for urban Indian health programs for a temporary period that expired. There have been calls for and proposed legislation to permanently extend 100% funding to urban Indian health programs.
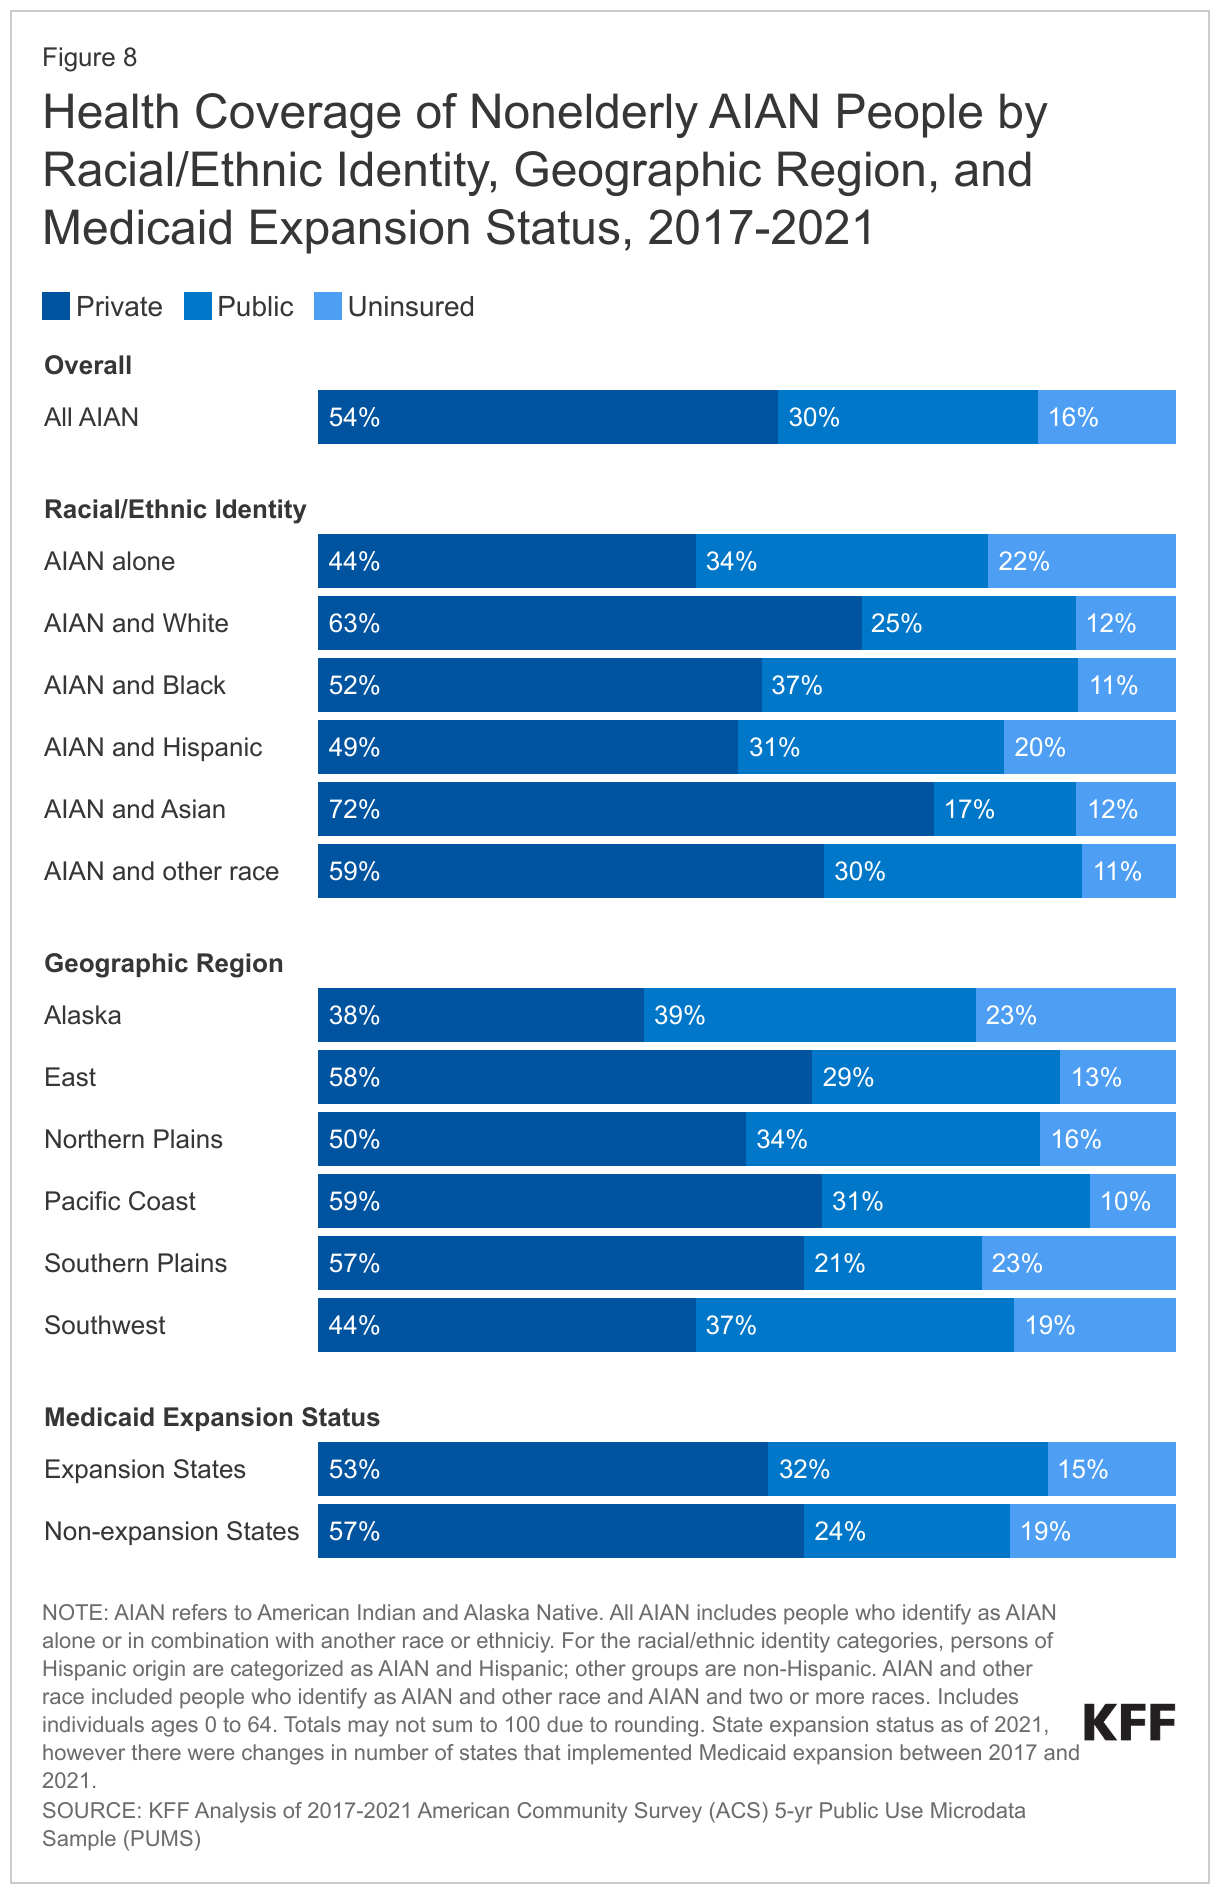
There are wide variations in uninsured rates among AIAN people by racial subgroup, IHS region, and Medicaid expansion status (Figure 8). Among nonelderly AIAN people, those who identify as AIAN alone (22%) and AIAN and Hispanic (20%) have higher uninsured rates than people who identify as AIAN and other racial groups. Among nonelderly people who identify as AIAN alone, uninsured rates are higher among people who indicate they are affiliated with a Tribe (23%) compared to people who do not indicate a Tribal affiliation (17%). This may, in part, reflect greater reliance on IHS for health care among those affiliated with a Tribe. However, IHS is not insurance and people relying solely on IHS may face gaps in care as noted above. Uninsured rates also vary by IHS region, ranging from 10% for those in the Pacific Coast region to 23% for those in the Alaska and Southern Plains region. The higher uninsured rate in Alaska largely reflects a lower rate of private coverage (37% vs. 54% of nonelderly AIAN overall), while the higher rate in the Southern Plains region largely reflects a relatively low rate of Medicaid coverage (21% vs. 30% for nonelderly AIAN overall) which is largely driven by the fact that two (Texas and Kansas) out of three states in the region have not implemented the ACA Medicaid expansion to low-income adults. Overall, uninsured rates among nonelderly AIAN people are higher in states that have not implemented the ACA Medicaid expansion than in expansion states, based on expansion status as of 20211 (Figure 8). In non-expansion states, eligibility for parents remains limited to very low income levels and other adults are not eligible.
Health Coverage Among NHOPI People
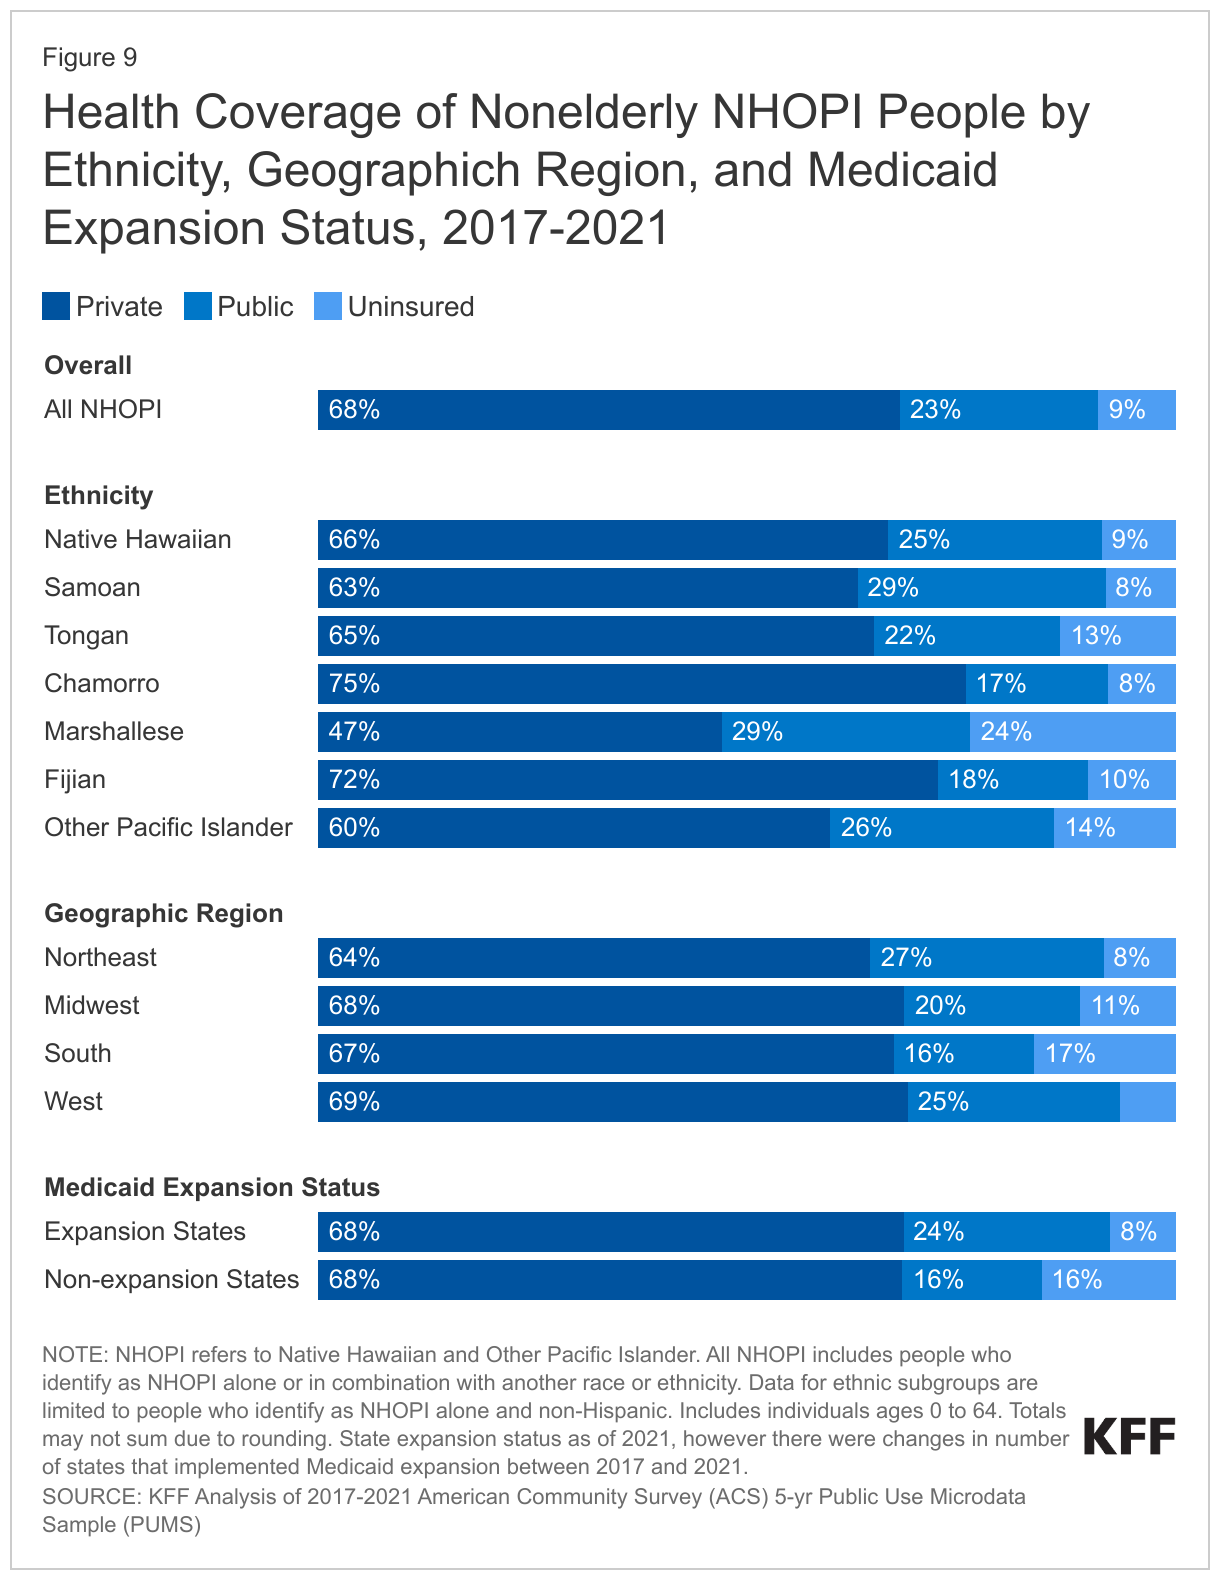
Uninsured rates among NHOPI people vary by where they live as well as by ethnicity. Uninsured rates are lowest among nonelderly NHOPI people living in the Western region of the country (7%) compared to the Northeast (8%), Midwest (11%), and South (17%) (Figure 9). This regional variation likely reflects differences in state Medicaid expansion decisions, with more non-expansion states in the South. Among NHOPI people, uninsured rates are two times higher among those who reside outside of Hawai’i (10%) compared to those who live in Hawai’i (5%). The lower uninsured rate in Hawai’i largely reflects a higher rate of private coverage as a result of the Hawai’i employer mandate. Overall, uninsured rates for nonelderly NHOPI people in states that had not expanded Medicaid as of 2021 are twice as high compared to rates in states that had expanded (16% vs. 8%). Uninsured rates also vary by ethnicity among nonelderly people who identify as NHOPI alone, ranging from 8% for Samoan people to 24% for Marshallese people. These differences are largely driven by differences in Medicaid coverage rates, which range from 17% among Chamorro people to 29% among Samoan and Marshallese people (Figure 9). These differences in Medicaid coverage largely reflect higher shares of noncitizen immigrants among some subgroups of NHOPI people since noncitizen immigrants face restrictions on eligibility for Medicaid and CHIP coverage. Across ethnic subgroups of people who identify as NHOPI alone, noncitizen immigrants are significantly more likely to be uninsured than their citizen counterparts (data not shown). Moreover, many of these same groups have higher rates of limited English proficiency which can also increase barriers to accessing health coverage.
Implications for Health Care for AIAN and NHOPI People
Higher uninsured rates among AIAN and NHOPI people contribute to barriers to accessing and utilizing care, which, in turn, can contribute to worse health outcomes. Health insurance coverage makes a difference in whether and when people receive medical care, where they get their care, and ultimately how healthy they are. Uninsured people are far more likely than those with insurance to postpone or forgo health care. Postponed or forgone care can lead to preventable conditions or chronic diseases going undetected and worsening. In addition, for many uninsured people, health care costs create financial distress and can lead to debt as well as difficult choices between health care costs and paying for other needs, like housing, food, and transportation. AIAN and NHOPI people are more likely to report lacking a usual source of care as well as foregoing care due to cost compared to White people. Moreover, the end of the Medicaid continuous enrollment provision may lead to higher uninsured rates and widening disparities for AIAN and NHOPI people, particularly those with limited English proficiency. As of November 14, 2023, an estimated 10.6 million people have been disenrolled.
Beyond coverage, AIAN and NHOPI people face other challenges that limit their ability to access health care and can negatively influence health. Reflecting ongoing structural inequities, AIAN and NHOPI people fare worse than their White counterparts on many social and economic measures that can affect the ability to access health care and negatively influence health, including having lower levels of income and educational attainment, being less likely to own a home, being more likely to live in crowded housing, and being less likely to own a vehicle. AIAN people also are less likely to have internet access. Given that some AIAN and NHOPI people live in rural and isolated areas that may require long travel distances to health care, transportation can be a key challenge to accessing health care. These challenges are exacerbated by the limited availability of providers and provider shortages in rural areas. In particular, analysis points to challenges filling provider positions in IHS facilities. Similarly, analysis of provider patterns in Hawai’i, which is home to a large share of NHOPI people, finds an overall physician shortage, as well as a shortage of NHOPI physicians and limited availability of these physicians in areas where NHOPI people live. AIAN and NHOPI people also face challenges accessing culturally and linguistically appropriate care. AIAN and NHOPI people have experienced a long history of abuse and mistreatment by the federal government, including forcible removal from their native lands and efforts to eliminate their languages and cultural practices. Differing cultural beliefs and values about health and limited cultural understanding among providers can present barriers to accessing health care.
These barriers to accessing care and other underlying drivers of health and health care inequities contribute to poor health outcomes for AIAN and NHOPI people. Across many measures of health, AIAN people fare worse than their White counterparts, including self-reported health status, infant and pregnancy-related mortality, and deaths due to suicide and drug overdoses. AIAN people have the shortest life expectancy across racial and ethnic groups and experienced a recent sharp decline in life expectancy, likely as a result of COVID-19. Data on health outcomes for NHOPI people remain more limited, although they also fare worse compared to their White counterparts for many of the measures for which data are available, including high rates of infant mortality.
Continued efforts to increase data available to understand AIAN and NHOPI peoples’ health and health care experiences and to engage with community members will be important for addressing disparities. Prioritizing data collection and reporting to identify and address disparities is an important component of advancing health equity. There are efforts underway to expand and improve availability of disaggregated data, including a charge from the Biden Administration to address the systemic lack of disaggregated data. These federal-level efforts to disaggregate data may help identify health disparities among smaller racial and ethnic groups and subgroups of larger racial and ethnic groups. They also may inform more culturally attuned and community-informed responses to addressing disparities, including initiatives focused on cultural connection and language preservation. Practices that exclude data for small racial and ethnic groups can leave these groups invisible, masking the disparities they may face and potentially impacting the allocation of resources to address their needs. Engaging with AIAN and NHOPI communities to gather input about their priorities and needs and addressing issues such as data sovereignty and community led research also will be important for addressing disparities, as well as working with providers, officials, and institutions to earn trust with individuals and communities by directly addressing concerns and recognizing historic and ongoing racism and discrimination within the health care system.
KFF would like to thank Dr. Donald Warne and Mr. Brett Lee Shelton with the Johns Hopkins Center for Indigenous Health for helpful review and comments.
Appendix
- For this analysis, state Medicaid expansion status is determined as of 2021, however there were changes in the number of states that implemented Medicaid expansion between 2017 and 2021. Therefore, coverage estimates by Medicaid expansion status may be under or overestimated given the changes in state expansion status during this period. ↩︎