2017 Employer Health Benefits Survey
Abstract
This annual survey of employers provides a detailed look at trends in employer-sponsored health coverage including premiums, employee contributions, cost-sharing provisions, and employer practices. The 2017 survey included more than 2,100 interviews with non-federal public and private firms. Annual premiums for employer-sponsored family health coverage reached $18,764 this year, up 3% from last year, with workers on average paying $5,714 towards the cost of their coverage, according to the Kaiser Family Foundation/Health Research & Education Trust 2017 Employer Health Benefits Survey. The 2017 survey includes information on the use of incentives for employer wellness programs, plan cost sharing, and firm offer rates. Survey results are released in a variety of ways, including a full report with downloadable tables on a variety of topics, summary of findings, and an article published in the journal Health Affairs.
News release
- A news release announcing the publication of the 2017 Employer Health Benefits Survey is available here.
Summary of Findings
- The Summary of Findings provides an overview of the 2017 survey results and is available under the Summary of Findings.
Full report
- The complete Employer Health Benefits Survey Report includes over 200 exhibits and is available under the Report The “Report” section contains 14 separate sections. Users can view each section separately or download the section exhibits from the right side of the respective section page.
Health affairs
- The peer-reviewed journal Health Affairs has published an article with key findings from the 2017 survey: Health Benefits In 2017: Stable Coverage, Workers Faced Considerable Variation in Costs.
Web briefing
- On Tuesday, September 19, 2017, the Kaiser Family Foundation and the Health Research & Educational Trust (HRET) held a reporters-only web briefing to release the 2017 Employer Health Benefits Survey.
Interactive graphic
- This graphing tool allows users to look at changes in premiums and worker contributions for covered workers at different types of firms over time: Premiums and Worker Contributions Among Workers Covered by Employer-Sponsored Coverage, 1999-2017.
Key exhibits-chartpack
- Over twenty overview slides from the 2017 Employer Health Benefits Survey are available as a slideshow or PDF.
Additional resources
- Standard errors for selected estimates are available in the Technical Supplement here.
- Employer Health Benefits Surveys from 1998-2016 are available here. Please note that historic survey reports have not been revised with methodological changes.
- Researchers may request a public use dataset by going to Contact Us and choosing “TOPIC: Health Costs.”
Researchers at the Kaiser Family Foundation, NORC at the University of Chicago, and Health Research & Educational Trust designed and analyzed the survey.
Summary Of Findings
Employer-sponsored insurance covers over half of the non-elderly population; approximately 151 million nonelderly people in total.1 To provide current information about employer-sponsored health benefits, the Kaiser Family Foundation (Kaiser) and the Health Research & Educational Trust (HRET) conduct an annual survey of private and nonfederal public employers with three or more workers. This is the nineteenth Kaiser/HRET survey and reflects employer-sponsored health benefits in 2017.
HEALTH INSURANCE PREMIUMS AND WORKER CONTRIBUTIONS
In 2017, the average annual premiums for employer-sponsored health insurance are $6,690 for single coverage and $18,764 for family coverage [Figure A]. The average single premium increased 4% and the average family premium increased 3% in 2017. Workers’ wages increased 2.3% and inflation increased 2.2% over the last year.2 The average premium for family coverage is lower for covered workers in small firms (3-199 workers) than for workers in large firms (200 or more workers) ($17,615 vs. $19,235).
Premiums for family coverage have increased 19% since 2012 and 55% since 2007 [Figure B]. Average premiums for high-deductible health plans with a savings option (HDHP/SOs) are considerably lower than the overall average for all plan types for both single and family coverage, at $6,024 and $17,581, respectively [Figure A]. These premiums do not include any firm contributions to workers’ health savings accounts or health reimbursement arrangements.
Premiums vary significantly around the averages for both single and family coverage, reflecting differences in health care costs and compensation decisions across regions and industries. Seventeen percent of covered workers are in plans with an annual total premium for family coverage of at least $22,517 (120% or more of the average family premium), and 21% of covered workers are in plans where the family premium is less than $15,011 (less than 80% of the average family premium).
Most covered workers make a contribution toward the cost of the premium for their coverage. On average, covered workers contribute 18% of the premium for single coverage and 31% of the premium for family coverage. Workers in small firms contribute a higher average percentage of the premium for family coverage than workers in large firms (39% vs. 28%).
Covered workers in firms with a relatively high percentage of lower-wage workers (at least 35% of workers earn $24,000 a year or less) contribute higher percentages of the premium for single (23%) and family (37%) coverage than workers in firms with a smaller share of lower-wage workers (18% and 31%, respectively).3
As with total premiums, the share of the premium contributed by workers varies considerably. For single coverage, 14% of covered workers are in plans that do not require them to make a contribution, 60% are in plans that require a contribution of 25% or less of the total premium, and 2% are in plans that require a contribution of more than half of the premium. For family coverage, 3% of covered workers are in plans that do not require them to make a contribution, 44% are in a plan that requires a contribution of 25% or less of the total premium, and 16% are in plans that require more than half of the premium. Covered workers in small firms are more likely than covered workers in large firms to be in a plan that requires the worker to contribute more than 50% of the total family premium (36% vs. 8%).
With regard to dollar amounts, the average annual premium contributions by covered workers for 2017 are $1,213 for single coverage and $5,714 for family coverage. Eight percent of covered workers contribute $12,000 or more a year for family coverage c[Figure C]. Average contribution amounts for covered workers in HDHP/SOs are lower for single and family coverage than for covered workers in other plan types [Figure A]. Covered workers’ average dollar contribution to family coverage has increased 74% since 2007 and 32% since 2012 Figure B]. Covered workers in small firms have lower average contributions for single coverage than workers in large firms ($1,030 vs. $1,289), but higher average contributions for family coverage ($6,814 vs. $5,264).
One reason for this variation in dollar amounts is the different approaches that employers use to structure employee contributions, particularly for family coverage. Of firms that offer family coverage, 45% of small firms and 15% of large firms provide the same dollar contribution for single and family coverage, which means that workers must pay the full additional premium cost to enroll family members in their plan. Forty-five percent of small firms and 75% of large firms make a higher dollar contribution for family coverage than for single coverage; 1% of small firms and 4% of large firms vary their approach with the class of the employee; and the remaining 9% of small firms and 6% of large firms take some other approach. Sixteen percent of covered workers are in a plan that requires workers who use tobacco to contribute more toward the premium.
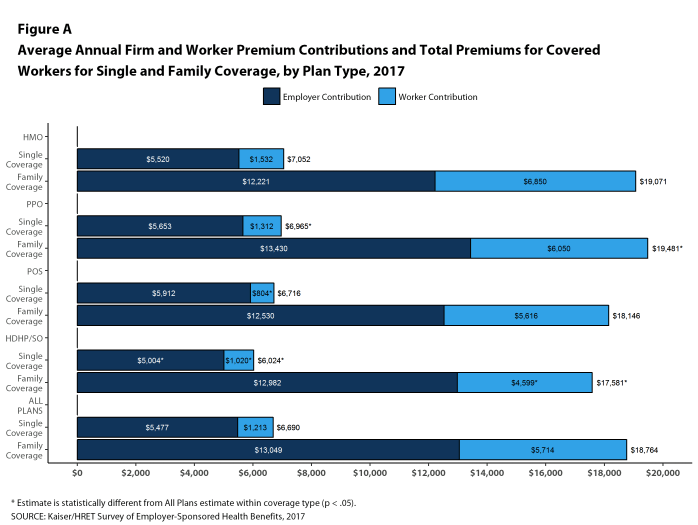
Figure A: Average Annual Firm and Worker Premium Contributions and Total Premiums for Covered Workers for Single and Family Coverage, by Plan Type, 2017
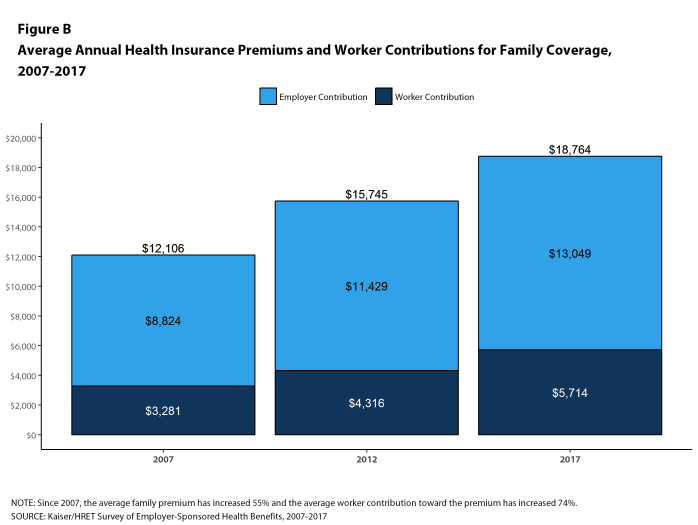
Figure B: Average Annual Health Insurance Premiums and Worker Contributions for Family Coverage, 2007-2017
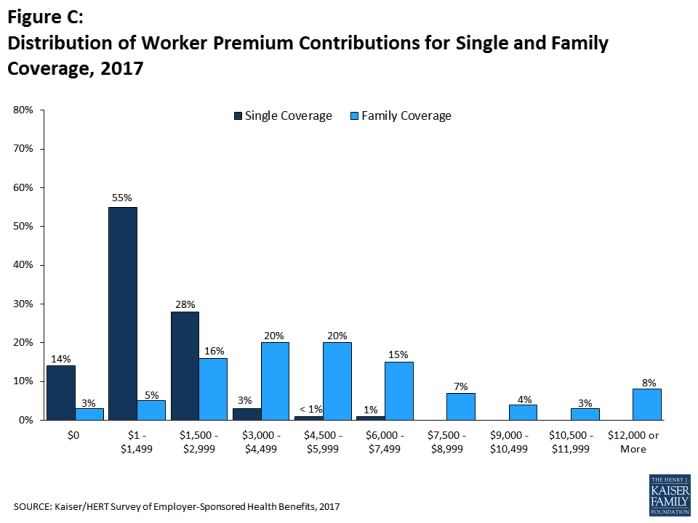
Figure C: Distribution of Worker Premium Contributions for Single and Family Coverage, 2017
PLAN ENROLLMENT
PPOs continue to be the most common plan type in 2017, enrolling 48% of covered workers. Twenty-eight percent of covered workers are enrolled in a high-deductible plan with a savings option (HDHP/SO), 14% in an HMO, 10% in a POS plan, and <1% in a conventional (also known as an indemnity) plan [Figure D]. Over the last five years, enrollment in PPOs has fallen by 8 percentage points while enrollment in HDHP/SOs has increased by 9 percentage points. Six percent of firms offering an HDHP/SO offer only an HDHP/SO to at least some of their workers.

Figure D: Distribution of Health Plan Enrollment for Covered Workers, by Plan Type and Firm Size, 2017
Self-Funding. Fifteen percent of covered workers in small firms and 79% in large firms are enrolled in plans that are either partially or completely self-funded, similar to last year. Although there has been discussion of more insurers offering partially self-funded plans (sometimes called level-premium plans) to smaller employers, we have not seen an increase in respondents reporting that they have self-funded plans in recent years.
Association Health Plans. Six percent of offering firms with fewer than 250 workers offer health benefits arranged through a trade or professional association.
EMPLOYEE COST SHARING
Most covered workers must pay a share of the cost when they use health care services. Eighty-one percent of covered workers have a general annual deductible for single coverage that must be met before most services are paid for by the plan [Figure E]. Even workers without a general annual deductible often face other types of cost sharing when they use services, such as copayments or coinsurance for office visits and hospitalizations.
Among covered workers with a general annual deductible, the average deductible amount for single coverage is $1,505, similar to the average deductible last year ($1,478). The average deductible for covered workers is higher in small firms than in large firms ($2,120 vs. $1,276). Among all covered workers, including both those with and without a deductible, the average deductible is $1,221. Fifty-eight percent of covered workers in small firms and 48% of covered workers in large firms are in a plan with a deductible of at least $1,000 for single coverage, similar to the percentages last year. Over the last five years, however, the percentage of covered workers with a general annual deductible of $1,000 or more for single coverage has grown substantially, increasing from 34% in 2012 to 51% in 2017 [Figure E]. Thirty-seven percent of covered workers in small firms are in a plan with a deductible of at least $2,000, compared to 15% for covered workers in large firms.
Deductibles have increased in recent years due to higher deductible amounts within plan types and to higher enrollment in HDHP/SOs. While growing deductibles in PPOs and other plan types generally increase enrollee out-of-pocket liability, the shift in enrollment to HDHP/SOs does not necessarily do so because most HDHP/SO enrollees receive an account contribution from their employers. Twenty-one percent of covered workers in an HDHP with a Health Reimbursement Arrangement (HRA) and 2% of covered workers in a Health Savings Account (HSA)-qualified HDHP receive an account contribution for single coverage at least equal to their deductible, while another 35% of covered workers in an HDHP with an HRA and 30% of covered workers in an HSA-qualified HDHP receive account contributions that, if applied to their deductible, would reduce their cost sharing to less than $1,000.
Whether they face a general annual deductible or not, a large share of covered workers also pay a portion of the cost when they visit an in-network physician. For primary care, 71% of covered workers have a copayment (a fixed dollar amount) when they visit a doctor and 22% have coinsurance (a percentage of the covered amount). For specialty care, 67% face a copayment and 26% face coinsurance. The average copayments are $25 for primary care and $38 for specialty care. The average coinsurance is 19% for primary and 19% for specialty care. These amounts are similar to those in 2016.
Most workers also face additional cost sharing for an emergency room visit, hospital admission, or outpatient surgery. After any general annual deductible is met, 32% of covered workers have a coinsurance and 58% have a copayment for an emergency room visit, and 64% of covered workers have a coinsurance and 12% have a copayment for hospital admissions. The average coinsurance rate for hospital admissions is 19% and the average copayment is $336 per hospital admission. The cost sharing provisions for outpatient surgery follow a similar pattern to those for hospital admissions.
While almost all (98%) covered workers are in plans with a limit on in-network cost sharing (called an out-of-pocket maximum) for single coverage, there is considerable variation in the actual dollar limits [Figure F]. Fifty-seven percent of these workers are in a plan with an annual out-of-pocket maximum for single coverage of more than $3,000, while 18% are in a plan with an out-of-pocket maximum of $6,000 or more.
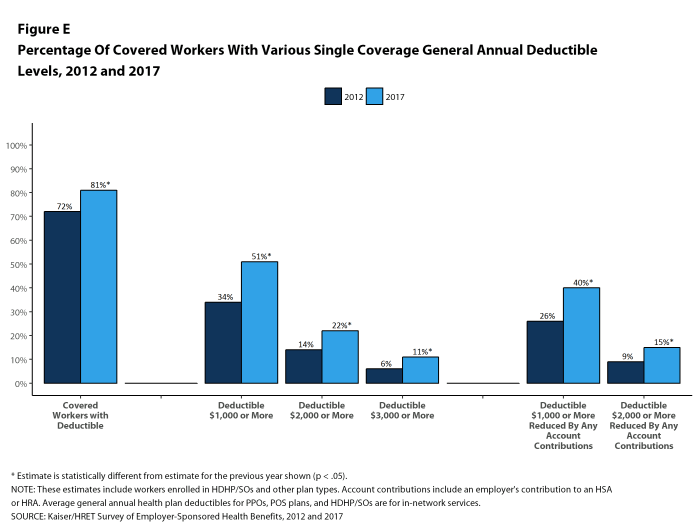
Figure E: Percentage of Covered Workers With Various Single Coverage General Annual Deductible Levels, 2012 and 2017
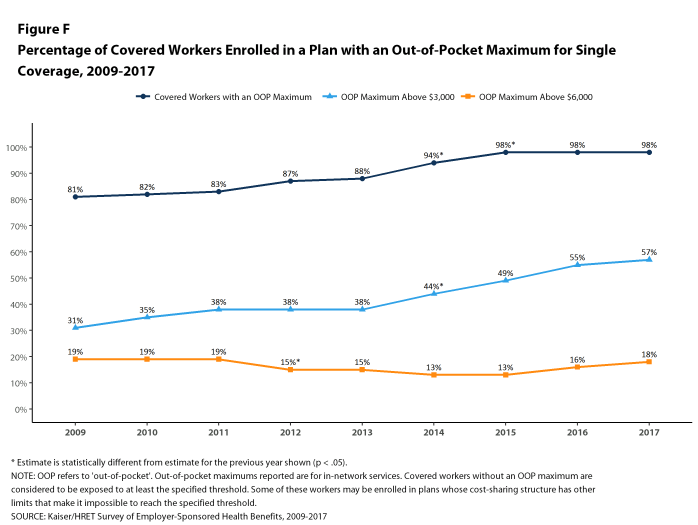
Figure F: Percentage of Covered Workers Enrolled In a Plan With an Out-Of-Pocket Maximum for Single Coverage, 2009-2017
AVAILABILITY OF EMPLOYER-SPONSORED COVERAGE
Fifty-three percent of firms offer health benefits to at least some of their workers, similar to the percentage last year [Figure G]. Eighty-nine percent of workers are in a firm that offers health benefits to at least some of its workers. Over the past decade, the percentage of workers at small firms that offer health benefits to at least some workers has decreased (78% vs 73%).
The likelihood of offering health benefits differs significantly by firm size, with only 40% of firms with 3 to 9 workers offering coverage while virtually all firms with 1,000 or more workers offer coverage.
Even in firms that offer health benefits, some workers are not eligible to enroll (e.g., waiting periods or part-time or temporary work status) and others who are eligible choose not to enroll (e.g., they feel the coverage is too expensive or they are covered through another source). In firms that offer coverage, 79% of workers are eligible for the health benefits offered, and of those eligible, 78% take up the firm’s offer, resulting in 62% of workers in offering firms enrolling in coverage through their employer. All of these percentages are similar to 2016.
Looking across workers both in firms that offer and those that do not offer health benefits, 55% of workers are covered by health plans offered by their employer.
Coverage for Family Members. Among firms offering health benefits, virtually all large firms and 94% of small firms offer coverage to spouses of eligible workers. Similarly, virtually all large firms and 92% of small firms offering health benefits offer coverage to other dependents of their eligible workers, such as children.
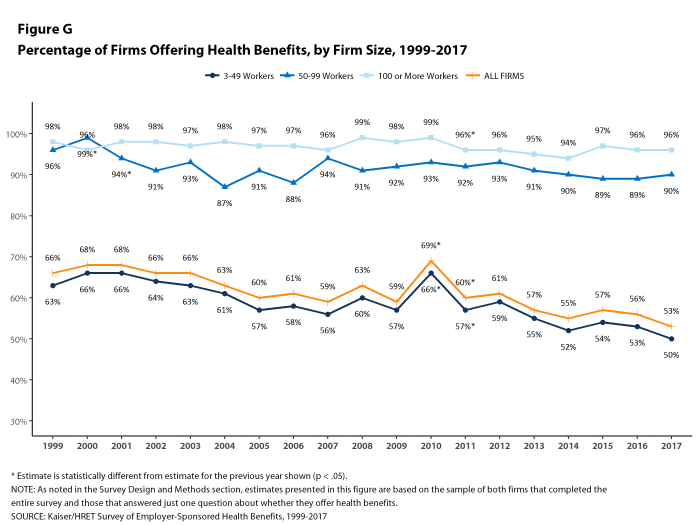
Figure G: Percentage of Firms Offering Health Benefits, by Firm Size, 1999-2017
RETIREE COVERAGE
Of the large firms offering health benefits to workers in 2017, 25% also offer health benefits to retirees, similar to the percentage in 2016 (24%). Among large firms that offer retiree health benefits, 95% offer health benefits to early retirees (workers retiring before age 65) and 66% offer health benefits to Medicare-age retirees. Twenty-six percent of large firms offering retiree benefits contribute to benefits through a contract with a Medicare Advantage plan. Twelve percent of large firms offering retiree benefits offer retiree benefits through a corporate or private exchange.
SUPPLEMENTAL AND VOLUNTARY BENEFITS
Firms offering health benefits also offer a variety of supplemental and other health benefits to their workers. Among firms offering health benefits, 67% of small firms and 97% of large firms offer dental benefits to their workers; 47% of small firms and 82% of large firms offer vision benefits; 23% of small firms and 46% of large firms offer critical illness insurance; 16% of small firms and 28% of large firms offer hospital indemnity insurance; and 16% of small firms and 25% of large firms offer long-term care insurance. Among all firms offering these supplemental benefits, firms are more likely to make a contribution toward dental coverage (67%) or vision coverage (54%) than for critical illness insurance (3%) or hospital indemnity insurance (5%).
WELLNESS, HEALTH RISK ASSESSMENTS AND BIOMETRIC SCREENINGS
A large share of firms have programs that encourage workers to identify health issues and to take steps to improve their health. Many firms offer health screening programs including health risk assessments, which are questionnaires asking workers about lifestyle, stress or physical health, and in-person examinations such as biometric screenings. Many firms also use incentives to encourage workers to complete assessments, participate in wellness programs, or meet biometric outcomes. As we have seen in previous years, there is considerable uncertainty among small firms on some questions, particularly those related to incentives, so findings are reported only for large firms in some instances.
Health Risk Assessments. Among firms offering health benefits, 38% of small firms and 62% of large firms provide workers an opportunity to complete a health risk assessment. A health risk assessment includes questions about a person’s medical history, health status, and lifestyle. Fifty-two percent of large firms with a health risk assessment program offer an incentive to encourage workers to complete the assessment. Among large firms with an incentive, the incentives include: gift cards, merchandise or similar incentives (50% of firms); requiring a completed health risk assessment to be eligible for other wellness incentives (46% of firms); lower premium contributions or cost sharing (46% of firms); and financial rewards such as cash, contributions to health-related savings accounts, or avoiding a payroll fee (40% of firms).
Biometric Screenings. Twenty-one percent of small firms and 52% of large firms offering health benefits offer workers the opportunity to complete a biometric screening. A biometric screening is a health examination that measures a person’s risk factors such as body weight, cholesterol, blood pressure, stress, and nutrition. Fifty-three percent of large firms with biometric screening programs offer workers an incentive to complete the screening. Among large firms with an incentive, the incentives include: lower premium contributions or cost sharing (49% of firms); gift cards, merchandise or similar incentives (44% of firms); requiring a completed biometric screening to be eligible for other wellness incentives (41% of firms); and financial rewards such as cash, contributions to health-related savings accounts, or avoiding a payroll fee (33% of firms). In addition, 14% of large firms with a biometric screening program have incentives tied to whether workers met specified biometric outcomes, such as a targeted body mass index (BMI) or cholesterol level.
Health and Wellness Promotion Programs. Many firms offer programs to help workers identify health risks and unhealthy behaviors and improve their lifestyles. Fifty-eight percent of small firms and 85% of large firms offer a program in at least one of these areas: smoking cessation; weight management; behavioral or lifestyle coaching. Thirty-two percent of large firms with one of these health and wellness programs offer workers an incentive to participate in or complete the program. Among large firms with an incentive for completing wellness programs, incentives include: gift cards, merchandise or similar incentives (68% of firms); requiring completion of activities to be eligible for other wellness incentives (44% of firms); financial rewards such as cash, contributions to health-related savings accounts, or avoiding a payroll fee (37% of firms); and lower premium contributions or cost sharing (19% of firms).
Eight percent of small firms and 14% of large firms report collecting health information from workers through wearable devices such as a Fitbit or Apple Watch.
As risk assessments and wellness programs have become more complex, incentives and rewards have become more sophisticated and may involve participating in or meeting goals in different programs (e.g., completing an assessment and participating in a health promotion activity). To better understand the combined incentives or penalties facing program participants, we asked large firms that had any incentives for health risk assessments, biometric screenings, or the specified health and wellness promotion programs what the maximum incentive was for a worker for all of their programs combined. Among large firms with any type of incentive, 25% have a maximum incentive of 150 or less; 33% have a maximum incentive between $151 and $500; 23% have a maximum incentive between $501 and $1,000; 13% have a maximum incentive between $1,001 and $2,000; and 6% have a maximum incentive of more than $2,000 [Figure H].
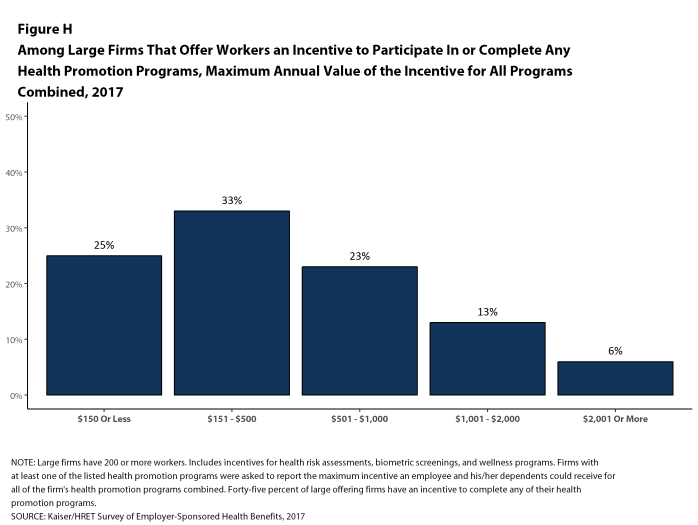
Figure H: Among Large Firms That Offer Workers an Incentive to Participate In or Complete Any Health Promotion Programs, Maximum Annual Value of the Incentive for All Programs Combined, 2017
SITES OF CARE
Telemedicine. Sixty-three percent of large firms that offer health benefits cover the provision of health care services through telecommunication in their largest health plan [Figure I]. Among these firms, 33% reported that workers have a financial incentive to receive services through telemedicine instead of visiting a physician’s office.
Retail Health Clinics. Seventy-three percent of large firms cover services offering health benefits provided in retail health clinics, such as those found in pharmacies and supermarkets, in their largest health plan [Figure I]. Among these firms, 17% reported that workers have a financial incentive to receive services in a retail clinic instead of visiting a traditional physician’s office.
Nurse Hotline. Seventy-nine percent of large firms offering health benefits have a nurse hotline as part of their largest health plan [Figure I].
PROVIDER NETWORKS
High Performance or Tiered Networks. Fifteen percent of large firms offering health benefits have high performance or tiered networks in their largest health plan, similar to the percentage reported last year [Figure I]. These programs identify providers that are more efficient and generally provide financial or other incentives for enrollees to use the selected providers.
Narrow Networks. Nine percent of large firms offering health benefits offer a health plan that they consider to have a narrow network (i.e., a network they would consider more restrictive than a standard HMO network), similar to the percentage reported last year [Figure I].
Eliminated Hospitals or Health Systems. Only 3% of large firms report that they or their health plan eliminated a hospital or health system in the past year in order to reduce the costs of their plan, similar to the percentage reported last year [Figure I].
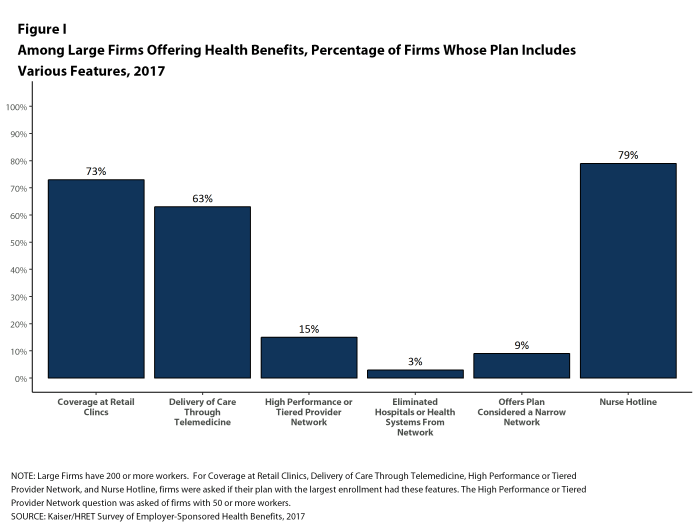
Figure I: Among Large Firms Offering Health Benefits, Percentage of Firms Whose Plan Includes Various Features, 2017
Private Exchanges. Four percent of firms offering health benefits with at least 50 workers offer health benefits through a private exchange. Among firms offering health benefits that do not currently offer through a private exchange, 10% with at least 50 workers, including 22% with at least 5,000 workers, say they have considered offering coverage through a private exchange.
CONCLUSION
The market for employer-sponsored health benefits continues along with no big changes in 2017. Premium increases are modest and there is no appreciable change in cost sharing or enrollment by type of plan. Employers continue to invest in health promotion and wellness approaches, including building incentives around programs that collect information about employee health and lifestyles.
Despite continuing economic improvement, with lower rates of unemployment, and the ACA employer mandate, there are no signs that the long-term declines in the offer and coverage rates are reversing. Even with modest premium growth, offer rates for small firms remain much lower than those for large firms, and the percentage of workers covered at work remains at 62%.
We continue to see significant variation around the average premiums and contribution amounts, particularly for small businesses. A meaningful share of covered workers in small firms must pay a substantial share of the cost of family coverage, raising the question of whether this is a viable source of coverage for the dependents of these workers.
The debate about the future of the ACA has focused on the provisions that extended coverage in the non-group market and Medicaid, with the provisions affecting employer-sponsored coverage receiving relatively little attention. Employers generally appear to have adapted to ACA provisions without significant disruption, including the employer requirement to offer coverage or pay a penalty, the provisions requiring preventive care be covered without cost sharing, and that non-grandfathered plans have an out-of-pocket limit on cost sharing. Even if repeal and replace efforts ultimately succeed, the impacts on the group market will likely be relatively small: for example, some employers may reduce offers of coverage to some of their lower-paid employees or may reduce the number of preventive services available without cost sharing; but the larger metrics measuring costs and coverage are unlikely to change in any significant way.
One policy that could affect the market over the next couple of years is the high-cost plan tax, also known as the Cadillac tax. In previous surveys, employers reported increasing cost sharing and making other changes in anticipation of the high-cost plan tax taking effect in 2018. With the effective date of the tax delayed until 2020 (and with the apparent widespread Congressional support for further delay), the pressure for employers with more expensive plans to take actions to reduce their cost seems to have abated. This could change abruptly, however, if the tax is not further delayed in the near future.
METHODOLOGY
The Kaiser Family Foundation/Health Research & Educational Trust 2017 Annual Employer Health Benefits Survey (Kaiser/HRET) reports findings from a telephone survey of 2,137 randomly selected non-federal public and private employers with three or more workers. Researchers at the Health Research & Educational Trust, NORC at the University of Chicago, and the Kaiser Family Foundation designed and analyzed the survey. National Research, LLC conducted the fieldwork between January and June 2017. In 2017, the overall response rate is 33%, which includes firms that offer and do not offer health benefits. Among firms that offer health benefits, the survey’s response rate is also 33%. To improve estimates for small firms, the 2017 survey had a significantly larger sample than previous years; the increased sample size lead to both more firms completing the survey and a lower response rate than in years past. Unless otherwise noted, differences referred to in the text and figures use the 0.05 confidence level as the threshold for significance.
For more information on the survey methodology, please visit the Methodology section at http://ehbs.kff.org/.
The Kaiser Family Foundation, a leader in health policy analysis, health journalism and communication, is dedicated to filling the need for trusted, independent information on the major health issues facing our nation and its people. The Foundation is a non-profit private operating foundation based in Menlo Park, California.
The Health Research & Educational Trust (HRET) Founded in 1944, the Health Research & Educational Trust (HRET) is the not-for-profit research and education affiliate of the American Hospital Association (AHA). HRET’s mission is to transform health care through research and education. HRET’s applied research seeks to create new knowledge, tools and assistance in improving the delivery of health care by providers and practitioners within the communities they serve.
- Kaiser Commission on Medicaid and the Uninsured. The uninsured: A primer — Key facts about health insurance and the uninsured in the era of health reform: Supplemental Tables [Internet]. Washington (DC): The Commission; 2016 Nov [cited 2017 Aug 1]. https://files.kff.org/attachment/Supplemental-Tables-The-Uninsured-A%20Primer-Key-Facts-about-Health-Insurance-and-the-Unisured-in-America-in-the-Era-of-Health-Reform. See Table 1: 271.3 million nonelderly people, 55.8% of whom are covered by employer-sponsored insurance.↩
- Kaiser/HRET surveys use the April-to-April time period, as do the sources in this and the following note. The inflation numbers are not seasonally adjusted. Bureau of Labor Statistics. Consumer Price Index – All Urban Consumers: Department of Labor; 2017. [cited 2017 July 21] https://data.bls.gov/timeseries/CUUR0000SA0?output_view=pct_1mth. Wage data are from the Bureau of Labor Statistics and based on the change in total average hourly earnings of production and nonsupervisory employees. Employment, hours, and earnings from the Current Employment Statistics survey: Department of Labor; 2017 [cited 2017 July 21]. http://data.bls.gov/timeseries/CES0500000008↩
- This threshold is based on the twenty-fifth percentile of workers’ earnings as reported by the Bureau of Labor Statistics, using data for 2016. Bureau of Labor Statistics. May 2016 national occupational employment and wage estimates: United States [Internet]. Washington (DC): BLS; [last modified 2017 Mar 310; cited 2017 Aug 15]. Available from: http://www.bls.gov/oes/current/oes_nat.htm↩
Survey Design And Methods
The Kaiser Family Foundation and the Health Research & Educational Trust (Kaiser/HRET) conduct this annual survey of employer-sponsored health benefits. HRET, a nonprofit research organization, is an affiliate of the American Hospital Association. The Kaiser Family Foundation designs, analyzes, and conducts this survey in partnership with HRET, and also funds the study. Kaiser contracts with researchers at NORC at the University of Chicago (NORC) to work with the Kaiser and HRET researchers in conducting the study. Kaiser/HRET retained National Research, LLC (NR), a Washington, D.C.-based survey research firm, to conduct telephone interviews with human resource and benefits managers using the Kaiser/HRET survey instrument. From January to June 2017, NR completed full interviews with 2,137 firms.
SURVEY TOPICS
The survey includes questions on the cost of health insurance, health benefit offer rates, coverage, eligibility, enrollment patterns, premium contributions,4 employee cost sharing, prescription drug benefits, retiree health benefits, and wellness benefits.
Kaiser/HRET asks each participating firm as many as 400 questions about its largest health maintenance organization (HMO), preferred provider organization (PPO), point-of-service (POS) plan, and high-deductible health plan with a savings option (HDHP/SO).5 We treat exclusive provider organizations (EPOs) and HMOs as one plan type and report the information under the banner of “HMO”; if an employer sponsors both an HMO and an EPO, they are asked about the attributes of the plan with the larger enrollment. Similarly, starting in 2013, plan information for conventional (or indemnity) plans was collected within the PPO battery. Less than one percent of firms that completed the PPO section had more enrollment in a conventional plan than in a PPO plan. Firms with 50 or more workers were asked: “Does your firm offer health benefits for current employees through a private or corporate exchange?” Employers were still asked for plan information about their HMO, PPO, POS and HDHP/SO plan regardless of whether they purchased health benefits through a private exchange or not.
Firms are asked about the attributes of their current plans during the interview. While the survey’s fielding period begins in January, many respondents may have a plan whose 2017 plan year has not yet begun [Figure M.1]. In some cases, plans may report the attributes of their 2016 plans and some plan attributes (such as HSA deductible limits) may not meet the calendar year regulatory requirements.
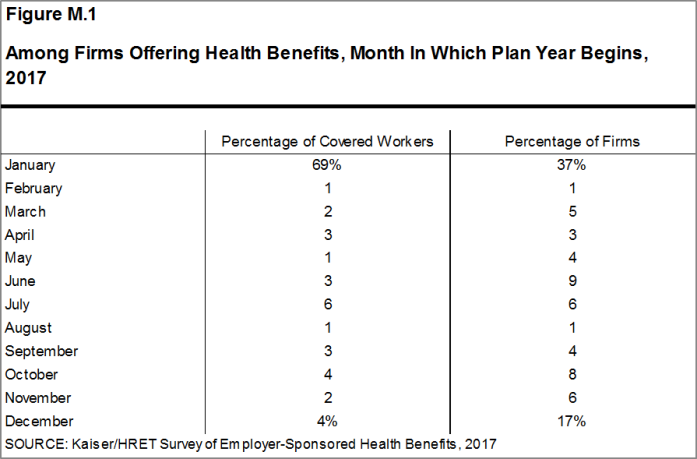
Figure M.1: Among Firms Offering Health Benefits, Month In Which Plan Year Begins, 2017
RESPONSE RATE
After determining the required sample from U.S. Census Bureau data, Kaiser/HRET drew its sample from a Survey Sampling Incorporated list (based on an original Dun and Bradstreet list) of the nation’s private employers and from the Census Bureau’s Census of Governments list of public employers with three or more workers. To increase precision, Kaiser/HRET stratified the sample by ten industry categories and six size categories. Kaiser/HRET attempted to repeat interviews with prior years’ survey respondents (with at least ten employees) who participated in either the 2015 or the 2016 survey, or both. Firms with 3-9 employees are not included in the panel to minimize the impact of panel effects on the offer rate statistic. As a result, 1,427 of the 2,137 firms that completed the full survey also participated in either the 2015 or 2016 surveys, or both.6 The overall response rate is 33%.7 Response rates are calculated using a CASRO method, which accounts for firms that are determined to be ineligible in its calculation. Beginning in 2012, the calculation of the response rates was adjusted to be slightly more conservative than previous years.
While the Kaiser/HRET survey similar to other employer and household surveys has seen a general decrease in response rates over time, the decrease between the 2016 and 2017 response rates is not solely explained by this trend. In order to improve statistical power among sub-groups, including small firms and those with a high share of low income workers, the size of the sample was expanded from 5,732 in 2016 to 7,895 in 2017. As a result, the 2017 survey includes 204 more completes than the 2016 survey. While this generally increases the precision of estimates (for example, a reduction in the standard error for the offer rate from 2.2% to 1.8%), it has the effect of reducing the response rate. In 2017, non-panel firms had a response rate of 17%, compared to 62% for firms that had participated in one of the last two years.
To increase response rates, firms with 3-9 employees were offered an incentive for participating in the survey. A third of these firms were sent a $5 Starbucks gift card in the advance letter, a third were offered an incentive of $50 in cash or as a donation to a charity of their choice after completing the full survey, and a third of firms were offered no incentive at all. Our analysis does not show significant differences in responses to key variables among these incentive groups.
The vast majority of questions are asked only of firms that offer health benefits. A total of 1,832 of the 2,137 responding firms indicated they offered health benefits. The response rate for firms that offer health benefits is also 33%.
We asked one question of all firms in the study with which we made phone contact but where the firm declined to participate. The question was “Does your company offer a health insurance program as a benefit to any of your employees?”. A total of 3,938 firms responded to this question (including 2,137 who responded to the full survey and 1,801 who responded to this one question). These responses are included in our estimates of the percentage of firms offering health benefits.8 The response rate for this question is 61%.
Beginning in 2014, we collected whether firms with a non-final disposition code (such as a firm that requested a callback at a later time or date) offered health benefits. By doing so we attempt to mitigate any potential non-response bias of firms either offering or not offering health benefits on the overall offer rate statistic. In 2017, 640 of the 1,801 firm responses that solely answered the offer question were obtained through this pathway.
FIRM SIZE CATEGORIES AND KEY DEFINITIONS
Throughout the report, figures categorize data by size of firm, region, and industry. Unless otherwise specified, firm size definitions are as follows: small firms: 3 to 199 workers; and large firms: 200 or more workers. Figure M.2 shows selected characteristics of the survey sample. A firm’s primary industry classification is determined from Survey Sampling International’s (SSI) designation on the sampling frame and is based on the U.S. Census Bureau’s North American Industry Classification System (NAICS). A firm’s ownership category and other firm characteristics used in figures such as 3.3 and 6.22 are based on respondents’ answers. While there is considerable overlap in firms in the “State/Local Government” industry category and those in the “public” ownership category, they are not identical. For example, public school districts are included in the service industry even though they are publicly owned.
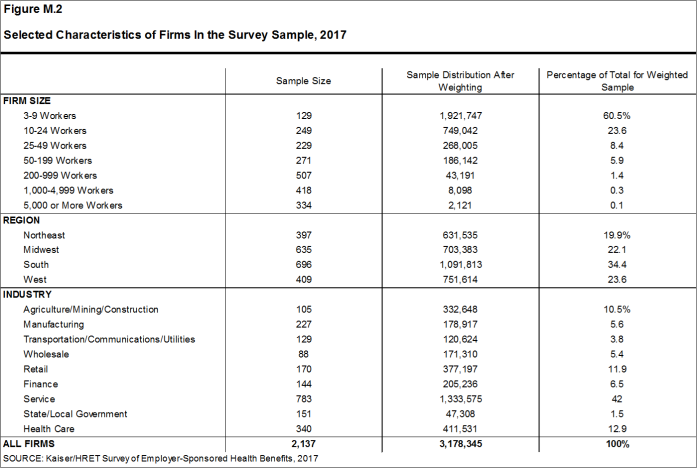
Figure M.2: Selected Characteristics of Firms In the Survey Sample, 2017
Figure M.3 presents the breakdown of states into regions and is based on the U.S Census Bureau’s categorizations. State-level data are not reported both because the sample size is insufficient in many states and we only collect information on a firm’s primary location rather than where all workers may actually be employed. Some mid- and large-size employers have employees in more than one state, so the location of the headquarters may not match the location of the plan for which we collected premium information.
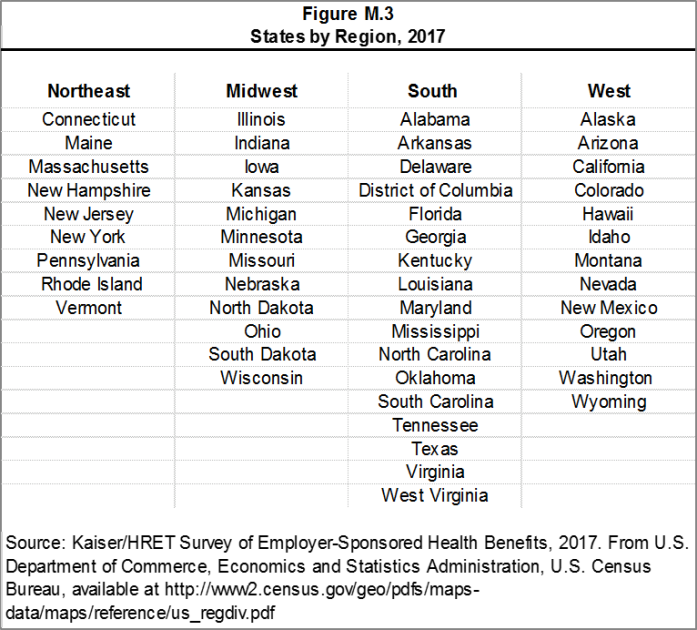
Figure M.3: States by Region, 2017
Figure M.4 displays the distribution of the nation’s firms, workers, and covered workers (employees receiving coverage from their employer). Among the three million firms nationally, approximately 60.5% employ 3 to 9 workers; such firms employ 7.8% of workers, and 3.1% of workers covered by health insurance. In contrast, less than one percent of firms employ 5,000 or more workers; these firms employ 35.5% of workers and 39.9% of covered workers. Therefore, the smallest firms dominate any statistics weighted by the number of employers. For this reason, most statistics about firms are broken out by size categories. In contrast, firms with 1,000 or more workers are the most influential employer group in calculating statistics regarding covered workers, since they employ the largest percentage of the nation’s workforce.
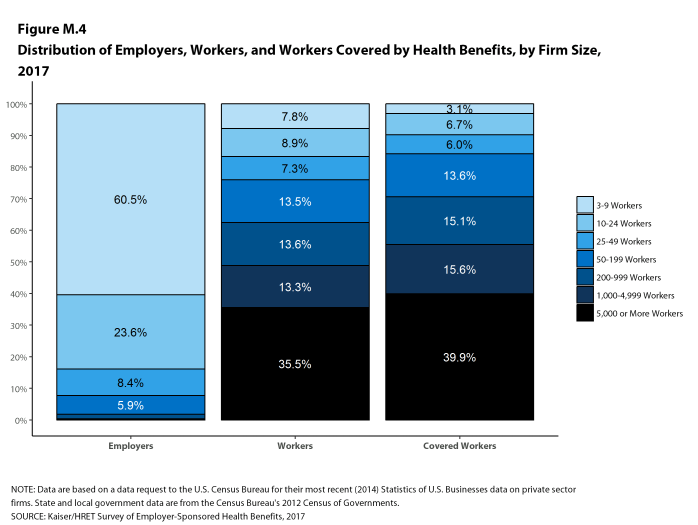
Figure M.4: Distribution of Employers, Workers, and Workers Covered by Health Benefits, by Firm Size, 2017
Throughout this report, we use the term “in-network” to refer to services received from a preferred provider. Family coverage is defined as health coverage for a family of four.
The survey asks firms what percentage of their employees earn less than a specified amount in order to identify the portion of a firm’s workforce that has relatively low wages. This year, the income threshold is $24,000 per year for lower-wage workers and $60,000 for higher-wage workers. These thresholds are based on the 25th and 75th percentile of workers’ earnings as reported by the Bureau of Labor Statistics using data from the Occupational Employment Statistics (OES) (2016).9 The cutoffs were inflation-adjusted and rounded to the nearest thousand. Prior to 2013, wage cutoffs were calculated using the now-eliminated National Compensation Survey.
ROUNDING AND IMPUTATION
Some figures in the report do not sum to totals due to rounding. In a few cases, numbers from distribution figures may not add to the numbers referenced in the text due to rounding. Although overall totals and totals for size and industry are statistically valid, some breakdowns may not be available due to limited sample sizes or a high relative standard error. Where the unweighted sample size is fewer than 30 observations, figures include the notation “NSD” (Not Sufficient Data). Estimates with high relative standard errors are reviewed and in some cases not published. Many breakouts by subsets may have a large standard error, meaning that even large differences are not statistically different. Statistics among small firms and those weighted by the number of firms tend to have more variability.
To control for item nonresponse bias, Kaiser/HRET imputes values that are missing for most variables in the survey. On average, 5% of observations are imputed. All variables are imputed following a hotdeck approach. The hotdeck approach replaces missing information with observed values from a firm similar in size and industry to the firm for which data are missing. In 2017, there were eleven variables where the imputation rate exceeded 20%; most of these cases were for individual plan level statistics. When aggregate variables were constructed for all of the plans, the imputation rate was usually much lower. There are a few variables that Kaiser/HRET has decided not to impute; these are typically variables where “don’t know” is considered a valid response option (for example, the percentage of workers respondents believe are covered by Medicaid). Some variables are imputed based on their relationship to each other. For example, if a firm provided a worker contribution for family coverage but no premium information, a ratio between the family premium and family contribution was imputed and then the family premium was calculated. In addition, there are several variables in which missing data are calculated based on respondents’ answers to other questions (for example, employer contributions to premiums are calculated from the respondent’s premium and the worker contribution to premiums).
Since 2014, we estimate separate single and family coverage premiums for firms that provide premium amounts as the average cost for all covered workers, instead of differentiating between single and family coverage. This method more accurately accounts for the portion that each type of coverage contributes to the total cost for the one percent of covered workers who are enrolled at firms affected by this adjustment.
SAMPLE DESIGN
We determined the sample requirements based on the universe of firms obtained from the U.S. Census Bureau. Prior to the 2010 survey, the sample requirements were based on the total counts provided by Survey Sampling Incorporated (SSI) (which obtains data from Dun and Bradstreet). Since 2010, we define Education as a separate sampling category for the purposes of sampling, rather than as a subgroup of the Service category. In the past, Education firms were a disproportionately large share of Service firms. Education is controlled for during post-stratification, and adjusting the sampling frame to also control for Education allows for a more accurate representation of both the Education and Service industries.
In past years, both private and government firms were sampled from the Dun and Bradstreet database. Beginning in 2009, Government firms were sampled from the 2007 Census of Governments. This change was made to eliminate the overlap of state agencies that were frequently sampled from the Dun and Bradstreet database. The sample of private firms is screened for firms that are related to state/local governments, and if these firms are identified in the Census of Governments, they are reclassified as government firms and a private firm is randomly drawn to replace the reclassified firm. The federal government is not included in the sample frame.
Finally, the data used to determine the 2017 Employer Health Benefits Survey sample frame include the U.S. Census’ 2013 Statistics of U.S. Businesses and the 2012 Census of Governments. At the time of the sample design (December 2016), these data represented the most current information on the number of public and private firms nationwide with three or more workers. As in the past, the post-stratification is based on the most up-to-date Census data available (the 2014 update to the Census of U.S. Businesses was purchased during the survey fielding period).
WEIGHTING AND STATISTICAL SIGNIFICANCE
Because Kaiser/HRET selects firms randomly, it is possible through the use of statistical weights to extrapolate the results to national (as well as firm size, regional, and industry) averages. These weights allow us to present findings based on the number of workers covered by health plans, the number of total workers, and the number of firms. In general, findings in dollar amounts (such as premiums, worker contributions, and cost sharing) are weighted by covered workers. Other estimates, such as the offer rate, are weighted by firms. Specific weights were created to analyze the HDHP/SO plans that are offered with a Health Reimbursement Arrangement (HRA) or that are Health Savings Account (HSA)-qualified. These weights represent the proportion of employees enrolled in each of these arrangements.
Calculation of the weights follows a common approach. We trimmed the weights in order to reduce the influence of weight outliers. First, we grouped firms into size and offer categories of observations. Within each strata, we identified the median and the interquartile range of the weights and calculated the trimming cut point as the median plus six times the interquartile range (M + [6 * IQR]). Weight values larger than this cut point are trimmed to the cut point. In all instances, very few weight values were trimmed. Finally, we calibrated the weights to U.S. Census Bureau’s 2014 Statistics of U.S. Businesses for firms in the private sector, and the 2012 Census of Governments as the basis for calibration / post-stratification for public sector firms. Historic employer-weighted statistics were updated in 2011.
In 2017, weights were not adjusted using the nonresponse adjustment process described in previous years’ methods. As in past years, Kaiser/HRET conducted a small follow-up survey of those firms with 3-49 workers that refused to participate in the full survey. Based on the results of a McNemar test, we were not able to verify that the results of the follow-up survey were comparable to the results from the original survey. In 2010 and 2015, the results of the McNemar test were also significant and we did not conduct a nonresponse adjustment.
Between 2006 and 2012, only limited information was collected on conventional plans. Starting in 2013, information on conventional plans is collected under the PPO section and therefore, the covered worker weight is representative of all plan types for which the survey collects information.
The survey collects information on physician office visits for each plan type. Different plan types at the same firm may have different cost-sharing structures (e.g., copayments or coinsurance). Because the composite variables (using data from across all plan types) are reflective of only those plans with that provision, separate weights for the relevant variables were created in order to account for the fact that not all covered workers have such provisions. As discussed below, changes in the 2017 survey have reduced the number of variable-specific weights used.
To account for design effects, the statistical computing package R and the library package “survey” were used to calculate standard errors.10,11 All statistical tests are performed at the .05 confidence level, unless otherwise noted. For figures with multiple years, statistical tests are conducted for each year against the previous year shown, unless otherwise noted. No statistical tests are conducted for years prior to 1999.
Statistical tests for a given subgroup (firms with 25-49 workers, for instance) are tested against all other firm sizes not included in that subgroup (all firm sizes NOT including firms with 25-49 workers, in this example). Tests are done similarly for region and industry; for example, Northeast is compared to all firms NOT in the Northeast (an aggregate of firms in the Midwest, South, and West). However, statistical tests for estimates compared across plan types (for example, average premiums in PPOs) are tested against the “All Plans” estimate. In some cases, we also test plan-specific estimates against similar estimates for other plan types (for example, single and family premiums for HDHP/SOs against single and family premiums for HMO, PPO, and POS plans); these are noted specifically in the text. The two types of statistical tests performed are the t-test and the Wald test. The small number of observations for some variables resulted in large variability around the point estimates. These observations sometimes carry large weights, primarily for small firms. The reader should be cautioned that these influential weights may result in large movements in point estimates from year to year; however, these movements are often not statistically significant. Standard Errors for most key statistics are available in a technical supplement available at http://www.kff.org/ehbs.
2017 SURVEY
In 2017, we continued to make revisions to how the survey asks employers about their prescription drug coverage. In most cases, information reported in Prescription Drug Benefits (Section 9) is not comparable with previous years’ findings. Over time, plans have developed more complex benefit designs. In order to better capture information on specialty drugs, we elected to ask about these drugs separately from the cost sharing on other tiers. We modified the question about the number of tiers a firm’s cost-sharing structure has to ask specifically about tiers that do not exclusively cover specialty drugs. Average copayment and coinsurance values are still reported among workers with three or more tiers, two tiers, or the same cost sharing regardless of drug class, but none of these tiers includes cost sharing for tiers that exclusively cover specialty drugs. Forty-five percent of firms with drug coverage cover specialty drugs but do not have a tier that only covers this class of drugs. In these cases, cost sharing among specialty drugs is still captured with the plan’s other drug classes.
Figures 9.1 and 9.2 report the distribution of cost-sharing structures including any tiers for specialty drugs. This analysis adds the number of tiers the firm reported by any tiers they may have for specialty drugs. Therefore, a firm with two tiers and a tier exclusively for specialty drugs is considered a three tier plan in this analysis, but a two tier plan when reporting average cost sharing values. Even if a firm has multiple specialty-only tiers, we collect information on only one.
Similar to 2016, we no longer require that a firm’s cost-sharing tiers be sequential, meaning that the second tier copayment was higher than the first tier, the third tier was higher than the second, and the fourth was higher than the third. As drug formularies have become more intricate, many firms have minimum and maximum amounts attached to their copayments and coinsurance, leading us to believe it was no longer appropriate to assume that a firm’s cost sharing followed this sequential logic.
To reduce the length of survey, in several areas, including stoploss coverage for self-funded firms and cost sharing for hospital admissions, outpatient surgery, and emergency room visits, we revised the questionnaire to ask respondents about the attributes of their largest health plan rather than each plan type they may offer. This expands on the method we used for prescription drug coverage in 2016. Therefore, for these topics, aggregate variables represent the attributes of the firm’s largest plan type, and are not a weighted average of all of the firms plan types. In previous surveys, if a firm had two plan types, one with a copayment and one with a coinsurance for hospital admissions, the covered worker weight was allotted proportionally toward the average copayment and coinsurance based on the number of covered workers with either feature. With of this change, comparison among plans types is now a comparison of firms where any given plan type is the largest. The change only affects firms that have multiple plan types (58% of covered workers). After reviewing the responses and comparing them to prior years where we asked about each plan type, we find that the information we are receiving is similar to responses from previous years. For this reason, we will continue to report our results for these questions weighted by the number of covered workers in responding firms.
Starting in 2017, respondents were allowed to volunteer that their plans did not cover outpatient surgery or hospital admissions. Less than 1% of respondents indicated that their plan did not include coverage for these services. Cost sharing for hospital admissions, outpatient surgery and emergency room visits was imputed by drawing a firm similar in size and industry within the same plan type.
In 2017, HSA-qualified health plans are not allowed to have separate per-person deductibles below the minimum family deductible ($2,600 in 2017). Some firms reported per-person deductibles below this limit; in these cases, firms were re-contacted, and in some instances, respondents confirmed these responses. We elected not to edit these deductibles to the legal minimum.
Beginning in 2017, values below 3% are not shown on graphical figures to improve the readability of those graphs. The underlying data for all estimates presented in graphs is available at http://www.kff.org/ehbs.
Annual inflation estimates are usually calculated from April to April. The 12 month percentage change for May to May was 2%.12
HISTORICAL DATA
Data in this report focus primarily on findings from surveys jointly authored by the Kaiser Family Foundation and the Health Research & Educational Trust, which have been conducted since 1999. Prior to 1999, the survey was conducted by the Health Insurance Association of America (HIAA) and KPMG using a similar survey instrument, but data are not available for all the intervening years. Following the survey’s introduction in 1987, the HIAA conducted the survey through 1990, but some data are not available for analysis. KPMG conducted the survey from 1991-1998. However, in 1991, 1992, 1994, and 1997, only larger firms were sampled. In 1993, 1995, 1996, and 1998, KPMG interviewed both large and small firms. In 1998, KPMG divested itself of its Compensation and Benefits Practice, and part of that divestiture included donating the annual survey of health benefits to HRET.
This report uses historical data from the 1993, 1996, and 1998 KPMG Surveys of Employer-Sponsored Health Benefits and the 1999-2016 Kaiser/HRET Survey of Employer-Sponsored Health Benefits. For a longer-term perspective, we also use the 1988 survey of the nation’s employers conducted by the HIAA, on which the KPMG and Kaiser/HRET surveys are based. The survey designs for the three surveys are similar.
Published: September 19th, 2017. Last Updated: 2017-09-14
- HDHP/SO premium estimates do not include contributions made by the employer to Health Savings Accounts or Health Reimbursement Arrangements.↩
- HDHP/SO includes high-deductible health plans with a deductible of at least $1,000 for single coverage and $2,000 for family coverage and that offer either a Health Reimbursement Arrangement (HRA) or a Health Savings Account (HSA). Although HRAs can be offered along with a health plan that is not an HDHP, the survey collected information only on HRAs that are offered along with HDHPs. For specific definitions of HDHPs, HRAs, and HSAs, see the introduction to Section 8.↩
- In total, 139 firms participated in 2015, 274 firms participated in 2016, and 1,014 firms participated in both 2015 and 2016.↩
- Response rate estimates are calculated by dividing the number of completes over the number of refusals and the fraction of the firms with unknown eligibility to participate estimated to be eligible. Firms determined to be ineligible to complete the survey are not included in the response rate calculation.↩
- Estimates presented in Figures 2.1, 2.2, 2.3, 2.4, 2.5, and 2.26 are based on the sample of both firms that completed the entire survey and those that answered just one question about whether they offer health benefits.↩
- General information on the OES can be found at http://www.bls.gov/oes/oes_emp.htm#scope. A comparison between the OES and the NCS is available at https://www.bls.gov/opub/mlr/2013/article/lettau-zamora.htm↩
- Analysis of the 2011 survey data using both R and SUDAAN (the statistical package used prior to 2012) produced the same estimates and standard errors.↩
- A supplement with standard errors for select estimates can be found online at Technical Supplement: Standard Error Tables for Selected Estimates, http://ehbs.kff.org↩
- Bureau of Labor Statistics, Consumer Price Index, U.S. City Average of Annual Inflation (April to April), 2000-2017; [cited 2017 July 21] http://data.bls.gov/timeseries/CUUR0000SA0?output_view=pct_1mth↩
Section One: Cost Of Health Insurance
The average annual premiums in 2017 are $6,690 for single coverage and $18,764 for family coverage. The average premium for single coverage increased by 4% since 2016 and the average premium for family coverage increased by 3%. The average family premium has increased 55% since 2007 and 19% since 2012. The average family premium for covered workers in small firms (3-199 workers) ($17,615) is significantly lower than average family premiums for workers in large firms (200 or more workers) ($19,235).
PREMIUM COSTS FOR SINGLE AND FAMILY COVERAGE
- The average premium for single coverage in 2017 is $6,690 per year. The average premium for family coverage is $18,764 per year [Figure 1.1].
- The average annual premium for family coverage for covered workers in small firms ($17,615) is lower than the average premium for covered workers in large firms ($19,235) [Figure 1.2].
- The average annual premiums for covered workers in HDHP/SOs are lower for single coverage ($6,024) and family coverage ($17,581) than overall average premiums. The average premiums for covered workers enrolled in PPO plans are higher for single ($6,965) and family coverage ($19,481) than the overall plan average [Figure 1.1].
- The average premiums for covered workers are lower in the South ($6,372 for single coverage and $18,038 for family coverage) than the average premiums for covered workers in all other regions. The average premium for family coverage for covered workers in the Northeast ($20,092) is higher than the average family premium for covered workers in all other regions [Figure 1.3].
- The average premiums for covered workers vary across industries, with those in the retail industry being particularly low ($5,716 for single coverage and $16,920 for family coverage) [Figure 1.4].
- The average premiums for covered workers in firms with a relatively large share of younger workers (where at least 35% of the workers are age 26 or younger) are lower than the average premiums for covered workers in firms with a smaller share of younger workers ($5,922 vs. $6,762 for single coverage and $16,893 vs. $18,939 for family coverage) [Figures 1.5 and 1.6].
- Premiums also vary by firm wage level. The average premiums for covered workers in firms with a relatively large share of lower-wage workers (where at least 35% of workers earn $24,000 a year or less) are less than the average premiums at firms with a smaller share of lower-wage workers ($6,035 vs. $6,739 for single coverage and $16,376 vs. $18,942 for family coverage) [Figures 1.5 and 1.6].
- The average premiums for covered workers in firms with at least some union workers are higher than the average premiums for covered workers in firms without union workers ($7,183 vs. $6,434 for single coverage and $19,885 vs. $18,177 for family coverage) [Figures 1.5 and 1.6].
- There is also variation in premiums by type of firm ownership. For both single and family coverage, covered workers at private for-profit firms have lower average annual premiums than covered workers at public firms or private not-for-profit firms [Figures 1.5 and 1.6].
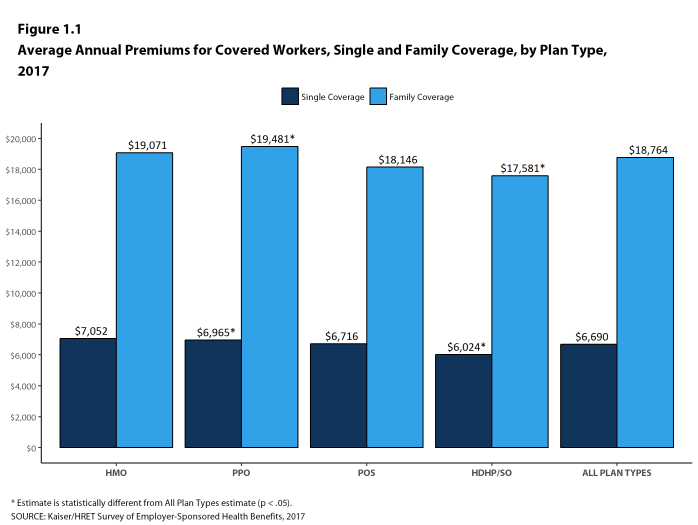
Figure 1.1: Average Annual Premiums for Covered Workers, Single and Family Coverage, by Plan Type, 2017
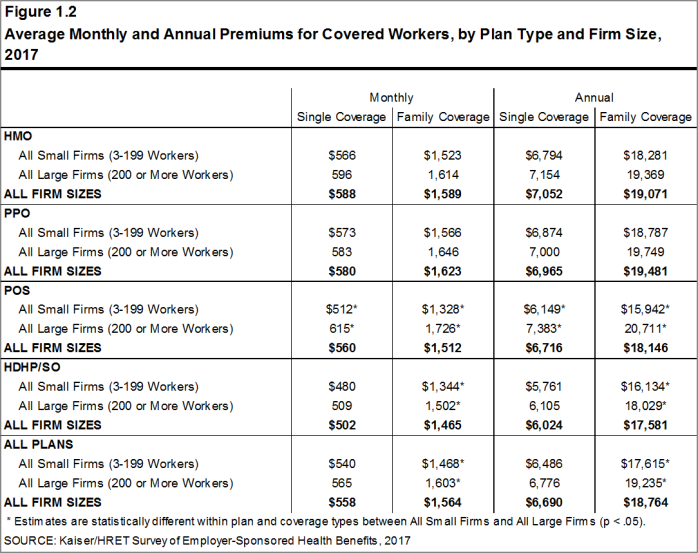
Figure 1.2: Average Monthly and Annual Premiums for Covered Workers, by Plan Type and Firm Size, 2017
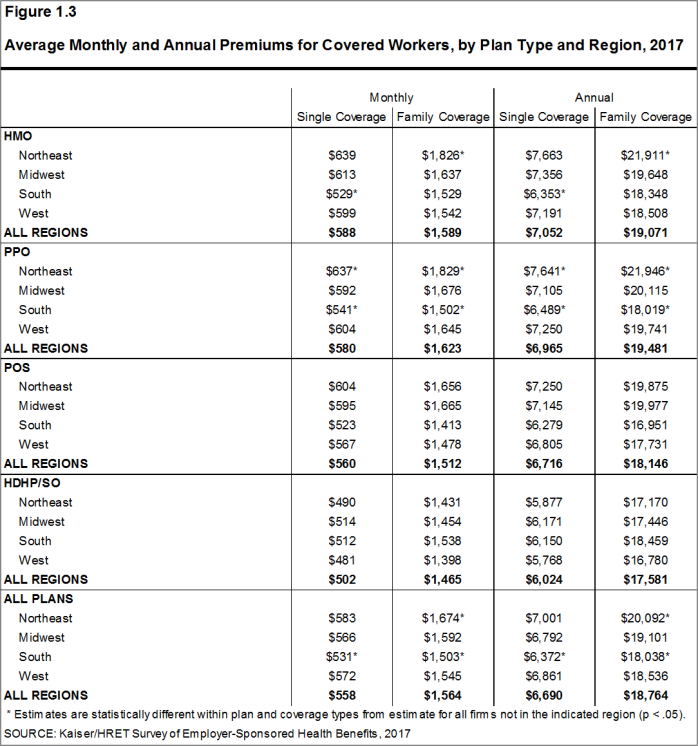
Figure 1.3: Average Monthly and Annual Premiums for Covered Workers, by Plan Type and Region, 2017

Figure 1.4: Average Monthly and Annual Premiums for Covered Workers, by Plan Type and Industry, 2017
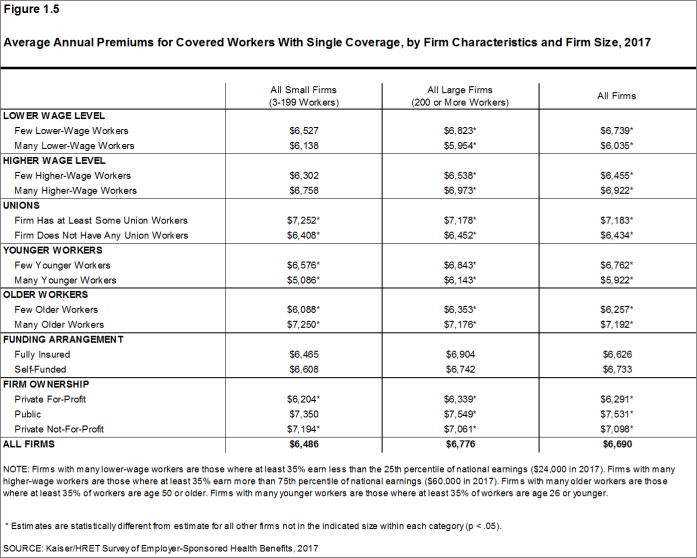
Figure 1.5: Average Annual Premiums for Covered Workers With Single Coverage, by Firm Characteristics and Firm Size, 2017

Figure 1.6: Average Annual Premiums for Covered Workers With Family Coverage, by Firm Characteristics and Firm Size, 2017
PREMIUM DISTRIBUTION
- There is considerable variation in premiums for both single and family coverage.
- Twenty percent of covered workers are employed in a firm with a single premium at least 20% higher than the average single premium, while 21% of covered workers are in firms with a single premium less than 80% of the average single premium [Figures 1.7].
- For family coverage, 17% of covered workers are employed in a firm with a family premium at least 20% higher than the average family premium, while 21% of covered workers are in firms with a family premium less than 80% of the average family premium [Figure 1.7].
- Six percent of covered workers are in a firm with a premium of at least $10,000 a year for single coverage [Figure 1.8]. Seven percent of covered workers are in a firm with a premium of at least $26,000 a year for family coverage [Figure 1.9].

Figure 1.7: Distribution of Annual Premiums for Single and Family Coverage Relative to the Average Annual Single or Family Premium, 2017
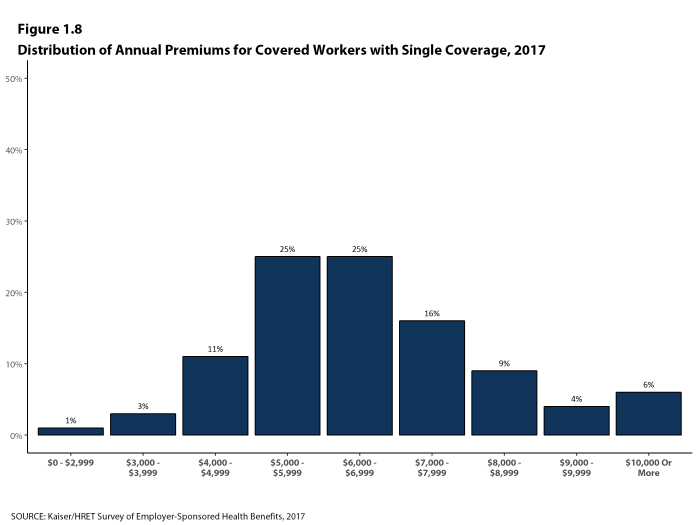
Figure 1.8: Distribution of Annual Premiums for Covered Workers With Single Coverage, 2017
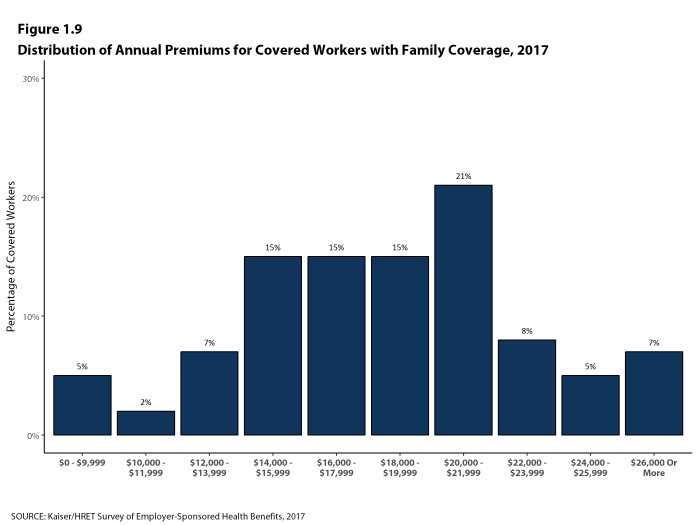
Figure 1.9: Distribution of Annual Premiums for Covered Workers With Family Coverage, 2017
PREMIUM CHANGES OVER TIME
- The average premium for single coverage is 4% higher than the single premium last year and the average premium for family coverage is 3% higher than the average family premium last year [Figure 1.10].
- The average premiums for single and family coverage have grown at the same rate (19%) since 2012.
- The average family premiums for both small and large firms have increased at similar rates since 2012 (15% for small firms and 20% for large firms). For small firms, the average family premium rose from $15,253 in 2012 to $17,615 in 2017. For large firms, the average family premium rose from $15,980 in 2012 to $19,235 in 2017 [Figures 1.11 and 1.12].
- The $18,764 average family premium in 2017 is 19% higher than the average family premium in 2012 and 55% higher than the average family premium in 2007 [Figure 1.10] . The 19% family premium growth in the last five years is smaller than the 30% growth between 2007 and 2012, or the 51% premium growth between 2002 and 2007 [Figure 1.13].
- The average family premiums for both small and large firms have increased at similar rates since 2007 (49% for small firms and 57% for large firms). For small firms, the average family premium rose from $11,835 in 2007 to $17,615 in 2017. For large firms, the average family premium rose from $12,233 in 2007 to $19,235 in 2017 [Figures 1.11 and 1.12].
- For covered workers in large firms, over the last five years, the average family premium in firms that are fully insured has grown at a similar rate to the average family premium for covered workers in fully or partially self-funded firms (16% for fully insured plans and 21% for self-funded firms) [Figure 1.14].
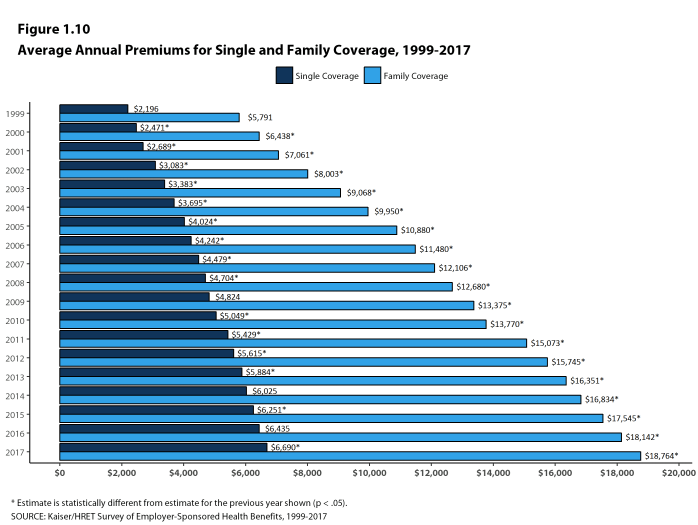
Figure 1.10: Average Annual Premiums for Single and Family Coverage, 1999-2017
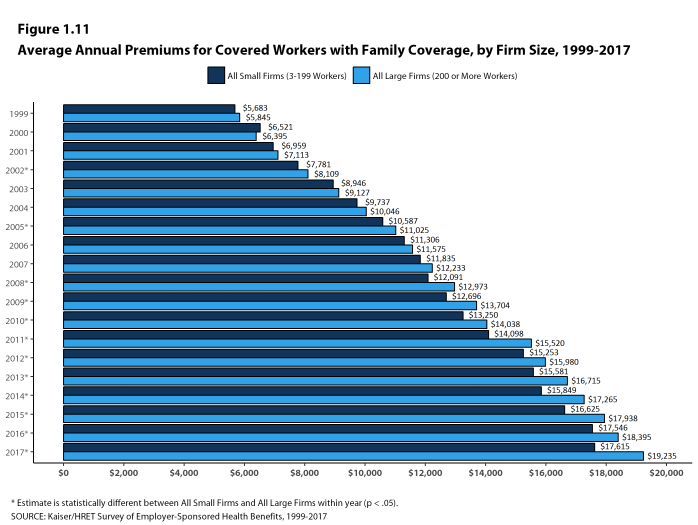
Figure 1.11: Average Annual Premiums for Covered Workers With Family Coverage, by Firm Size, 1999-2017
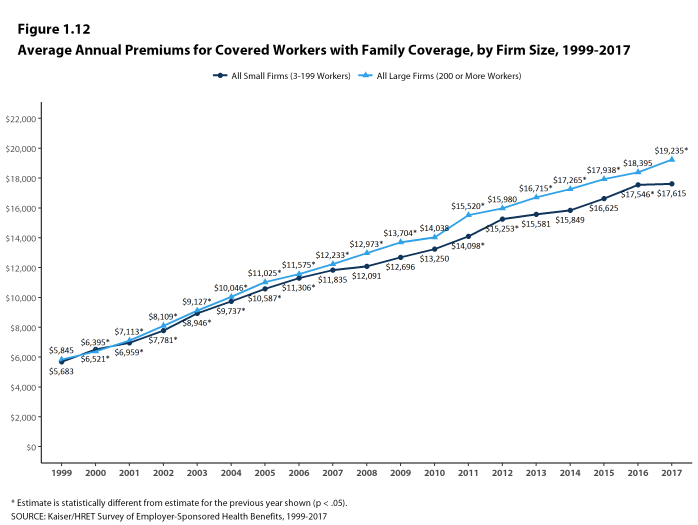
Figure 1.12: Average Annual Premiums for Covered Workers With Family Coverage, by Firm Size, 1999-2017
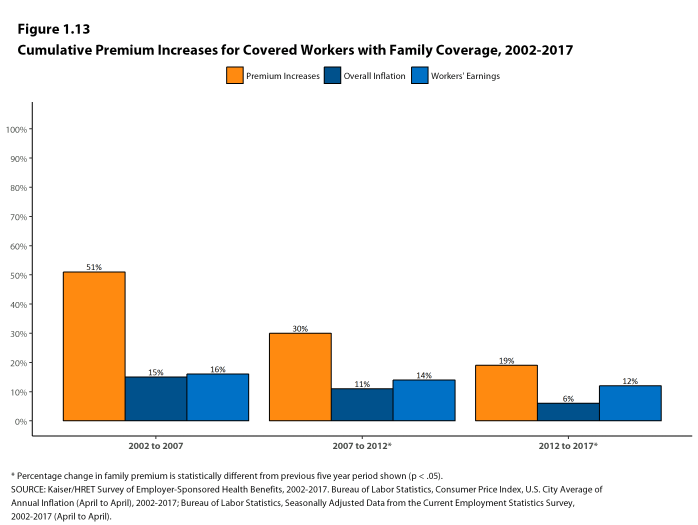
Figure 1.13: Cumulative Premium Increases for Covered Workers With Family Coverage, 2002-2017
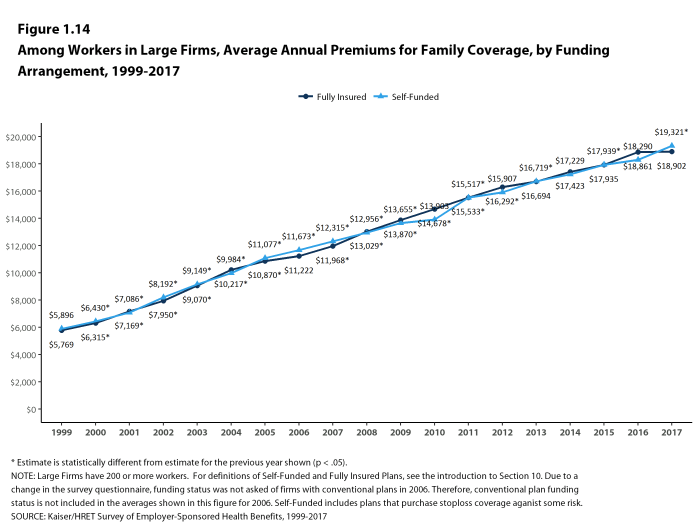
Figure 1.14: Among Workers In Large Firms, Average Annual Premiums for Family Coverage, by Funding Arrangement, 1999-2017
Section Two: Health Benefits Offer Rates
While nearly all large firms (200 or more workers) offer health benefits to at least some employees, small firms (3-199 workers) are significantly less likely to do so. The percentage of all firms offering health benefits in 2017 (53%) is similar to the percentage of firms offering health benefits last year (56%), but lower than the percentages of firms offering health benefits in 2007 (59%) and 2012 (61%). As we reported last year, there has been a long-term decline in the offer and coverage rates for employer-provided coverage, particularly among smaller firms.13
Firms not offering health benefits continue to cite cost as the most important reason they do not do so. Almost all firms that offer coverage offer to dependents such as children and the spouses of eligible employees.
FIRM OFFER RATES
- In 2017, 53% of firms offer health benefits, similar to the 56% who reported doing so in 2016 [Figure 2.1].
- Ninety-nine percent of large firms offer health benefits to at least some of their workers. In contrast, only 53% of small firms offer health benefits in 2017 [Figures 2.2 and 2.3]. The percentages of both small and large firms offering health benefits to at least some of their workers are similar to those of last year [Figure 2.2].
- The overall percentage of firms offering coverage in 2017 is less than the percentage offering coverage in 2012 (61%) and 2007 (59%) [Figure 2.1]. As we reported last year, there has been a long-term decline in the offer and coverage rates for employer-provided coverage, particularly among smaller firms.
- Since most firms in the country are small, variation in the overall offer rate is driven largely by changes in the percentages of the smallest firms (3-9 workers) offering health benefits. For more information on the distribution of firms in the country, see the Survey Design and Methods Section and Figure M.4.14
- Ninety-six percent of firms with 100 or more workers offer health benefits to at least some of their workers in 2017. Ninety percent of firms with 50-99 workers offer benefits to at least some workers [Figure 2.4].
- Eighty-nine percent of all workers are employed by a firm that offers health benefits to at least some of its workers [Figure 2.26].
- Offer rates vary across different types of firms.
- Smaller firms are less likely to offer health insurance: 40% of firms with 3-9 workers offer coverage, compared to 78% of firms with 25-49 workers, and 92% of firms with 50-199 workers [Figure 2.3].
- Offer rates throughout different firm size categories in 2017 remain similar to those reported in 2016 [Figure 2.2].
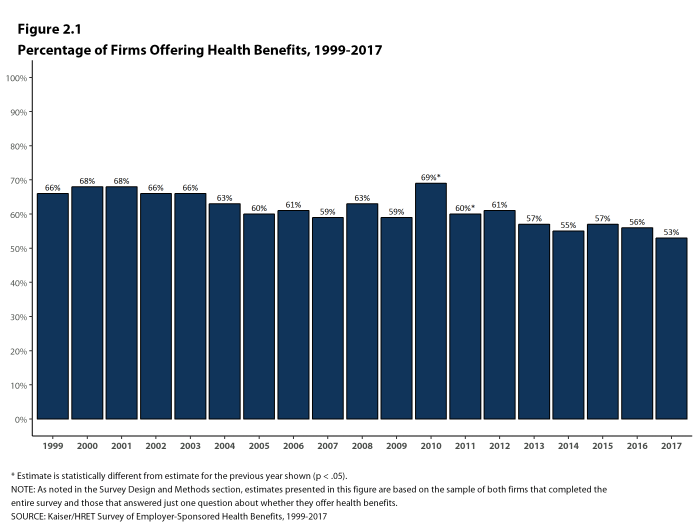
Figure 2.1: Percentage of Firms Offering Health Benefits, 1999-2017
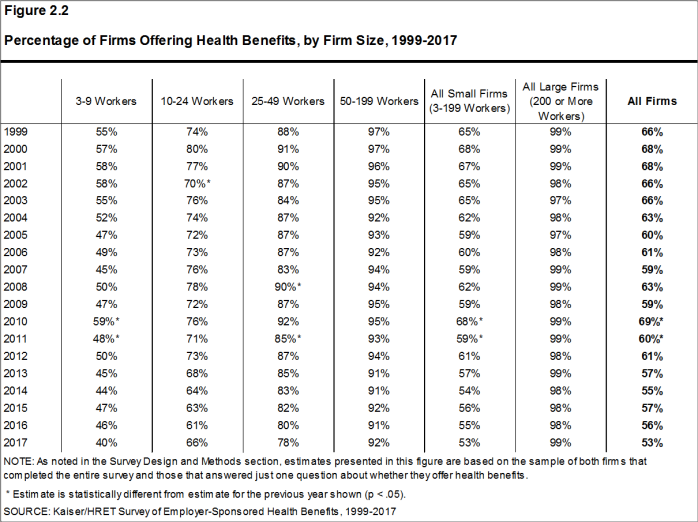
Figure 2.2: Percentage of Firms Offering Health Benefits, by Firm Size, 1999-2017
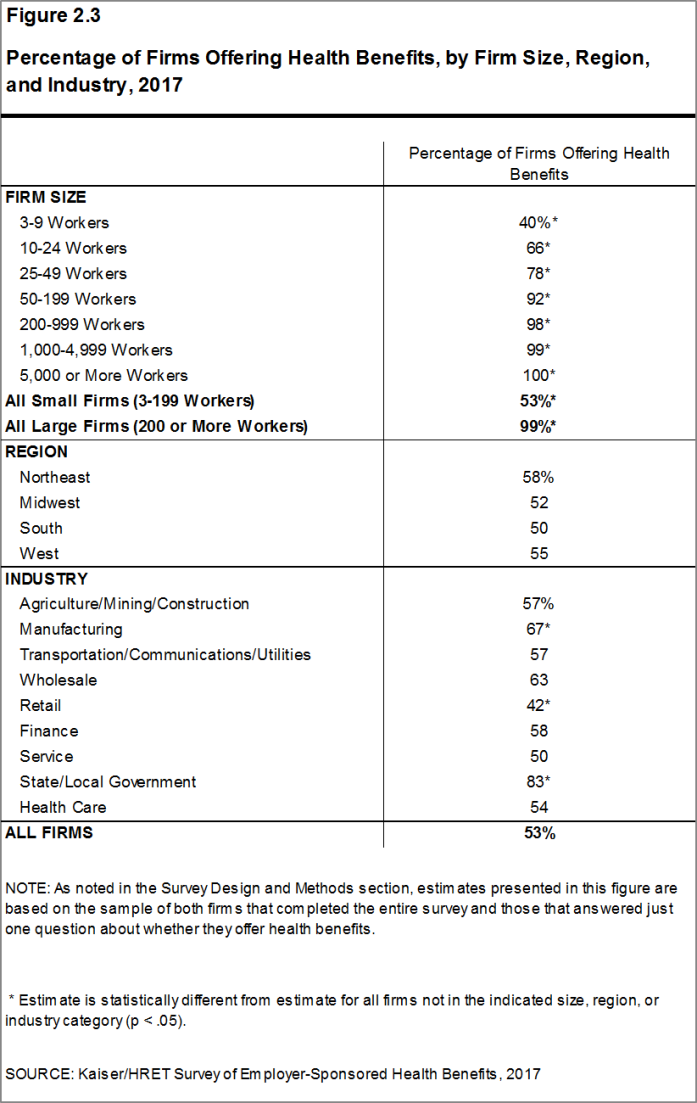
Figure 2.3: Percentage of Firms Offering Health Benefits, by Firm Size, Region, and Industry, 2017
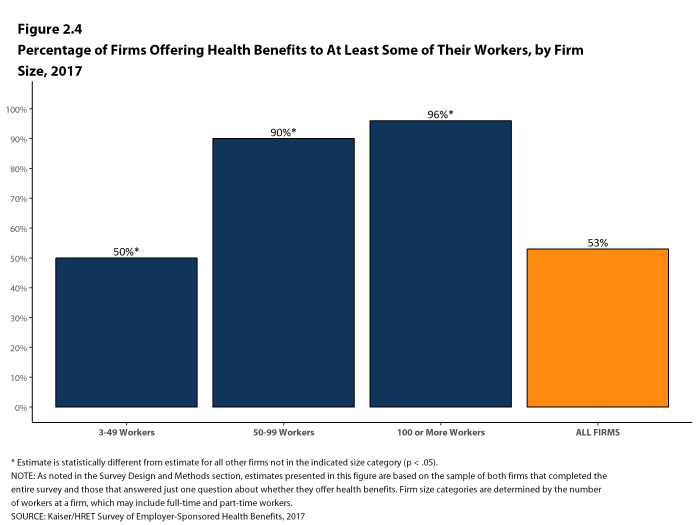
Figure 2.4: Percentage of Firms Offering Health Benefits to at Least Some of Their Workers, by Firm Size, 2017
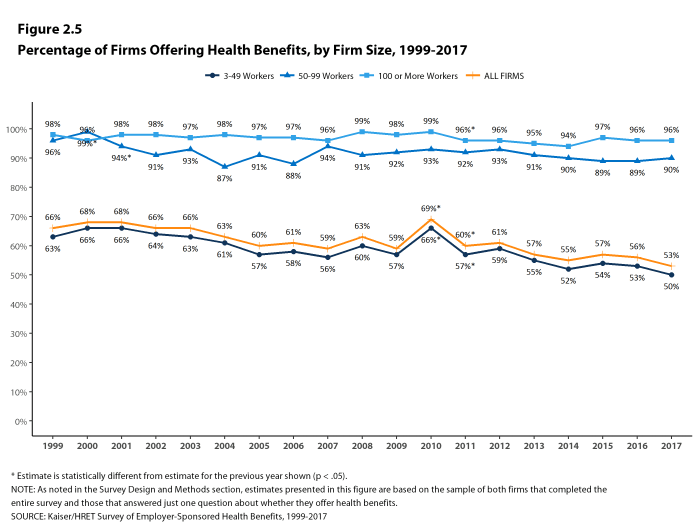
Figure 2.5: Percentage of Firms Offering Health Benefits, by Firm Size, 1999-2017
PART-TIME AND TEMPORARY WORKERS
- Among firms offering health benefits, relatively few offer benefits to their part-time and temporary workers.
- The ACA defines full-time workers as those who on average work at least 30 hours per week, and part-time workers as those who on average work fewer than 30 hours per week. The employer shared responsibility provision of the ACA requires that firms with at least 50 full-time equivalent employees offer full-time employees coverage that meets minimum standards or be assessed a penalty.15 Beginning in 2015, we modified the survey to explicitly ask employers whether they offered benefits to employees working fewer than 30 hours. Our previous question did not include a definition of “part-time”. For this reason, historical data on part-time offer rates are shown, but we did not test whether the differences between 2014 and 2015 were significant. Many employers may work with multiple definitions of part-time; one for their compliance with legal requirements and another for internal policies and programs.
- In 2017, 13% of all firms that offer health benefits offer them to part-time workers [Figure 2.7]. Large firms are more likely to offer health benefits to part-time workers than small firms (31% vs. 12%) [Figure 2.9].
- A small percentage (5%) of firms offering health benefits offer them to temporary workers [Figure 2.8]. Among firms offering health benefits, large firms are more likely than small firms to offer benefits to temporary workers (13% vs. 5%) [Figure 2.10]. The percentage of large firms offering health benefits to temporary workers is not statistically different from the 17% reported in 2016 [Figure 2.8].
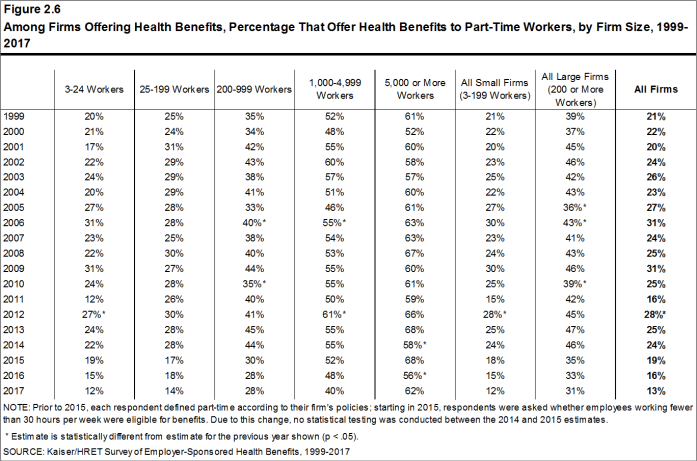
Figure 2.6: Among Firms Offering Health Benefits, Percentage That Offer Health Benefits to Part-Time Workers, by Firm Size, 1999-2017
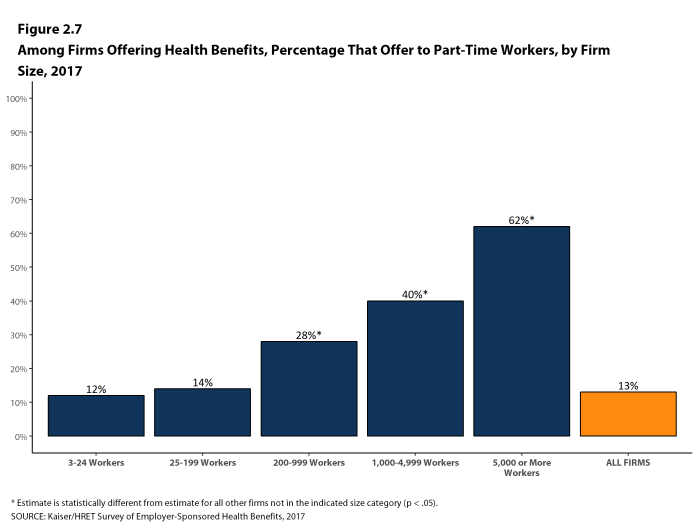
Figure 2.7: Among Firms Offering Health Benefits, Percentage That Offer to Part-Time Workers, by Firm Size, 2017
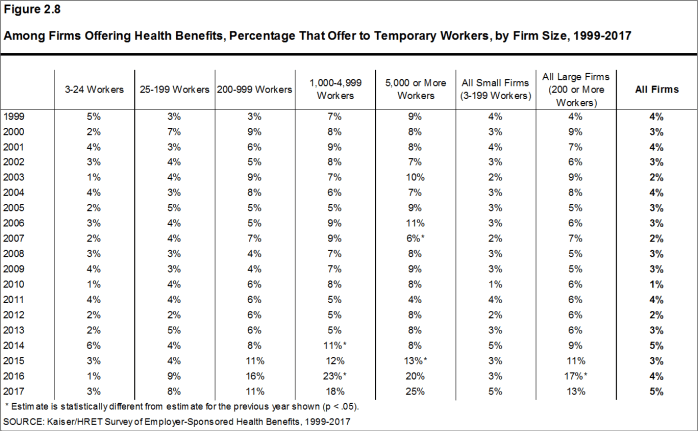
Figure 2.8: Among Firms Offering Health Benefits, Percentage That Offer to Temporary Workers, by Firm Size, 1999-2017
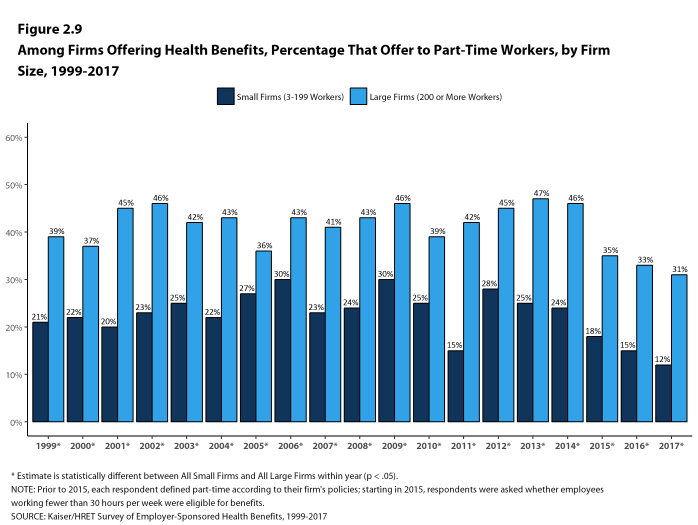
Figure 2.9: Among Firms Offering Health Benefits, Percentage That Offer to Part-Time Workers, by Firm Size, 1999-2017
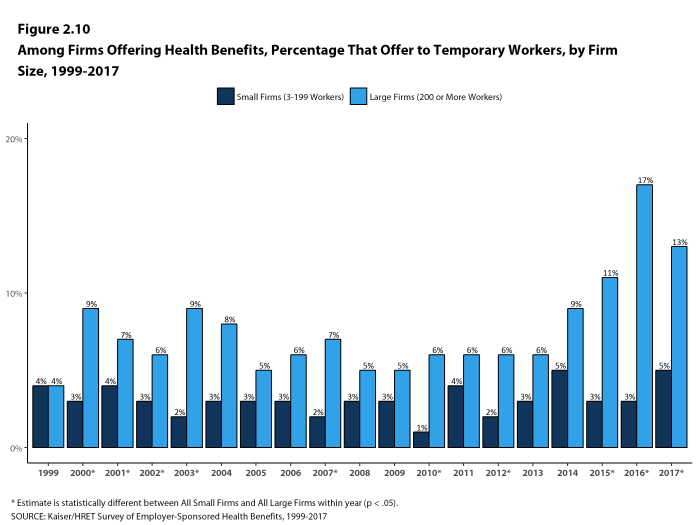
Figure 2.10: Among Firms Offering Health Benefits, Percentage That Offer to Temporary Workers, by Firm Size, 1999-2017
SPOUSES, DEPENDENTS AND DOMESTIC PARTNER BENEFITS
- The majority of firms offering health benefits offer to spouses and dependents, such as children. In 2017, 94% of small firms and 100% of large firms offering health benefits offer coverage to spouses, similar to last year. Ninety-two percent of small firms and 100% of large firms offering health benefits cover other dependents, such as children, similar to last year. Five percent of small firms offering health benefits offer only single coverage to employees [Figure 2.11].
- Employers were also asked whether same-sex or opposite-sex domestic partners were allowed to enroll in the firm’s coverage. While definitions may vary, employers often define domestic partners as an unmarried couple who has lived together for a specified period of time. Firms may define domestic partners separately from any legal requirements a state may have, and also, employers may have a different policy in different parts of the country or for different workers.
- In 2017, 36% of firms offering health benefits offer coverage to opposite-sex domestic partners, similar to the 27% who did so in 2016. Forty percent of firms offering health benefits offer coverage to same-sex domestic partners, similar to the 32% who did so last year [Figure 2.13].
- When firms are asked if they offer health benefits to opposite or same-sex domestic partners, many report that they have not encountered this issue. At some small firms, the firm may not have formal human resource policies on domestic partners simply because none of the firm’s workers have asked to cover a domestic partner. Regarding health benefits for opposite-sex domestic partners, 30% of firms report in 2017 that they have not encountered this request or that the question was not applicable [Figure 2.12]. The vast majority of firms in the United States are small businesses [Figure M.1]. Therefore, statistics about the percentage of firms that offer domestic partner benefits are largely determined by small businesses. More small firms (31%) than large firms (2%) indicate that they have not encountered this request or that the question was not applicable [Figure 2.12]. Regarding health benefits for same-sex domestic partners, 34% of firms report that they have not encountered the request or that the question was not applicable. More small firms (35%) than large firms (4%) report that they have not encountered the issue of offering benefits to same-sex domestic partners [Figure 2.12].
- Among large firms not offering health benefits to same-sex domestic partners, 3% stopped offering them within the last 12 months.
- Over half (57%) of firms that offer health benefits to spouses also offer coverage to same-sex spouses, with large firms more likely than small firms to offer coverage to same-sex spouses (88% vs. 56%). Small firms are more likely than large firms to report that this request has not been encountered (32% vs. 4%) [Figure 2.15].
- Among all firms that offer health benefits, 15% report providing additional compensation or benefits to employees if they enroll in a spouse’s plan, and 18% provide additional compensation or benefits to employees if they do not participate in the firm’s health benefits [Figure 2.16].
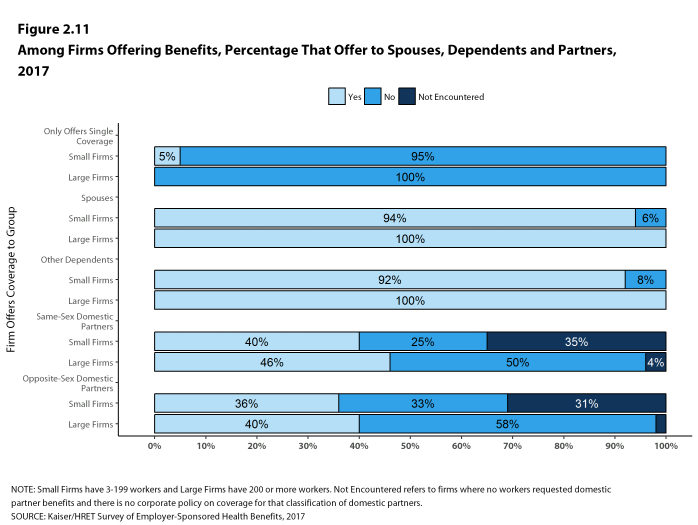
Figure 2.11: Among Firms Offering Benefits, Percentage That Offer to Spouses, Dependents and Partners, 2017
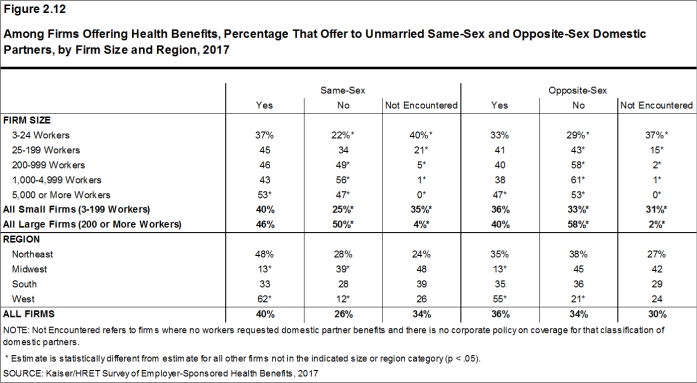
Figure 2.12: Among Firms Offering Health Benefits, Percentage That Offer to Unmarried Same-Sex and Opposite-Sex Domestic Partners, by Firm Size and Region, 2017
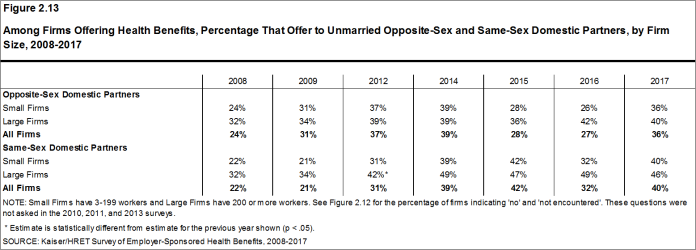
Figure 2.13: Among Firms Offering Health Benefits, Percentage That Offer to Unmarried Opposite-Sex and Same-Sex Domestic Partners, by Firm Size, 2008-2017

Figure 2.14: Among Firms Not Offering Domestic Partner Benefits, Percentage of Firms That Stopped Offering Those Benefits In the Last 12 Months, by Firm Size, 2017
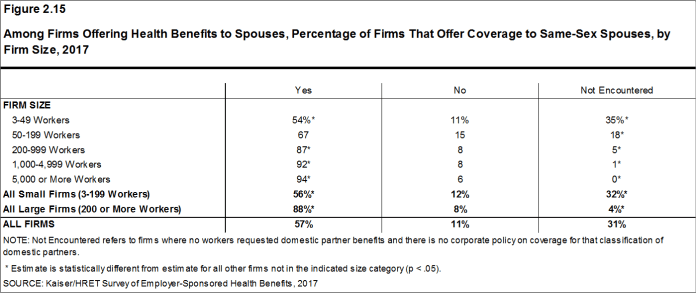
Figure 2.15: Among Firms Offering Health Benefits to Spouses, Percentage of Firms That Offer Coverage to Same-Sex Spouses, by Firm Size, 2017
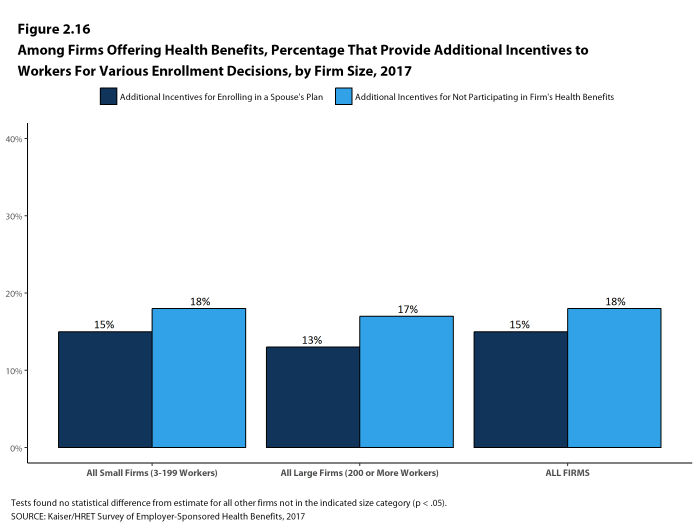
Figure 2.16: Among Firms Offering Health Benefits, Percentage That Provide Additional Incentives to Workers for Various Enrollment Decisions, by Firm Size, 2017
SUPPLEMENTAL AND VOLUNTARY BENEFITS
- Firms offering health benefits also offer a variety of supplemental and other health benefits to their workers. Large firms are more likely than small firms to offer these benefits [Figure 2.17]. Among firms offering health benefits:
- Sixty-seven percent of small firms and 97% of large firms offer dental benefits to their employees. Of firms offering these benefits, 67% make a contribution toward the cost of the coverage [Figure 2.18].
- Forty-seven percent of small firms and 82% of large firms offer vision benefits to their employees. Of firms offering these benefits, 54% make a contribution toward the cost of the coverage [Figure 2.18].
- Critical illness insurance provides a cash benefit when an enrollee is diagnosed with a specified condition, such as cancer. Twenty-three percent of small firms and 46% of large firms offer critical illness insurance to their employees. Of firms offering these benefits, 3% make a contribution toward the cost of the coverage [Figure 2.18].
- Hospital indemnity plans, sometimes known as hospital cash plans, provide a cash benefit when an enrollee is admitted to the hospital or has a certain type of outpatient surgery. Sixteen percent of small firms and 28% of large firms offer hospital indemnity insurance to their employees. Of firms offering these benefits, 5% make a contribution toward the cost of the coverage [Figure 2.18].
- Long-term care insurance covers assistance with daily living not generally covered by health insurance such as care from a home health worker or nursing home. Sixteen percent of small firms and 25% of large firms offer long-term care insurance to their employees, similar to the percentages in 2011. Of firms offering these benefits, 47% make a contribution toward the cost of the coverage [Figure 2.18].
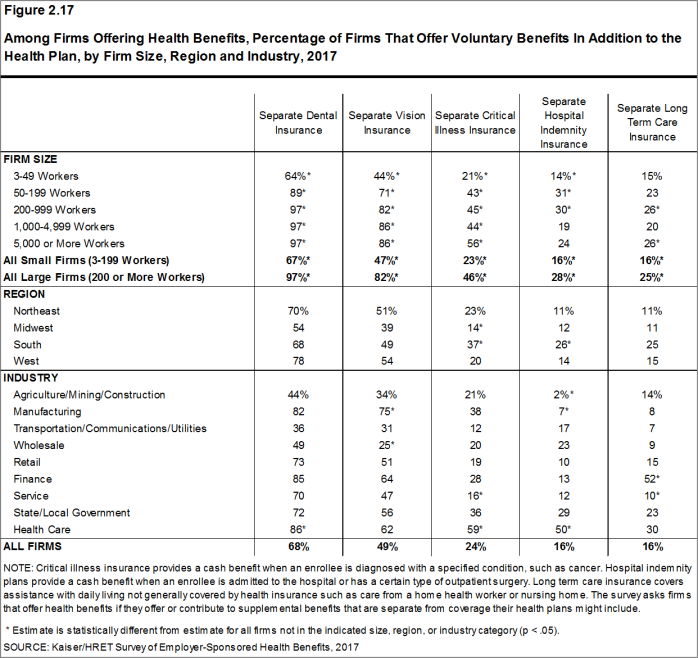
Figure 2.17: Among Firms Offering Health Benefits, Percentage of Firms That Offer Voluntary Benefits In Addition to the Health Plan, by Firm Size, Region and Industry, 2017
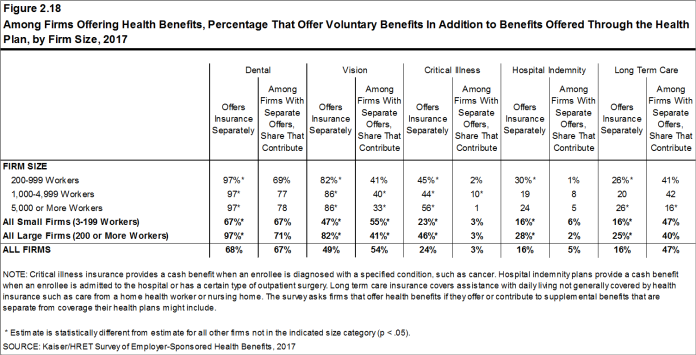
Figure 2.18: Among Firms Offering Health Benefits, Percentage That Offer Voluntary Benefits In Addition to Benefits Offered Through the Health Plan, by Firm Size, 2017
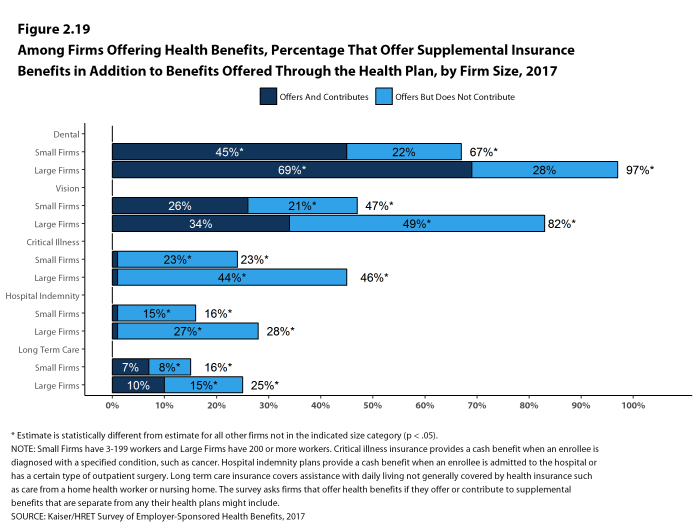
Figure 2.19: Among Firms Offering Health Benefits, Percentage That Offer Supplemental Insurance Benefits In Addition to Benefits Offered Through the Health Plan, by Firm Size, 2017
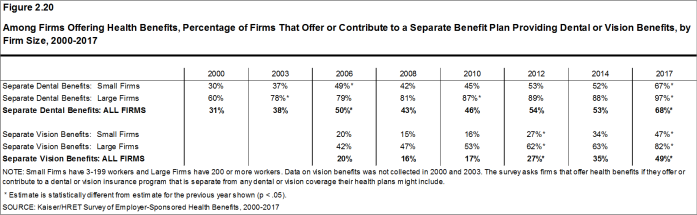
Figure 2.20: Among Firms Offering Health Benefits, Percentage of Firms That Offer or Contribute to a Separate Benefit Plan Providing Dental or Vision Benefits, by Firm Size, 2000-2017
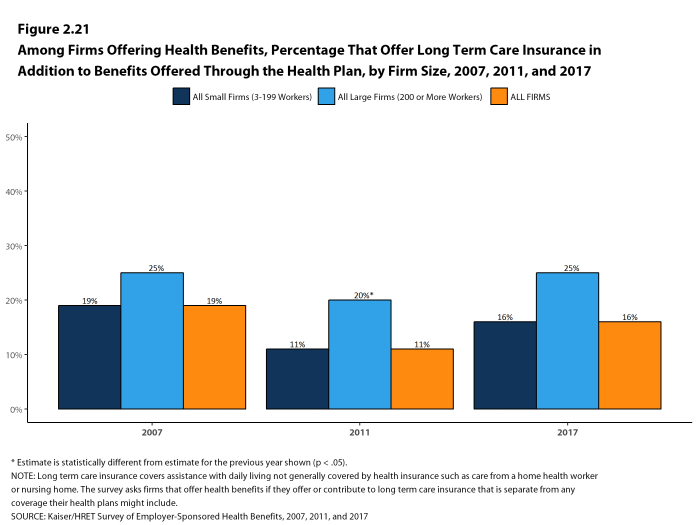
Figure 2.21: Among Firms Offering Health Benefits, Percentage That Offer Long Term Care Insurance In Addition to Benefits Offered Through the Health Plan, by Firm Size, 2007, 2011, and 2017
FIRMS NOT OFFERING HEALTH BENEFITS
- The survey asks firms that do not offer health benefits if they have offered insurance or shopped for insurance in the recent past, and about their most important reasons for not offering coverage. Because such a small percentage of large firms report not offering health benefits, we present responses for small non-offering firms only.
- The cost of health insurance remains the primary reason cited by firms for not offering health benefits. Among small firms not offering health benefits, 44% cite high cost as “the most important reason” for not doing so, followed by “the firm is too small” (17%) [Figure 2.22]. Relatively few small firms indicate that they do not offer because they believe that employees will get a better deal on the health insurance exchanges (2%).
- Many small non-offering firms have either offered health insurance in the past five years, or have shopped for health insurance in the past year. Twenty percent of small non-offering firms have offered health benefits in the past five years, and 13% have shopped for coverage in the past year [Figure 2.23]. The 20% of small non-offering firms that have offered coverage in the past five years is similar to the 19% reported last year.
- Among small non-offering firms that report they stopped offering coverage within the last five years, 18% stopped offering coverage within the last year.
- Among small non-offering firms, 16% report that they provide funds to their employees to purchase health insurance on their own in the individual market or through a health insurance exchange [Figure 2.24]. Forty percent of these firms provide workers between $2,000 and $5,999 a year to purchase non-group insurance [Figure 2.25].
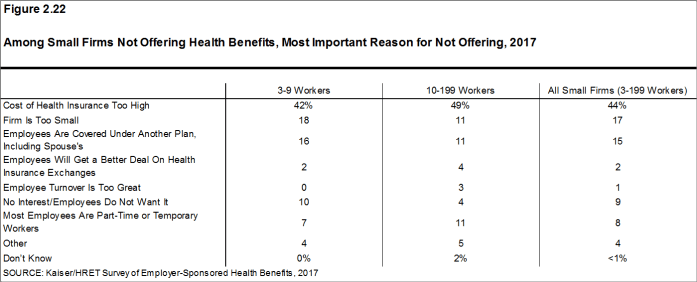
Figure 2.22: Among Small Firms Not Offering Health Benefits, Most Important Reason for Not Offering, 2017
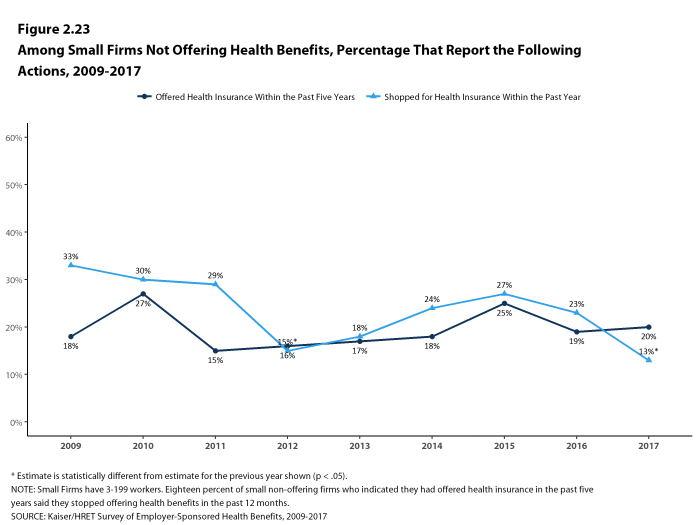
Figure 2.23: Among Small Firms Not Offering Health Benefits, Percentage That Report the Following Actions, 2009-2017
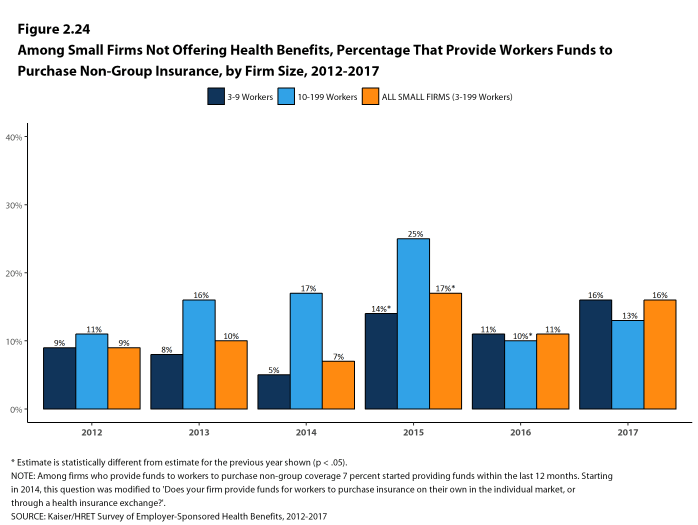
Figure 2.24: Among Small Firms Not Offering Health Benefits, Percentage That Provide Workers Funds to Purchase Non-Group Insurance, by Firm Size, 2012-2017
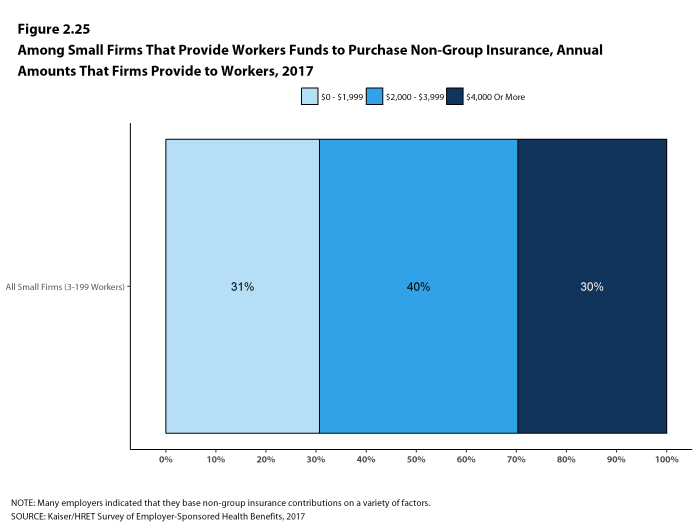
Figure 2.25: Among Small Firms That Provide Workers Funds to Purchase Non-Group Insurance, Annual Amounts That Firms Provide to Workers, 2017
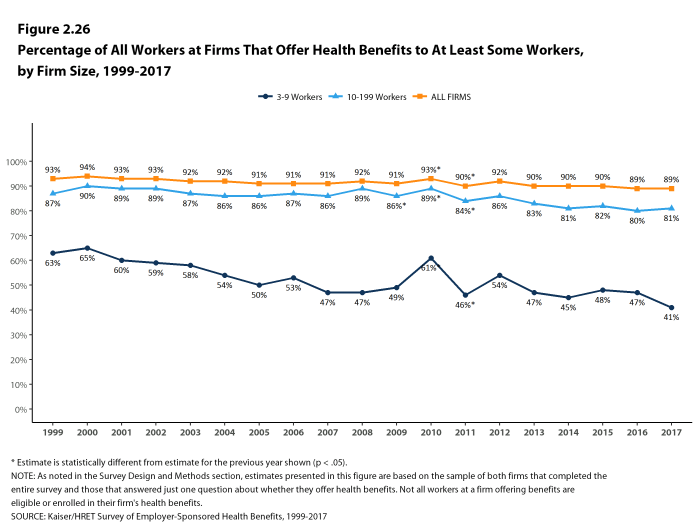
Figure 2.26: Percentage of All Workers at Firms That Offer Health Benefits to at Least Some Workers, by Firm Size, 1999-2017
- Kaiser Family Foundation. Diminishing offer and coverage rates among private sector employees [Internet]. Menlo Park, (CA): KFF; 2016 Sep [cited 2017 Jul 13]. Available from: http://www.kff.org/private-insurance/issue-brief/diminishing-offer-and-coverage-rates-among-private-sector-employees/↩
- Because surveys only collect information from a portion of the total number of firms in the country, there is uncertainty in any estimate. Since there are so many small firms, sometimes even seemingly large differences are not statistically different. For more information on the Employer Health Benefits Survey’s weighting and design please see the Survey Design and Methods section.↩
- Internal Revenue Code. 26 U.S. Code § 4980H – Shared responsibility for employers regarding health coverage. 2011. https://www.gpo.gov/fdsys/pkg/USCODE-2011-title26/pdf/USCODE-2011-title26-subtitleD-chap43-sec4980H.pdf↩
Section Three: Employee Coverage, Eligibility, And Participation
Employers are the principal source of health insurance in the United States, providing health benefits for about 151 million non-elderly people in America.16 Most workers are offered health coverage at work, and the majority of workers who are offered coverage take it. Workers may not be covered by their own employer for several reasons: their employer may not offer coverage, they may not be eligible for the benefits offered by their firm, they may elect to receive coverage through their spouse’s employer, or they may refuse coverage from their firm. Before eligible workers may enroll, about three-quarters (76%) of covered workers face a waiting period.
ELIGIBILITY
- Not all workers are eligible for the health benefits offered by their firm, and not all eligible workers “take up” (i.e., elect to participate in) the offer of coverage. The share of workers covered in a firm is a product of both the percentage of workers who are eligible for the firm’s health insurance and the percentage that choose to take up the benefit. The percentage of workers eligible for health benefits at offering firms in 2017 is similar to last year and the recent past for both small and large firms [Figure 3.1].
- Seventy-nine percent of workers in firms offering health benefits are eligible for the coverage offered by their employer. The percentage of eligible workers is higher in small firms with 3-24 workers (84%) than other firm sizes [Figure 3.2].
- Eligibility varies considerably by firm wage level. Workers in firms with a relatively large share of lower-wage workers (where at least 35% of workers earn $24,000 a year or less) are less likely to be eligible for health benefits than workers in firms with a smaller share of lower-wage workers (68% vs. 81%) [Figure 3.3].
- Workers in firms with a relatively large share of higher-wage workers (where at least 35% earn $60,000 or more annually) are more likely to be eligible for health benefits than workers in firms with a smaller share of higher-wage workers (88% vs. 73%) [Figure 3.3].
- Eligibility also varies by the age of the workforce. Those in firms with a relatively small share of younger workers (where fewer than 35% of the workers are age 26 or younger) are more likely to be eligible for health benefits than those in firms with a larger share younger workers (81% vs. 64%) [Figure 3.3].
- The average eligibility rate is particularly low in retail firms (54%) [Figure 3.2].
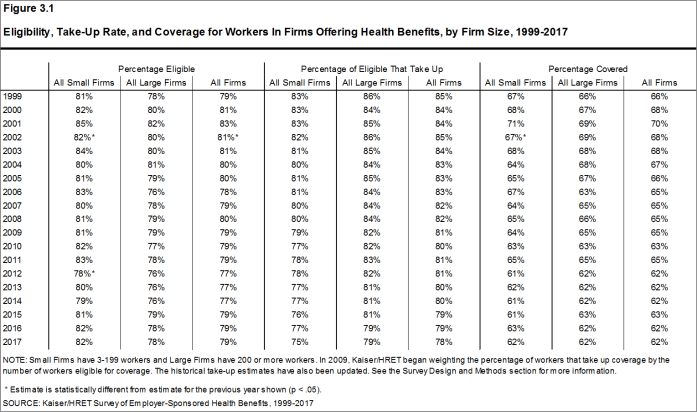
Figure 3.1: Eligibility, Take-Up Rate, and Coverage for Workers In Firms Offering Health Benefits, by Firm Size, 1999-2017
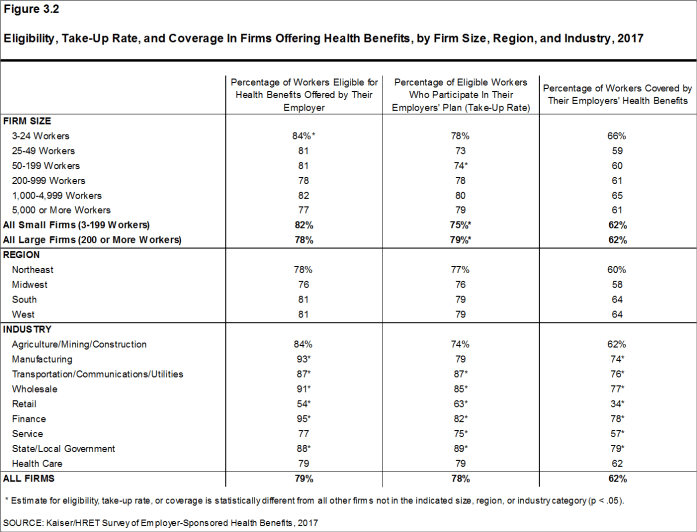
Figure 3.2: Eligibility, Take-Up Rate, and Coverage In Firms Offering Health Benefits, by Firm Size, Region, and Industry, 2017
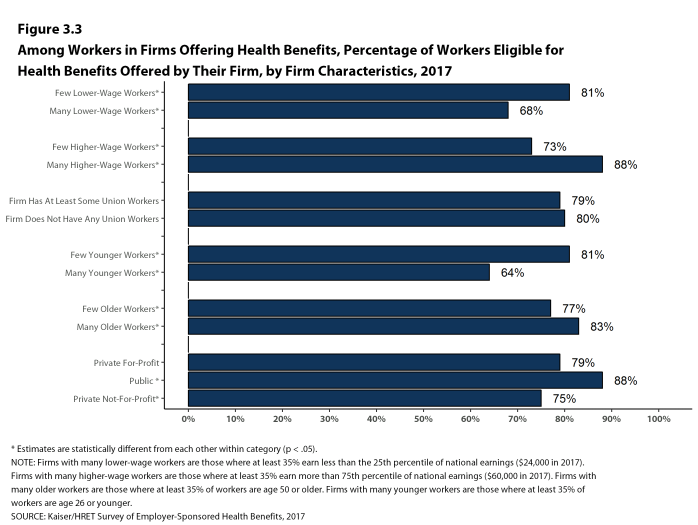
Figure 3.3: Among Workers In Firms Offering Health Benefits, Percentage of Workers Eligible for Health Benefits Offered by Their Firm, by Firm Characteristics, 2017
TAKE-UP RATE
- A large share of workers who are offered health benefits at work elect to enroll. In 2017, 78% of eligible workers take up coverage when it is offered to them, similar to last year [Figure 3.1].17 Eligible workers in large firms (200 or more workers) are more likely to take up coverage when offered than eligible workers in small firms (3-199 workers) (79% vs. 75%) [Figure 3.2].
- The likelihood of a worker accepting a firm’s offer of coverage varies by firm wage level. Eligible workers in firms with a relatively small share of lower-wage workers (where fewer than 35% of workers earn $24,000 a year or less) are more likely to take up coverage than eligible workers in firms with a larger share of lower-wage workers (79% vs. 65%) [Figure 3.4].
- Eligible workers in firms with a relatively large share of higher-wage workers (where at least 35% earn $60,000 or more annually) are more likely to take up coverage than those in firms with a smaller share of higher-wage workers (82% vs. 74%) [Figure 3.4].
- Eligible workers in firms with relatively large share of younger workers (where at least 35% of the workers are age 26 or younger) are less likely to take up coverage than those in firms with a smaller share of younger workers (70% vs. 79%) [Figure 3.4].
- The percentage of eligible workers taking up benefits in offering firms also varies by industry, with a lower average take-up rate at retail firms (63%) and a higher average take-up rate at state and local governments (89%) [Figure 3.2].
- The share of eligible workers taking up benefits in offering firms (78%) has decreased over time, from 81% in 2012 and 82% in 2007.
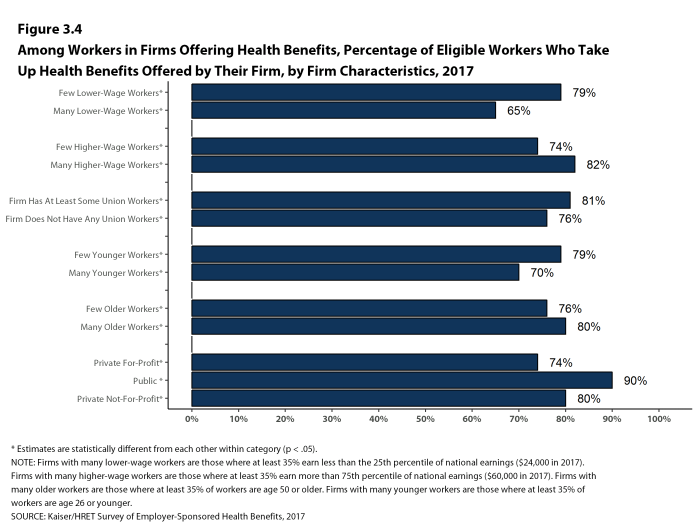
Figure 3.4: Among Workers In Firms Offering Health Benefits, Percentage of Eligible Workers Who Take Up Health Benefits Offered by Their Firm, by Firm Characteristics, 2017
COVERAGE
- The percentage of workers at firms offering health benefits that are covered by their firm’s health plan in 2017 is 62%, the same percentage as last year [Figure 3.1].
- The coverage rate at firms offering health benefits is the same for small firms and large firms in 2017. These rates are similar to the rates last year for both small firms and large firms [Figure 3.1].
- There is significant variation by industry in the coverage rate among workers in firms offering health benefits. The average coverage rate is particularly low in retail (34%) and service (57%) industries [Figure 3.2].
- Among workers in firms offering health benefits, those in firms with a relatively large share of lower-wage workers (where at least 35% of workers earn $24,000 a year or less) are less likely to be covered by their own firm than workers in firms with a smaller share of lower-wage workers (44% vs. 64%). A comparable pattern exists in firms with a relatively large share of higher-wage workers (where at least 35% earn $60,000 or more annually), with workers in these firms being more likely to be covered by their employer’s health benefits than those in firms with a smaller share of higher-wage workers (72% vs. 54%) [Figure 3.5].
- Among workers in firms offering health benefits, those in firms with a relatively small share of younger workers (where fewer than 35% of the workers are age 26 or younger) are more likely to be covered by their own firm than those in firms with a larger share of younger workers (64% vs. 45%) [Figure 3.5].
- Among workers in all firms, including those that offer and those that do not offer health benefits, 55% of workers are covered by health benefits offered by their employer, the same percentage as last year. The coverage rate in 2017 is lower than the coverage rate in 2007 (59%).
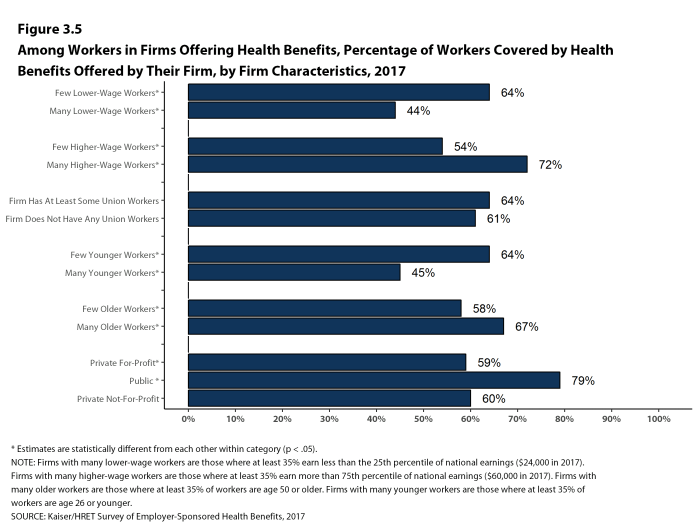
Figure 3.5: Among Workers In Firms Offering Health Benefits, Percentage of Workers Covered by Health Benefits Offered by Their Firm, by Firm Characteristics, 2017
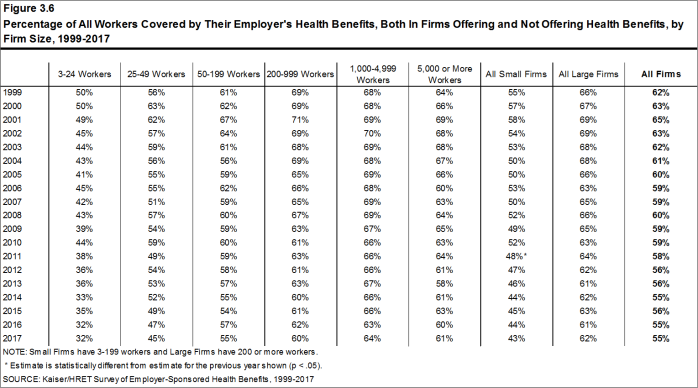
Figure 3.6: Percentage of All Workers Covered by Their Employer’s Health Benefits, Both In Firms Offering and Not Offering Health Benefits, by Firm Size, 1999-2017
WAITING PERIODS
- Waiting periods are a specified length of time after beginning employment before workers are eligible to enroll in health benefits. With some exceptions, the Affordable Care Act requires that waiting periods cannot exceed 90 days.18 For example, employers are permitted to have orientation periods before the waiting period begins which, in effect, means a worker is not eligible for coverage 3 months after hire. If a worker is eligible to enroll on the 1st of the month after three months of employment, this survey rounds up and considers the firm’s waiting period four months. For these reasons, some employers still have waiting periods exceeding the 90-day maximum.
- Seventy-six percent of covered workers face a waiting period before coverage is available, similar to last year [Figure 3.9]. Covered workers in small firms are more likely than those in large firms to have a waiting period (84% vs. 73%) [Figure 3.7].
- The average waiting period among covered workers who face a waiting period is 1.9 months [Figure 3.7]. A small percentage (2%) of covered workers with a waiting period have a waiting period of more than 3 months.
- Respondents with waiting periods greater than 4 months generally indicated that employees had training or orientation periods, or measurement periods in which they were employees but were not eligible for health benefits. Some employers have measurement periods to determine whether variable hour employees will meet the requirements for the firm’s health benefits.19
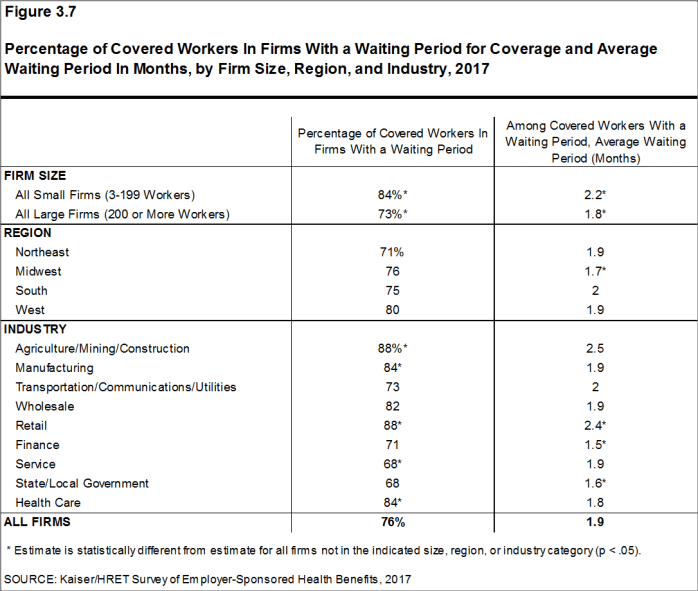
Figure 3.7: Percentage of Covered Workers In Firms With a Waiting Period for Coverage and Average Waiting Period In Months, by Firm Size, Region, and Industry, 2017
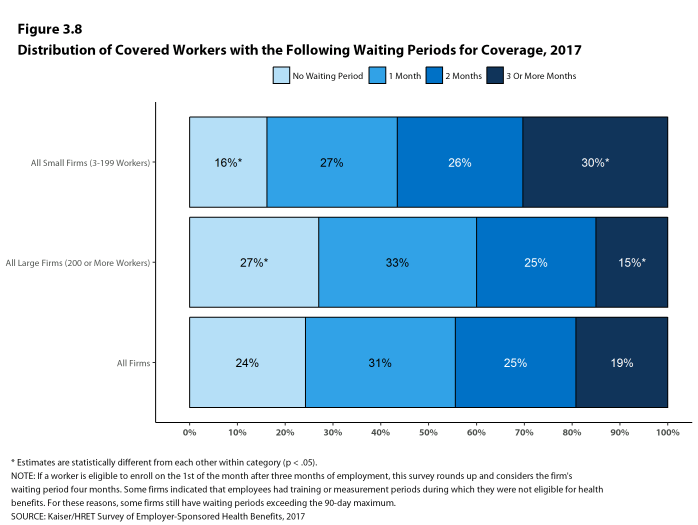
Figure 3.8: Distribution of Covered Workers With the Following Waiting Periods for Coverage, 2017
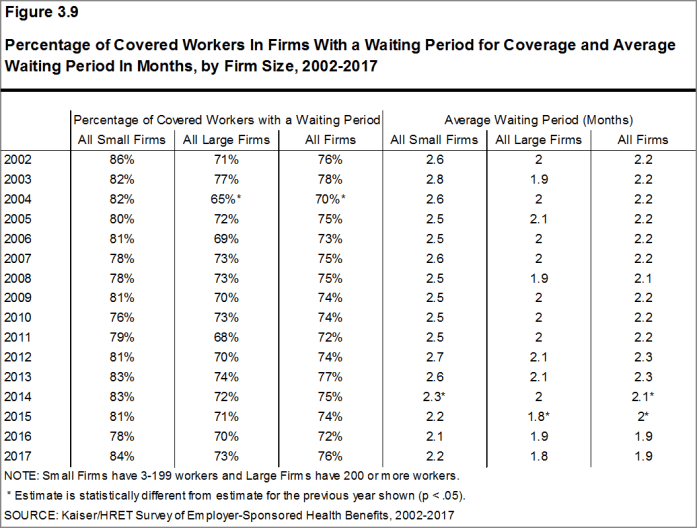
Figure 3.9: Percentage of Covered Workers In Firms With a Waiting Period for Coverage and Average Waiting Period In Months, by Firm Size, 2002-2017
AUTO ENROLLMENT
- Thirty-one percent of firms offering health benefits, including 35% of firms with 3 to 49 workers and 18% of firms with 5,000 or more workers, automatically enroll eligible workers in health benefits after any applicable waiting period [Figure 3.10].
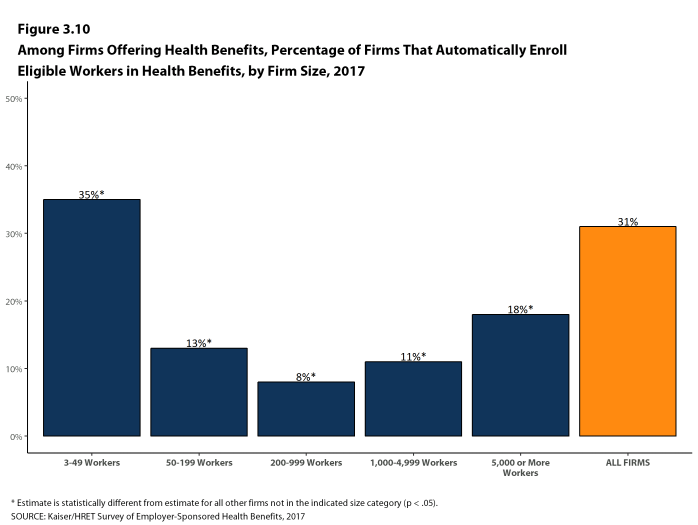
Figure 3.10: Among Firms Offering Health Benefits, Percentage of Firms That Automatically Enroll Eligible Workers In Health Benefits, by Firm Size, 2017
- Kaiser Commission on Medicaid and the Uninsured. The uninsured: A primer—Key facts about health insurance and the uninsured in the wake of national health reform [Internet]. Washington (DC): The Commission; 2016 Nov [cited 2016 Aug 1]. http://www.kff.org/uninsured/report/the-uninsured-a-primer-key-facts-about-health-insurance-and-the-uninsured-in-the-wake-of-national-health-reform/. See supplemental tables – Table 1: 270.2 million non-elderly people, 55.5% of whom are covered by ESI.↩
- In 2009, Kaiser/HRET began weighting the percentage of workers that take up coverage by the number of workers eligible for coverage. The historical take up estimates have also been updated. See the Survey Design and Methods section for more information.↩
- Variable hour employees may have a measurement period of up to 12 months before it is determined if they are eligible for benefits. Employers may require a cumulative service requirement of up to 1,200 hours before an employee may enroll. Federal Register. Vol. 79, No. 36. Feb 12, 2014. https://www.gpo.gov/fdsys/pkg/FR-2014-02-24/pdf/2014-03809.pdf↩
- Under the ACA, employers may determine whether or not an employee is a full-time employee by looking back at the number of hours an employee has worked during a defined period. See https://www.irs.gov/affordable-care-act/employers/identifying-full-time-employees↩
Section Four: Types Of Plans Offered
Most firms that offer health benefits offer only one type of health plan (81%). Large firms (200 or more workers) are more likely to offer more than one type of health plan than small firms (3-199 workers). Firms are most likely to offer their workers a PPO plan and are least likely to offer a conventional plan (sometimes known as indemnity insurance).
- Eighty-one percent of firms offering health benefits in 2017 offer only one type of health plan. Large firms are more likely to offer more than one plan type than small firms (55% vs. 17%) [Figure 4.1].
- The percentage of covered workers at firms that offer multiple plan types can also be analyzed. Fifty-eight percent of covered workers are employed in a firm that offers more than one health plan type. Seventy percent of covered workers in large firms are employed by a firm that offers more than one plan type, compared to 30% in small firms [Figure 4.2].
- About three-quarters (73%) of covered workers in firms offering health benefits work in firms that offer one or more PPO plans; 57% work in firms that offer one or more HDHP/SO plans; 33% work in firms that offer one or more HMO plans; 15% work in firms that offer one or more POS plans; and 1% work in firms that offer one or more conventional plans [Figure 4.4].20
- Among covered workers in firms offering only one type of health plan, those in large firms are more likely to be offered an HDHP/SO (36%) than those in small firms (23%). Covered workers in small firms offering only one type of plan are more likely to be offered a POS plan than covered workers in large firms (19% vs. 2%) [Figure 4.5].
- Among covered workers in firms offering only one type of health plan, 30% are in firms that only offer an HDHP/SO and 52% are in firms that only offer a PPO [Figure 4.5].
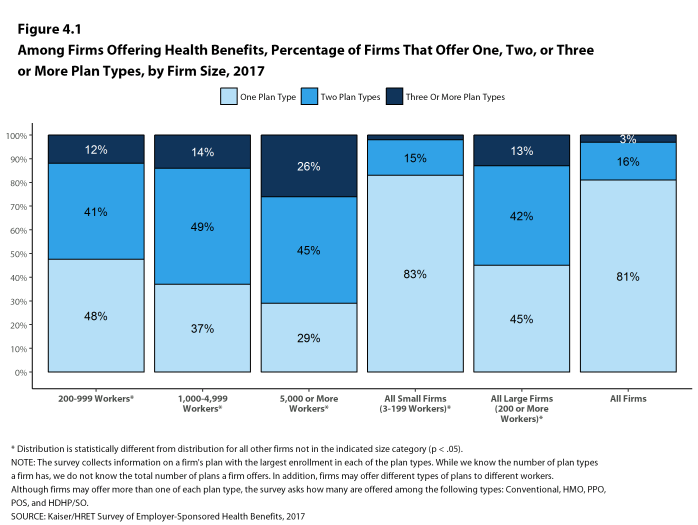
Figure 4.1: Among Firms Offering Health Benefits, Percentage of Firms That Offer One, Two, or Three or More Plan Types, by Firm Size, 2017
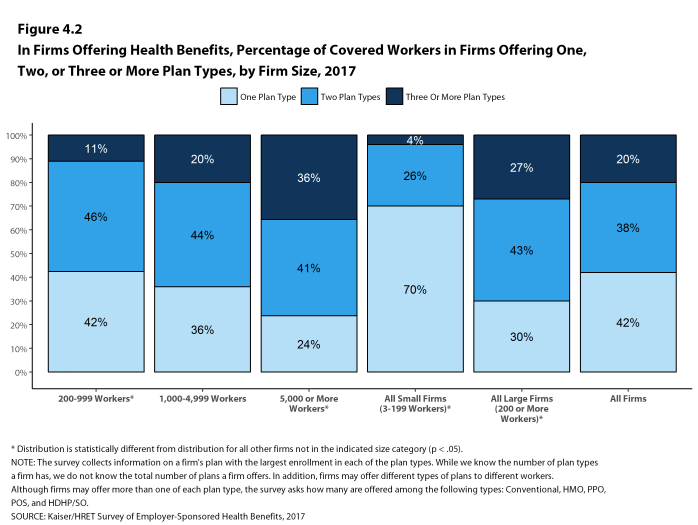
Figure 4.2: In Firms Offering Health Benefits, Percentage of Covered Workers In Firms Offering One, Two, or Three or More Plan Types, by Firm Size, 2017
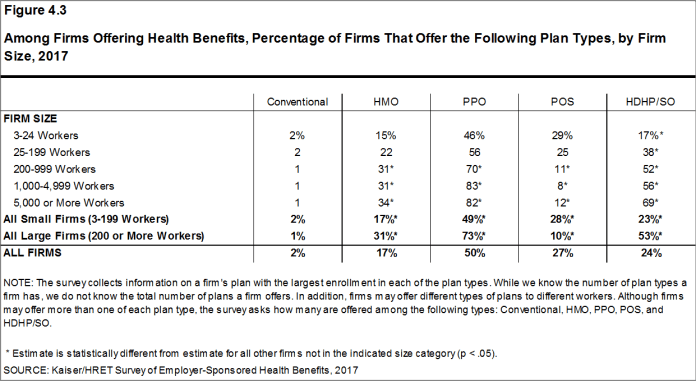
Figure 4.3: Among Firms Offering Health Benefits, Percentage of Firms That Offer the Following Plan Types, by Firm Size, 2017
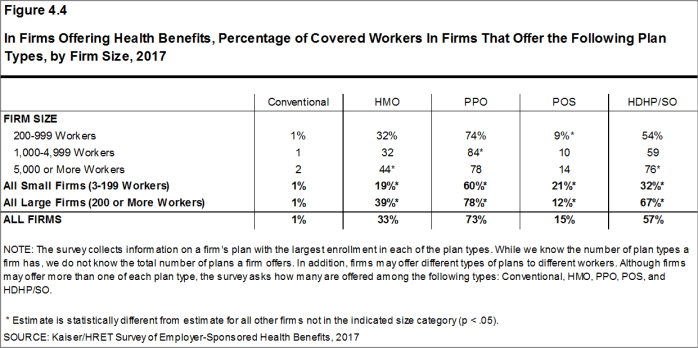
Figure 4.4: In Firms Offering Health Benefits, Percentage of Covered Workers In Firms That Offer the Following Plan Types, by Firm Size, 2017
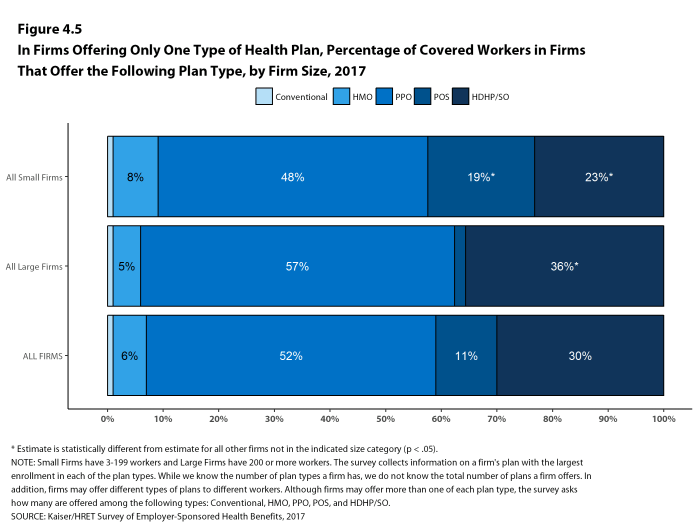
Figure 4.5: In Firms Offering Only One Type of Health Plan, Percentage of Covered Workers In Firms That Offer the Following Plan Type, by Firm Size, 2017
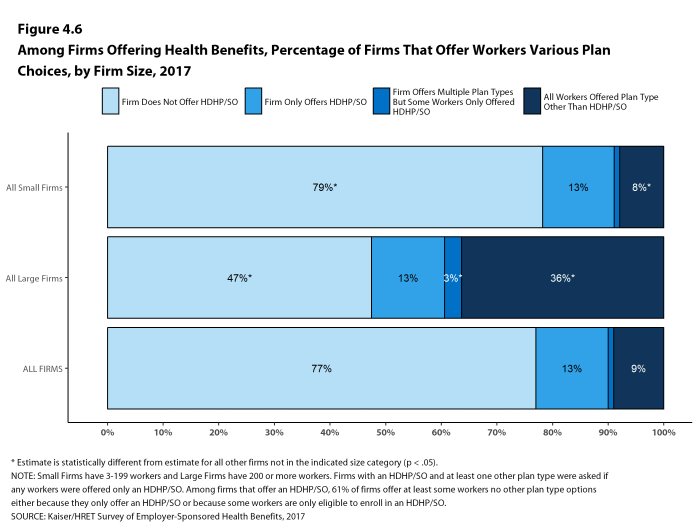
Figure 4.6: Among Firms Offering Health Benefits, Percentage of Firms That Offer Workers Various Plan Choices, by Firm Size, 2017
The survey collects information on a firm’s plan with the largest enrollment in each of the plan types. While we know the number of plan types a firm has, we do not know the total number of plans a firm offers workers. In addition, firms may offer different types of plans to different workers. For example, some workers might be offered one type of plan at one location, while workers at another location are offered a different type of plan.
- Starting in 2010, we included firms that said they offer a plan type even if there are no covered workers enrolled in that plan type.↩
Section Five: Market Shares Of Health Plans
The largest share of covered workers is enrolled in PPOs, covering 48% of covered workers, followed by HDHP/SOs, HMOs, POS plans, and conventional plans. Enrollment distribution varies by firm size: HDHP/SOs have a relatively higher share of enrollment among large firms (200 or more workers) than small firms (3-199 workers) (30% vs. 23%), and POS plans are relatively more popular among small firms than large firms (18% vs. 6%).
- Forty-eight percent of covered workers are enrolled in PPOs, followed by HDHP/SOs (28%), HMOs (14%), POS plans (10%), and conventional plans (<1%) [Figure 5.1].
- The percentage of covered workers enrolled in HDHP/SOs is similar to last year.
- A larger share of covered workers are enrolled in HDHP/SOs than in HMOs in both small firms and large firms.
- Plan enrollment patterns vary by firm size.
- Covered workers in large firms are more likely than covered workers in small firms to enroll in HDHP/SOs (30% vs. 23%). Covered workers in small firms are more likely than covered workers in large firms to enroll in POS plans (18% vs. 6%) [Figure 5.2].
- Plan enrollment patterns also differ across regions.
- HMO enrollment is significantly higher in the West (29%) and significantly lower in the South (10%) and Midwest (8%) [Figure 5.3].
- Covered workers in the South (54%) are more likely to be enrolled in PPOs than workers in other regions, while covered workers in the West (39%) are less likely to be enrolled in a PPO [Figure 5.3].
- Covered workers in the Midwest (36%) are more likely to be enrolled in HDHP/SOs than workers in other regions, while covered workers in the South (23%) are less likely to be enrolled in HDHP/SOs [Figure 5.3].
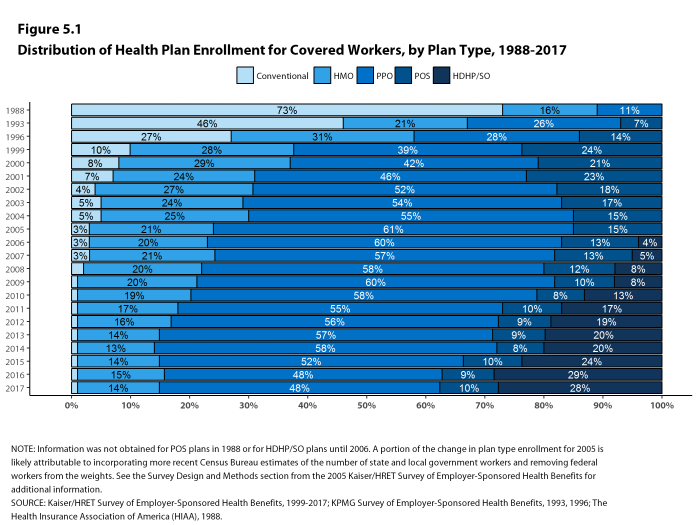
Figure 5.1: Distribution of Health Plan Enrollment for Covered Workers, by Plan Type, 1988-2017
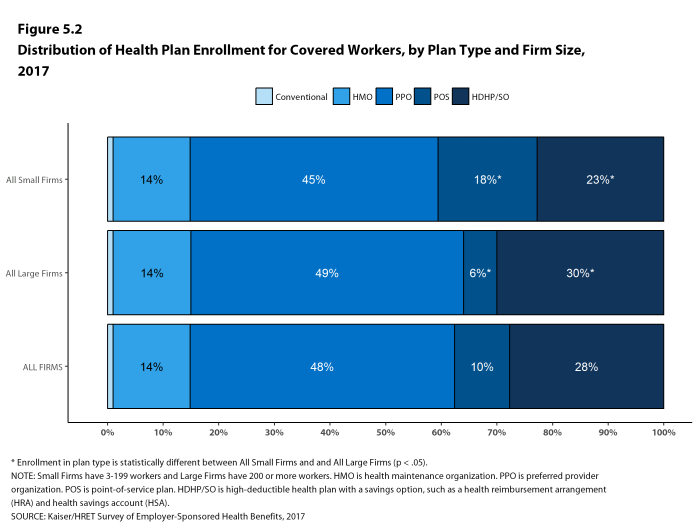
Figure 5.2: Distribution of Health Plan Enrollment for Covered Workers, by Plan Type and Firm Size, 2017
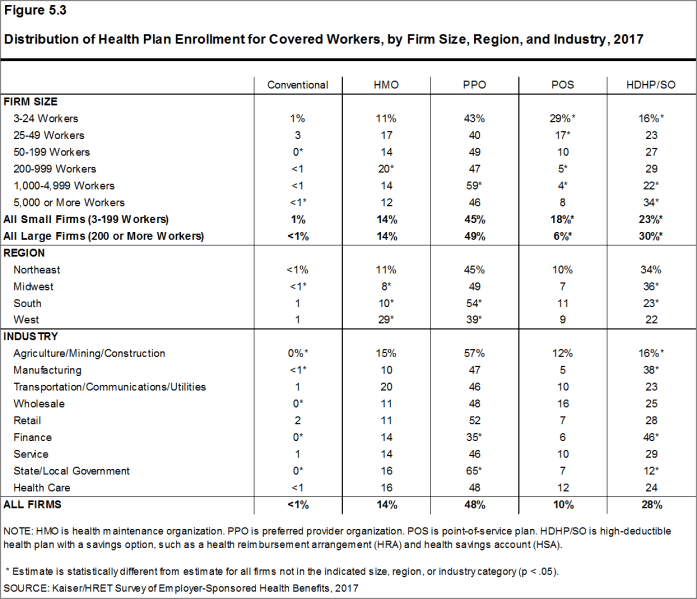
Figure 5.3: Distribution of Health Plan Enrollment for Covered Workers, by Firm Size, Region, and Industry, 2017
Section Six: Worker And Employer Contributions For Premiums
In 2017, premium contributions by covered workers average 18% for single coverage and 31% for family coverage.21 The average monthly worker contributions are $101 for single coverage ($1,213 annually) and $476 for family coverage ($5,714 annually).22 Covered workers in small firms (3-199 workers) have a lower average contribution amount for single coverage ($1,030 vs. $1,289), but a higher average contribution amount for family coverage ($6,814 vs. $5,264) than covered workers in large firms (200 or more workers).
- In 2017, covered workers on average contribute 18% of the premium for single coverage and 31% of the premium for family coverage [Figure 6.1]. The average contribution percentage for single coverage has remained stable in recent years. The average contribution percentage for family coverage is higher in 2017 than in 2012 (31% vs. 28%).
- Covered workers in small firms on average contribute a lower percentage of the premium for single coverage (16% vs. 19%) and a higher percentage of the premium for family coverage (39% vs. 28%) than covered workers in large firms [Figure 6.24].
- Workers with single coverage have an average contribution of $101 per month ($1,213 annually), and workers with family coverage have an average contribution of $476 per month ($5,714 annually) toward their health insurance premiums [Figures 6.2, 6.3, and 6.4].
- The average worker contributions in HDHP/SOs are lower than the overall average worker contribution for single coverage ($1,020 vs. $1,213) and family coverage ($4,599 vs. $5,714) [Figure 6.5].
- Worker contributions also differ by firm size. As in previous years, workers in small firms on average contribute a lower amount annually for single coverage than workers in large firms ($1,030 vs. $1,289). In contrast, workers in small firms on average contribute significantly more annually for family coverage than workers in large firms ($6,814 vs. $5,264) [Figure 6.6].
- The average worker contributions for single and family coverage in small firms and for single coverage in large firms are similar to last year. The average worker contribution for family coverage in large firms increased from $4,719 to $5,264 [Figures 6.8 and 6.9].
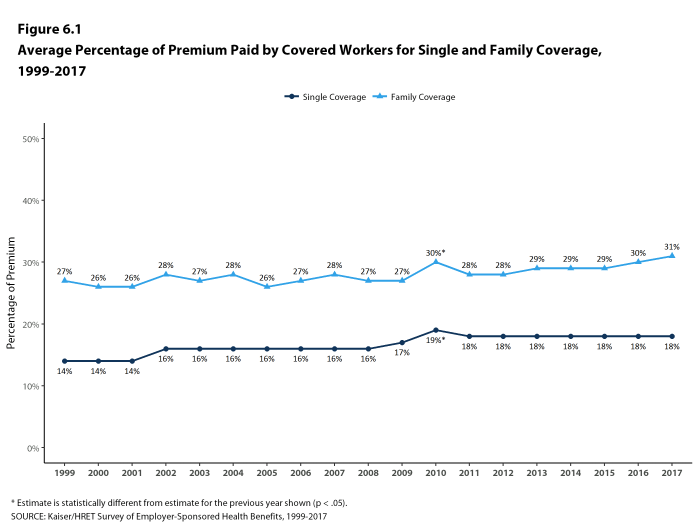
Figure 6.1: Average Percentage of Premium Paid by Covered Workers for Single and Family Coverage, 1999-2017
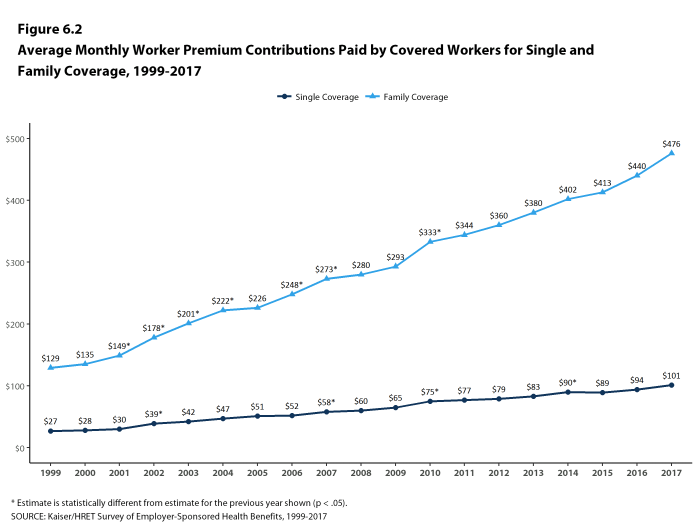
Figure 6.2: Average Monthly Worker Premium Contributions Paid by Covered Workers for Single and Family Coverage, 1999-2017
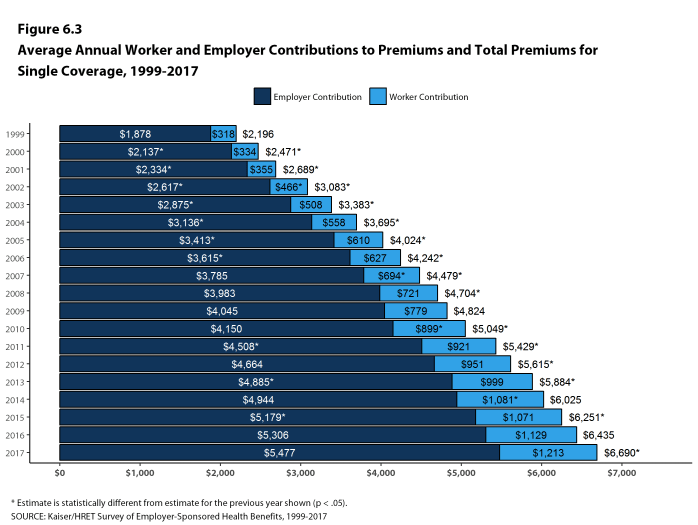
Figure 6.3: Average Annual Worker and Employer Contributions to Premiums and Total Premiums for Single Coverage, 1999-2017
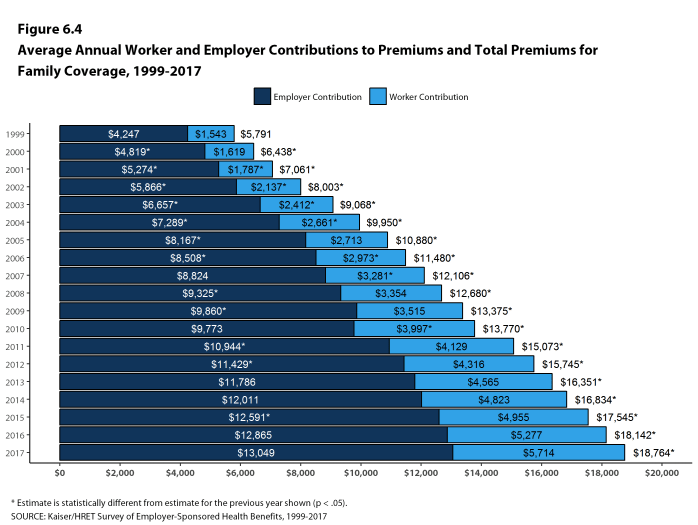
Figure 6.4: Average Annual Worker and Employer Contributions to Premiums and Total Premiums for Family Coverage, 1999-2017
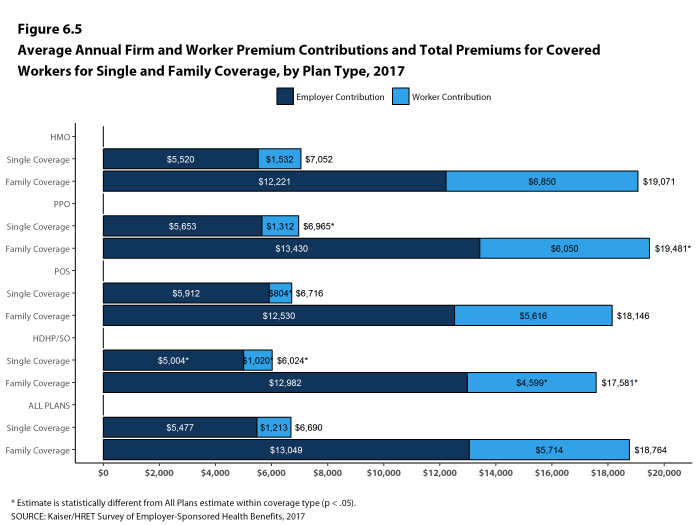
Figure 6.5: Average Annual Firm and Worker Premium Contributions and Total Premiums for Covered Workers for Single and Family Coverage, by Plan Type, 2017
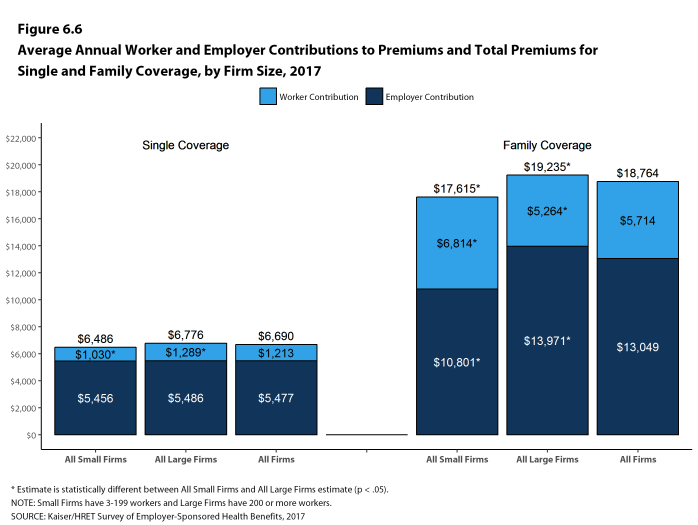
Figure 6.6: Average Annual Worker and Employer Contributions to Premiums and Total Premiums for Single and Family Coverage, by Firm Size, 2017
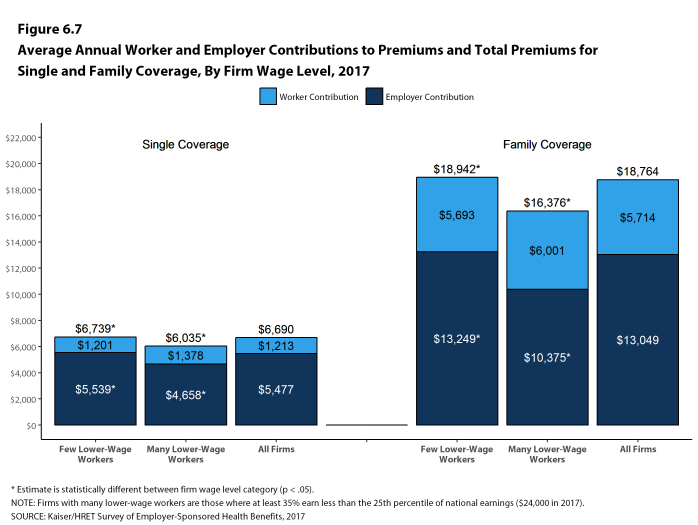
Figure 6.7: Average Annual Worker and Employer Contributions to Premiums and Total Premiums for Single and Family Coverage, by Firm Wage Level, 2017
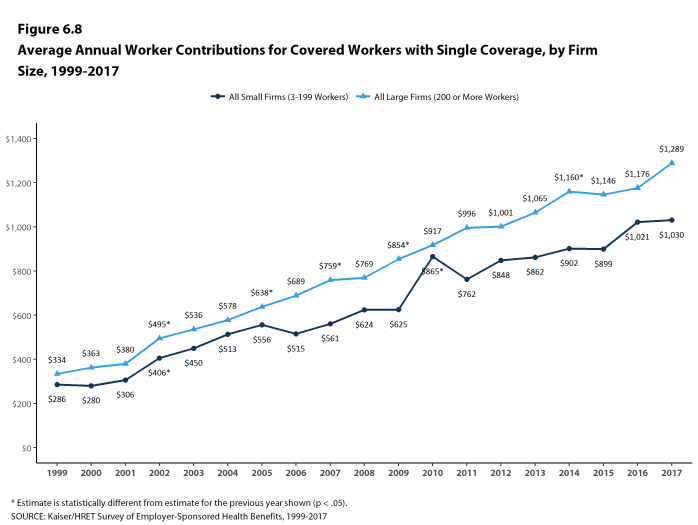
Figure 6.8: Average Annual Worker Contributions for Covered Workers With Single Coverage, by Firm Size, 1999-2017
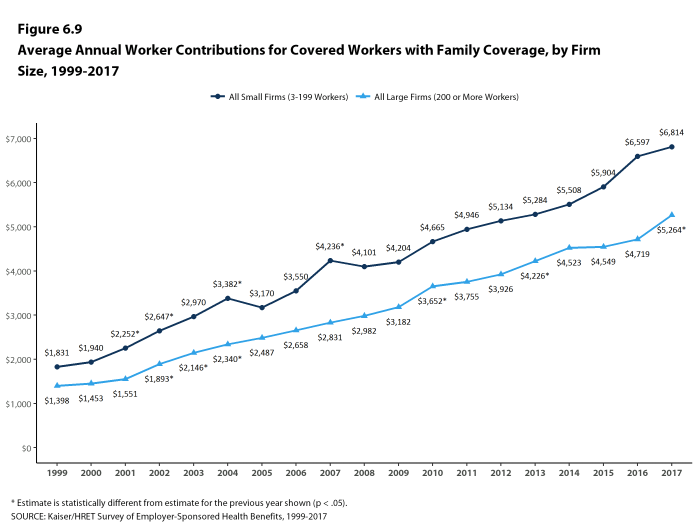
Figure 6.9: Average Annual Worker Contributions for Covered Workers With Family Coverage, by Firm Size, 1999-2017
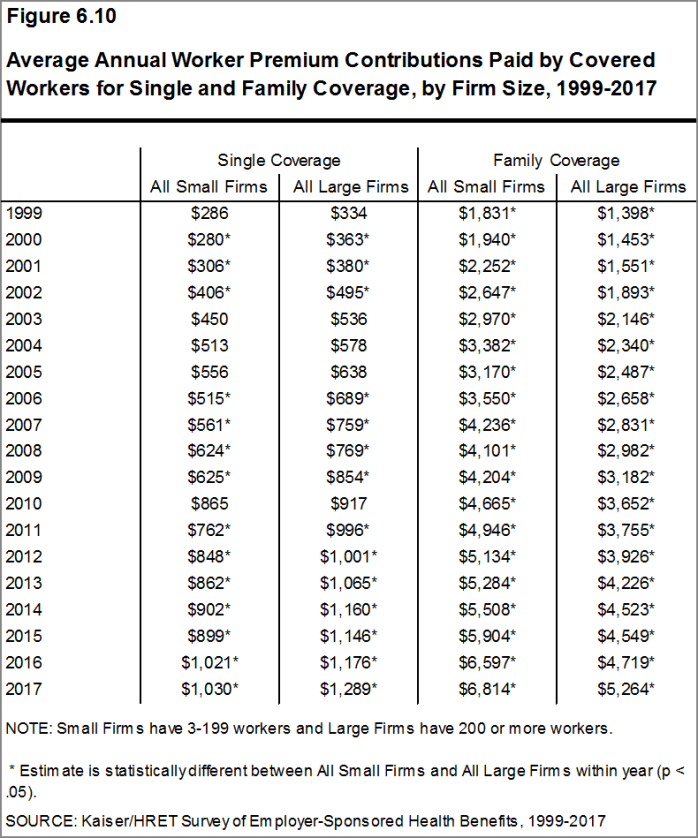
Figure 6.10: Average Annual Worker Premium Contributions Paid by Covered Workers for Single and Family Coverage, by Firm Size, 1999-2017
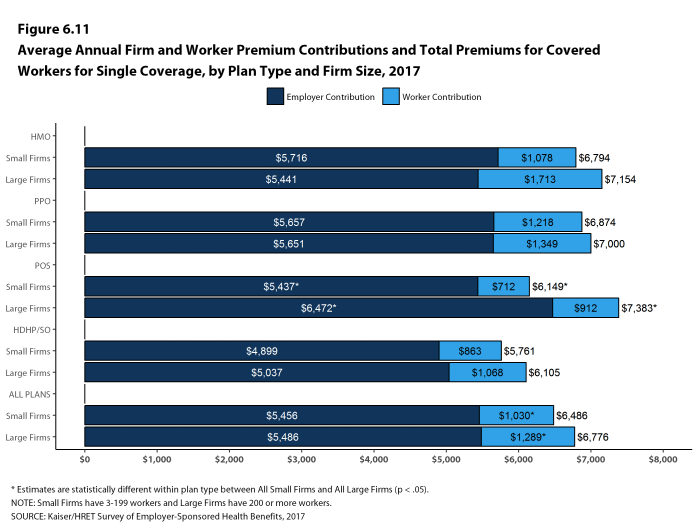
Figure 6.11: Average Annual Firm and Worker Premium Contributions and Total Premiums for Covered Workers for Single Coverage, by Plan Type and Firm Size, 2017
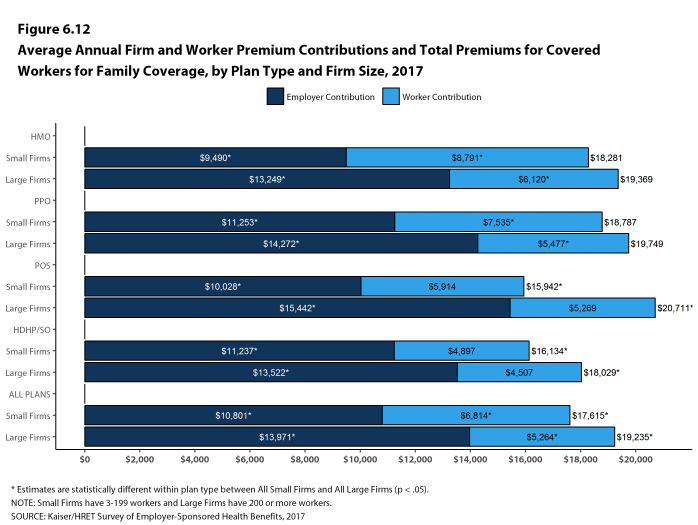
Figure 6.12: Average Annual Firm and Worker Premium Contributions and Total Premiums for Covered Workers for Family Coverage, by Plan Type and Firm Size, 2017
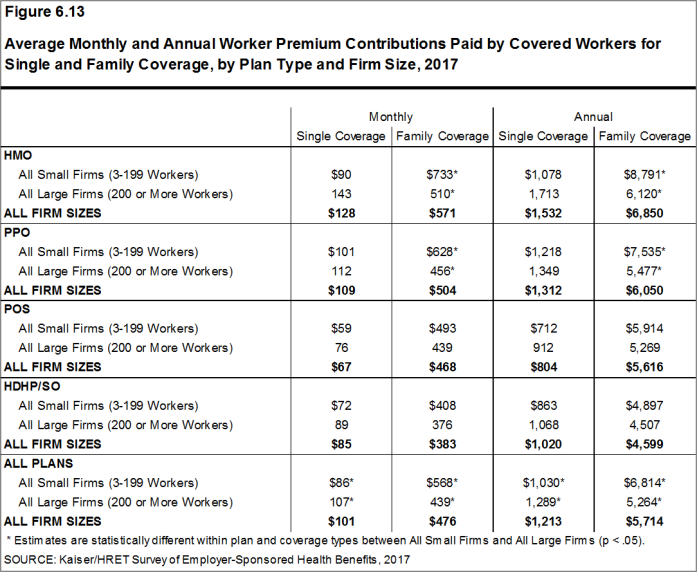
Figure 6.13: Average Monthly and Annual Worker Premium Contributions Paid by Covered Workers for Single and Family Coverage, by Plan Type and Firm Size, 2017
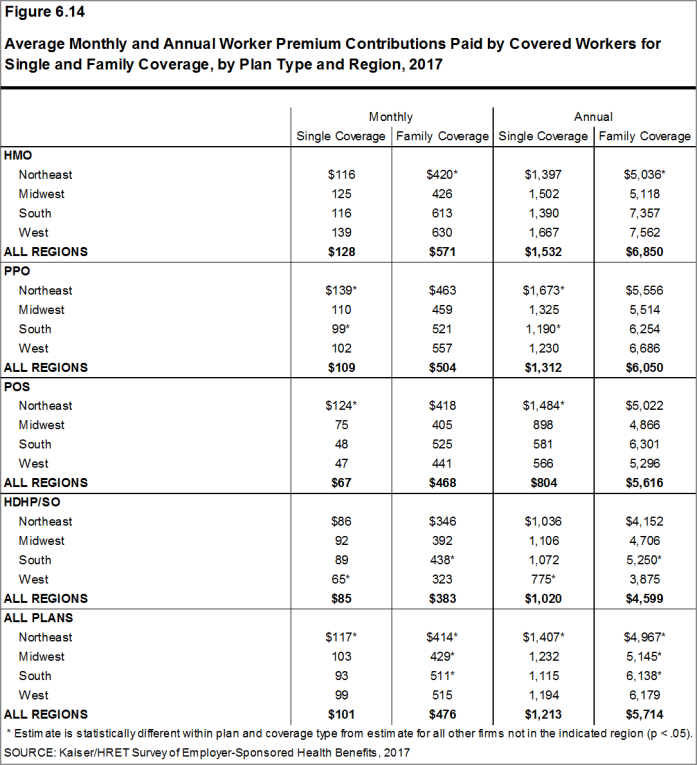
Figure 6.14: Average Monthly and Annual Worker Premium Contributions Paid by Covered Workers for Single and Family Coverage, by Plan Type and Region, 2017
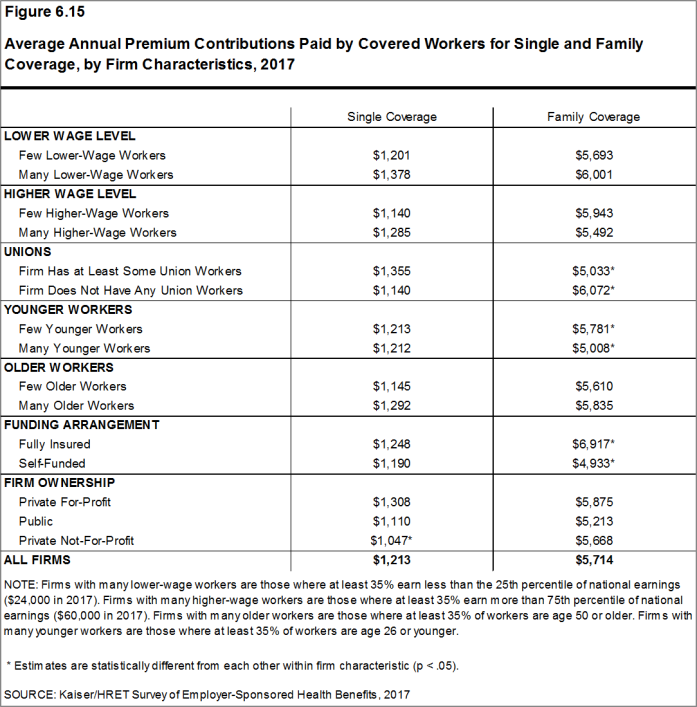
Figure 6.15: Average Annual Premium Contributions Paid by Covered Workers for Single and Family Coverage, by Firm Characteristics, 2017
VARIATION IN WORKER CONTRIBUTIONS TO THE PREMIUM
- About four-fifths of covered workers are in a plan where the employer contributes at least half of the premium for both single and family coverage.
- Fourteen percent of covered workers are in a plan where the employer pays the entire premium for single coverage; 3% of covered workers are in a plan where the employer pays the entire premium for family coverage [Figure 6.18].
- Covered workers in small firms are much more likely than covered workers in large firms to be in a plan where the employer pays 100% of the premium. Thirty-three percent of covered workers in small firms have an employer that pays the full premium for single coverage, compared to 6% of covered workers in large firms [Figure 6.17]. For family coverage, 10% of covered workers in small firms have an employer that pays the full premium, compared to 1% of covered workers in large firms [Figure 6.16].
- Sixteen percent of covered workers are in a plan where enrollees have a contribution of more than 50% of the premium for family coverage [Figure 6.18].
- Thirty-six percent of covered workers in small firms work in a firm where the enrollee contribution for family coverage is more than 50% of the premium, compared to 8% of covered workers in large firms [Figure 6.18].
- For single coverage, 3% of covered workers in small firms and 2% of covered workers in large firms are in a plan where the enrollee contribution is more than 50% of the premium. The difference between the estimates for small and large firms is not statistically significant [Figure 6.18].
- There is substantial variation among workers in small firms and workers in large firms in the dollar amounts they contribute for single and family coverage. For example, among covered workers in small firms, 10% have no contribution for family coverage, while 19% have a contribution of more than $12,000. Among covered workers in large firms, 1% have no contribution for family coverage, while 4% have a contribution of more than $12,000 [Figure 6.16].
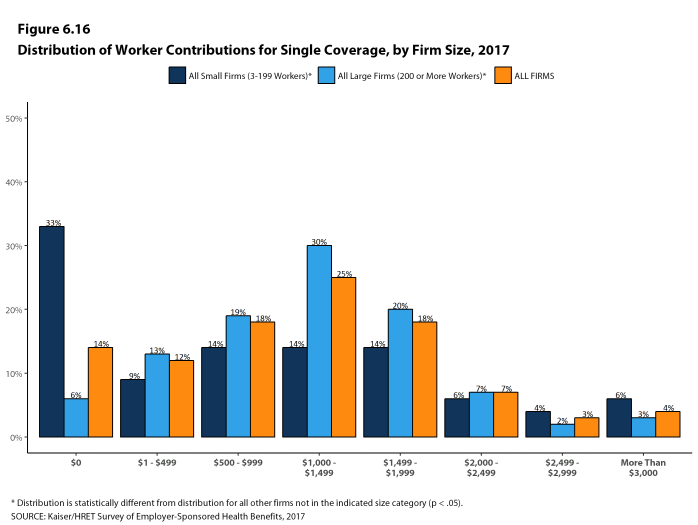
Figure 6.16: Distribution of Worker Contributions for Single Coverage, by Firm Size, 2017
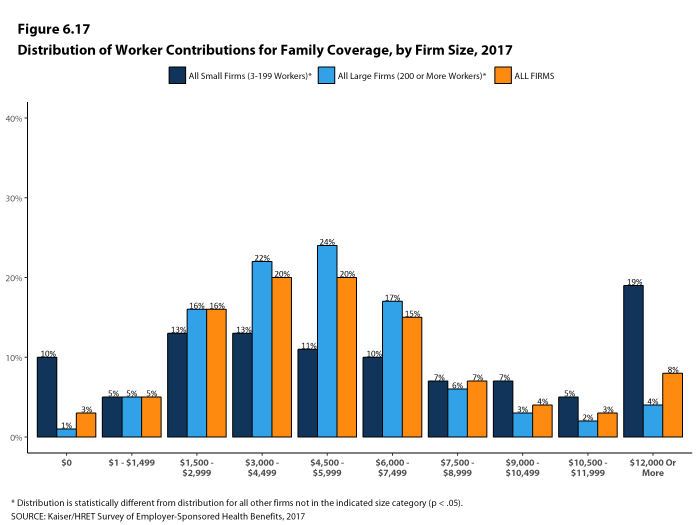
Figure 6.17: Distribution of Worker Contributions for Family Coverage, by Firm Size, 2017
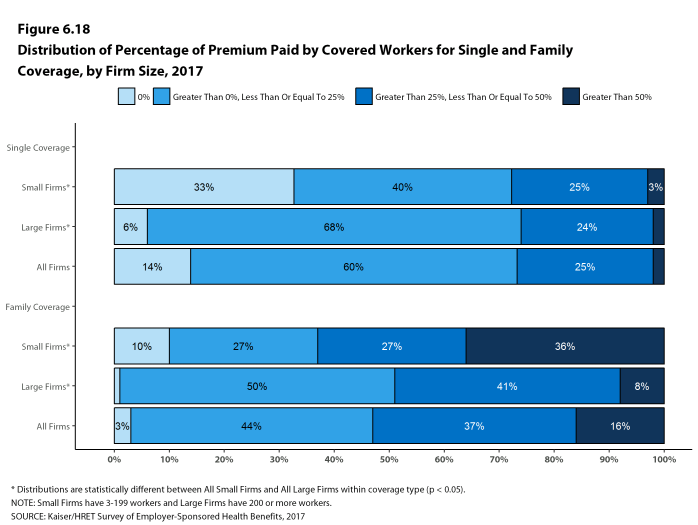
Figure 6.18: Distribution of Percentage of Premium Paid by Covered Workers for Single and Family Coverage, by Firm Size, 2017
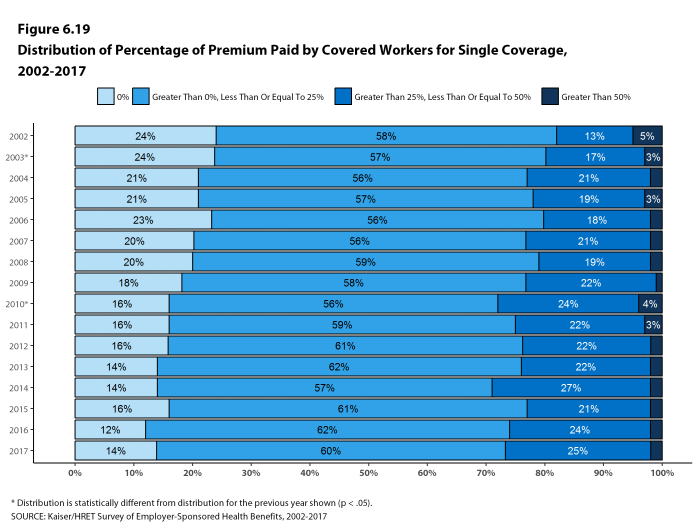
Figure 6.19: Distribution of Percentage of Premium Paid by Covered Workers for Single Coverage, 2002-2017
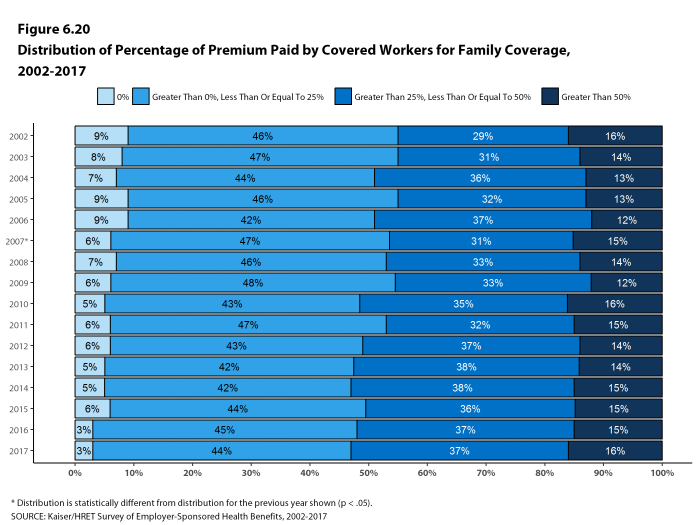
Figure 6.20: Distribution of Percentage of Premium Paid by Covered Workers for Family Coverage, 2002-2017
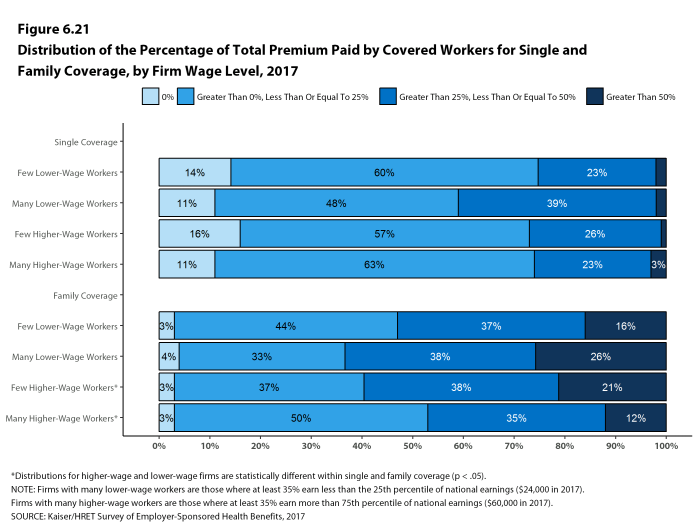
Figure 6.21: Distribution of the Percentage of Total Premium Paid by Covered Workers for Single and Family Coverage, by Firm Wage Level, 2017
DIFFERENCES BY FIRM CHARACTERISTICS
- The percentage of the premium paid by covered workers also varies by firm characteristics.
- Covered workers in firms with a relatively large share of lower-wage workers (where at least 35% of workers earn $24,000 a year or less) on average have higher contribution rates for single coverage (23% vs. 18%) and family coverage (37% vs. 31%) than those in firms with a smaller share of lower-wage workers [Figures 6.22 and 6.23].
- Covered workers in firms with a relatively large share of higher-wage workers (where at least 35% earn $60,000 or more annually) on average have lower contribution rates for family coverage than those in firms with a smaller share of higher-wage workers (29% vs. 34%) [Figure 6.23].
- Covered workers in large firms that have at least some union workers on average have lower contribution rates for family coverage than those in firms without any union workers (25% vs. 30%) [Figures 6.23].
- Covered workers in large firms that are partially or completely self-funded on average have lower contribution rates for family coverage than workers in large firms that are fully insured (26% vs. 35%) [Figure 6.23].23
- Covered workers in private for-profit firms on average have higher contribution rates for both single coverage (21%) and family coverage (33%) than workers in public organizations and private not-for-profit firms [Figures 6.22 and 6.23].
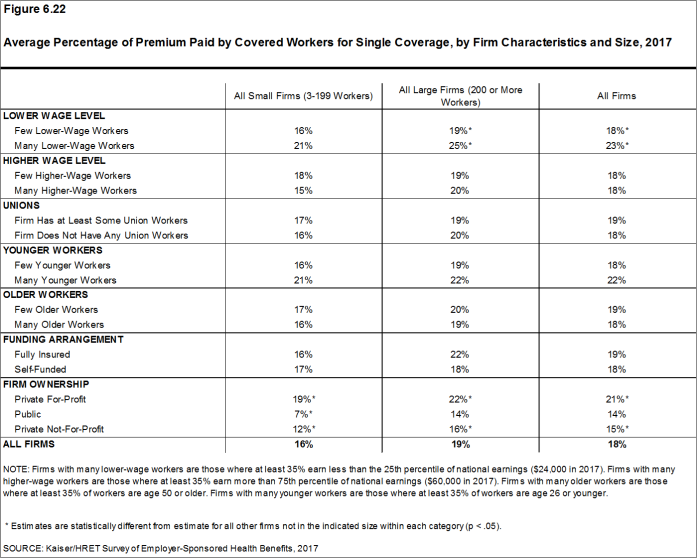
Figure 6.22: Average Percentage of Premium Paid by Covered Workers for Single Coverage, by Firm Characteristics and Size, 2017
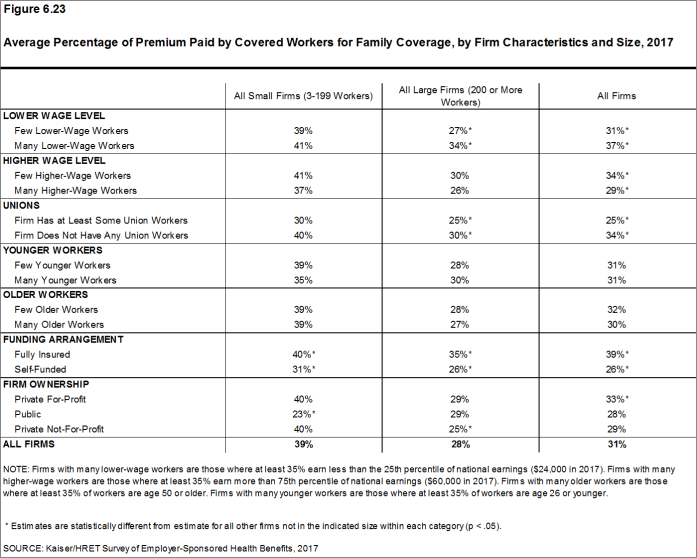
Figure 6.23: Average Percentage of Premium Paid by Covered Workers for Family Coverage, by Firm Characteristics and Size, 2017
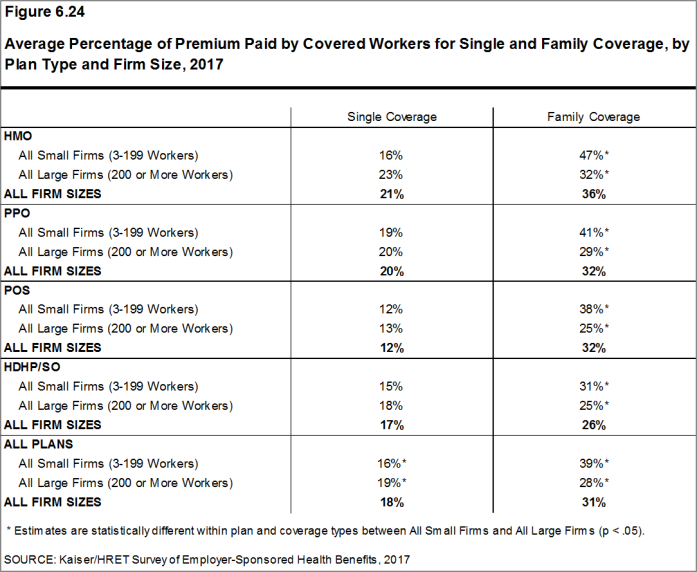
Figure 6.24: Average Percentage of Premium Paid by Covered Workers for Single and Family Coverage, by Plan Type and Firm Size, 2017
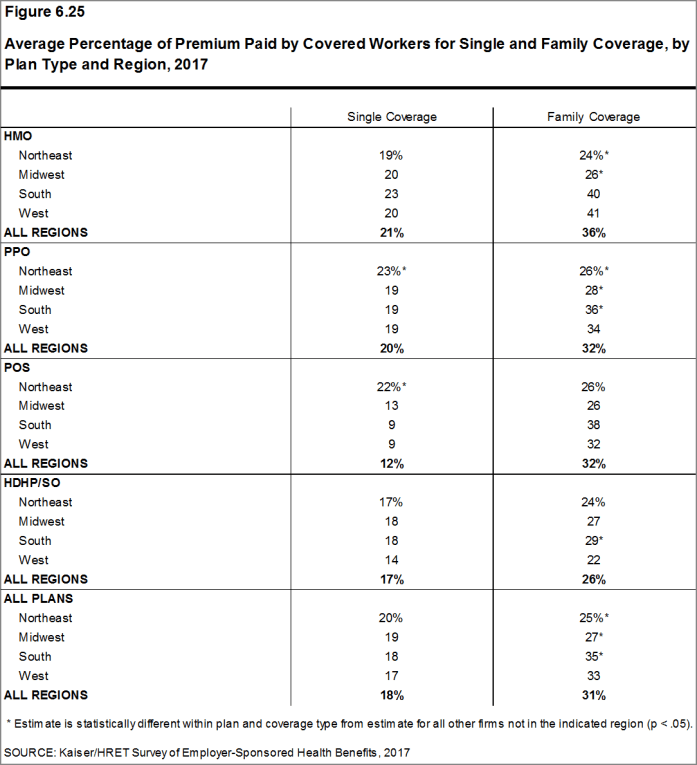
Figure 6.25: Average Percentage of Premium Paid by Covered Workers for Single and Family Coverage, by Plan Type and Region, 2017
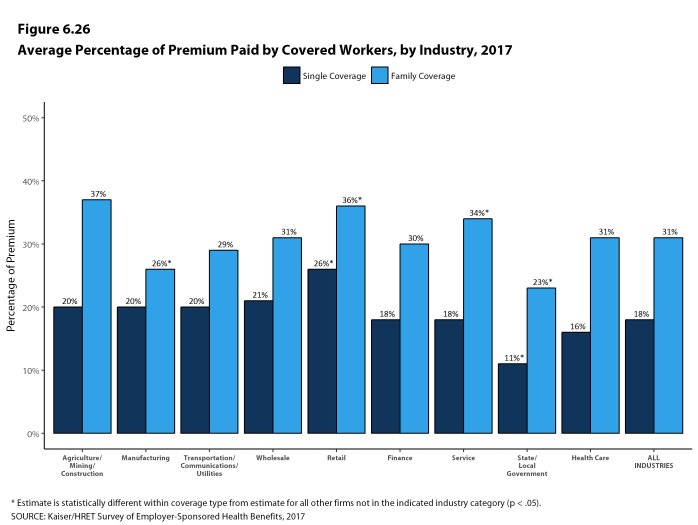
Figure 6.26: Average Percentage of Premium Paid by Covered Workers, by Industry, 2017
CONTRIBUTION APPROACHES
- Firms take different approaches for contributing toward family coverage. Among firms offering health benefits, 45% of small firms and 15% of large firms contribute the same dollar amount for single coverage as for family coverage, which means that the worker must pay the entire difference between the cost of single and family coverage if they wish to enroll their family members. Forty-five percent of small firms and 75% of large firms make a larger dollar contribution for family coverage than for single coverage [Figure 6.27].

Figure 6.27: Among Firms Offering Family Coverage, Percentage Using Various Approaches to Family Premium Contributions, by Firm Size, 2017
CHANGES OVER TIME
- The average worker contributions for single and family coverage have increased 75% and 74%, respectively, over the last 10 years, and 28% and 32%, respectively, over the last five years.
- Over the last five years, the average worker contribution for family coverage has increased faster than the average employer contribution for family coverage (32% vs. 14% ) and the last ten years (74% vs. 48% ).
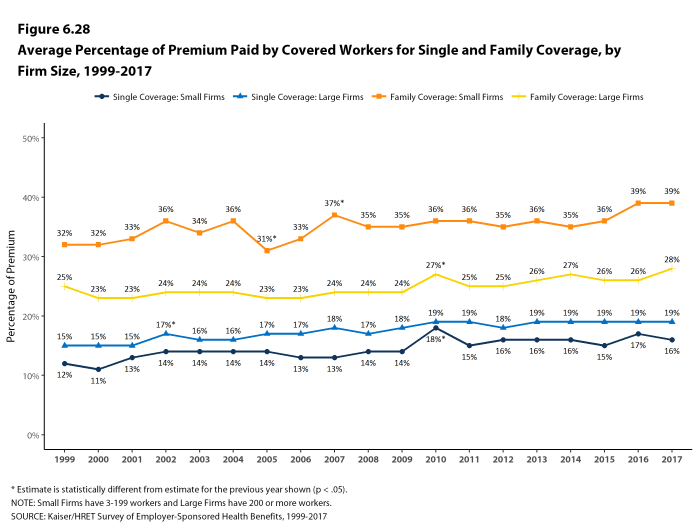
Figure 6.28: Average Percentage of Premium Paid by Covered Workers for Single and Family Coverage, by Firm Size, 1999-2017
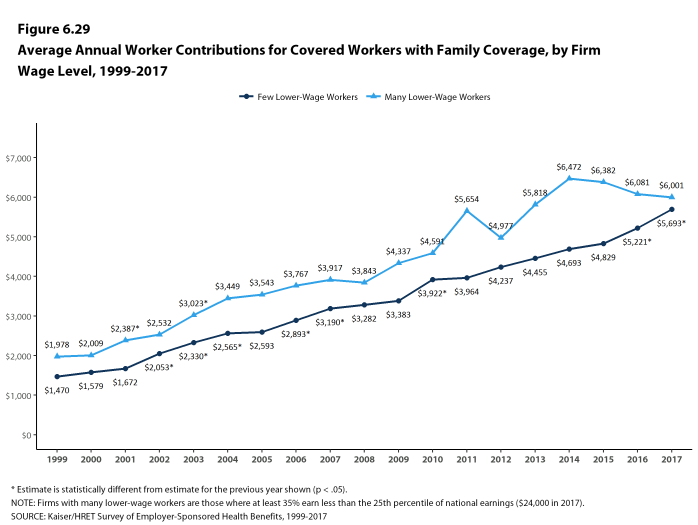
Figure 6.29: Average Annual Worker Contributions for Covered Workers With Family Coverage, by Firm Wage Level, 1999-2017
- Estimates for premiums, worker contributions to premiums, and employer contributions to premiums presented in Section 6 do not include contributions made by the employer to Health Savings Accounts (HSAs) or Health Reimbursement Arrangements (HRAs). See Section 8 for estimates of employer contributions to HSAs and HRAs.↩
- The average percent contribution is calculated as a weighted average of all a firm’s plan types and may not necessarily equal the average worker contribution divided by the average premium.↩
- For definitions of Self-Funded and Fully-Insured plans, see the introduction to Section 10.↩
Section Seven: Employee Cost Sharing
In addition to any required premium contributions, most covered workers face cost sharing for the medical services they use. Cost sharing for medical services can take a variety of forms, including deductibles (an amount that must be paid before most services are covered by the plan), copayments (fixed dollar amounts), and coinsurance (a percentage of the charge for services). The type and level of cost sharing often vary by the type of plan in which the worker is enrolled. Cost sharing may also vary by the type of service, such as office visits, hospitalizations, or prescription drugs.
The cost-sharing amounts reported here are for covered workers using services provided in-network by participating providers. Plan enrollees receiving services from providers that do not participate in plan networks often face higher cost sharing and may be responsible for charges that exceed plan allowable amounts. The framework of this survey does not allow us to capture all of the complex cost-sharing requirements in modern plans, particularly for ancillary services (such as durable medical equipment or physical therapy) or cost-sharing arrangements that vary across different settings (such as tiered networks). Therefore, we do not collect information on all plan provisions and limits that affect enrollee out-of-pocket liability.
GENERAL ANNUAL DEDUCTIBLES FOR WORKERS IN PLANS WITH DEDUCTIBLES
- A general annual deductible is an amount that must be paid by enrollees before most services are covered by their health plan. Non-grandfathered health plans are required to cover some services such as preventive care without cost sharing. Some plans require enrollees to meet a service-specific deductible, such as on prescription drugs or hospital admissions, in lieu of or in addition to a general annual deductible.
- Eighty-one percent of covered workers are enrolled in a plan with a general annual deductible for single coverage, similar to 83% in 2016, but an increase from 72% in 2012 [Figure 7.2].
- The percentage of covered workers enrolled in a plan with a general annual deductible for single coverage is similar for small firms (3-199 workers) and large firms (200 or more workers) (77% and 83%) [Figure 7.2].
- The likelihood of having a deductible varies by plan type [Figure 7.1]. Covered workers in HMOs are less likely to have a general annual deductible for single coverage than workers in other plan types. Sixty-two percent of workers in HMOs do not have a general annual deductible for single coverage, compared to 35% of workers in POS plans and 14% of workers in PPOs.
- For covered workers in a plan with a general annual deductible, the average annual deductible for single coverage is $1,505, similar to the average deductible ($1,478) last year [Figures 7.3 and 7.10].
- For covered workers in plans with a general annual deductible, the average deductibles for single coverage are $1,175 in HMOs, $1,046 in PPOs, $1,301 in POS plans, and $2,304 in HDHP/SOs [Figure 7.6].
- The average deductibles for single coverage are higher across plan types for covered workers in small firms than for covered workers in large firms. For covered workers in PPOs with a general annual deductible, for example, the average deductible amount for single coverage in small firms is much higher than the average deductible amount in large firms ($1,594 vs. $856) [Figure 7.6]. Overall, for covered workers in plans with a general annual deductible, the average deductible amount for single coverage in small firms is higher than the average deductible amount in large firms ($2,120 vs. $1,276) [Figure 7.3].
- Among covered workers in plans with a general annual deductible, the average deductible for workers in firms with a relatively large share of lower-wage workers (where at least 35% of workers earn $24,000 a year or less) is higher than the average deductible for covered workers in firms with a smaller share of lower-wage workers ($2,234 vs. $1,449) [Figure 7.4].
- The average general annual deductible for single coverage for covered workers in plans with a deductible has increased 37% over the last five years, from $1,097 in 2012 to $1,505 in 2017 [Figure 7.8].
- There is considerable variation in the dollar values of general annual deductibles for covered workers at different firms. For example, 20% of covered workers enrolled in a PPO plan with a general annual deductible for single coverage have a deductible of less than $500, while 13% have a deductible of $2,000 or more [Figure 7.19].
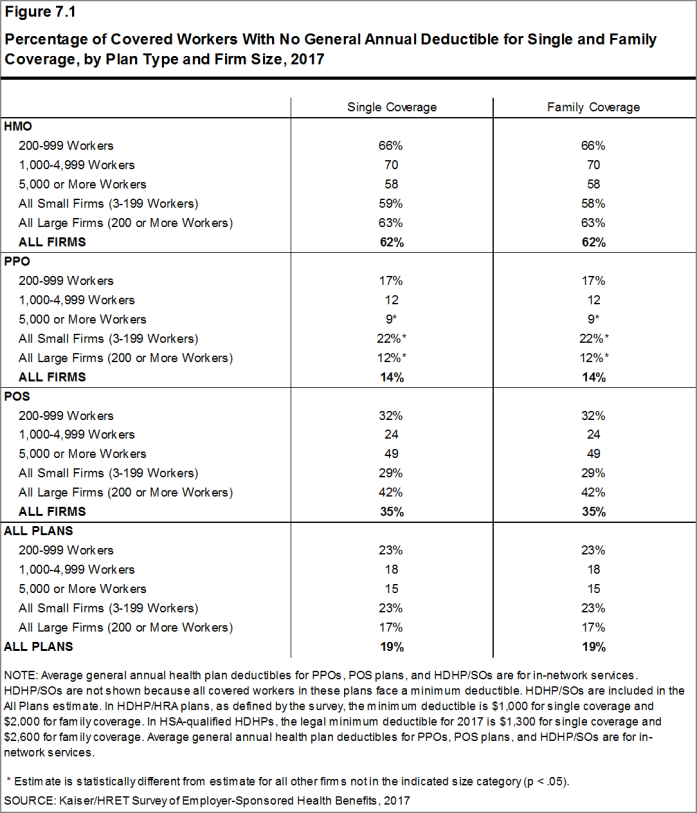
Figure 7.1: Percentage of Covered Workers With No General Annual Deductible for Single and Family Coverage, by Plan Type and Firm Size, 2017

Figure 7.2: Percentage of Covered Workers In a Plan That Includes a General Annual Deductible for Single Coverage, by Plan Type, 2006-2017
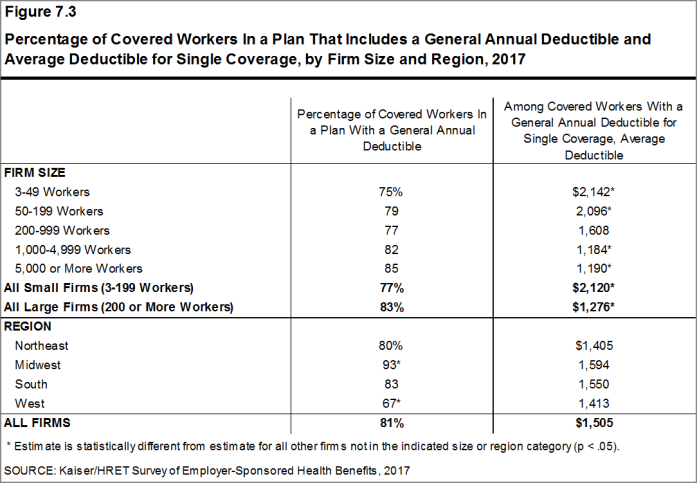
Figure 7.3: Percentage of Covered Workers In a Plan That Includes a General Annual Deductible and Average Deductible for Single Coverage, by Firm Size and Region, 2017
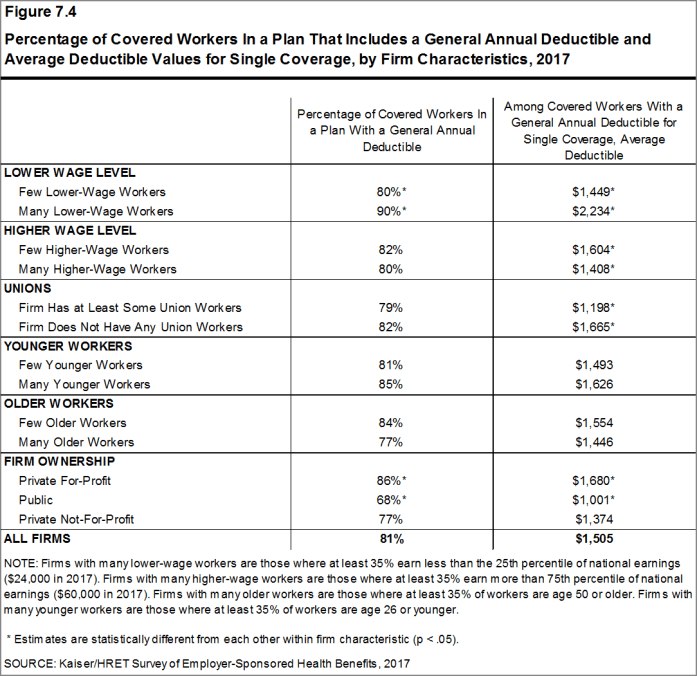
Figure 7.4: Percentage of Covered Workers In a Plan That Includes a General Annual Deductible and Average Deductible Values for Single Coverage, by Firm Characteristics, 2017
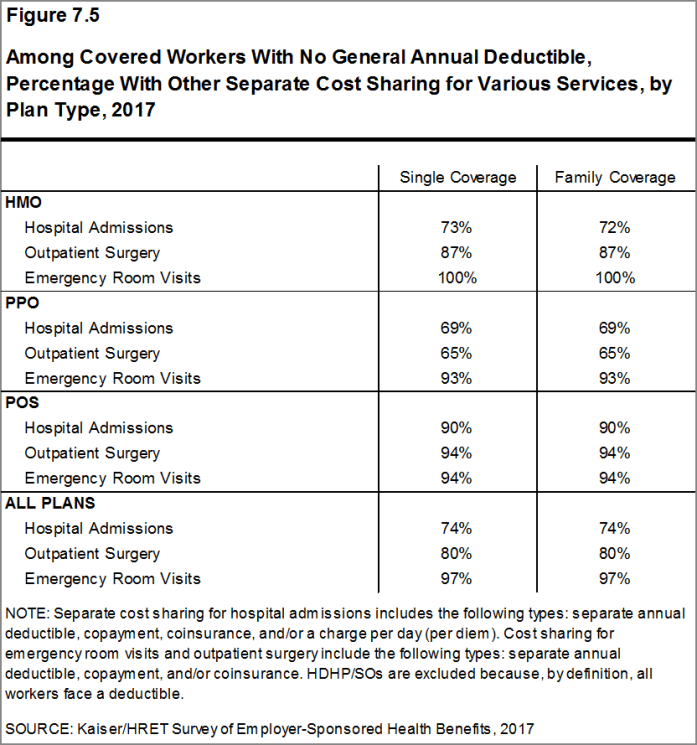
Figure 7.5: Among Covered Workers With No General Annual Deductible, Percentage With Other Separate Cost Sharing for Various Services, by Plan Type, 2017
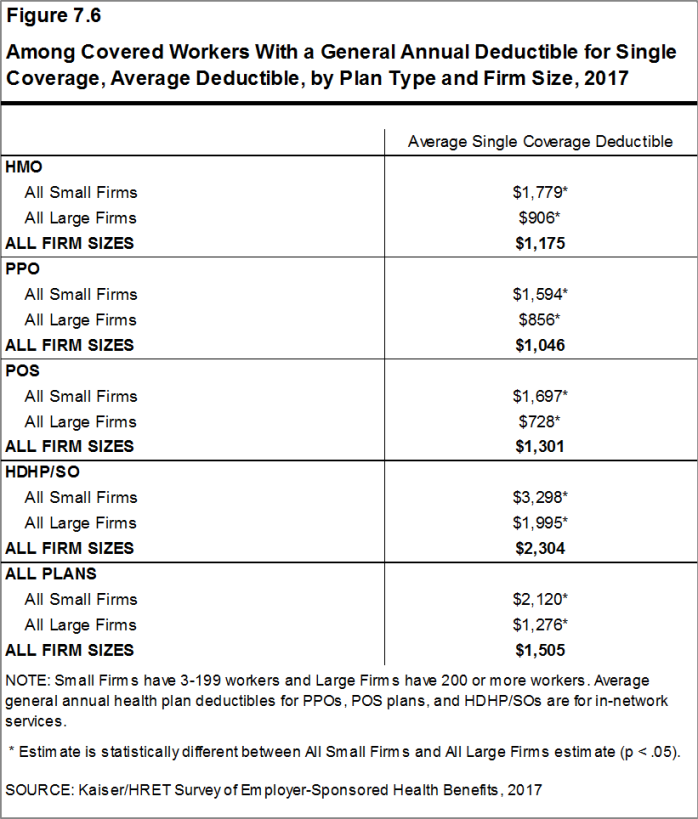
Figure 7.6: Among Covered Workers With a General Annual Deductible for Single Coverage, Average Deductible, by Plan Type and Firm Size, 2017
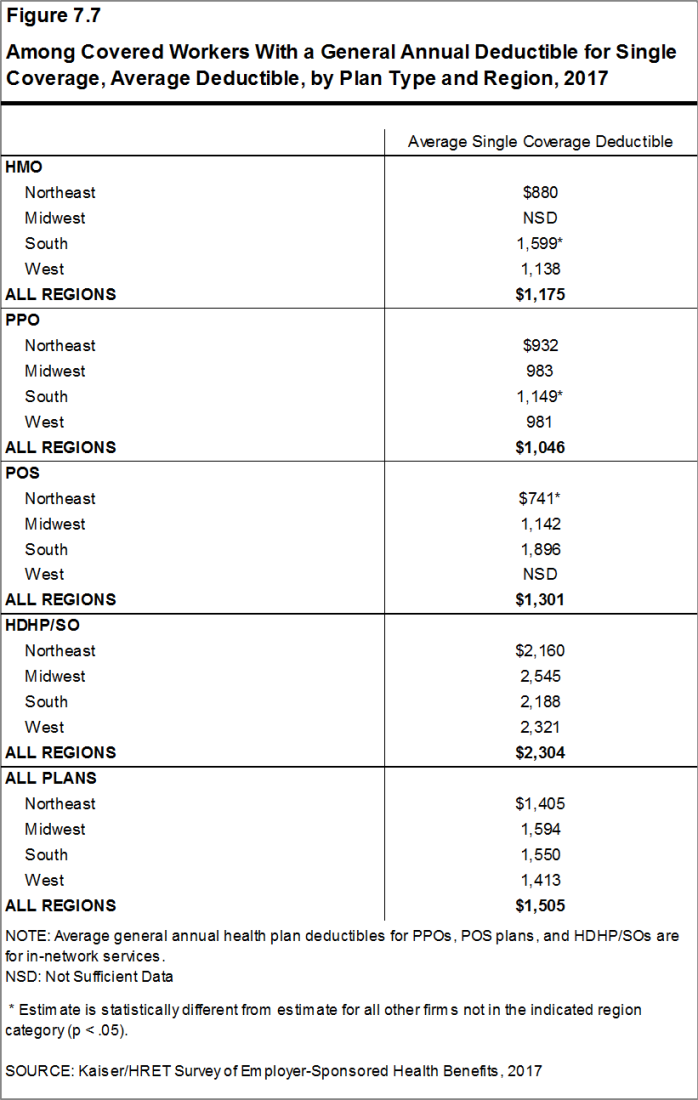
Figure 7.7: Among Covered Workers With a General Annual Deductible for Single Coverage, Average Deductible, by Plan Type and Region, 2017

Figure 7.8: Among Covered Workers With a General Annual Deductible, Average Single and Family Coverage Deductible, by Plan Type, 2006-2017
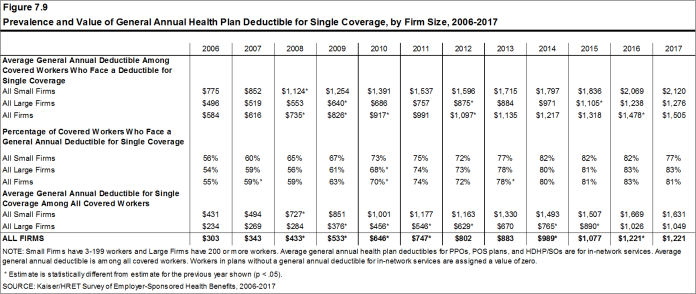
Figure 7.9: Prevalence and Value of General Annual Health Plan Deductible for Single Coverage, by Firm Size, 2006-2017
GENERAL ANNUAL DEDUCTIBLES AMONG ALL COVERED WORKERS
- As discussed above, the share of covered workers in plans with a general annual deductible has increased significantly over time: from 59% in 2007, to 72% in 2012, to 81% in 2017 [Figure 7.2], as have the average deductible amounts for covered workers in plans with deductibles: from $616 in 2007, to $1,097 in 2012, to $1,505 in 2017 [Figure 7.10]. Neither trend by itself captures the full impact of changes in deductibles on covered workers. We can look at the average impact of both trends together on covered workers by assigning a zero deductible value to covered workers in plans with no deductible and looking at how the resulting averages change over time. These average deductible amounts are lower in any given year but the changes over time reflect both the higher deductibles in plans with deductibles and the fact that more workers face them.
- Using this approach, the average general annual deductible for single coverage for all covered workers in 2017 is $1,221 [Figures 7.9 and 7.10].
- The 2017 value is 52% higher than the average general annual deductible of $802 in 2012 and 255% higher than the average general annual deductible of $343 in 2007 [Figures 7.9 and 7.10].
- Another way to look at deductibles is the percentage of all covered workers who are in a plan with a deductible that exceeds certain thresholds. Fifty-one percent of covered workers are in plans with a general annual deductible of $1,000 or more for single coverage, the same percentage as last year [Figure 7.12].
- Over the last five years, the percentage of covered workers with a general annual deductible of $1,000 or more for single coverage has grown substantially, increasing from 34% to 51% [Figure 7.12].
- Workers in small firms are more likely to have a general annual deductible of $1,000 or more for single coverage than workers in large firms (58% vs. 48%) [Figure 7.11].
- Twenty-two percent of covered workers are enrolled in a plan with a deductible of $2,000 or more, similar to the percentage last year (23%) [Figure 7.14]. Thirty-seven percent of covered workers in small firms have a general annual deductible of $2,000 or more, as compared to 15% in large firms [Figure 7.14].
- One of the reasons for the growth in deductible amounts has been the growth in enrollment in HDHP/SOs, which have higher deductibles than other plans. While growing deductibles in other plan types generally increases enrollee out-of-pocket liability, the shift in enrollment to HDHP/SOs does not necessarily do so because most HDHP/SO enrollees receive an account contribution from their employers, which in essence reduces the high cost sharing in these plans.
- Twenty-one percent of covered workers in an HDHP with an HRA and 2% of covered workers in an HSA-qualified HDHP receive an account contribution for single coverage at least equal to their deductible, while another 35% of covered workers in an HDHP with an HRA and 30% of covered workers in an HSA-qualified HDHP receive account contributions that, if applied to their deductible, would reduce the deductible to $1,000 or less [Figure 7.16].
- If we reduce the deductibles that workers face by employer account contributions, the percentage of covered workers with a deductible liability of $1,000 or more would be reduced from 51% to 40% [Figures 7.12 and 7.13].
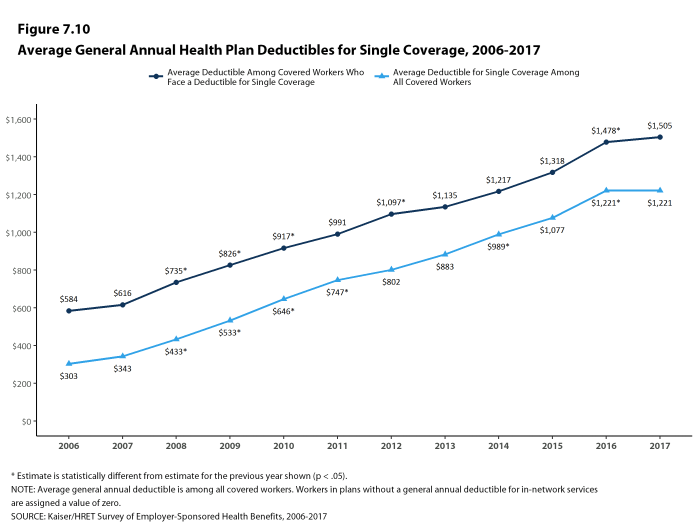
Figure 7.10: Average General Annual Health Plan Deductibles for Single Coverage, 2006-2017
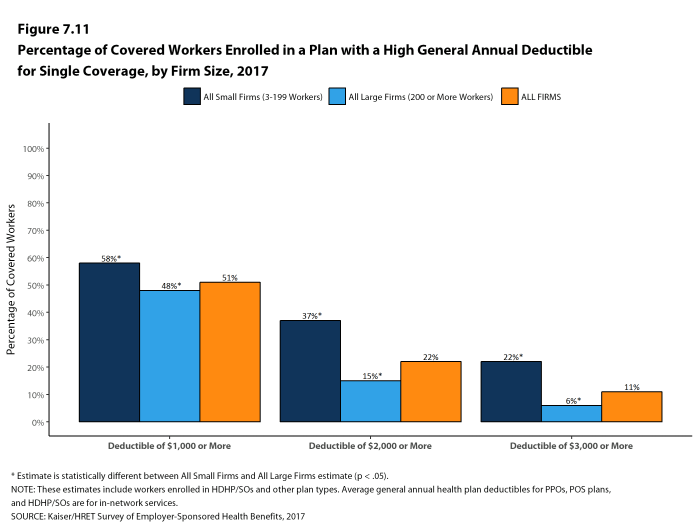
Figure 7.11: Percentage of Covered Workers Enrolled In a Plan With a High General Annual Deductible for Single Coverage, by Firm Size, 2017
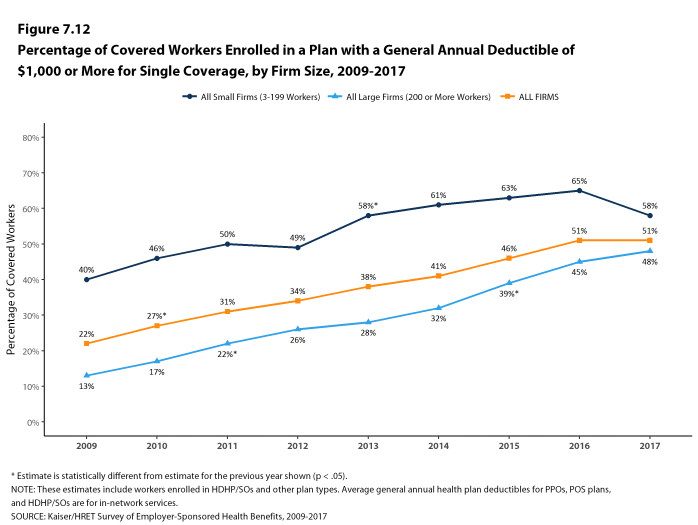
Figure 7.12: Percentage of Covered Workers Enrolled In a Plan With a General Annual Deductible of $1,000 or More for Single Coverage, by Firm Size, 2009-2017
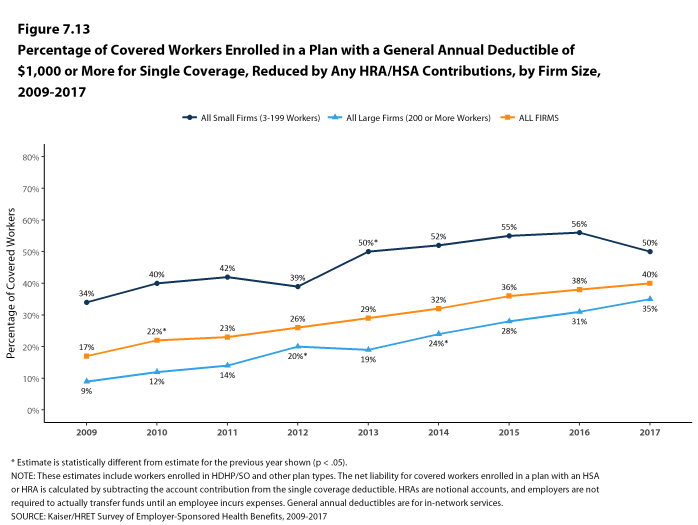
Figure 7.13: Percentage of Covered Workers Enrolled In a Plan With a General Annual Deductible of $1,000 or More for Single Coverage, Reduced by Any HRA/HSA Contributions,
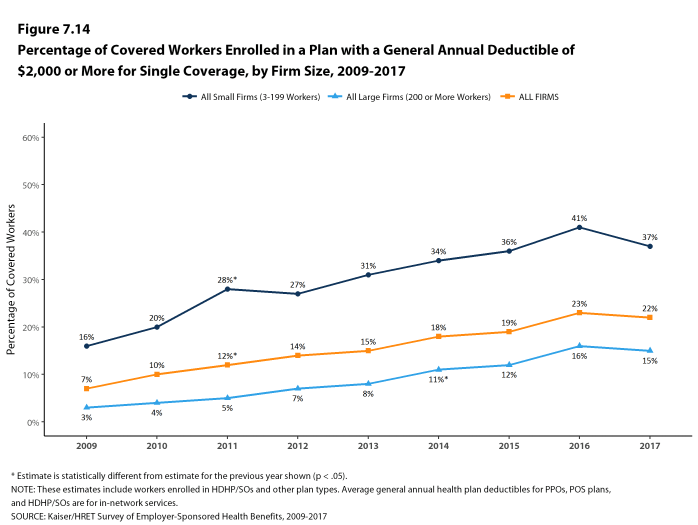
Figure 7.14: Percentage of Covered Workers Enrolled In a Plan With a General Annual Deductible of $2,000 or More for Single Coverage, by Firm Size, 2009-2017
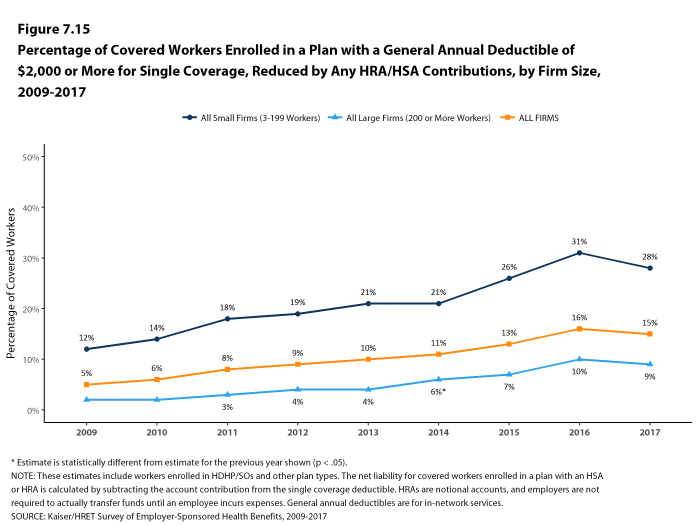
Figure 7.15: Percentage of Covered Workers Enrolled In a Plan With a General Annual Deductible of $2,000 or More for Single Coverage, Reduced by Any HRA/HSA Contributions, by Firm Size, 2009-2017
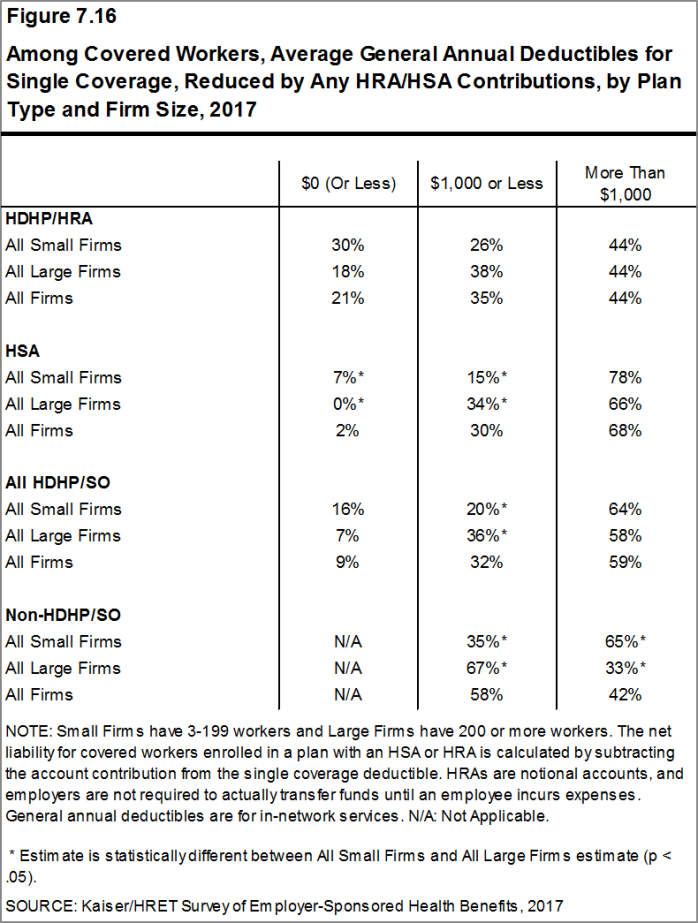
Figure 7.16: Among Covered Workers, Average General Annual Deductibles for Single Coverage, Reduced by Any HRA/HSA Contributions, by Plan Type and Firm Size, 2017
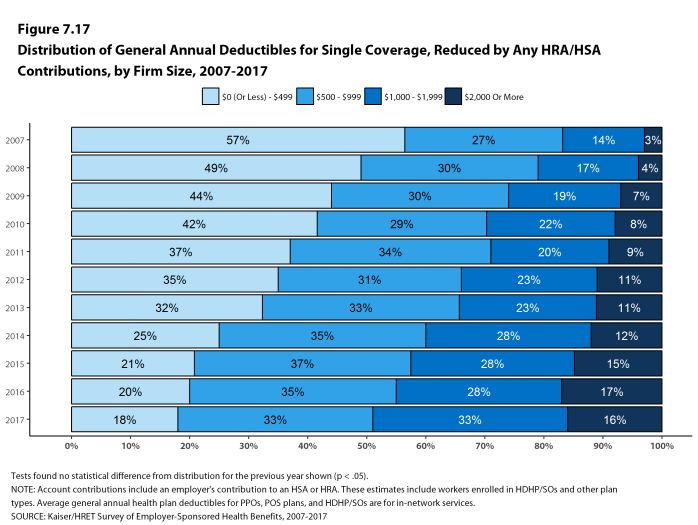
Figure 7.17: Distribution of General Annual Deductibles for Single Coverage, Reduced by Any HRA/HSA Contributions, by Firm Size, 2007-2017
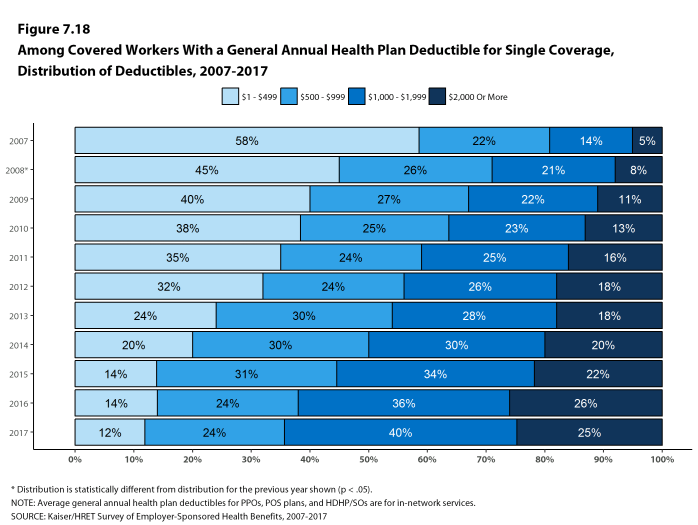
Figure 7.18: Among Covered Workers With a General Annual Health Plan Deductible for Single Coverage, Distribution of Deductibles, 2007-2017
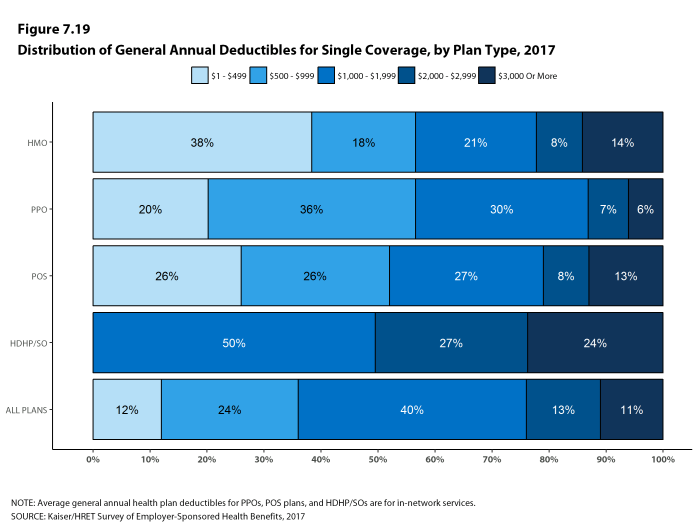
Figure 7.19: Distribution of General Annual Deductibles for Single Coverage, by Plan Type, 2017
GENERAL ANNUAL DEDUCTIBLES FOR WORKERS ENROLLED IN FAMILY COVERGE
- For family coverage, the majority of covered workers with general annual deductibles have an aggregate deductible, which means that all family members’ out-of-pocket expenses count toward meeting the deductible amount. Among covered workers in a plan with family coverage, the percentages of covered workers with an average aggregate general annual deductible are 24% for workers in HMOs, 50% for workers in PPOs, and 43% for workers in POS plans [Figure 7.20].
- The average deductible amounts for covered workers with an aggregate deductible for family coverage are $2,732 for HMOs, $2,503 for PPOs, $2,697 for POS plans, and $4,527 for HDHP/SOs [Figure 7.21]. Deductible amounts for aggregate family deductibles are similar to last year for plan types other than PPOs.
- The other type of family deductible, a separate per-person deductible, requires each family member to meet a separate per-person deductible amount before the plan covers expenses for that member. About two-thirds of covered workers in plans with separate per-person family deductibles (68%) consider the deductible met for all family members if a prescribed number of family members each reaches his or her separate deductible amounts [Figure 7.24].24 Plans may also require each family member to meet a separate per-person deductible until the family’s combined spending reaches a specified dollar amount.
- For covered workers in health plans that have separate per-person general annual deductible amounts for family coverage, the average deductibles are $1,045 for HMOs, $914 for PPOs, $1,128 for POS plans, and $2,645 for HDHP/SOs [Figure 7.21].
- Most covered workers in plans with a separate per-person general annual deductible for family coverage have a limit to the number of family members required to meet the separate deductible amounts [Figure 7.24]. Among those covered workers in plans with a limit on the number of family members, the most frequent number of family members required to meet the separate deductible amounts is two (39%) [Figure 7.25].
- For covered workers in plans with an aggregate deductible for family coverage, the average annual family deductibles in small firms are higher than the average annual family deductibles in large firms across plan types [Figure 7.21].
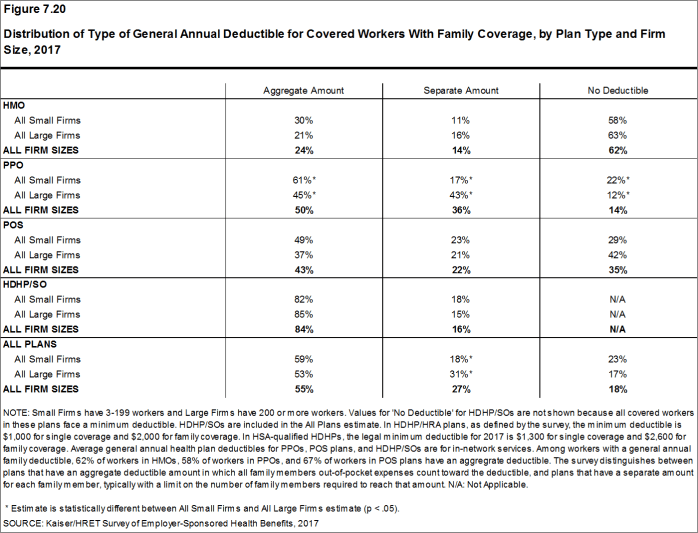
Figure 7.20: Distribution of Type of General Annual Deductible for Covered Workers With Family Coverage, by Plan Type and Firm Size, 2017
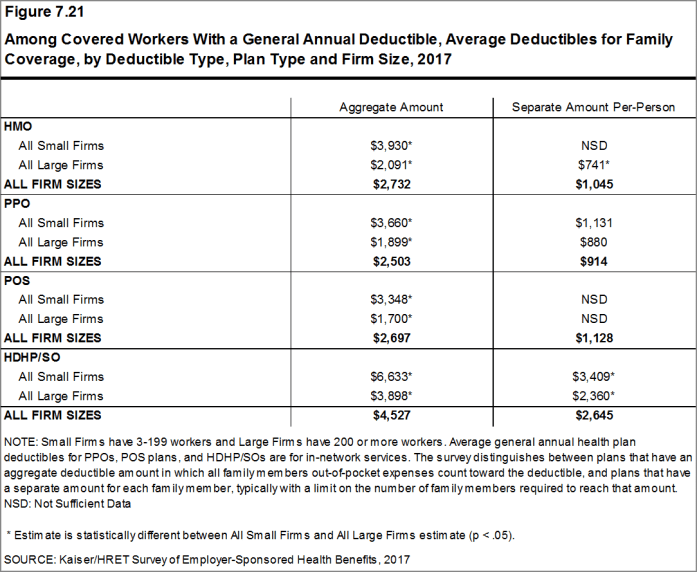
Figure 7.21: Among Covered Workers With a General Annual Deductible, Average Deductibles for Family Coverage, by Deductible Type, Plan Type and Firm Size, 2017
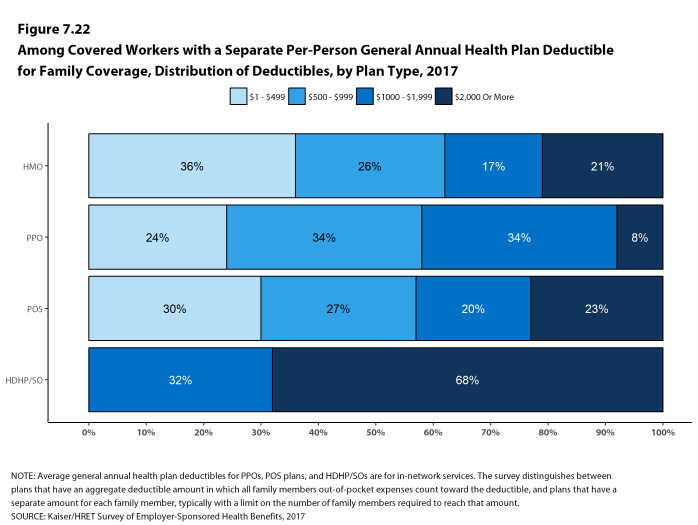
Figure 7.22: Among Covered Workers with a Separate Per-Person General Annual Health Plan Deductible for Family Coverage, Distribution of Deductibles, by Plan Type, 2017
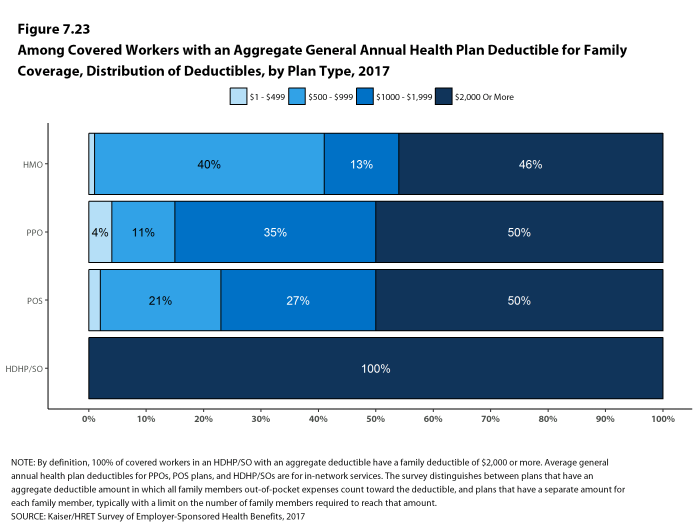
Figure 7.23: Among Covered Workers With an Aggregate General Annual Health Plan Deductible for Family Coverage, Distribution of Deductibles, by Plan Type, 2017
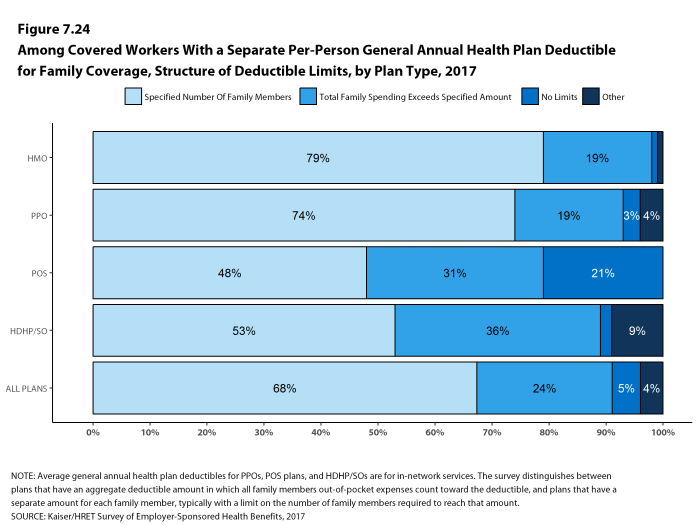
Figure 7.24: Among Covered Workers With a Separate Per-Person General Annual Health Plan Deductible for Family Coverage, Structure of Deductible Limits, by Plan Type, 2017
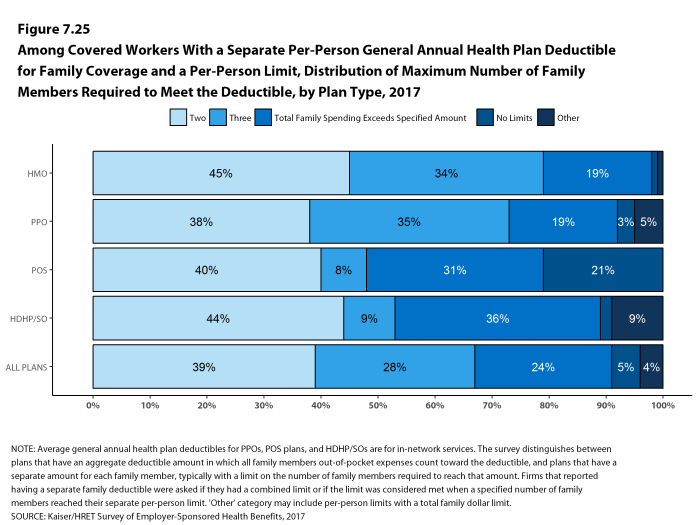
Figure 7.25: Among Covered Workers With a Separate Per-Person General Annual Health Plan Deductible for Family Coverage and a Per-Person Limit, Distribution of Maximum Number of Family Members Required to Meet the Deductible, by Plan Type, 2017
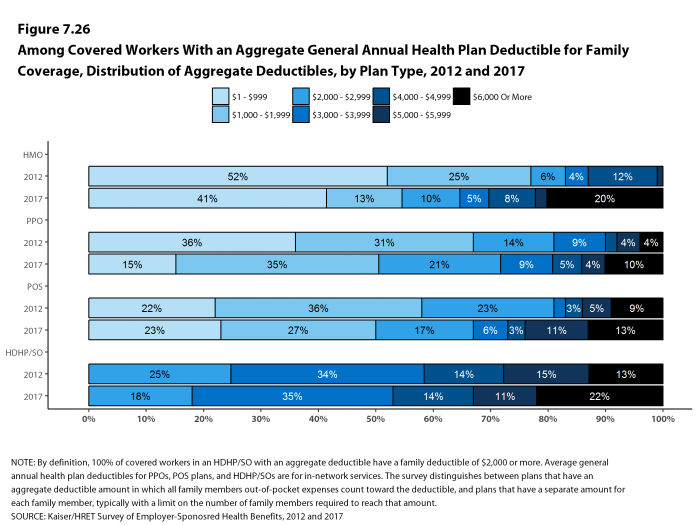
Figure 7.26: Among Covered Workers With an Aggregate General Annual Health Plan Deductible for Family Coverage, Distribution of Aggregate Deductibles, by Plan Type, 2012 and 2017
CHARACTERISTICS OF GENERAL ANNUAL DEDUCTIBLES
- The majority of covered workers with a general annual deductible are in plans where the deductible does not have to be met before certain services, such as physician office visits or prescription drugs, are covered.
- Large majorities of covered workers (74% in HMOs, 75% in PPOs, and 74% in POS plans) with general annual deductibles are enrolled in plans where the deductible does not have to be met before physician office visits for primary care are covered [Figure 7.27].
- Similarly, among workers with a general annual deductible, large shares of covered workers in HMOs (96%), PPOs (92%), and POS plans (94%) are enrolled in plans where the general annual deductible does not have to be met before prescription drugs are covered [Figure 7.27].
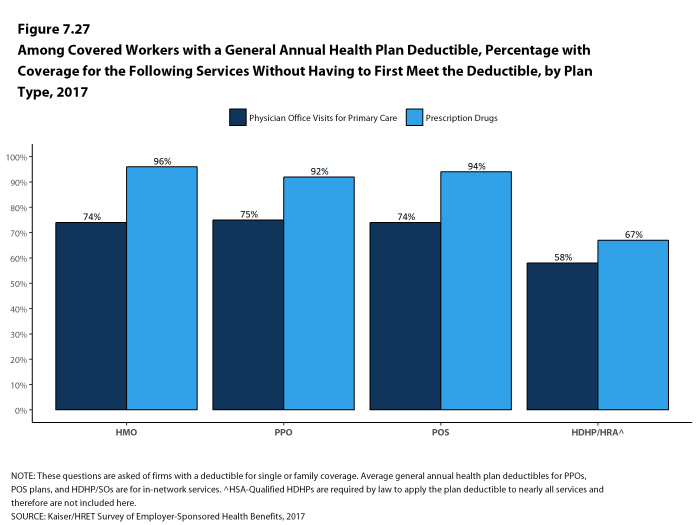
Figure 7.27: Among Covered Workers With a General Annual Health Plan Deductible, Percentage With Coverage for the Following Services Without Having to First Meet the Deductible, by Plan Type, 2017
HOSPITAL ADMISSIONS, OUTPATIENT SURGERY AND EMERGENCY ROOM VISITS
- Whether or not a worker has a general annual deductible, most workers face additional types of cost sharing (such as a copayment, coinsurance, or a per diem charge) when admitted to a hospital or having outpatient surgery. The distribution of workers with cost sharing for hospital admissions, outpatient surgery and emergency room visits does not equal 100% as workers may face a combination of types of cost sharing. In some cases, these cost-sharing arrangements are very complicated; for example workers visiting an emergency room may have some forms of cost-sharing waived if they are admitted to the hospital but still face other cost-sharing. In addition, the average copayment and coinsurance rates include workers who may have a combination of these types of cost sharing.
- Beginning this year, to reduce burden on respondents, we revised the survey to ask respondents about cost sharing for inpatient admissions, outpatient surgery and emergency room visits only in their largest health plan type; previously, we asked for this information for the largest plan for each of the plan types that they offered. After reviewing the responses and comparing them to prior years where we asked about each plan type, we find that the information we are receiving is quite similar to responses from previous years. For this reason, we will continue to report our results for these questions weighted by the number of covered workers in the responding firms. There is a more detailed discussion in the survey design and methods section on this topic.
- For hospital admissions, 64% of covered workers have coinsurance and 12% have copayments. Lower percentages of workers have per day (per diem) payments (10%), a separate hospital deductible (1%), or both a copayment and coinsurance (6%), while 17% have no additional cost sharing for hospital admissions after any general annual deductible has been met [Figure 7.28].
- For covered workers in HMO plans, copayments are more common (38%) and coinsurance (28%) is less common than the average for all covered workers [Figure 7.28].
- HDHP/SOs, on average, have a different cost-sharing structure than other plan types for hospital admissions. Only 1% of covered workers in HDHP/SOs have a copayment for hospital admissions, lower than the average for all covered workers [Figure 7.28].
- The average coinsurance rate for a hospital admission is 19%, the average copayment is $336 per hospital admission, and the average per diem charge is $257 [Figure 7.32]. Ninety-three percent of workers enrolled in a plan with a per diem for hospital admissions have a limit on the number of days a worker must pay the amount [Figure 7.33].
- The cost-sharing provisions for outpatient surgery are similar to those for hospital admissions, as most workers have coinsurance or copayments. In 2017, 19% of covered workers have a copayment and 64% have coinsurance for outpatient surgery. In addition, 6% have both a copayment and coinsurance, while 16% have no additional cost sharing after any general annual deductible has been met [Figure 7.29].
- For covered workers with cost sharing for outpatient surgery, the average coinsurance rate is 19% and the average copayment is $231 [Figure 7.32].
- The large majority of covered workers have cost sharing when they visit an emergency room. In 2017, 58% percent of covered workers have a copayment for emergency room visits and 32% have a coinsurance [Figure 7.30].
- For covered workers with cost sharing for an emergency room visit, the average coinsurance rate is 20% and the average copayment is $180 [Figure 7.32].
- Among covered workers in HDHP/SO plans, 21% have no cost sharing for an emergency room visit after any general annual deductible has been met, compared to 8% of covered workers in all plans [Figure 7.30].
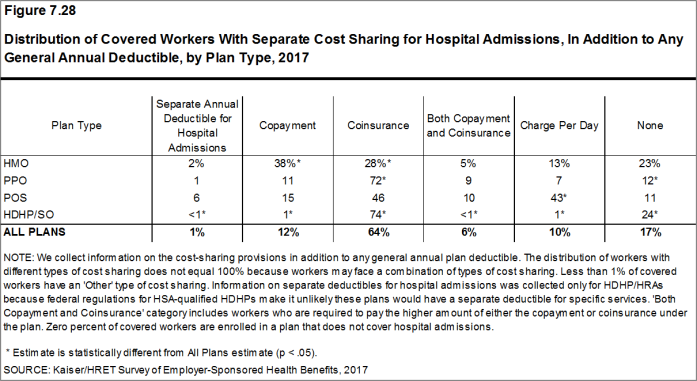
Figure 7.28: Distribution of Covered Workers With Separate Cost Sharing for Hospital Admissions, In Addition to Any General Annual Deductible, by Plan Type, 2017
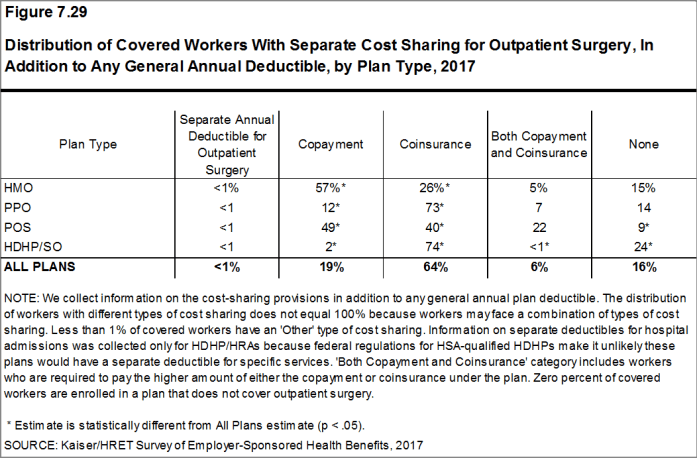
Figure 7.29: Distribution of Covered Workers with Separate Cost Sharing for Outpatient Surgery, in Addition to Any General Annual Deductible, by Plan Type, 2017
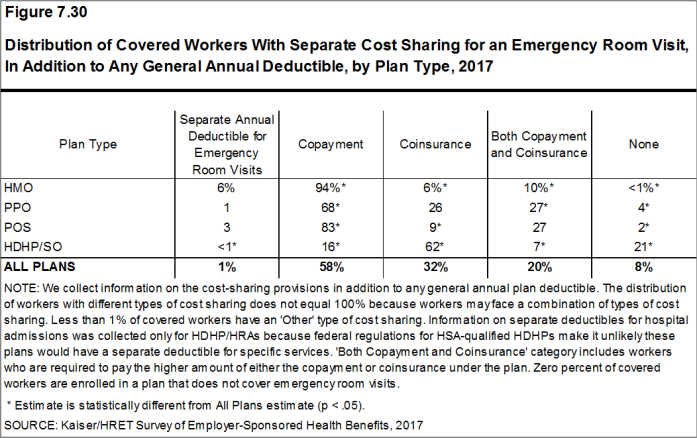
Figure 7.30: Distribution of Covered Workers with Separate Cost Sharing for an Emergency Room Visit, in Addition to Any General Annual Deductible, by Plan Type, 2017
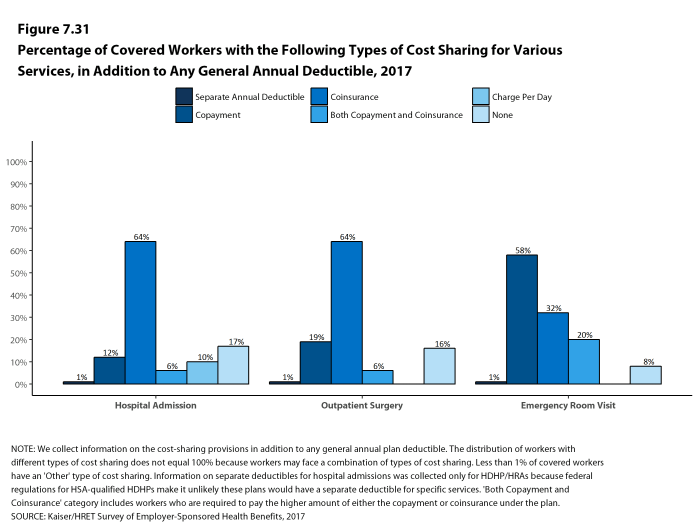
Figure 7.31: Percentage of Covered Workers With the Following Types of Cost Sharing for Various Services, In Addition to Any General Annual Deductible, 2017
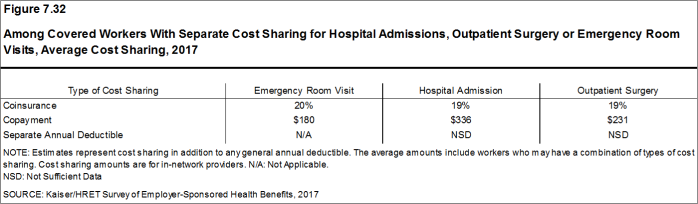
Figure 7.32: Among Covered Workers With Separate Cost Sharing for Hospital Admissions, Outpatient Surgery or Emergency Room Visits, Average Cost Sharing, 2017
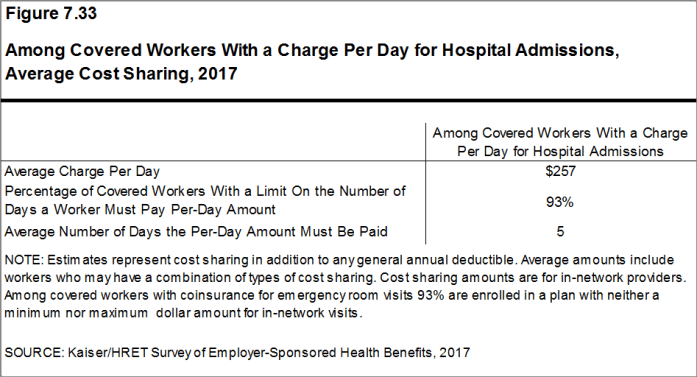
Figure 7.33: Among Covered Workers With a Charge Per Day for Hospital Admissions, Average Cost Sharing, 2017
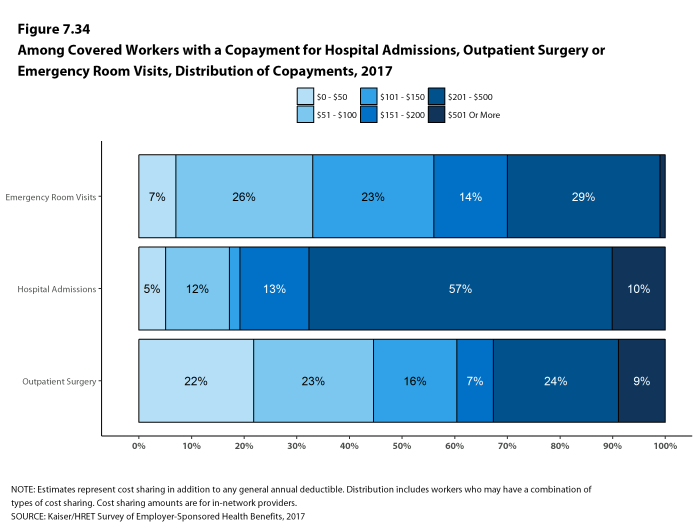
Figure 7.34: Among Covered Workers With a Copayment for Hospital Admissions, Outpatient Surgery or Emergency Room Visits, Distribution of Copayments, 2017
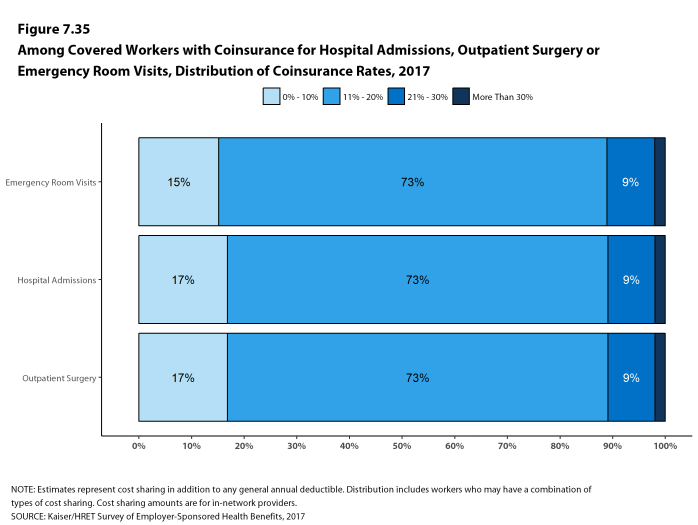
Figure 7.35: Among Covered Workers With Coinsurance for Hospital Admissions, Outpatient Surgery or Emergency Room Visits, Distribution of Coinsurance Rates, 2017
COST SHARING FOR PHYSICIAN OFFICE VISITS
- The majority of covered workers are enrolled in health plans that require cost sharing for an in-network physician office visit, in addition to any general annual deductible.25
- The most common form of physician office visit cost sharing for in-network services is copayments. Seventy-one percent of covered workers have a copayment for a primary care physician office visit and 22% have coinsurance. For office visits with a specialty physician, 67% of covered workers have copayments and 26% have coinsurance [Figure 7.36].
- Over the last five years, the percentage of covered workers with coinsurance for office visits with a specialist has risen from 19% to 26%.
- Covered workers in HMOs, PPOs, and POS plans are much more likely to have copayments for both primary care and specialty care physician office visits than workers in HDHP/SOs. For primary care physician office visits, 62% of covered workers in HDHP/SOs have coinsurance, 18% have no cost sharing after the general annual plan deductible is met, and 18% have copayments [Figure 7.36].
- Among covered workers with a copayment for in-network physician office visits, the average copayment is $25 for primary care and $38 for specialty physician office visits [Figure 7.37], similar to the amounts last year.
- Among covered workers with coinsurance for in-network physician office visits, the average coinsurance rates are 19% for a visit with a primary care physician and 19% for a visit with a specialist [Figure 7.37], similar to the rates last year.
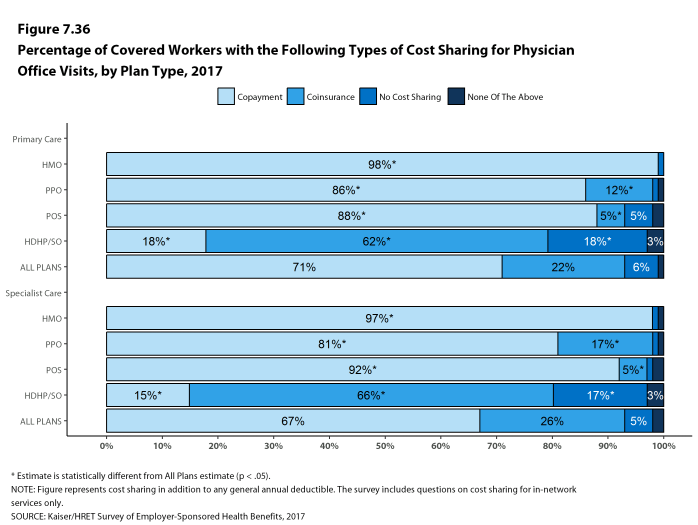
Figure 7.36: Percentage of Covered Workers With the Following Types of Cost Sharing for Physician Office Visits, by Plan Type, 2017
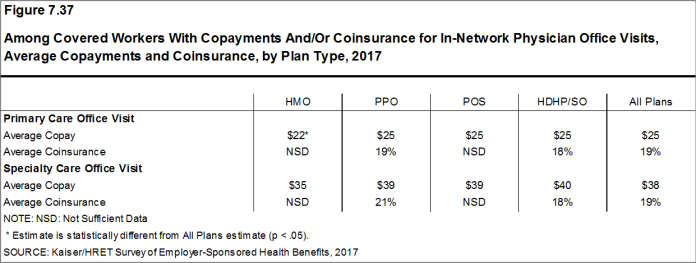
Figure 7.37: Among Covered Workers With Copayments And/Or Coinsurance for In-Network Physician Office Visits, Average Copayments and Coinsurance, by Plan Type, 2017
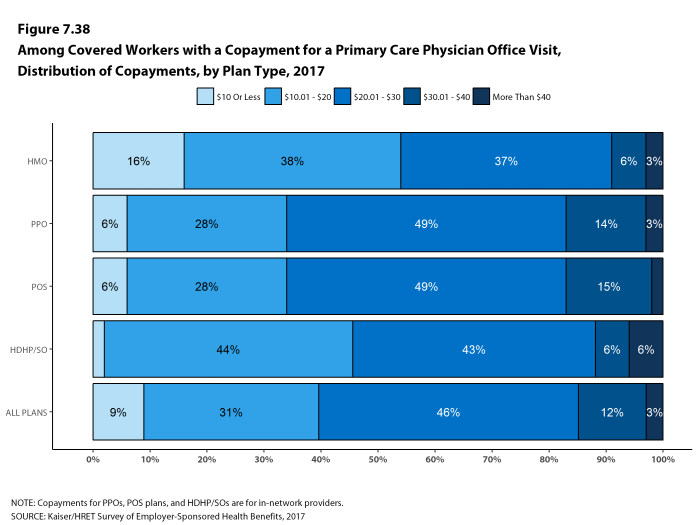
Figure 7.38: Among Covered Workers With a Copayment for a Primary Care Physician Office Visit, Distribution of Copayments, by Plan Type, 2017
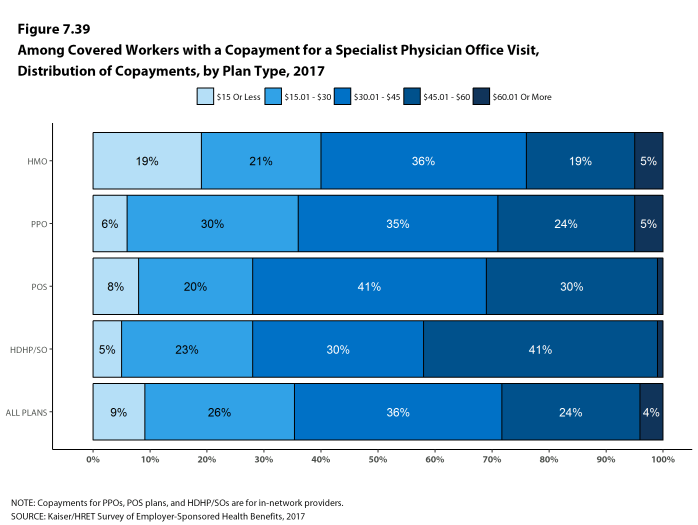
Figure 7.39: Among Covered Workers With a Copayment for a Specialist Physician Office Visit, Distribution of Copayments, by Plan Type, 2017
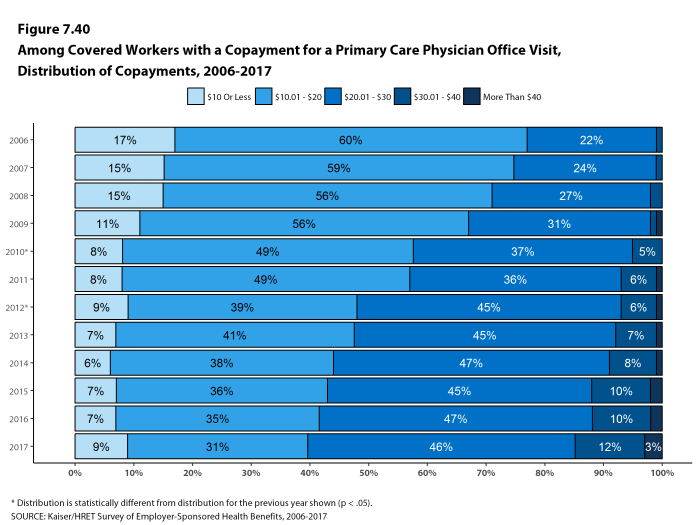
Figure 7.40: Among Covered Workers With a Copayment for a Primary Care Physician Office Visit, Distribution of Copayments, 2006-2017
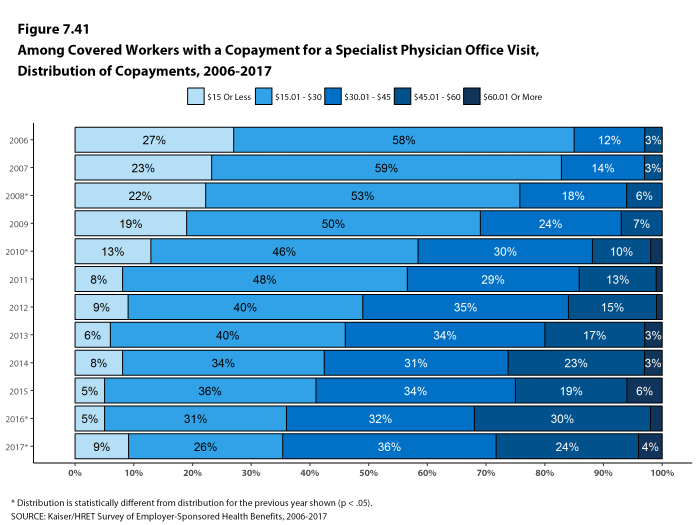
Figure 7.41: Among Covered Workers With a Copayment for a Specialist Physician Office Visit, Distribution of Copayments, 2006-2017
OUT-OF-POCKET MAXIMUM AMOUNTS
- Most covered workers are in a plan that partially or totally limits the cost sharing that a plan enrollee must pay in a year. These limits are generally referred to as out-of-pocket maximum amounts. The Affordable Care Act (ACA) requires that non-grandfathered health plans have an out-of-pocket maximum of $7,150 or less for single coverage and $14,300 for family coverage.26 Many plans have complex out-of-pocket structures, which makes it difficult to accurately collect information on this element of plan design.
- In 2017, 98% percent of covered workers are in a plan with an out-of-pocket maximum for single coverage. This is a significant increase from 87% in 2012 [Figure 7.42].
- For covered workers in plans with out-of-pocket maximums for single coverage, there is wide variation in spending limits.
- Fifteen percent of covered workers in plans with an out-of-pocket maximum for single coverage have an out-of-pocket maximum of less than $2,000, while 21% have an out-of-pocket maximum of $6,000 or more [Figure 7.44].
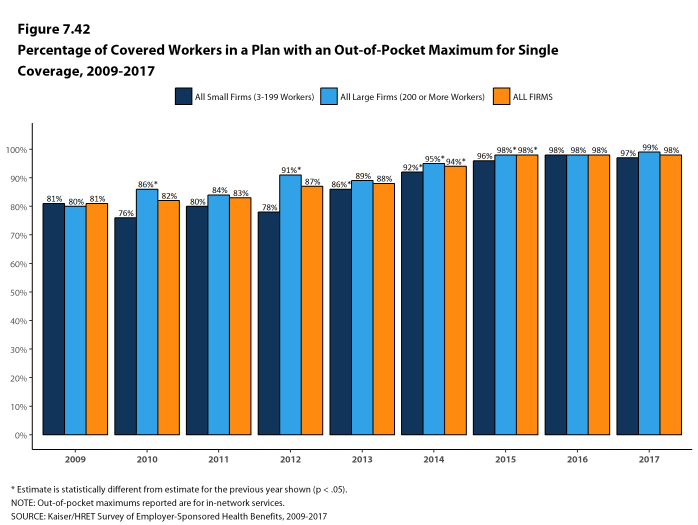
Figure 7.42: Percentage of Covered Workers In a Plan With an Out-Of-Pocket Maximum for Single Coverage, 2009-2017
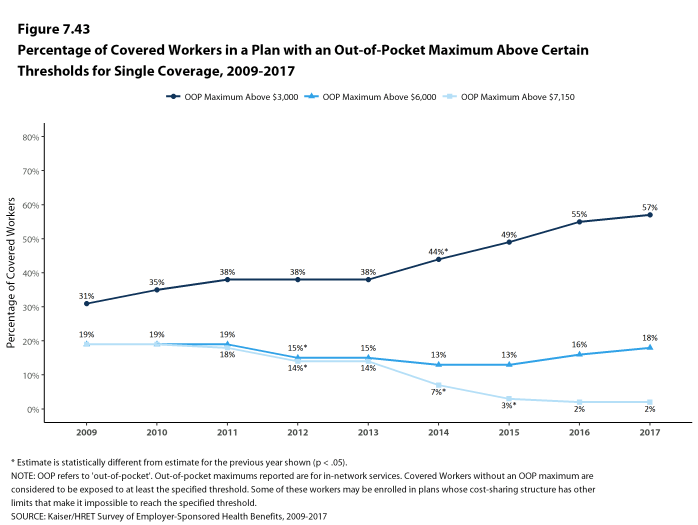
Figure 7.43: Percentage of Covered Workers In a Plan With an Out-Of-Pocket Maximum Above Certain Thresholds for Single Coverage, 2009-2017
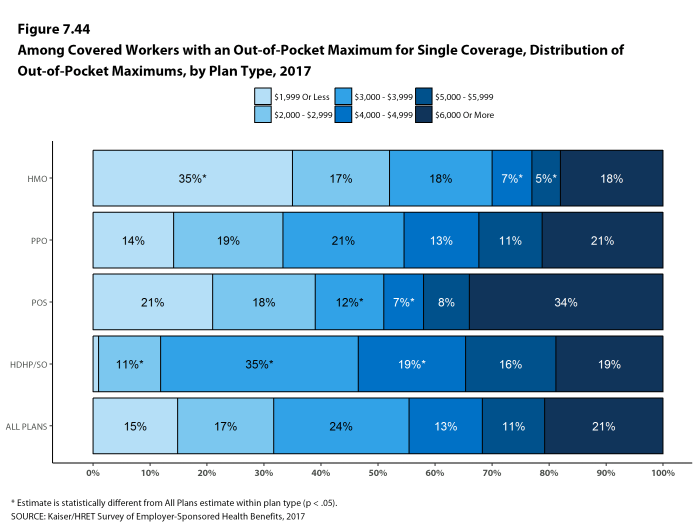
Figure 7.44: Among Covered Workers With an Out-Of-Pocket Maximum for Single Coverage, Distribution of Out-Of-Pocket Maximums, by Plan Type, 2017
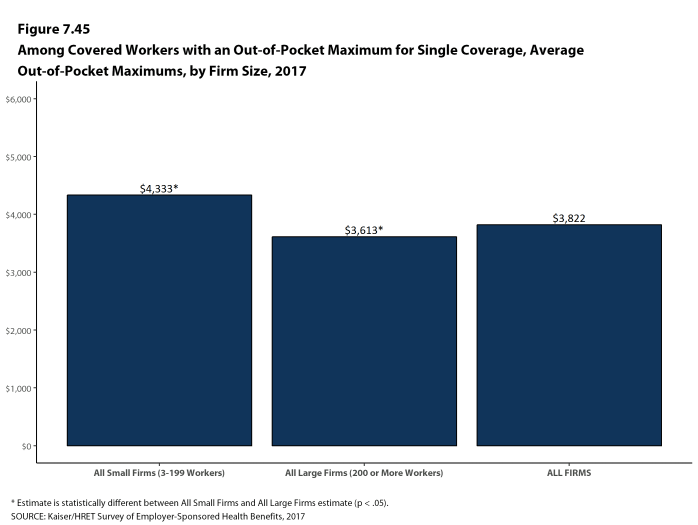
Figure 7.45: Among Covered Workers With an Out-Of-Pocket Maximum for Single Coverage, Average Out-Of-Pocket Maximums, by Firm Size, 2017
- Some workers with separate per-person deductibles or out-of-pocket maximums for family coverage do not have a specific number of family members that are required to meet the deductible amount and instead have another type of limit, such as a per-person amount with a total dollar amount limit. These responses are included in the averages and distributions for separate family deductibles and out-of-pocket maximums.↩
- Starting in 2010, the survey asked about the prevalence and cost of physician office visits separately for primary care and specialty care. Prior to the 2010 survey, if the respondent indicated the plan had a copayment for office visits, we assumed the plan had a copayment for both primary and specialty care visits. The survey did not allow for a respondent to report that a plan had a copayment for primary care visits and coinsurance for visits with a specialist physician. The changes made in 2010 allow for variations in the type of cost sharing for primary care and specialty care visits. The survey includes cost sharing for in-network services only.↩
- For those enrolled in an HDHP/HSA, the out-of-pocket maximum is $6,550 for an individual plan and $13,100 for a family plan.↩
Section Eight: High-deductible Health Plans With Savings Option
To help cover out-of-pocket expenses not covered by a health plan, some firms offer high deductible plans that are paired with an account that allows enrollees to use tax-preferred savings to pay plan cost sharing and other out-of-pocket medical expenses. The two most common are health reimbursement arrangements (HRAs) and health savings accounts (HSAs). HRAs and HSAs are financial accounts that workers or their family members can use to pay for health care services. These savings arrangements are often (or, in the case of HSAs, always) paired with health plans with high deductibles. The survey treats high-deductible plans paired with a savings option as a distinct plan type – High-Deductible Health Plan with Savings Option (HDHP/SO) – even if the plan would otherwise be considered a PPO, HMO, POS plan, or conventional health plan. Specifically for the survey, HDHP/SOs are defined as (1) health plans with a deductible of at least $1,000 for single coverage and $2,000 for family coverage27 offered with an HRA (referred to as HDHP/HRAs); or (2) high-deductible health plans that meet the federal legal requirements to permit an enrollee to establish and contribute to an HSA (referred to as HSA-qualified HDHPs).28
PERCENTAGE OF FIRMS OFFERING HDHP/HRAS AND HSA-QUALIFIED HDHPS
- Twenty-four percent of firms offering health benefits offer an HDHP/HRA, an HSA-qualified HDHP, or both. Among firms offering health benefits, 9% offer an HDHP/HRA and 17% offer an HSA-qualified HDHP [Figure 8.1]. The percentage of firms offering an HDHP/SO is similar to last year.
- Large firms (200 or more workers) are more likely than small firms (3-199 workers) to offer an HDHP/SO (53% vs. 23%). [Figure 8.3].
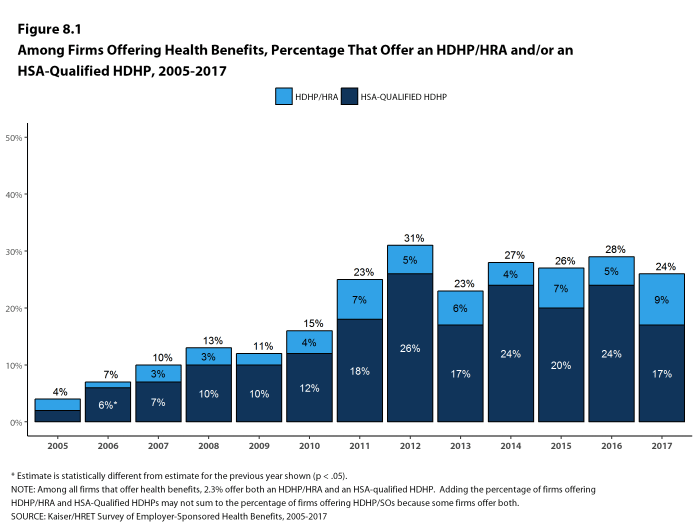
Figure 8.1: Among Firms Offering Health Benefits, Percentage That Offer an HDHP/HRA And/Or an HSA-Qualified HDHP, 2005-2017
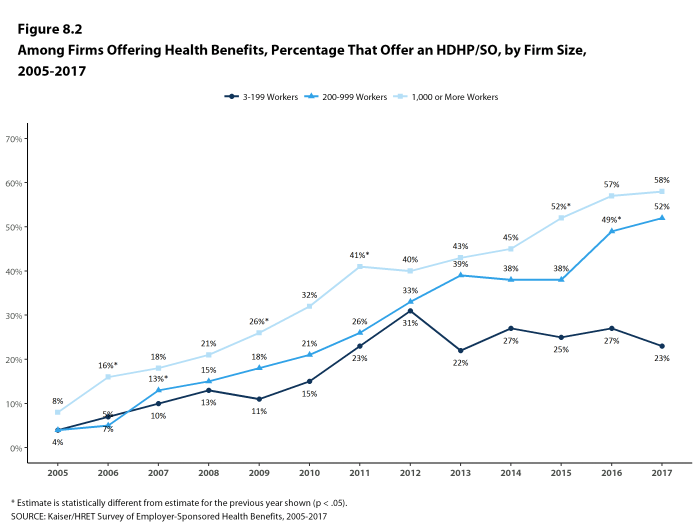
Figure 8.2: Among Firms Offering Health Benefits, Percentage That Offer an HDHP/SO, by Firm Size, 2005-2017
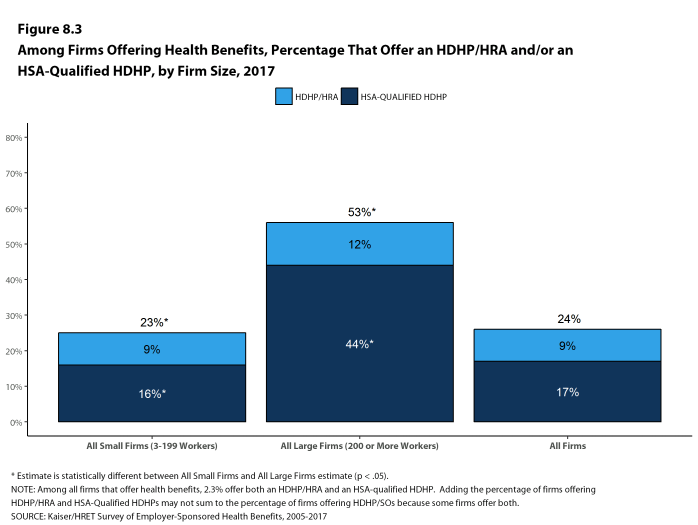
Figure 8.3: Among Firms Offering Health Benefits, Percentage That Offer an HDHP/HRA And/Or an HSA-Qualified HDHP, by Firm Size, 2017
ENROLLMENT IN FIRMS OFFERING HDHP/HRAS AND HSA-QUALIFIED HDHPS
- Enrollment in HDHP/SO plans has increased over the last five years, from 19% of covered workers in 2012 to 28% in 2017.
- Nine percent of covered workers are enrolled in HDHP/HRAs and 19% of covered workers are enrolled in HSA-qualified HDHPs in 2017. These percentages are the same as the percentages last year [Figure 8.5].
- A higher percentage of covered workers in large firms is enrolled in HDHP/SOs than in small firms (30% vs. 23%) [Figure 8.6].
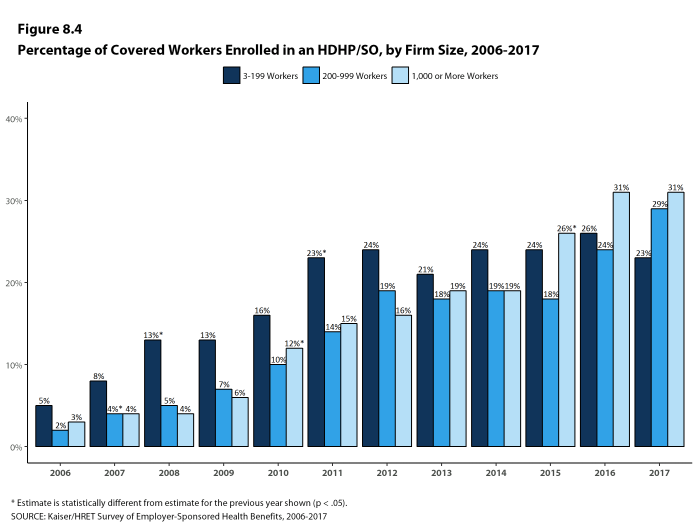
Figure 8.4: Percentage of Covered Workers Enrolled In an HDHP/SO, by Firm Size, 2006-2017
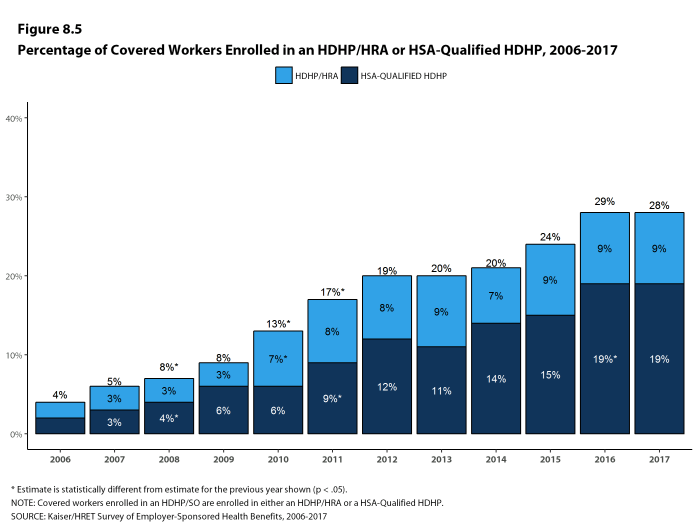
Figure 8.5: Percentage of Covered Workers Enrolled In an HDHP/HRA or HSA-Qualified HDHP, 2006-2017
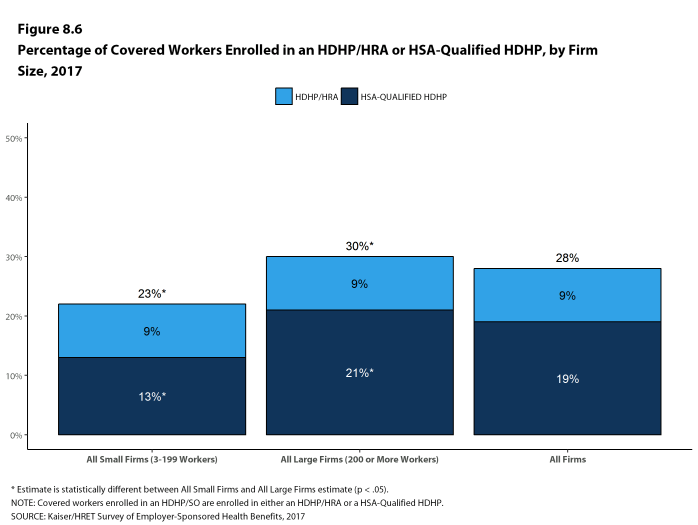
Figure 8.6: Percentage of Covered Workers Enrolled In an HDHP/HRA or HSA-Qualified HDHP, by Firm Size, 2017
PREMIUMS AND WORKER CONTRIBUTIONS
- The average annual premiums in 2017 for covered workers in HDHP/HRAs are $6,438 for single coverage and $18,948 for family coverage [Figure 8.7]. The average annual premium for single coverage in HDHP/HRAs is significantly less than the average annual premium for single coverage for covered workers in plans that are not HDHP/SOs [Figure 8.8].
- The average annual premium for workers in HSA-qualified HDHPs is $5,773 for single coverage and $16,821 for family coverage. These amounts are significantly less than the average single and family premium for covered workers in plans that are not HDHP/SOs [Figure 8.8].
- The average single and family coverage premiums for covered workers enrolled in HSA-qualified HDHPs are lower than the premiums for covered workers enrolled in HDHP/HRAs.
- The average annual worker contributions to premiums for workers enrolled in HDHP/HRAs are $1,216 for single coverage and $5,130 for family coverage [Figure 8.7].
- The average annual worker contributions to premiums for workers in HSA-qualified HDHPs are $918 for single coverage and $4,289 for family coverage. The average contributions for single and family coverage for covered workers in HSA-qualified HDHPs are significantly less than the average premium contribution made by covered workers in plans that are not HDHP/SOs [Figure 8.8].
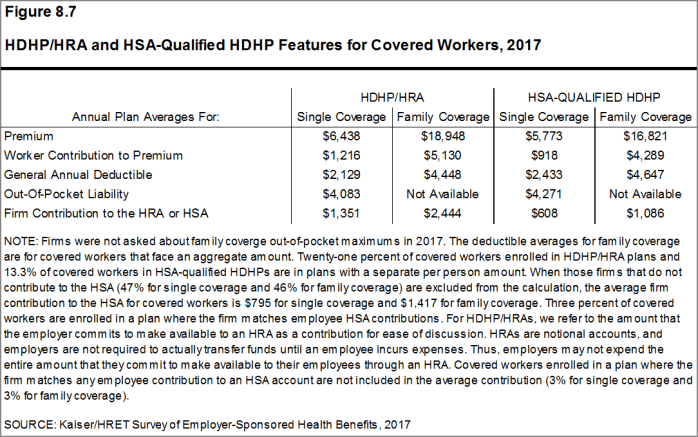
Figure 8.7: HDHP/HRA and HSA-Qualified HDHP Features for Covered Workers, 2017
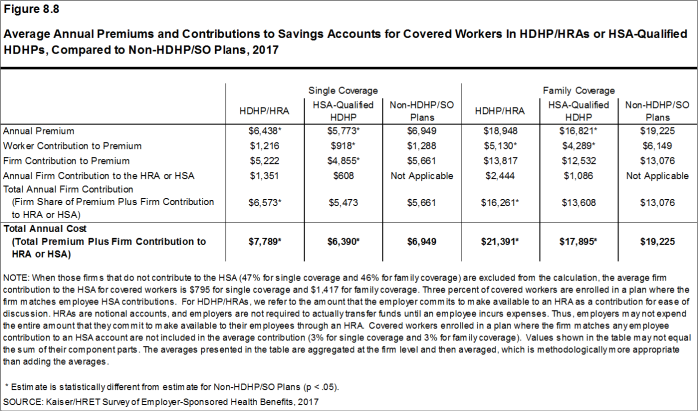
Figure 8.8: Average Annual Premiums and Contributions to Savings Accounts for Covered Workers In HDHP/HRAs or HSA-Qualified HDHPs, Compared to Non-HDHP/SO Plans, 2017
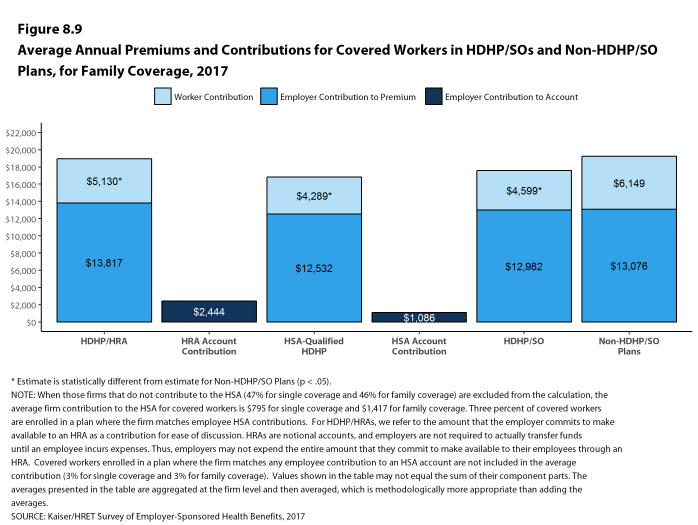
Figure 8.9: Average Annual Premiums and Contributions for Covered Workers In HDHP/SOs and Non-HDHP/SO Plans, for Family Coverage, 2017
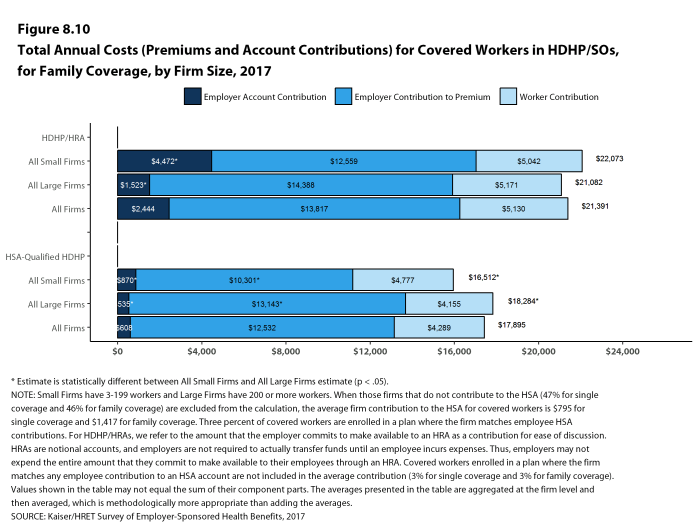
Figure 8.10: Total Annual Costs (Premiums and Account Contributions) for Covered Workers In HDHP/SOs, for Family Coverage, by Firm Size, 2017
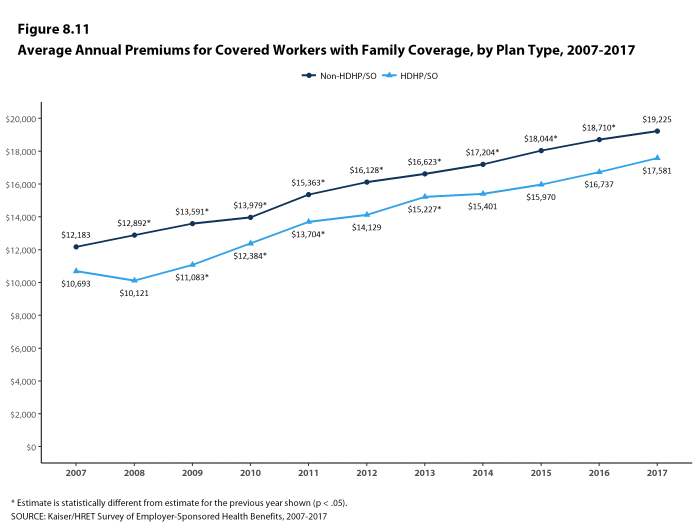
Figure 8.11: Average Annual Premiums for Covered Workers With Family Coverage, by Plan Type, 2007-2017
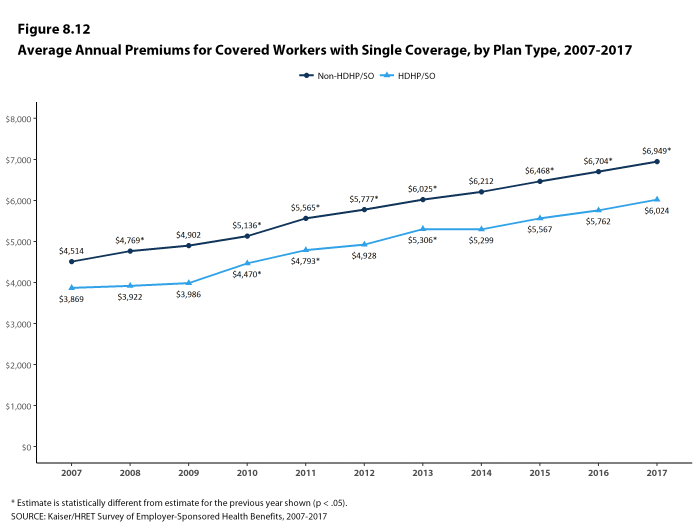
Figure 8.12: Average Annual Premiums for Covered Workers With Single Coverage, by Plan Type, 2007-2017
PLAN DEDUCTIBLES
- As expected, workers enrolled in HDHP/SOs have higher deductibles than workers enrolled in HMOs, PPOs, or POS plans.
- The average general annual deductible for single coverage is $2,129 for HDHP/HRAs and $2,433 for HSA-qualified HDHPs [Figure 8.14]. These averages are similar to the amounts reported in recent years. There is wide variation around these averages: 19% of covered workers enrolled in an HDHP/SO are in a plan with a deductible of $1,000 to $1,499 while 24% are in a plan with a deductible of $3,000 or more [Figure 8.13].
- The survey asks firms whether the family deductible amount is (1) an aggregate amount (i.e., the out-of-pocket expenses of all family members are counted until the deductible is satisfied), or (2) a per-person amount that applies to each family member (typically with a limit on the number of family members that would be required to meet the deductible amount) (see Section 7 for more information).
- The average aggregate deductibles for workers with family coverage are $4,448 for HDHP/HRAs and $4,647 for HSA-qualified HDHPs [Figure 8.7]. As with single coverage, there is wide variation around these averages for family coverage: 18% of covered workers enrolled in HDHP/SOs with an aggregate family deductible have a deductible of $2,000 to $2,999 while 22% have a deductible of $6,000 dollars or more [Figure 8.15].
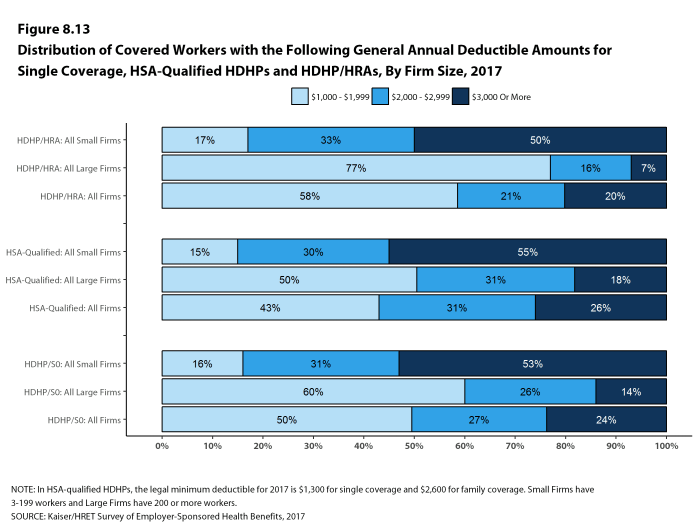
Figure 8.13: Distribution of Covered Workers With the Following General Annual Deductible Amounts for Single Coverage, HSA-Qualified HDHPs and HDHP/HRAs, by Firm Size, 2017
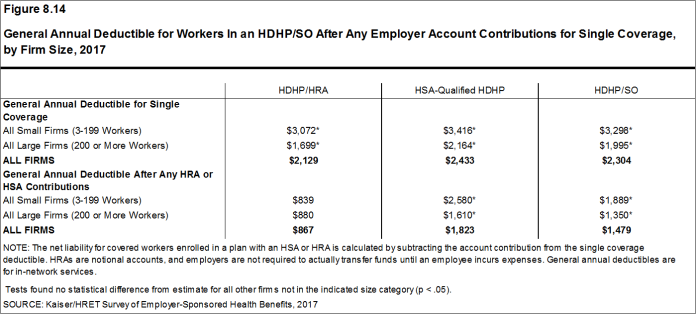
Figure 8.14: General Annual Deductible for Workers In an HDHP/SO After Any Employer Account Contributions for Single Coverage, by Firm Size, 2017
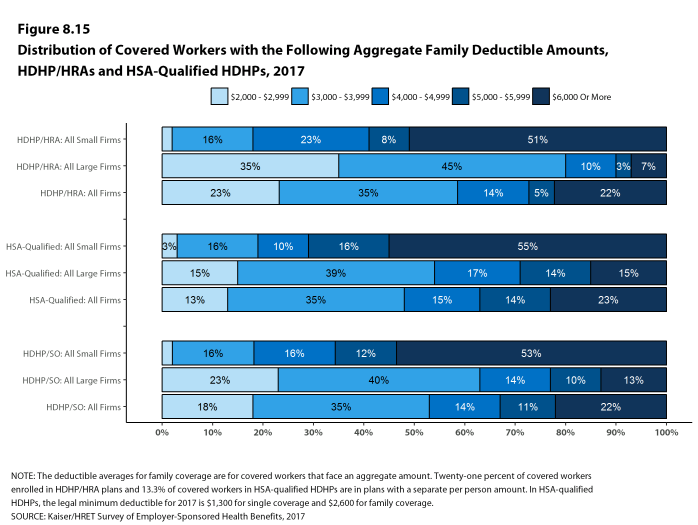
Figure 8.15: Distribution of Covered Workers With the Following Aggregate Family Deductible Amounts, HDHP/HRAs and HSA-Qualified HDHPs, 2017
OUT-OF-POCKET MAXIMUM AMOUNTS
- HSA-qualified HDHPs are legally required to have an annual out-of-pocket maximum of no more than $6,550 for single coverage and $13,100 for family coverage in 2017. Non-grandfathered HDHP/HRA plans starting in 2017 are required to have out-of-pocket maximums of no more than $7,150 for single coverage and $14,300 for family coverage. Virtually all HDHP/HRA plans have an out of pocket maximum for single coverage in 2017.
- The average annual out-of-pocket maximum for single coverage is $4,083 for HDHP/HRAs and $4,271 for HSA-qualified HDHPs [Figure 8.7].
EMPLOYER CONTRIBUTIONS TO PREMIUMS AND SAVINGS OPTIONS
- Employers contribute to HDHP/SOs in two ways: through their contributions toward the premium for the health plan and through their contributions (if any, in the case of HSAs) to the savings account option (i.e., the HRAs or HSAs themselves).
- Looking at only the annual employer contributions to premiums, covered workers in HDHP/HRAs on average receive employer contributions of $5,222 for single coverage and $13,817 for family coverage [Figure 8.8]. These amounts are similar to the contribution amounts last year.
- The average annual employer contributions to premiums for workers in HSA-qualified HDHPs are $4,855 for single coverage and $12,532 for family coverage, similar to the contribution amounts last year. The average employer contribution for covered workers in HSA-qualified HDHPs for single coverage is lower than the average contribution for covered workers in plans that are not HDHP/SOs [Figure 8.8].
- Looking at employer contributions to the savings options, covered workers enrolled in HDHP/HRAs on average receive an annual employer contribution to their HRA of $1,351 for single coverage and $2,444 for family coverage [Figure 8.8].
- HRAs are generally structured in such a way that employers may not actually spend the whole amount that they make available to their employees’ HRAs.29 Amounts committed to an employee’s HRA that are not used by the employee generally roll over and can be used in future years, but any balance may revert back to the employer if the employee leaves his or her job. Thus, the employer contribution amounts to HRAs that we capture in the survey may exceed the amount that employers will actually spend.
- Covered workers enrolled in HSA-qualified HDHPs on average receive an annual employer contribution to their HSA of $608 for single coverage and $1,086 for family coverage [Figure 8.8]. These amounts do not include the 3% of covered workers in HSA-qualified HDHPs whose employers say they vary account contributions based on certain factors, such as job classification or participation in a wellness program [Figure 8.18].
- In many cases, employers that sponsor HSA-qualified HDHP/SOs do not make contributions to HSAs established by their employees. Forty-seven percent of employers offering single coverage and 46% offering family coverage through HSA-qualified HDHPs do not make contributions toward the HSAs that their workers establish. Twenty-three percent of workers with single coverage and 23% of workers with family coverage in an HSA-qualified HDHP do not receive an account contribution from their employer [Figures 8.16 and 8.17].
- The average HSA contributions reported above include the portion of covered workers whose employer contribution to the HSA is zero. When those firms that do not contribute to the HSA are excluded from the calculation, the average employer contribution for covered workers is $795 for single coverage and $1,417 for family coverage.
- The percentage of covered workers enrolled in a plan where the employer makes no HSA contribution for single and family coverage (23%) is similar to the percentage in recent years.
- Employer contributions to savings account options (i.e., the HRAs and HSAs themselves) for their workers can be added to their health plan premium contributions to calculate total employer contributions toward HDHP/SOs. We note that HRAs are a promise by an employer to pay up to a specified amount and that many employees will not receive the full amount of their HRA in a year, so adding the employer premium contribution amount and the HRA contribution represents an upper bound for employer liability that overstates the amount that is actually expended. Since employer contributions to employee HSA accounts immediately transfer the full amount to the employee, adding employer premium and HSA contributions is a good way to look at their total liability under these plans.
- For HDHP/HRAs, the average annual total employer contribution for covered workers is $6,573 for single coverage and $16,261 for family coverage. The average total employer contribution amounts for covered workers for single coverage and family coverage in HDHP/HRAs are higher than the average amount that employers contribute toward family coverage in health plans that are not HDHP/SOs [Figure 8.8].
- For HSA-qualified HDHPs, the average total annual firm contribution for covered workers is $5,473 for single coverage and $13,608 for workers with family coverage. The average total firm contribution amounts for single and family coverage in HSA-qualified HDHPs are similar to the average firm contributions toward single and family coverage in health plans that are not HDHP/SOs [Figure 8.8].
- There is considerable variation in the amount that employers contribute to savings accounts.
- Forty-six percent of covered workers in an HDHP/HRA have an annual HRA contribution of less than $800, while 22% have an annual HRA contribution of $1,600 or more.
- Thirty-seven percent of covered workers in an HSA-qualified HDHP have an annual HSA contribution of less than $400, including 23% that have no HSA contribution from their employer. In contrast, 12% of covered workers in an HSA-qualified HDHP have an annual HSA contribution of $1,200 or more. These percentages do not include the 3% of covered workers with an employer that matches their HSA contribution.
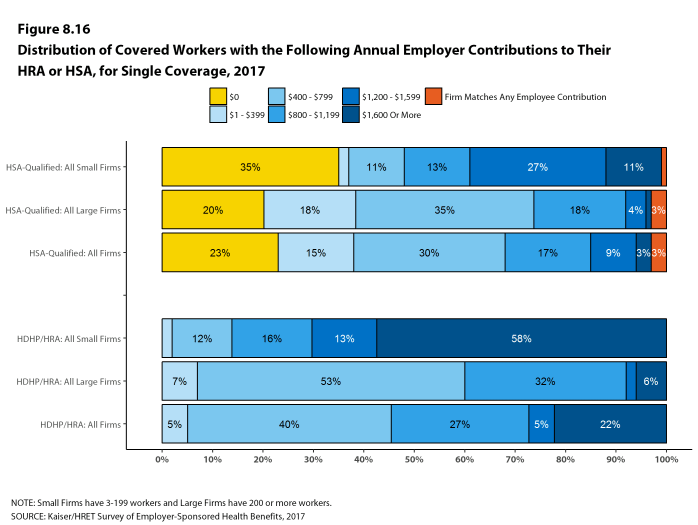
Figure 8.16: Distribution of Covered Workers With the Following Annual Employer Contributions to Their HRA or HSA, for Single Coverage, 2017
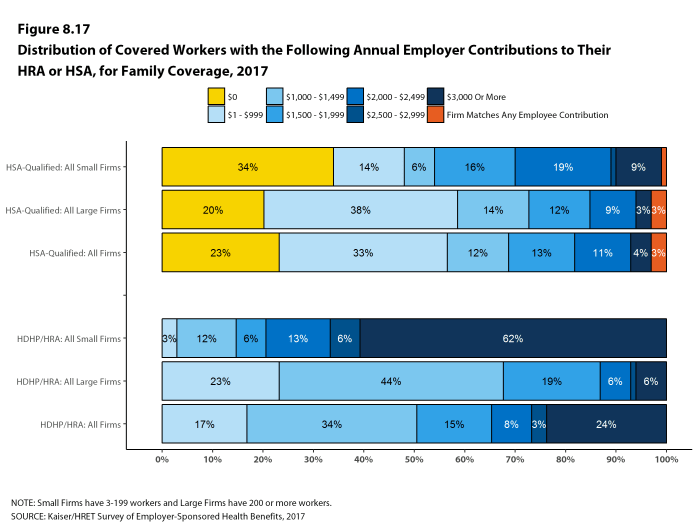
Figure 8.17: Distribution of Covered Workers With the Following Annual Employer Contributions to Their HRA or HSA, for Family Coverage, 2017
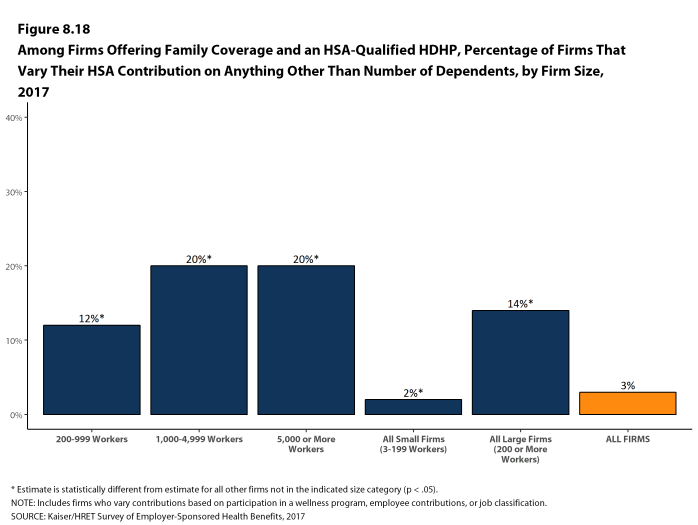
Figure 8.18: Among Firms Offering Family Coverage and an HSA-Qualified HDHP, Percentage of Firms That Vary Their HSA Contribution On Anything Other Than Number of Dependents, by Firm Size, 2017
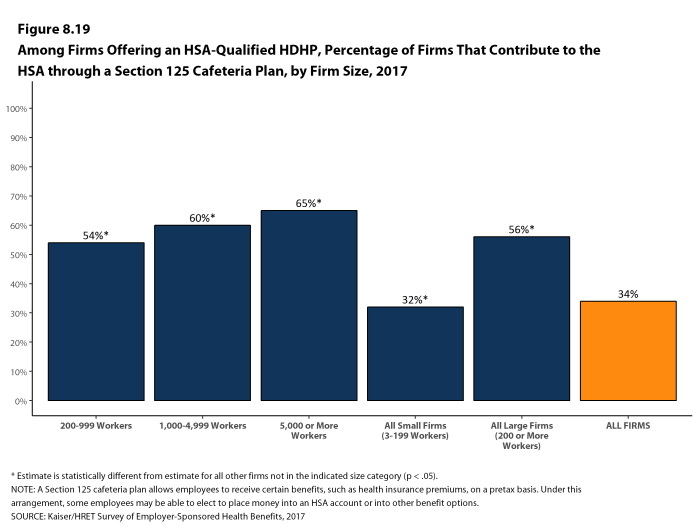
Figure 8.19: Among Firms Offering an HSA-Qualified HDHP, Percentage of Firms That Contribute to the HSA Through a Section 125 Cafeteria Plan, by Firm Size, 2017
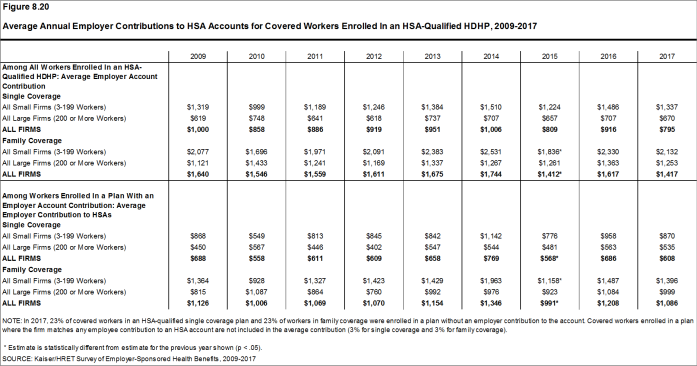
Figure 8.20: Average Annual Employer Contributions to HSA Accounts for Covered Workers Enrolled In an HSA-Qualified HDHP, 2009-2017
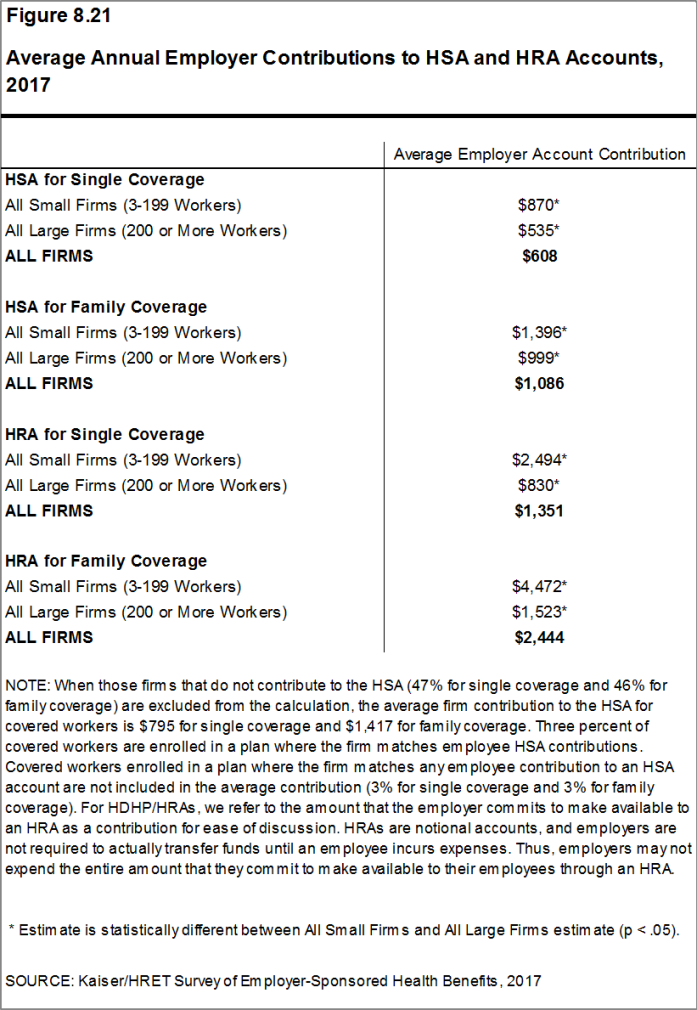
Figure 8.21: Average Annual Employer Contributions to HSA and HRA Accounts, 2017
COST-SHARING FOR OFFICE-VISITS
- The cost-sharing pattern for primary care office visits differs for workers enrolled in HDHP/SOs. Thirty-nine percent of covered workers in HDHP/HRAs have a copayment for primary care physician office visits compared to 7% enrolled in an HSA-qualified HDHP [Figure 8.22]. Workers in other plan types are much more likely to face copayments than coinsurance for physician office visits (see Section 7 for more information).
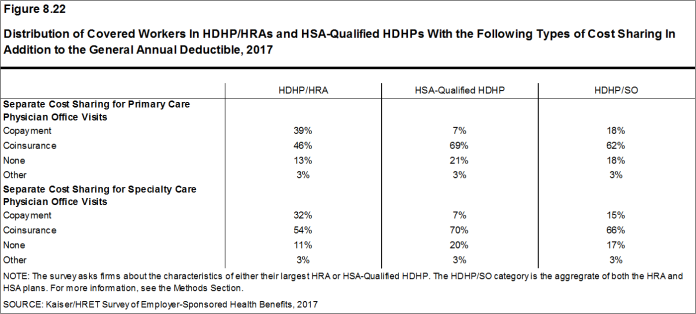
Figure 8.22: Distribution of Covered Workers In HDHP/HRAs and HSA-Qualified HDHPs With the Following Types of Cost Sharing In Addition to the General Annual Deductible, 2017
- There is no legal requirement for the minimum deductible in a plan offered with an HRA. The survey defines a high-deductible HRA plan as a plan with a deductible of at least $1,000 for single coverage and $2,000 for family coverage. Federal law requires a deductible of at least $1,300 for single coverage and $2,600 for family coverage for HSA-qualified HDHPs in 2017. See the Text Box for more information on HDHP/HRAs and HSA-qualified HDHPs.↩
- The definitions of HDHP/SOs do not include other consumer-driven plan options, such as arrangements that combine an HRA with a lower-deductible health plan or arrangements in which an insurer (rather than the employer as in the case of HRAs or the enrollee as in the case of HSAs) establishes an account for each enrollee. Other arrangements may be included in future surveys as the market evolves.↩
- The survey asks “Up to what dollar amount does your firm promise to contribute each year to an employee’s HRA or health reimbursement arrangement for single coverage?” We refer to the amount that the employer commits to make available to an HRA as a contribution for ease of discussion. As discussed, HRAs are notional accounts, and employers are not required to actually transfer funds until an employee incurs expenses. Thus, employers may not expend the entire amount that they commit to make available to their employees through an HRA. Some employers may make their HRA contribution contingent on other factors, such as completing wellness programs.↩
- See U.S. Department of the Treasury, Health Savings Accounts, available at http://www.irs.gov/pub/irs-drop/rp-14-30.pdf↩
Section Nine: Prescription Drug Benefits
Almost all covered workers have coverage for prescription drugs. Over the years that we have conducted the survey, coverage for prescriptions has become more complex as employers and insurers expanded the use of formularies with multiple cost-sharing tiers as well as other management approaches. Collecting information about these practices is challenging and was burdensome to respondents with multiple plans to report on.
Beginning in 2016, to reduce burden on respondents, we revised the survey to ask respondents about the attributes of prescription drug coverage only in their largest health plan; previously, we asked about prescription coverage in their largest plan for each of the plan types that they offered. After reviewing the responses and comparing them to prior years where we asked about each plan type, we find that the information we are receiving is quite similar to responses from previous years. For this reason, we will continue to report our results for these questions weighted by the number of covered workers in responding firms. There is a more detailed discussion in the survey design and methods section on this topic.
In addition, because of the significant policy interest in access to and the cost of specialty drugs, in 2016 we also began asking employers to report separately about the cost sharing for tiers that cover only specialty drugs. In cases in which a tier covers only specialty drugs, we report its attributes under the specialty banner, rather than as one of the standard tiers. This entails revising the way we group formulary tiers: for example, a three-tier formulary where the third tier covers exclusively specialty drugs is now consider a two-tier plan with an additional tier. This approach allows us to report on the cost sharing for specialty drugs regardless of the number of tiers in the formulary. For this reason, we are not presenting statistical comparisons of estimates relying on tiers to prior years.31 This change is also discussed more fully in the survey design and methods section.
- Nearly all (99%) covered workers work at a firm that provides prescription drug coverage in their largest health plan.
DISTRIBUTION OF COST-SHARING
- A large share of covered workers (91%) are in a plan with a tiered cost-sharing formula for prescription drugs [Figure 9.1]. Cost-sharing tiers generally refer to a health plan placing a drug on a formulary or preferred drug list that classifies drugs into categories that are subject to different cost sharing or management. It is common for there to be different tiers for generic, preferred and non-preferred drugs. In recent years, plans have created additional tiers which, for example, may be used for lifestyle drugs or expensive biologics. Some plans may have multiple tiers for different categories; for example, a plan may have preferred and non-preferred specialty tiers. The survey obtains information about the cost-sharing structure for up to five tiers.
- Eighty-three percent of covered workers are in a plan with three, four, or more tiers of cost sharing for prescription drugs [Figure 9.1]. These totals include tiers that cover only specialty drugs, even though the cost-sharing information for those tiers is reported separately.
- HDHP/SOs have a different cost-sharing pattern for prescription drugs than other plan types. Covered workers in HDHP/SOs are more likely to be in a plan with the same cost sharing regardless of drug type (15% vs. 2%) or in a plan that has no cost sharing for prescriptions once the plan deductible is met (13% vs. <1%) as compared to covered workers in other types of plans [Figure 9.2].
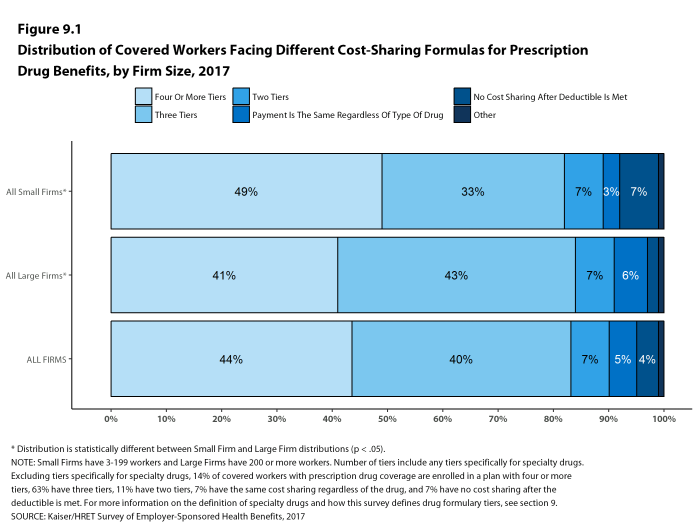
Figure 9.1: Distribution of Covered Workers Facing Different Cost-Sharing Formulas for Prescription Drug Benefits, by Firm Size, 2017
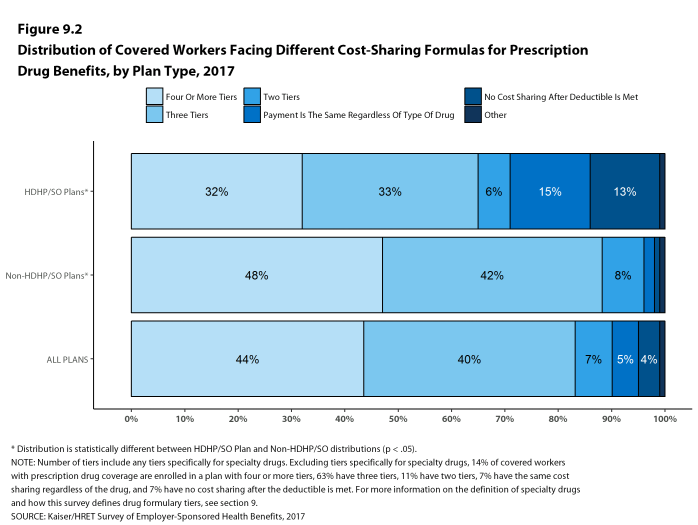
Figure 9.2: Distribution of Covered Workers Facing Different Cost-Sharing Formulas for Prescription Drug Benefits, by Plan Type, 2017
AVERAGE COST-SHARING NOT INCLUDING TIERS EXCLUSIVELY COVERING SPECIALTY DRUGS
- Even when formulary tiers covering only specialty drugs are not included, a large share (77%) of covered workers are in a plan with three or more tiers of cost sharing for prescription drugs. The cost-sharing statistics presented in this section do not include information about tiers that cover only specialty drugs. In cases in which a plan covers specialty drugs on a tier with other drugs, they will still be included in these averages. Cost-sharing statistics for tiers covering only specialty drugs are presented in the next section.
- For covered workers in a plan with three or more tiers of cost sharing for prescription drugs, copayments are the most common form of cost sharing in the first three tiers and coinsurance is the next most common. Among those with a fourth tier, the difference between the percentage with a copayment and a coinsurance requirement is not statistically significant [Figure 9.3].
- Among covered workers in plans with three or more tiers of cost sharing for prescription drugs, the average copayments are $11 for first-tier drugs, $33 second-tier drugs, $59 for third-tier drugs, and $110 for fourth-tier drugs [Figure 9.6].
- Among covered workers in plans with three or more tiers of cost sharing for prescription drugs, the average coinsurance rates are 17% for first-tier drugs, 25% second-tier drugs, 38% third-tier drugs, and 28% for fourth-tier drugs [Figure 9.6].
- Eleven percent of covered workers are in a plan with two tiers for prescription drug cost sharing (excluding tiers covering only specialty drugs).
- For these workers, copayments are more common than coinsurance for both first-tier and second-tier drugs. The average copayment for the first tier is $11 and the average copayment for the second tier is $30 [Figure 9.3].
- Seven percent of covered workers are in a plan with the same cost sharing for prescriptions regardless of the type of drug (excluding tiers covering only specialty drugs).
- Among these workers, 21% have copayments and 79% have coinsurance [Figure 9.3]. The average coinsurance rate is 19% and the average copayment is $11 [Figure 9.7].
- Twenty-one percent of these workers are in a plan that limits coverage for prescriptions to generic drugs [Figure 9.9].
- Coinsurance rates for prescription drugs often have maximum and/or minimum dollar amounts associated with the coinsurance rate. Depending on the plan design, coinsurance maximums may significantly limit the amount an enrollee must spend out-of-pocket for higher cost drugs.
- These coinsurance minimum and maximum amounts vary across the tiers.
- For example, among covered workers in a plan with coinsurance for the first cost-sharing tier, 25% have only a maximum dollar amount attached to the coinsurance rate, 8% have only a minimum dollar amount, 18% have both a minimum and maximum dollar amount, and 49% have neither. For those in a plan with coinsurance for the fourth cost-sharing tier, 52% have only a maximum dollar amount attached to the coinsurance rate, 4% have only a minimum dollar amount, 12% have both a minimum and maximum dollar amount, and 33% have neither. [Figure 9.8].
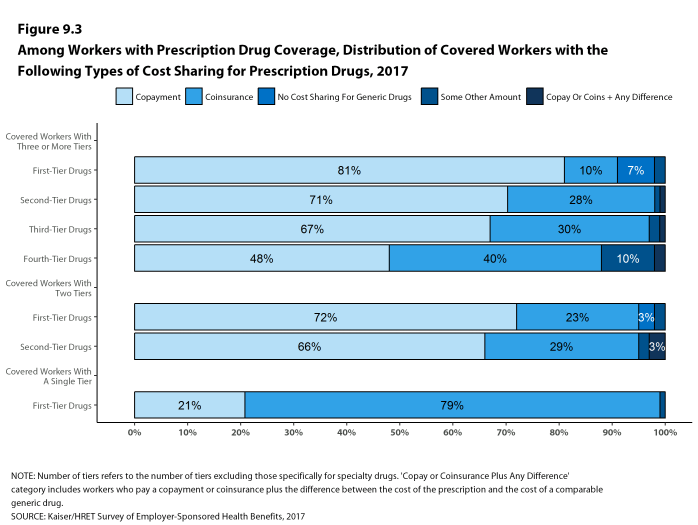
Figure 9.3: Among Workers With Prescription Drug Coverage, Distribution of Covered Workers With the Following Types of Cost Sharing for Prescription Drugs, 2017
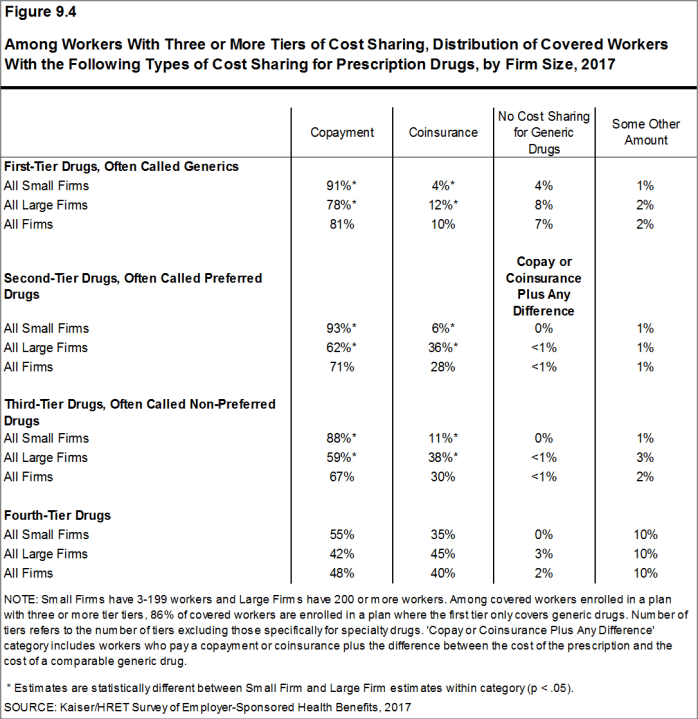
Figure 9.4: Among Workers With Three or More Tiers of Cost Sharing, Distribution of Covered Workers With the Following Types of Cost Sharing for Prescription Drugs, by Firm Size, 2017
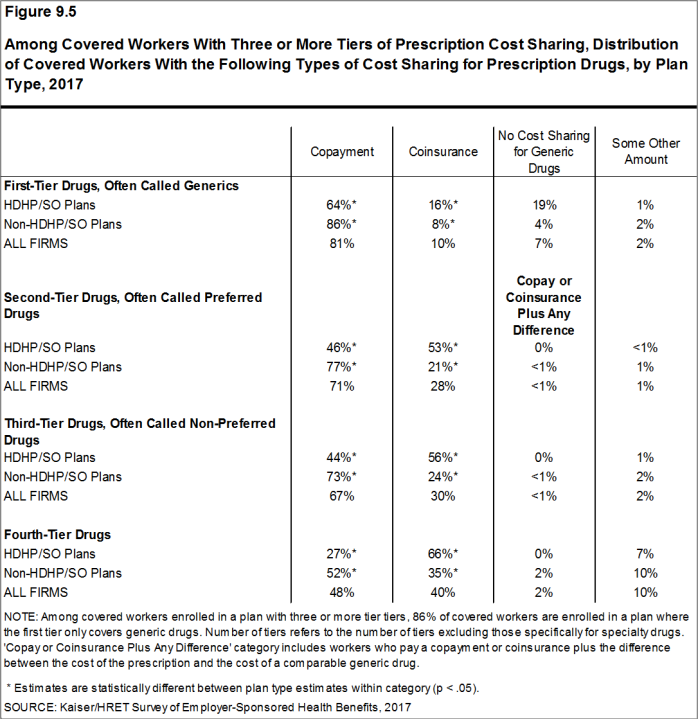
Figure 9.5: Among Covered Workers With Three or More Tiers of Prescription Cost Sharing, Distribution of Covered Workers With the Following Types of Cost Sharing for Prescription Drugs, by Plan Type, 2017
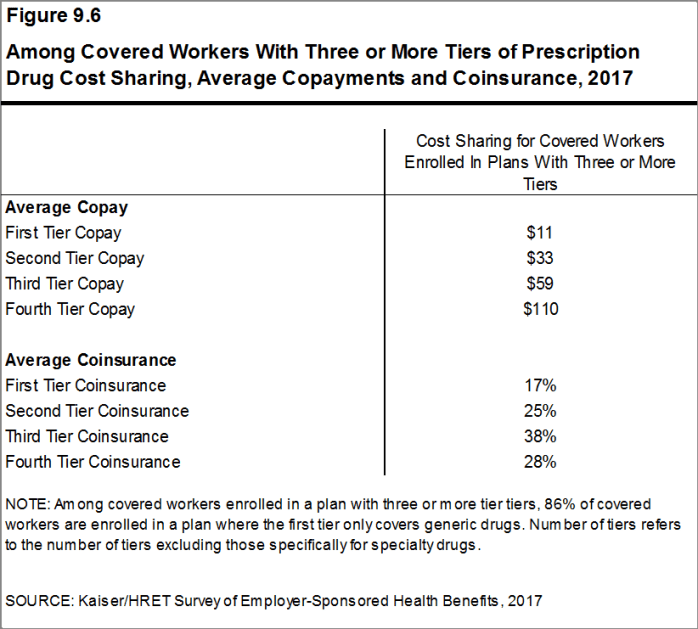
Figure 9.6: Among Covered Workers With Three or More Tiers of Prescription Drug Cost Sharing, Average Copayments and Coinsurance, 2017
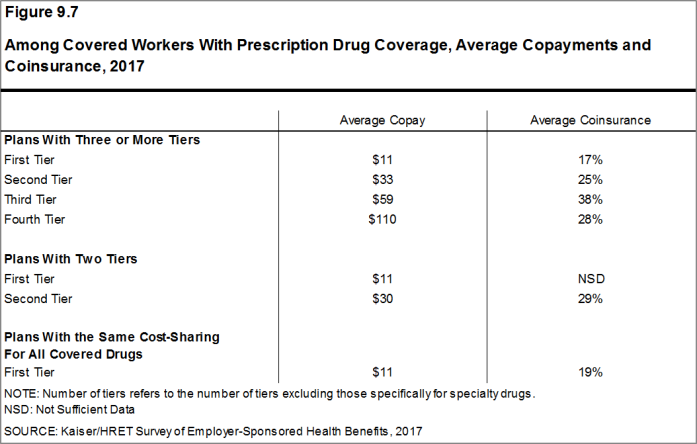
Figure 9.7: Among Covered Workers With Prescription Drug Coverage, Average Copayments and Coinsurance, 2017
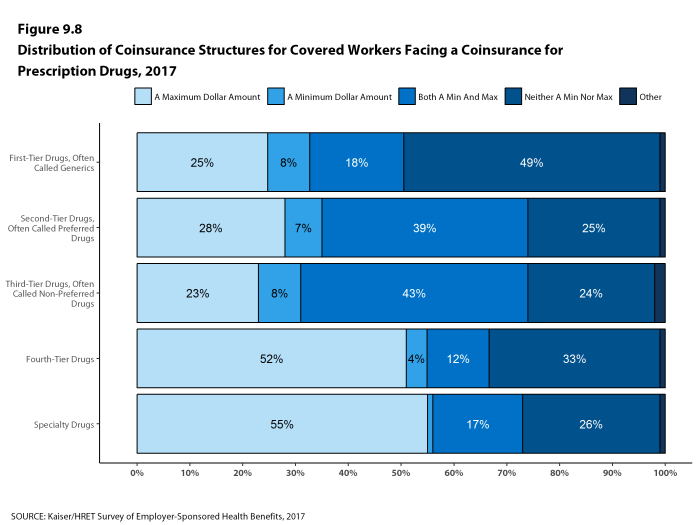
Figure 9.8: Distribution of Coinsurance Structures for Covered Workers Facing a Coinsurance for Prescription Drugs, 2017
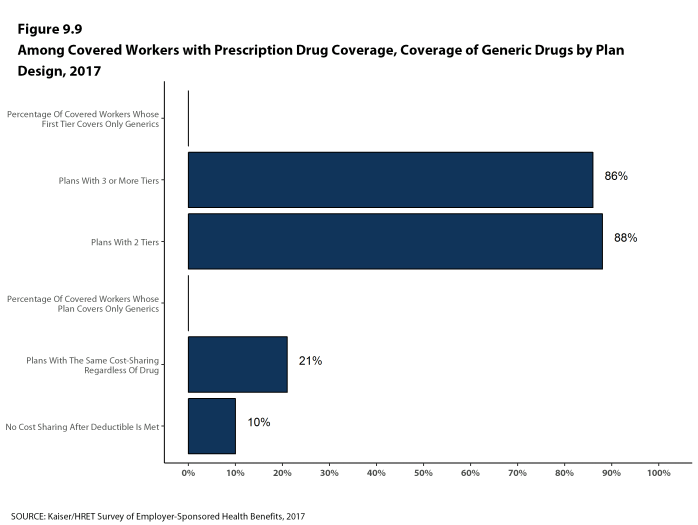
Figure 9.9: Among Covered Workers With Prescription Drug Coverage, Coverage of Generic Drugs by Plan Design, 2017
SPECIALTY DRUGS
- Specialty drugs, such as biologics that may be used to treat chronic conditions or some cancer drugs, can be quite expensive and often require special handling and administration. We revised our questions beginning with the 2016 survey to obtain more information about formulary tiers that are exclusively for specialty drugs. We are reporting results only among large firms because a substantial share of small firms were unsure whether their largest plan covered these drugs.
- Ninety-seven percent of covered workers at large firms have coverage for specialty drugs [Figure 9.10]. Among these workers, 47% are in a plan with at least one cost-sharing tier just for specialty drugs [Figure 9.11].
- Among covered workers in a plan with a separate tier for specialty drugs, 45% have a copayment for specialty drugs and 46% have a coinsurance [Figure 9.12]. The average copayment is $101 and the average coinsurance rate is 27% [Figure 9.13]. Eighty percent of those with a coinsurance have a maximum dollar limit on the amount of coinsurance they must pay.
- Some covered workers are also required to meet a deductible before the plan covers specialty drugs. Among covered workers enrolled in a plan with a deductible and specialty drug coverage, 29% must meet the general annual deductible and 15% must meet a separate drug deductible before specialty drugs are covered [Figure 9.14].
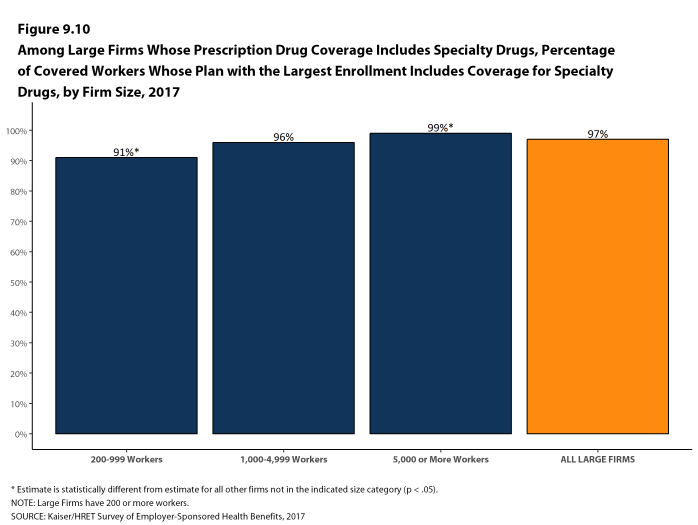
Figure 9.10: Among Large Firms Whose Prescription Drug Coverage Includes Specialty Drugs, Percentage of Covered Workers Whose Plan With the Largest Enrollment Includes Coverage for Specialty Drugs, by Firm Size, 2017
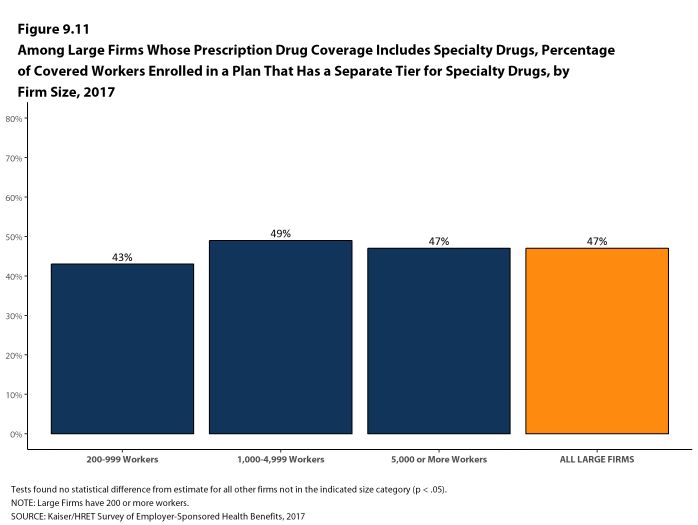
Figure 9.11: Among Large Firms Whose Prescription Drug Coverage Includes Specialty Drugs, Percentage of Covered Workers Enrolled in a Plan That Has a Separate Ties for Specialty Drugs, by Firm Size, 2017
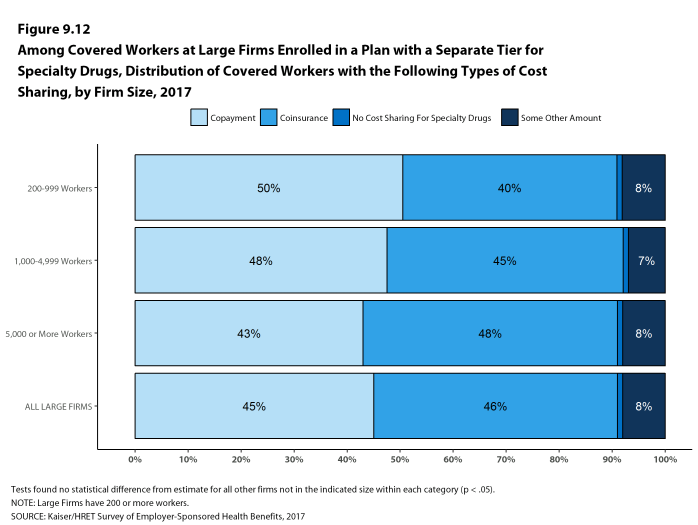
Figure 9.12: Among Covered Works at Large Firms Enrolled in a Plan with a Separate Tier for Specialty Drugs, Distribution of Covered Works with the Following Types of Cost Charing, by Firm Size, 2017
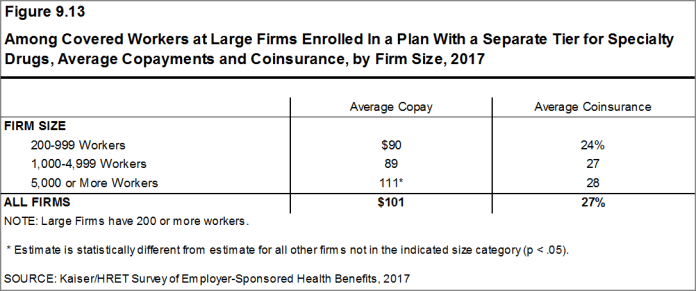
Figure 9.13: Among Covered Workers at Large Firms Enrolled In a Plan With a Separate Tier for Specialty Drugs, Average Copayments and Coinsurance, by Firm Size, 2017
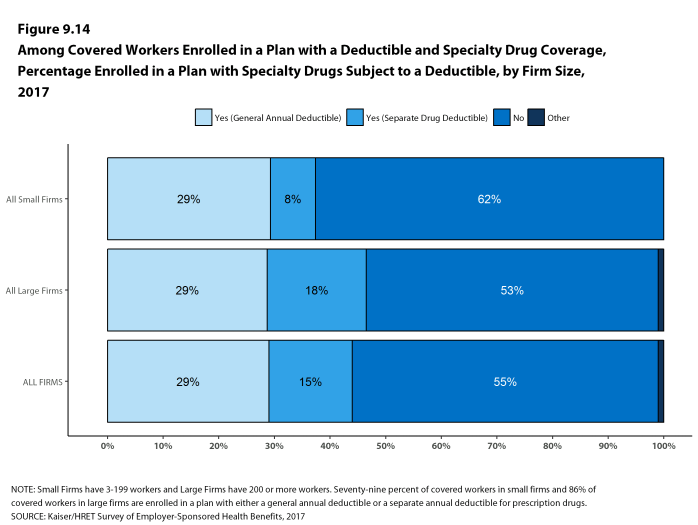
Figure 9.14: Among Covered Workers Enrolled In a Plan With a Deductible and Specialty Drug Coverage, Percentage Enrolled In a Plan With Specialty Drugs Subject to a Deductible, by Firm Size, 2017
SEPARATE ANNUAL DRUG DEDUCTIBLES
- In addition to other cost sharing, some covered workers are also required to meet a separate prescription drug deductible before the plan covers some or all drugs. Fifteen percent of covered workers are in a plan with a separate annual deductible for prescription drugs [Figure 9.15]. These prescription drug deductibles are separate from any general annual deductible and may apply to all or a select number of tiers.
- For 57% of covered workers in firms with a separate deductible for prescription drugs, the deductible applies to all drugs on each of the formulary tiers [Figure 9.16].
- The average annual deductible among covered workers in firms who face a separate annual deductible is $149 [Figure 9.16].
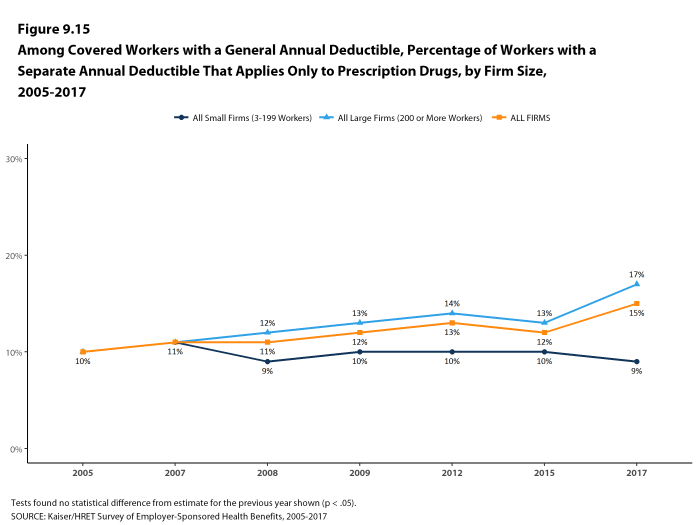
Figure 9.15: Among Covered Workers with a General Annual Deductible, Percentage of Workers with a Separat Annual Deductible That Applies Only to Prescription Drugs, by Firm Size, 2005-2017
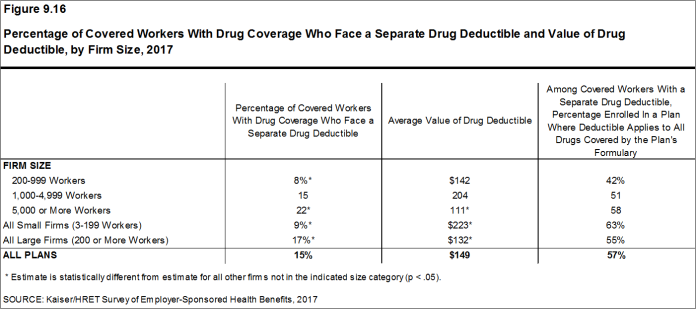
Figure 9.16: Percentage of Covered Workers with Drug Coverage Who Face a Separate Drug Deductible and Value of Drug Deductible, by Firm Size, 2017
- See the Methods Section for more information. In cases in which a firm indicated that one of their tiers was exclusively for specialty drugs, we reported the cost-sharing structure and any copay or coinsurance information under the specialty drug banner. Therefore, a firm that has three tiers of cost sharing may only have plan attributes for the generic and preferred tiers.↩
Section Ten: Plan Funding
Many firms, particularly larger firms, choose to pay for the health services of their workers directly from their own funds rather than by purchasing health insurance for them. This is called self-funding. Federal law (the Employee Retirement Income Security Act of 1974, or ERISA) exempts self-funded plans established by private employers from most state insurance laws, including reserve requirements, mandated benefits, premium taxes, and consumer protection regulations. Sixty percent of covered workers are in a self-funded health plan. Self-funding is common among larger firms because they can spread the risk of costly claims over a large number of workers and dependents.
Many firms with self-funded plans also use insurance, often called stoploss coverage, to limit their liability for very large claims or an unexpected level of expenses. About three-fifths of covered workers in fully or partially self-funded plans are in plans with stoploss insurance.
- Sixty percent of covered workers are in a plan that is completely or partially self-funded, similar to last year [Figures 10.1 and 10.2].
- The percentage of covered workers enrolled in self-funded plans has been stable in recent years across firm sizes [Figure 10.2].
- As expected, covered workers in large firms are significantly more likely to be in a self-funded plan than covered workers in small firms (79% vs. 15%). The percentage of covered workers in self-funded plans increases as the number of workers in a firm increases. Eighty-one percent of covered workers in firms with 1,000 to 4,999 workers and 91% of covered workers in firms with 5,000 or more workers are in self-funded plans in 2017 [Figures 10.1 and 10.4].
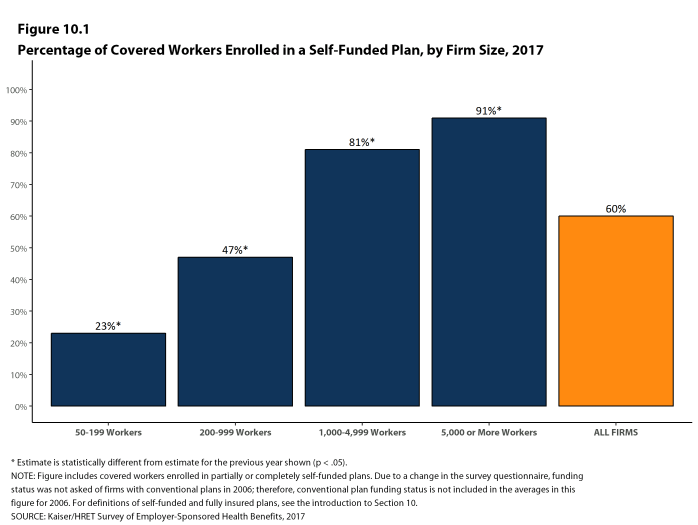
Figure 10.1: Percentage of Covered Workers Enrolled In a Self-Funded Plan, by Firm Size, 2017
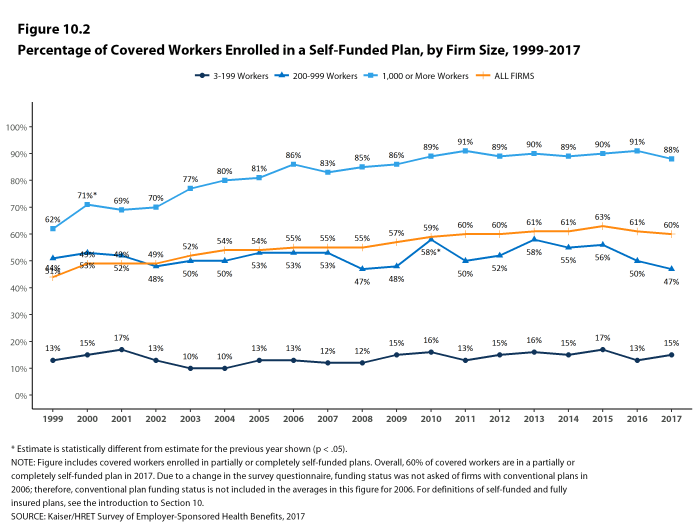
Figure 10.2: Percentage of Covered Workers Enrolled In a Self-Funded Plan, by Firm Size, 1999-2017

Figure 10.3: Percentage of Covered Workers Enrolled In a Self-Funded Plan, by Plan Type, 1999-2017
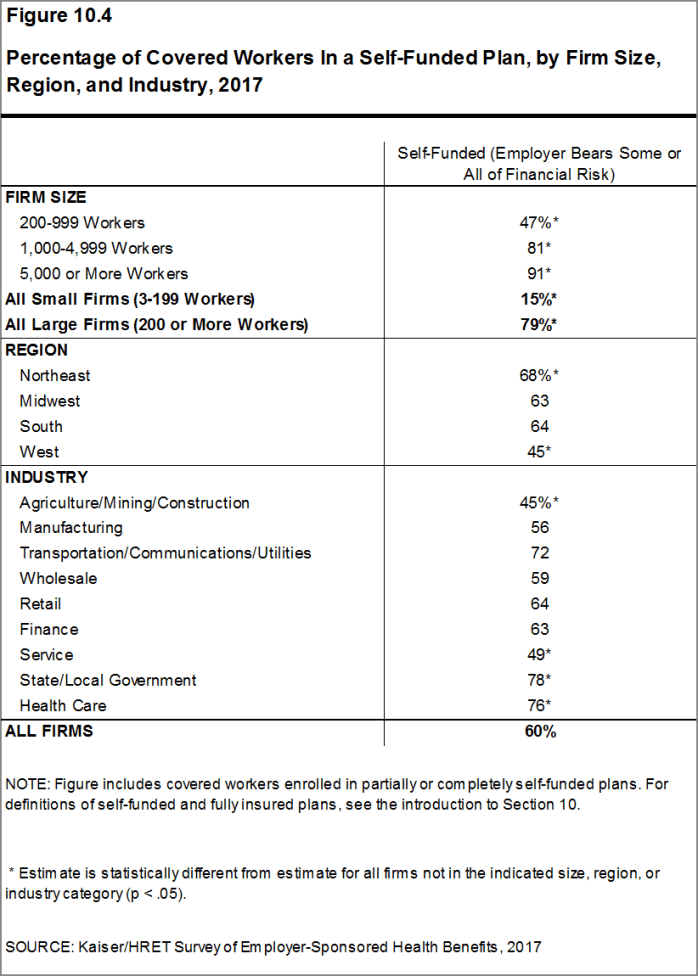
Figure 10.4: Percentage of Covered Workers In a Self-Funded Plan, by Firm Size, Region, and Industry, 2017
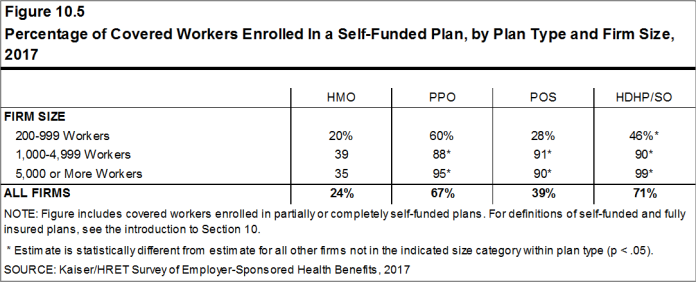
Figure 10.5: Percentage of Covered Workers Enrolled In a Self-Funded Plan, by Plan Type and Firm Size, 2017
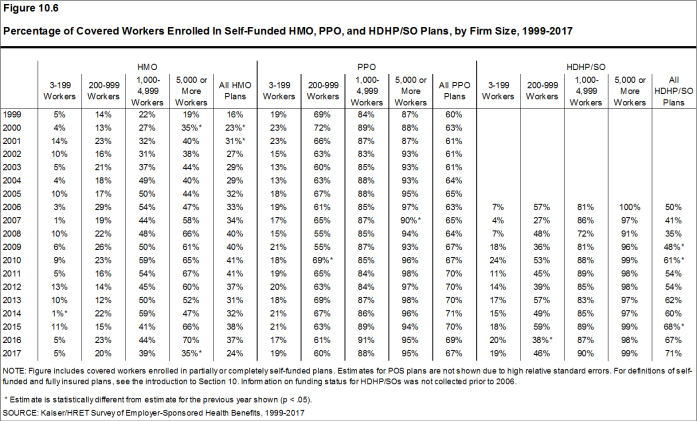
Figure 10.6: Percentage of Covered Workers Enrolled In Self-Funded HMO, PPO, and HDHP/SO Plans, by Firm Size, 1999-2017
STOPLOSS COVERAGE AND ATTACHMENT POINTS
- Fifty-eight percent of covered workers in self-funded health plans are in plans that have stoploss insurance [Figure 10.7]. Stoploss coverage may limit the amount of claims that must be paid for each worker or may limit the total amount the plan sponsor must pay for all claims over the plan year.
- The percentage of covered workers in self-funded plans with stoploss insurance (58%) is similar to the value when the survey first asked about stoploss insurance in 2011 (58%).
- Eighty-eight percent of covered workers in self-funded plans that have stoploss protection are in plans where the stoploss insurance limits the amount that the plan must spend on each worker. This includes stoploss insurance plans that limit a firm’s per-employee spending and plans that limit both a firm’s overall spending and per-employee spending [Figure 10.8].
- Firms with per-enrollee stoploss coverage were asked for the dollar amount where the stoploss coverage would start to pay for most or all of the claim (called an attachment point). The average attachment point in small firms is $80,000. For large firms with a per-person limit, the average attachment point is $340,000 [Figure 10.8].
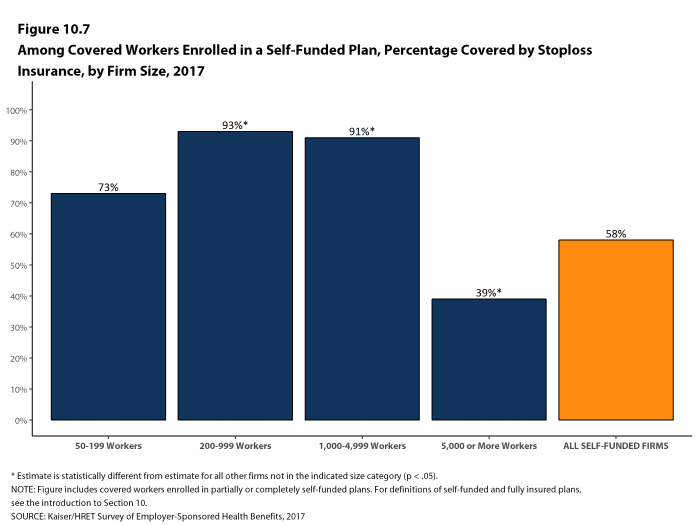
Figure 10.7: Among Covered Workers Enrolled In a Self-Funded Plan, Percentage Covered by Stoploss Insurance, by Firm Size, 2017
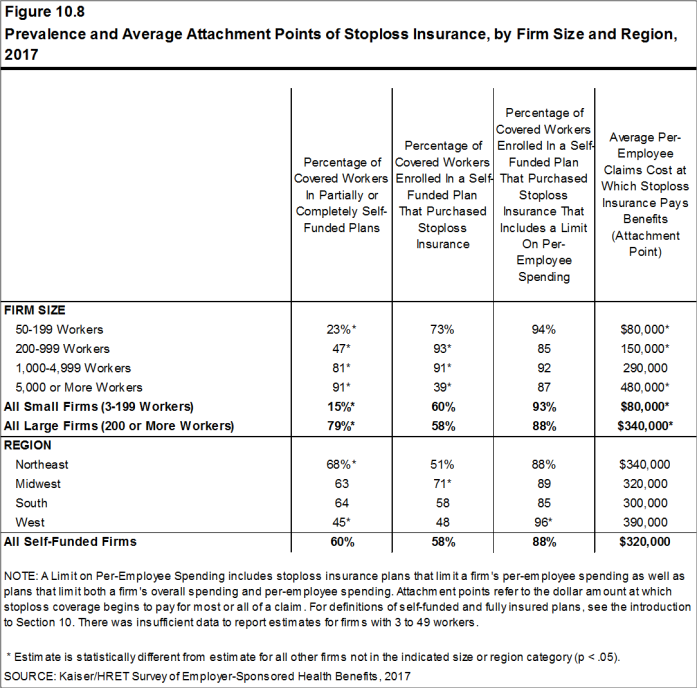
Figure 10.8: Prevalence and Average Attachment Points of Stoploss Insurance, by Firm Size and Region, 2017
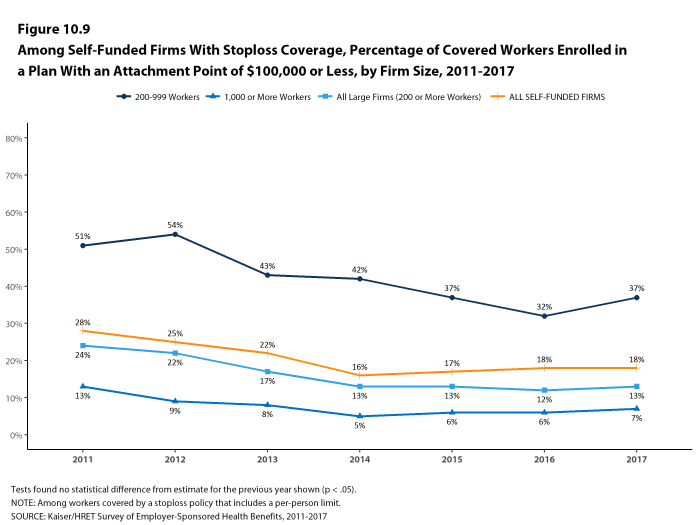
Figure 10.9: Among Self-Funded Firms With Stoploss Coverage, Percentage of Covered Workers Enrolled In a Plan With an Attachment Point of $100,000 or Less, by Firm Size, 2011-2017
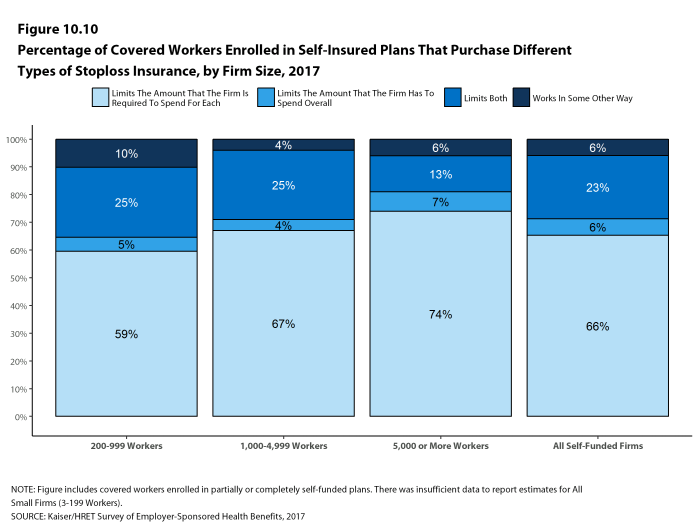
Figure 10.10: Percentage of Covered Workers Enrolled In Self-Insured Plans That Purchase Different Types of Stoploss Insurance, by Firm Size, 2017
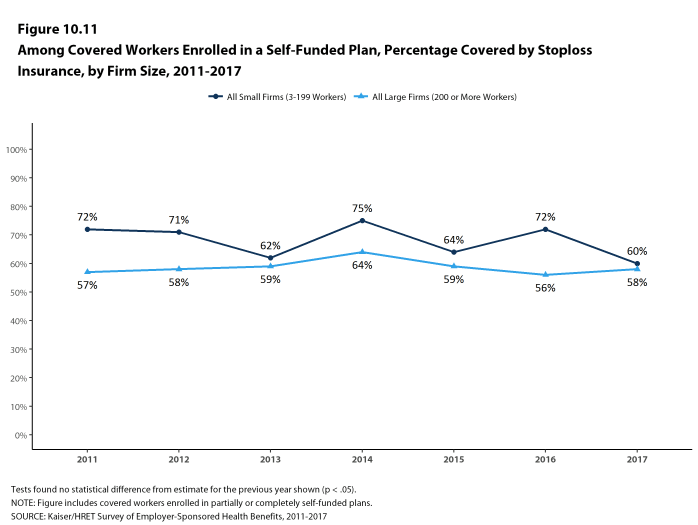
Figure 10.11: Among Covered Workers Enrolled In a Self-Funded Plan, Percentage Covered by Stoploss Insurance, by Firm Size, 2011-2017
Section Eleven: Retiree Health Benefits
Retiree health benefits are an important consideration for older workers making decisions about their retirement. Health benefits for retirees provide an important supplement to Medicare for retirees age 65 or older. Over time, the percentage of firms offering retiree coverage has decreased. This survey asks retiree health benefits questions only of large firms (200 or more workers).
EMPLOYER RETIREE BENEFITS
- In 2017, 25% of large firms that offer health benefits to their workers offer retiree coverage, similar to recent years [Figure 11.1]. However, there has been a downward trend in the percentage of firms offering retirees coverage, from 32% in 2007 and 40% in 1999.
- Retiree health benefits offer rates vary considerably by firm characteristics.
- Among large firms offering health benefits, firms with 200-999 workers are less likely to offer retiree health benefits than firms with 1,000 or more workers (23% vs. 36%) [Figure 11.2].
- The share of large firms offering retiree health benefits varies considerably by industry. State and local governments (73%) and transportation/communication/utilities industries (47%) have higher than average offer rates, while retail (5%) and health care (8%) have lower than average offer rates [Figure 11.2].
- Among large firms offering health benefits, the share of public firms offering retiree benefits (67%) is higher than the shares of private for-profit firms (11%) or private not-for-profit firms (19%) offering retiree benefits [Figure 11.3].
- Large firms with at least some union workers are more likely to offer retiree health benefits than large firms without any union workers (45% vs. 18%) [Figure 11.3].
- Twenty-six percent of large firms offering retiree benefits contribute to those benefits through a contract with a Medicare Advantage plan. Firms with 1,000-4,999 workers are more likely to contribute to retiree benefits through a contract with a Medicare Advantage plan than other large firms (44% vs. 21%) [Figure 11.4].
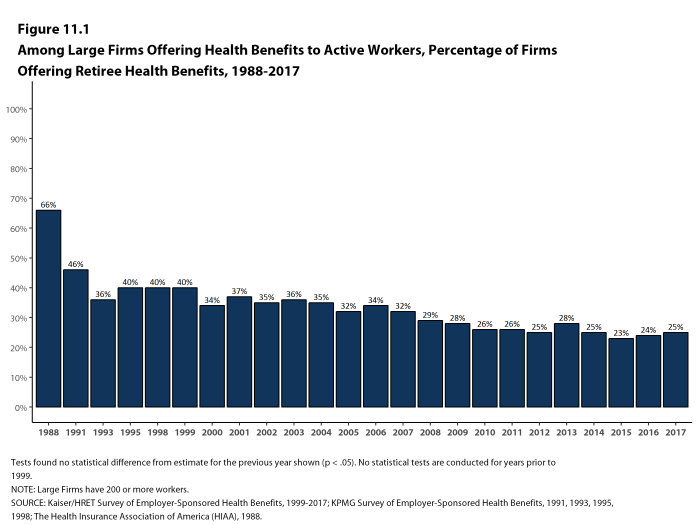
Figure 11.1: Among Large Firms Offering Health Benefits to Active Workers, Percentage of Firms Offering Retiree Health Benefits, 1988-2017
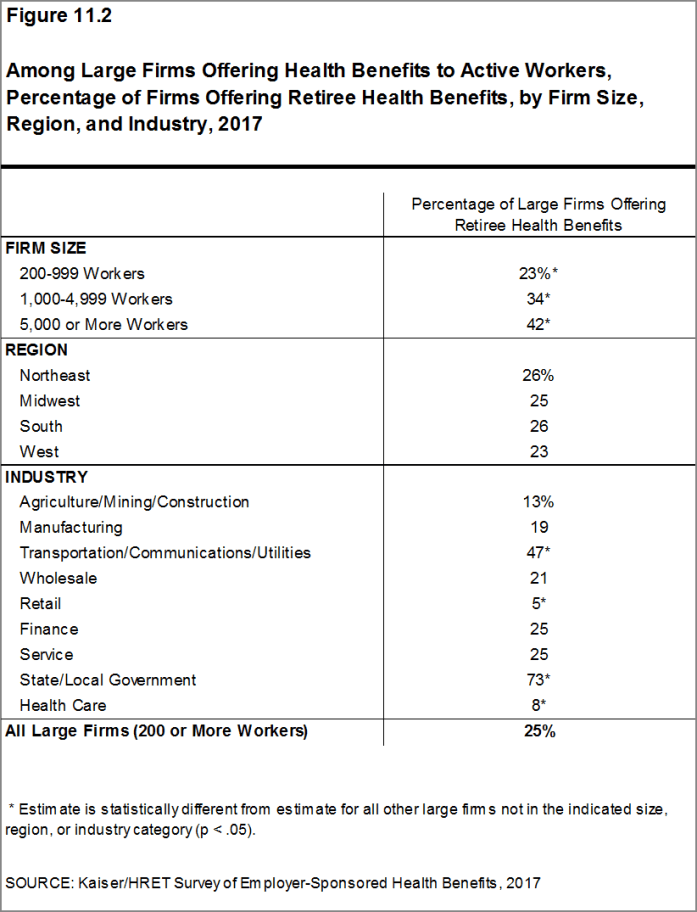
Figure 11.2: Among Large Firms Offering Health Benefits to Active Workers, Percentage of Firms Offering Retiree Health Benefits, by Firm Size, Region, and Industry, 2017
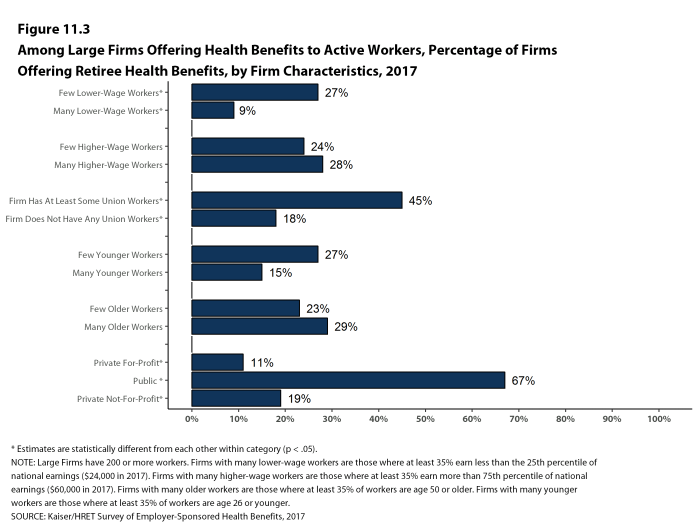
Figure 11.3: Among Large Firms Offering Health Benefits to Active Workers, Percentage of Firms Offering Retiree Health Benefits, by Firm Characteristics, 2017
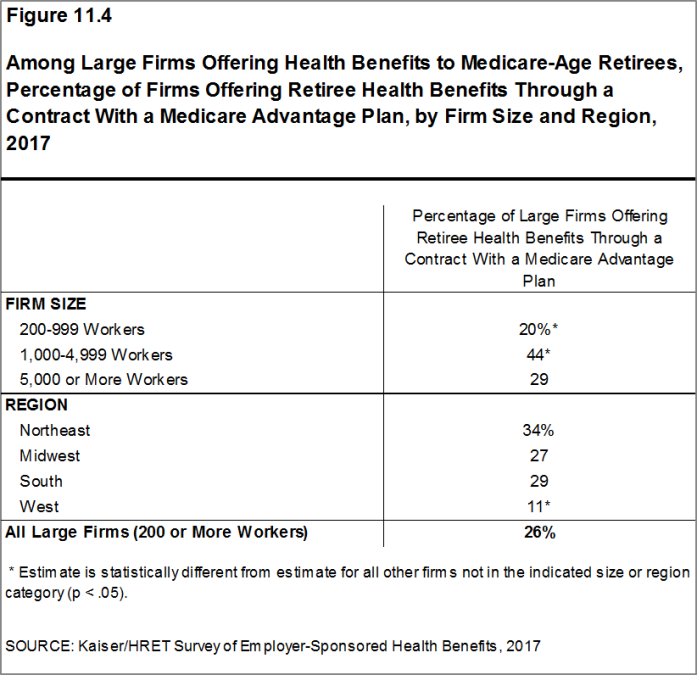
Figure 11.4: Among Large Firms Offering Health Benefits to Medicare-Age Retirees, Percentage of Firms Offering Retiree Health Benefits Through a Contract With a Medicare Advantage Plan, by Firm Size and Region, 2017
EARLY RETIREES AND MEDICARE-AGE RETIREES
- Among large firms offering retiree health benefits, most firms offer to early retirees under the age of 65 (95%). A lower percentage (66%) of large firms offering retiree health benefits offer to Medicare-age retirees. These percentages are similar to those in recent years [Figure 11.5].
- Among all large firms offering retiree health benefits, 61% offer health benefits to both early and Medicare-age retirees.
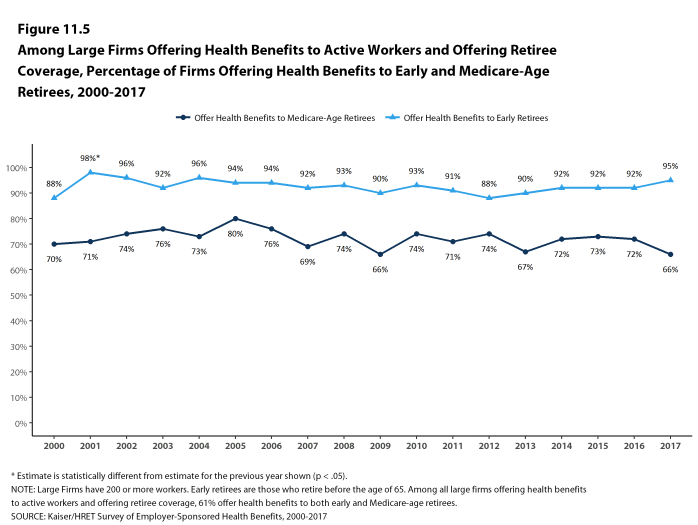
Figure 11.5: Among Large Firms Offering Health Benefits to Active Workers and Offering Retiree Coverage, Percentage of Firms Offering Health Benefits to Early and Medicare-Age Retirees, 2000-2017
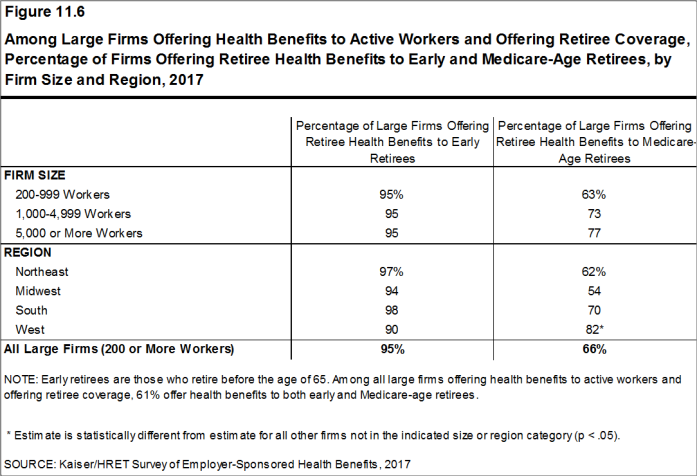
Figure 11.6: Among Large Firms Offering Health Benefits to Active Workers and Offering Retiree Coverage, Percentage of Firms Offering Retiree Health Benefits to Early and Medicare-Age Retirees, by Firm Size and Region, 2017
PRIVATE EXCHANGES
- Private exchanges have received considerable attention over the last several years. They are typically created by a consulting company, broker, or insurer, and are different than the public exchanges created under the Affordable Care Act (ACA). Private exchanges allow employees or retirees from multiple companies to choose from a larger number of health benefit options than one firm would generally provide. Twelve percent of large firms offering retiree health benefits report they offer benefits through a private exchange, similar to the percentage last year (6%) [Figure 11.7]. For more information on the use of private exchanges for active employees, please see Section 14.
- Thirty percent of large firms offering retiree benefits make a defined contribution for retiree health benefits [Figure 11.7]. A defined contribution is a set dollar amount that the retiree can use to purchase a retiree health plan they choose.
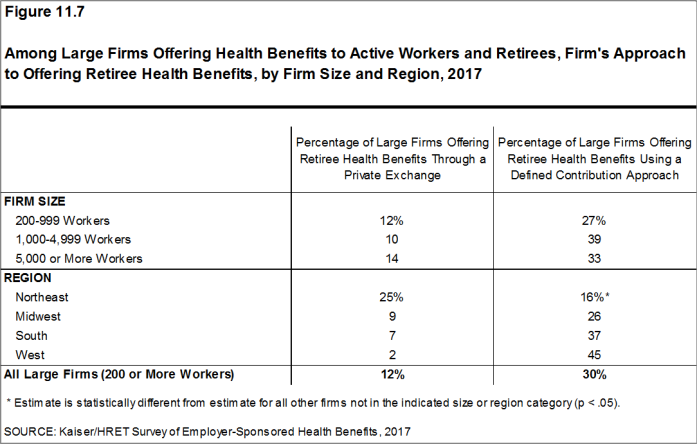
Figure 11.7: Among Large Firms Offering Health Benefits to Active Workers and Retirees, Firm’s Approach to Offering Retiree Health Benefits, by Firm Size and Region, 2017
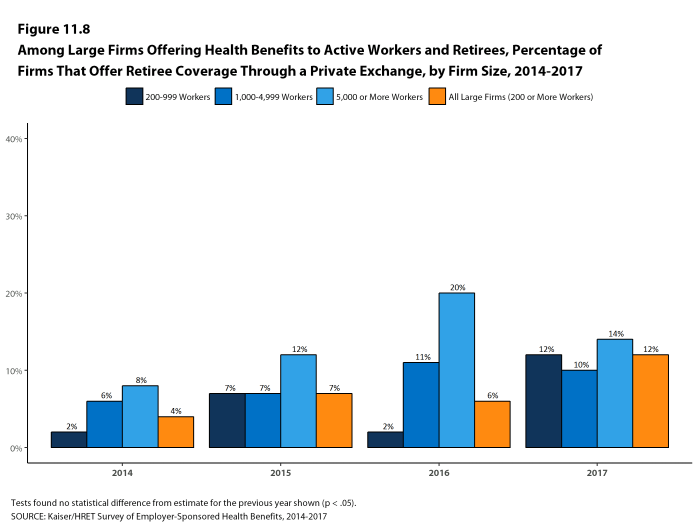
Figure 11.8: Among Large Firms Offering Health Benefits to Active Workers and Retirees, Percentage of Firms That Offer Retiree Coverage Through a Private Exchange, by Firm Size, 2014-2017
Section Twelve: Health And Wellness Programs
Firms continue to show considerable interest in programs that help workers identify health issues and manage chronic conditions. Many employers believe that improving the health of their workers and their family members can improve morale, productivity and reduce health care costs. In addition to wellness programs, many large firms use disease management programs to help workers manage chronic conditions.
In addition to offering wellness programs, a majority of large firms now offer health screening programs, including health risk assessments, which are questionnaires asking workers about lifestyle, stress or physical health, and biometric screening, which we define as in-person health examinations conducted by a medical professional. Firms and insurers may use the health information collected during screenings to target wellness offerings or other health services to workers with certain conditions or behaviors that pose a risk to their health. Some firms have incentive programs that reward or penalize workers for different activities, including participating in wellness programs or completing health screenings.
Only firms offering health benefits were asked about their wellness and health promotion programs. Information about incentives is reported only for large firms (200 or more workers) because many small firm (3-199 workers) respondents do not know this information about their programs. This year’s survey includes new questions about how a firm evaluates its wellness programs and about penalties for workers who use tobacco.
Among large firms offering health benefits in 2017, 62% offer workers the opportunity to complete a health risk assessment, 52% offer workers the opportunity to complete a biometric screening, and 85% offer workers wellness programs such as programs to help them stop smoking or lose weight, or programs that offer lifestyle and behavioral coaching. Substantial shares of these large firms provide incentives for workers to participate in or to complete the programs.
HEALTH RISK ASSESSMENTS
Some firms provide workers the opportunity to complete a health risk assessment to identify potential health issues. Health risk assessments generally include questions about medical history, health status, and lifestyle. At small firms, health risk assessments are typically administered by an insurer.
- Among firms offering health benefits, 38% of small firms and 62% of large firms provide workers the opportunity to complete a health risk assessment [Figure 12.1]. These percentages are similar to the corresponding percentages for 2016 (32% for small firms and 59% for large firms) [Figure 12.2].
- Seventy-eight percent of firms offering health benefits with 5,000 or more workers provide workers the opportunity to complete a health risk assessment, similar to the percentage for 2016 (74%) [Figure 12.1].
- In firms providing workers the opportunity to complete a health risk assessment, 42% of covered workers complete an assessment, similar to the percentage in 2016 [Figure 12.3].
- There is considerable variation across firms in the percentage of workers who complete the assessment. Nineteen percent of large firms providing workers the opportunity to complete a health risk assessment report that more than 75% of their workers complete the assessment, while 45% report no more than 25% of workers complete the assessment.
- Some firms offer incentives to encourage workers to complete a health risk assessment.
- Among large firms that offer a health risk assessment, 52% offer workers an incentive to complete the assessment [Figure 12.4].
- Among large firms offering incentives for workers to complete a health risk assessment, 46% lower premium contributions or reduce cost sharing and 40% offer cash, HSA or HRA contributions, or allow the worker to avoid a payroll deduction [Figure 12.5]. In some firms, workers must complete the assessment to be eligible for other rewards under the firm’s wellness programs. Some firms offer workers more than one type of incentive.
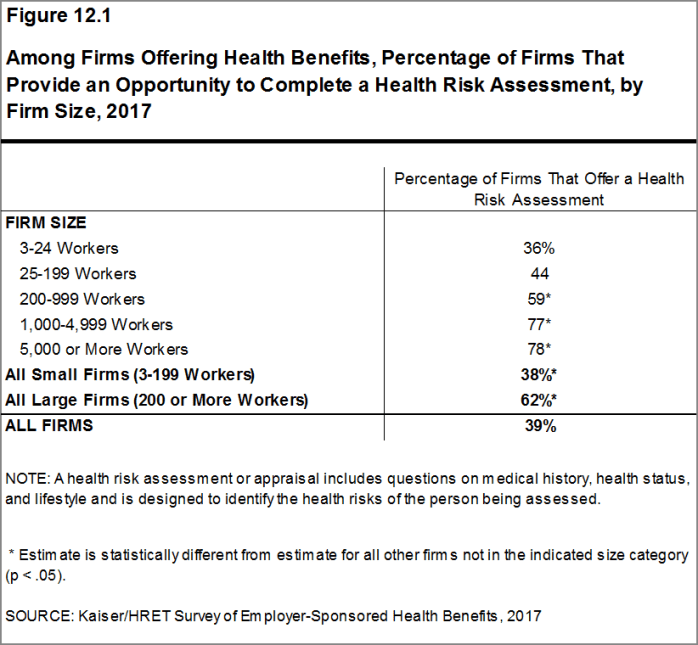
Figure 12.1: Among Firms Offering Health Benefits, Percentage of Firms That Provide an Opportunity to Complete a Health Risk Assessment, by Firm Size, 2017
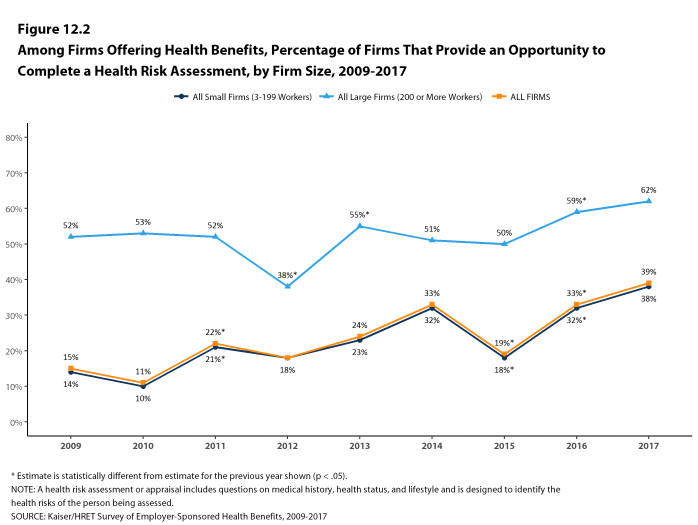
Figure 12.2: Among Firms Offering Health Benefits, Percentage of Firms That Provide an Opportunity to Complete a Health Risk Assessment, by Firm Size, 2009-2017
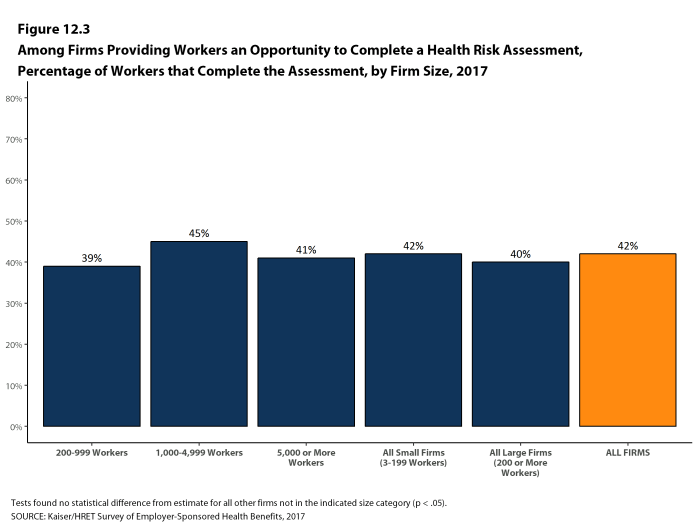
Figure 12.3: Among Firms Providing Workers an Opportunity to Complete a Health Risk Assessment, Percentage of Workers That Complete the Assessment, by Firm Size, 2017
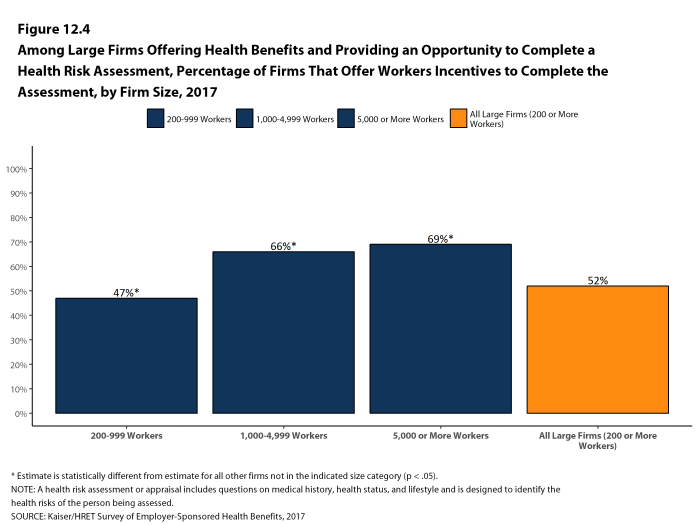
Figure 12.4: Among Large Firms Offering Health Benefits and Providing an Opportunity to Complete a Health Risk Assessment, Percentage of Firms That Offer Workers Incentives to Complete the Assessment, by Firm Size, 2017
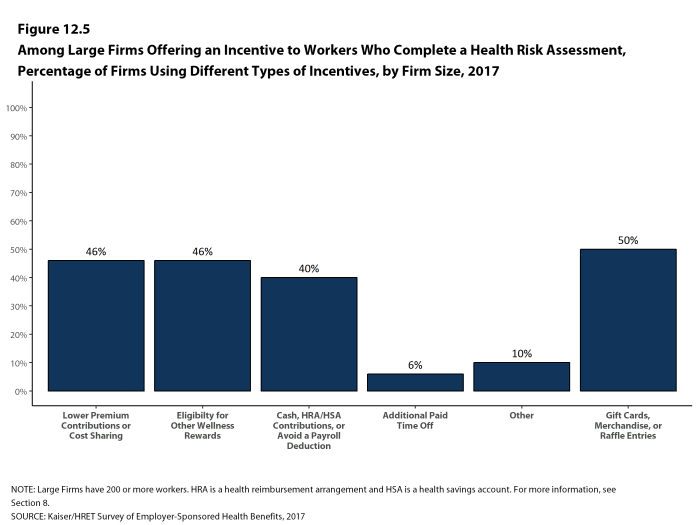
Figure 12.5: Among Large Firms Offering an Incentive to Workers Who Complete a Health Risk Assessment, Percentage of Firms Using Different Types of Incentives, by Firm Size, 2017
BIOMETRIC SCREENING
Biometric screening is a health examination that measures a person’s risk factors (such as cholesterol, blood pressure, and body mass index (BMI)) for certain medical issues. A biometric outcome involves assessing whether an enrollee meets specified health targets related to certain risk factors, such as meeting a target BMI or cholesterol level. As defined by this survey, goals related to smoking are not included in the biometric screening questions.
- Among firms offering health benefits, 21% of small firms and 52% of large firms provide workers the opportunity to complete a biometric screening [Figure 12.6]. These percentages are similar to 2016 (20% and 53%) [Figure 12.7].
- In firms providing workers the opportunity to complete a biometric screening, 41% of covered workers complete a screening [Figure 12.8].
- There is considerable variation across firms in the percentage of workers who complete a biometric screening. Twenty-two percent of large firms providing workers the opportunity to complete a biometric screening report that more than 75% of their workers complete the screening, while 26% report no more than 25% of workers complete the screening.
- Firms that provide workers the opportunity to complete a biometric screening may include additional incentives for those workers who do so.
- Among large firms with biometric screening programs, 53% offer workers an incentive to complete the screening [Figure 12.10]. The likelihood of a firm with a biometric screening program offering an incentive to complete a biometric screening increases with firm size [Figure 12.10]. Some firms report offering more than one type of incentive.
- Among large firms with an incentive for workers to complete a biometric screening, 49% lower premium contributions or reduce cost sharing and 33% offer cash, HRA or HSA contributions, or allow the worker to avoid a payroll deduction. As with incentives for health risk assessments, workers in some firms must complete the biometric screening to be eligible for other rewards under the firm’s wellness programs [Figure 12.11].
- In addition to incentives for completing a biometric screening, some firms offer workers incentives to meet biometric outcomes. Among large firms with biometric screening programs, 14% reward or penalize workers based on achieving specified biometric outcomes (such as meeting a target BMI) [Figure 12.10].
- The size of the incentives firms offer for meeting biometric outcomes varies considerably. Among large firms offering a reward or penalty for meeting biometric outcomes, the maximum reward is valued at $150 or less for 9% of firms and more than $1,000 for 17% of firms [Figure 12.12]. Twenty-three percent of these firms combine the reward with incentives for other activities.
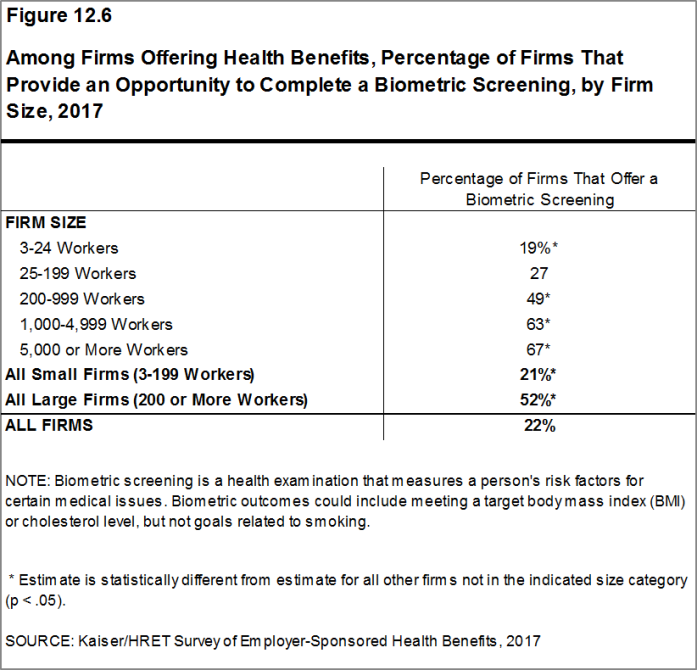
Figure 12.6: Among Firms Offering Health Benefits, Percentage of Firms That Provide an Opportunity to Complete a Biometric Screening, by Firm Size, 2017
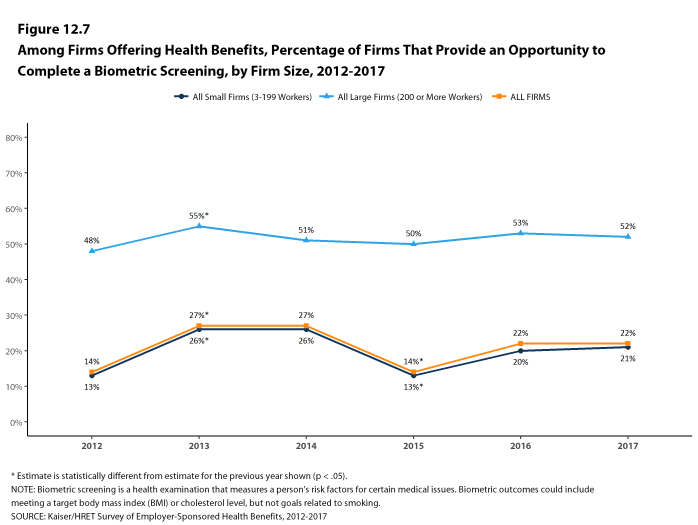
Figure 12.7: Among Firms Offering Health Benefits, Percentage of Firms That Provide an Opportunity to Complete a Biometric Screening, by Firm Size, 2012-2017
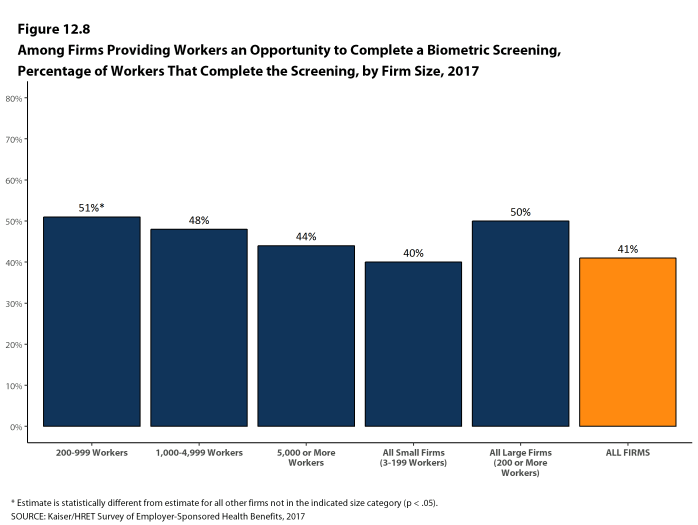
Figure 12.8: Among Firms Providing Workers an Opportunity to Complete a Biometric Screening, Percentage of Workers That Complete the Screening, by Firm Size, 2017
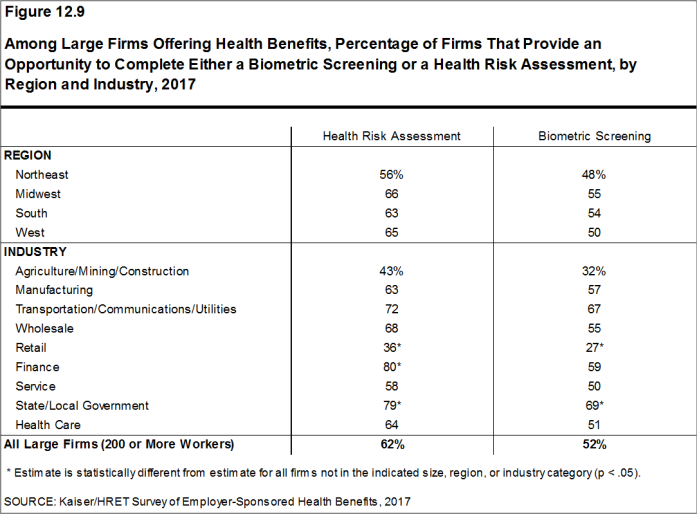
Figure 12.9: Among Large Firms Offering Health Benefits, Percentage of Firms That Provide an Opportunity to Complete Either a Biometric Screening or a Health Risk Assessment, by Region and Industry, 2017
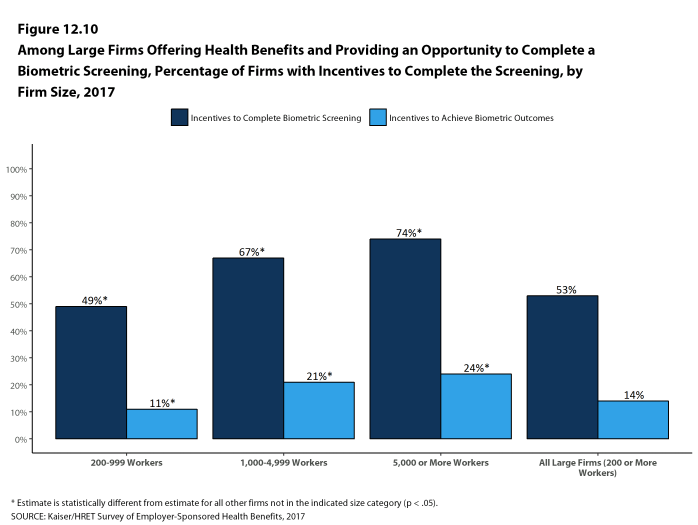
Figure 12.10: Among Large Firms Offering Health Benefits and Providing an Opportunity to Complete a Biometric Screening, Percentage of Firms With Incentives to Complete the Screening, by Firm Size, 2017
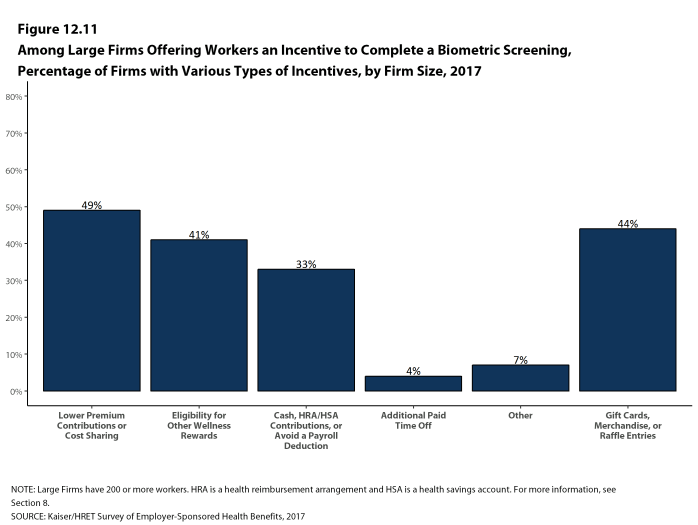
Figure 12.11: Among Large Firms Offering Workers an Incentive to Complete a Biometric Screening, Percentage of Firms With Various Types of Incentives, by Firm Size, 2017
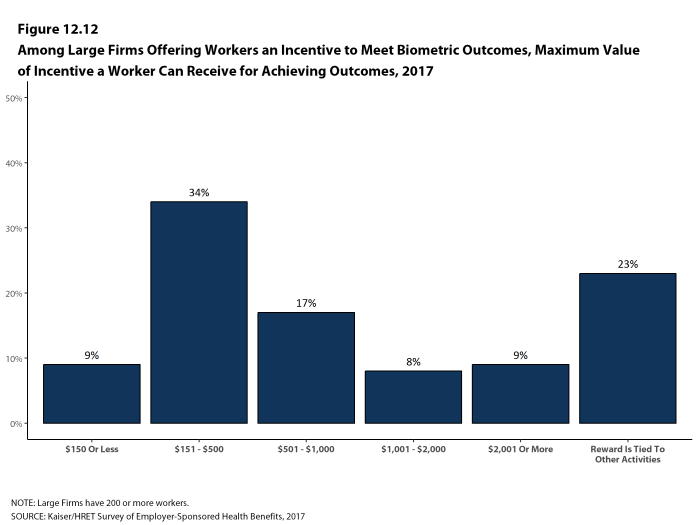
Figure 12.12: Among Large Firms Offering Workers an Incentive to Meet Biometric Outcomes, Maximum Value of Incentive a Worker Can Receive for Achieving Outcomes, 2017
ADMINISTRATION OF HEALTH SCREENING PROGRAMS
Among firms offering health benefits, 44% of small firms and 69% of large firms offer workers a health risk assessment, biometric screening or both screening programs. The scope and administration of screening programs vary considerably across firms, and some firms use different administrators for different programs.
- Among firms that offer a health screening program, an insurer or third-party administrator administers some health screening programs at 87% of firms, third party vendors, such as wellness providers, administer some screening programs at 29% of firms, and the firm itself administers some health screening programs at 9% of firms [Figure 12.13].
- Thirty-seven percent of large firms offering health benefits have an incentive for workers to complete biometric screening or a health risk assessment. Among large firms with an incentive for either health screening program, 34% have incentives for workers not enrolled in the health plan and 49% have incentives for spouses enrolled as dependents in the plan [Figure 12.14].
- Among firms offering health benefits, 8% of small firms and 14% of large firms collect information from workers’ wearable devices, such as a Fitbit or Apple Watch, as part of their wellness or health promotion program [Figure 12.15].
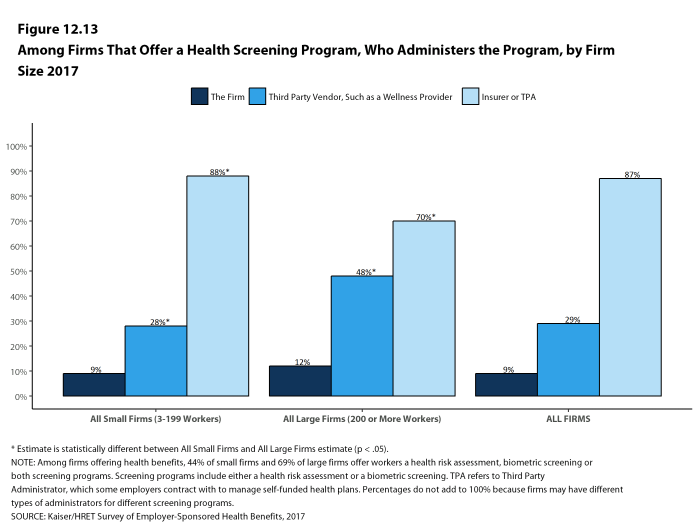
Figure 12.13: Among Firms That Offer a Health Screening Program, Who Administers the Program, by Firm Size 2017
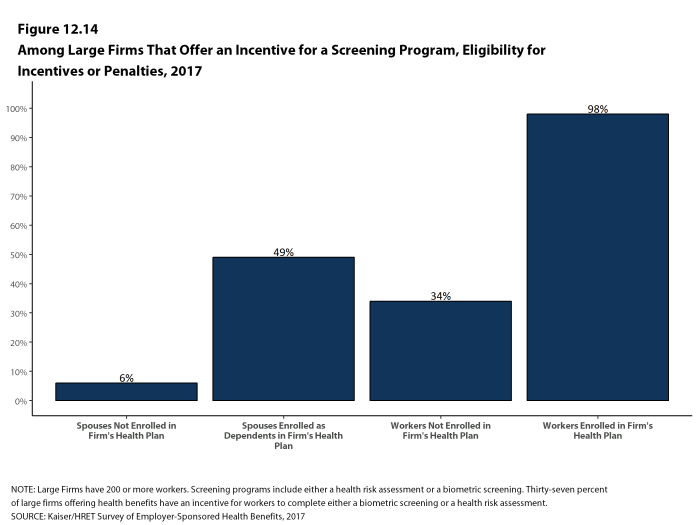
Figure 12.14: Among Large Firms That Offer an Incentive for a Screening Program, Eligibility for Incentives or Penalties, 2017
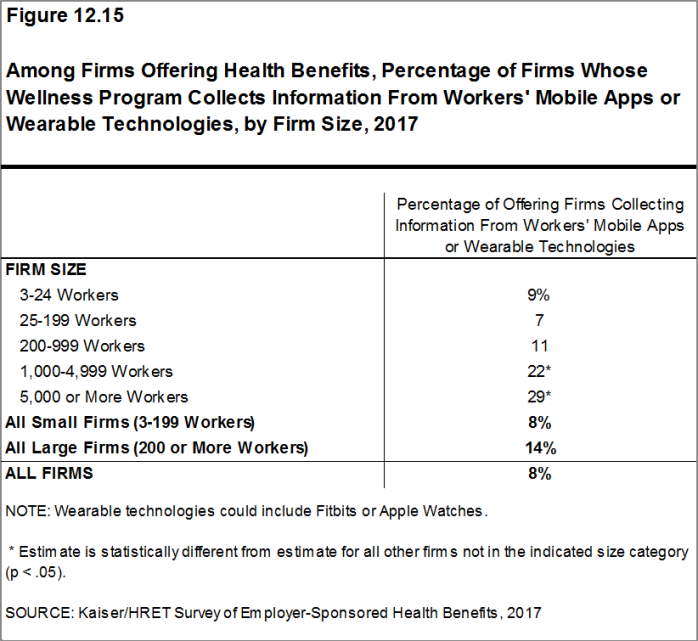
Figure 12.15: Among Firms Offering Health Benefits, Percentage of Firms Whose Wellness Program Collects Information From Workers’ Mobile Apps or Wearable Technologies, by Firm Size, 2017
WELLNESS AND HEALTH PROMOTION PROGRAMS
Many firms and health plans offer programs to help workers engage in healthy lifestyles and reduce health risks. Wellness and health promotion programs may include exercise programs, health education classes, and stress-management counseling. These programs may be offered directly by the firm, an insurer, or a third-party contractor.
- Among firms offering health benefits, 40% of small firms and 72% of large firms offer programs to help workers stop smoking, 34% of small firms and 67% of large firms offer programs to help workers lose weight, and 47% of small firms and 72% of large firms offer some other lifestyle or behavioral coaching program. Fifty-eight percent of small firms and 85% of large firms offering health benefits offer at least one of these three programs [Figures 12.16 and 12.17].
- To encourage participation in wellness programs, firms may offer incentives to workers who participate in or complete wellness programs.
- Thirty-two percent of large firms offering one of these wellness or health promotion programs offer an incentive to encourage workers to participate in or complete the programs [Figure 12.18]. Forty-six percent of firms with more than 5,000 workers offering one of these wellness or health promotion programs offer an incentive to participate in or complete the programs.
- Among large firms offering incentives to workers to participate in or complete wellness or health promotion programs, 19% lower premium contributions or reduce cost sharing and 37% offer cash , HSA or HRA contributions, or allow the worker to avoid a payroll deduction [Figure 12.19].
- Firms with incentives for health risk assessments, biometric screening, or wellness or health promotion programs were asked to report the maximum reward or penalty a worker could earn for all of the firm’s health promotion activities combined. Some firms do not offer incentives for individual activities, but offer rewards to workers who complete a variety of activities. Among large firms offering incentives for any of these programs, the maximum value for all wellness-related incentives is $150 or less in 25% of firms and more than $1,000 in 19% of firms [Figure 12.20].
- Firms with incentives for health risk assessments, biometric screening, or wellness or health promotion programs were also asked how effective they believed incentives were for encouraging participation. Thirty-four percent of large firms offering incentives for any one of these programs said the incentives are “very effective” at encouraging workers to participate and 58% said the incentives are “somewhat effective”, while 7% said the incentives are “not at all effective” [Figure 12.21].
- Firms offering a health screening program or a wellness program use a variety of metrics to evaluate their health promotion programs, including participation, employee satisfaction, and return on investment [Figure 12.23].
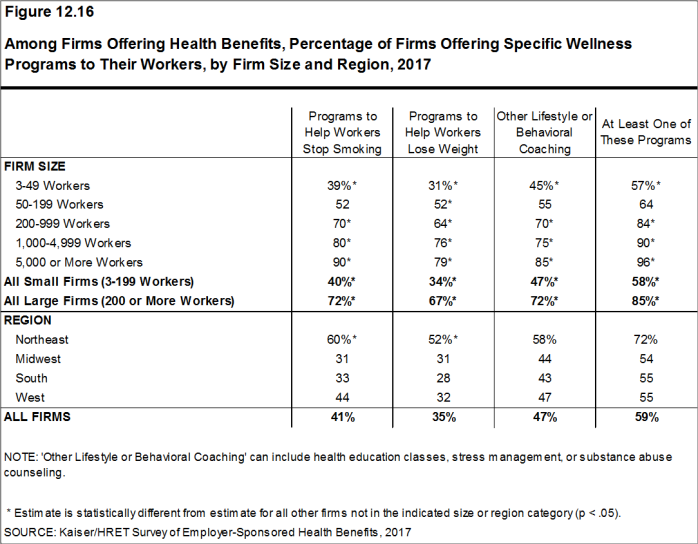
Figure 12.16: Among Firms Offering Health Benefits, Percentage of Firms Offering Specific Wellness Programs to Their Workers, by Firm Size and Region, 2017
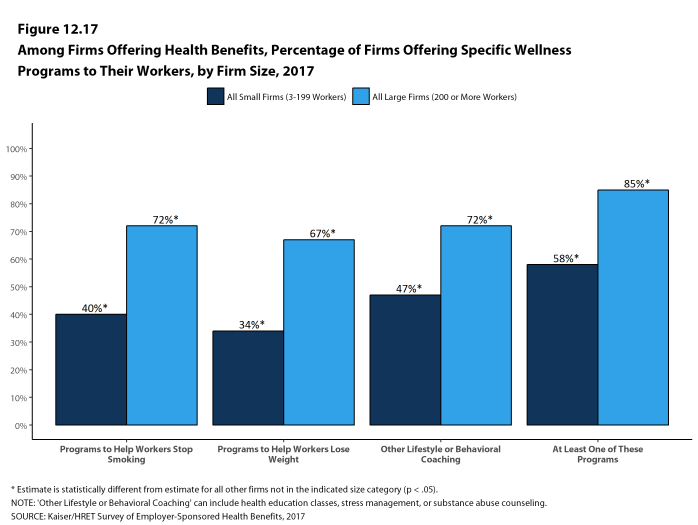
Figure 12.17: Among Firms Offering Health Benefits, Percentage of Firms Offering Specific Wellness Programs to Their Workers, by Firm Size, 2017
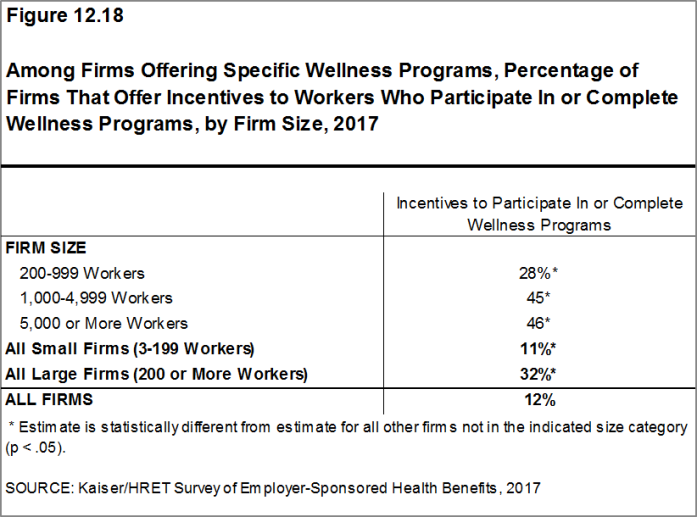
Figure 12.18: Among Firms Offering Specific Wellness Programs, Percentage of Firms That Offer Incentives to Workers Who Participate In or Complete Wellness Programs, by Firm Size, 2017
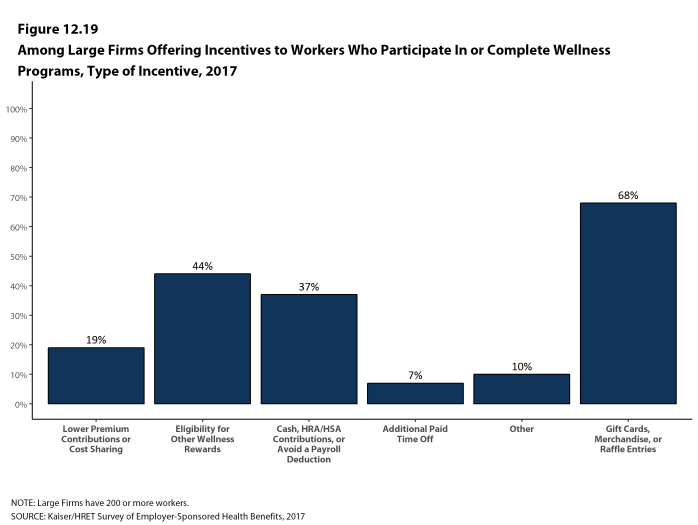
Figure 12.19: Among Large Firms Offering Incentives to Workers Who Participate In or Complete Wellness Programs, Type of Incentive, 2017

Figure 12.20: Among Large Firms That Offer Workers an Incentive to Participate In or Complete Any Health Promotion Programs, Maximum Annual Value of the Incentive for All Programs Combined, 2017
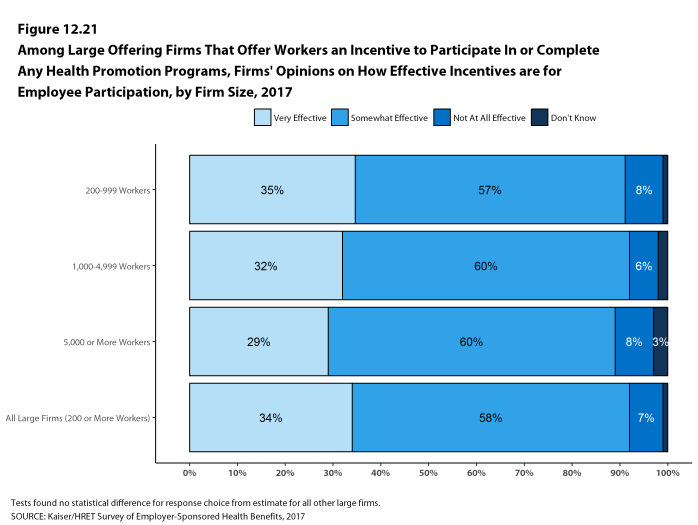
Figure 12.21: Among Large Offering Firms That Offer Workers an Incentive to Participate In or Complete Any Health Promotion Programs, Firms’ Opinions On How Effective Incentives Are for Employee Participation, by Firm Size, 2017
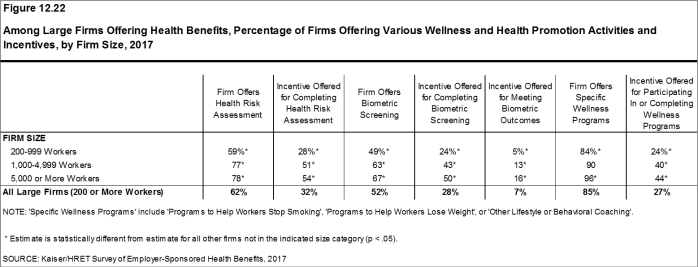
Figure 12.22: Among Large Firms Offering Health Benefits, Percentage of Firms Offering Various Wellness and Health Promotion Activities and Incentives, by Firm Size, 2017
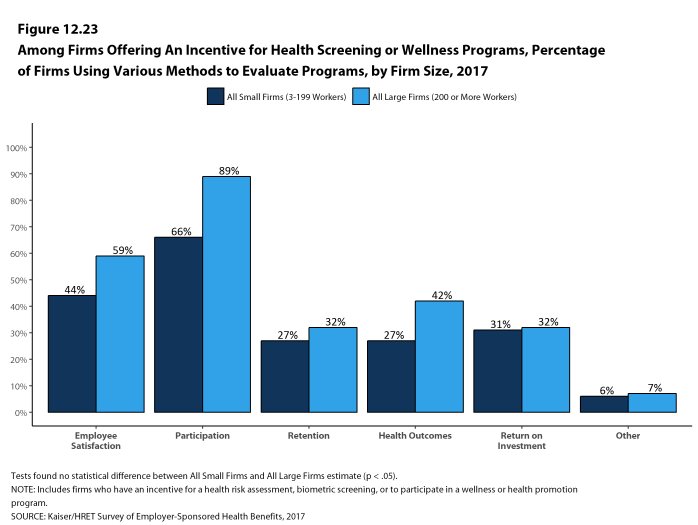
Figure 12.23: Among Firms Offering an Incentive for Health Screening or Wellness Programs, Percentage of Firms Using Various Methods to Evaluate Programs, by Firm Size, 2017
DISEASE MANAGEMENT
Disease management programs aim to improve health and reduce costs for enrollees with chronic illnesses by educating them about their disease and suggesting treatment options. These programs can help enrollees with conditions such as diabetes, asthma, hypertension, and high cholesterol.
- Forty-one percent of firms that offer health benefits offer disease management programs. Large firms are more likely than small firms to offer disease management programs (68% vs. 40%) [Figure 12.24].
- Nine percent of large firms that offer disease management programs offer incentives for workers to participate in or complete the programs. This percentage is highest among firms with 5,000 or more workers (26%) [Figure 12.26].
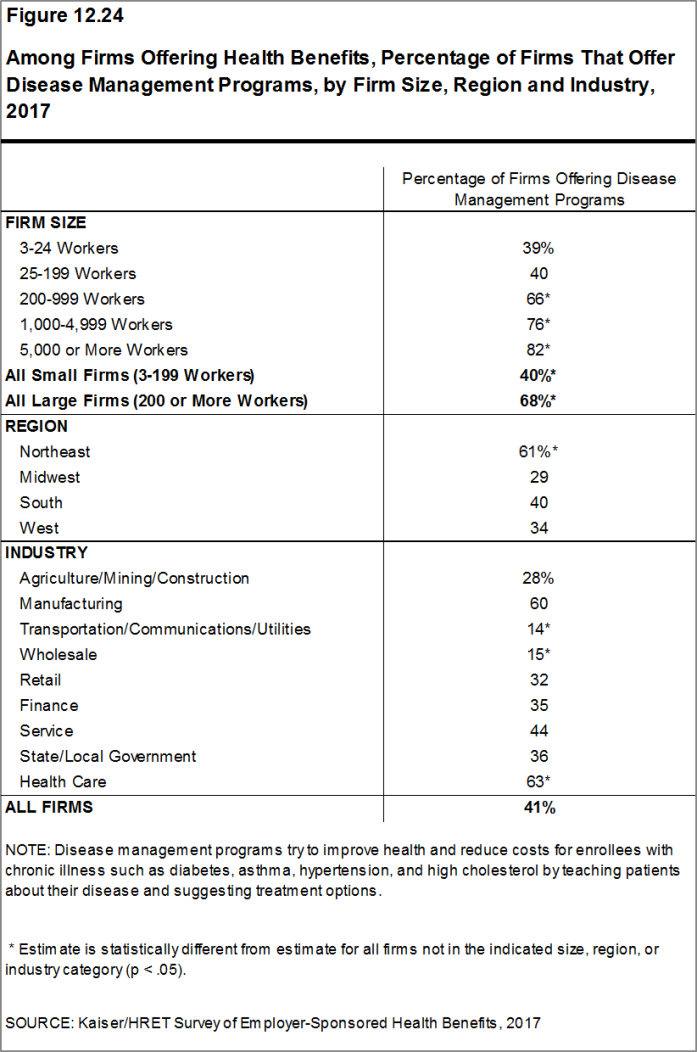
Figure 12.24: Among Firms Offering Health Benefits, Percentage of Firms That Offer Disease Management Programs, by Firm Size, Region and Industry, 2017
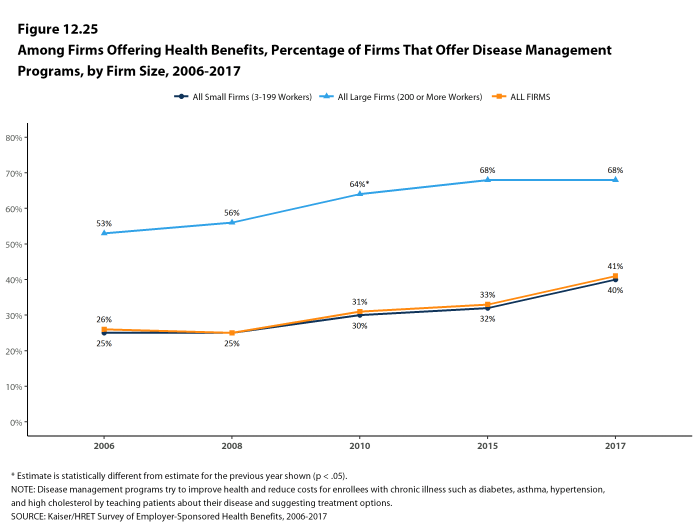
Figure 12.25: Among Firms Offering Health Benefits, Percentage of Firms That Offer Disease Management Programs, by Firm Size, 2006-2017
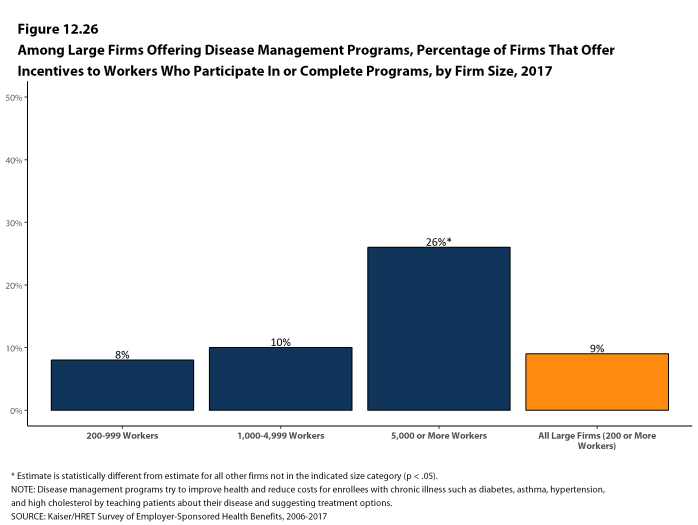
Figure 12.26: Among Large Firms Offering Disease Management Programs, Percentage of Firms That Offer Incentives to Workers Who Participate In or Complete Programs, by Firm Size, 2017
PENALTIES FOR TOBACCO USE
- Among firms offering health benefits, 16% of small firms and 14% of large firms, including 49% of firms with 5,000 or more workers, require higher premium contributions or cost sharing from workers who use tobacco [Figure 12.27]. Some firms noted that not smoking is a condition of employment.
- Among firms with higher costs for workers who use tobacco, virtually all firms rely on self-reporting, including through a health risk assessment, to determine whether a worker uses tobacco [Figure 12.28].
- Among large firms with higher costs for workers who use tobacco, 56% indicate that dependents also have higher premium contributions or cost sharing if they use tobacco [Figure 12.29].
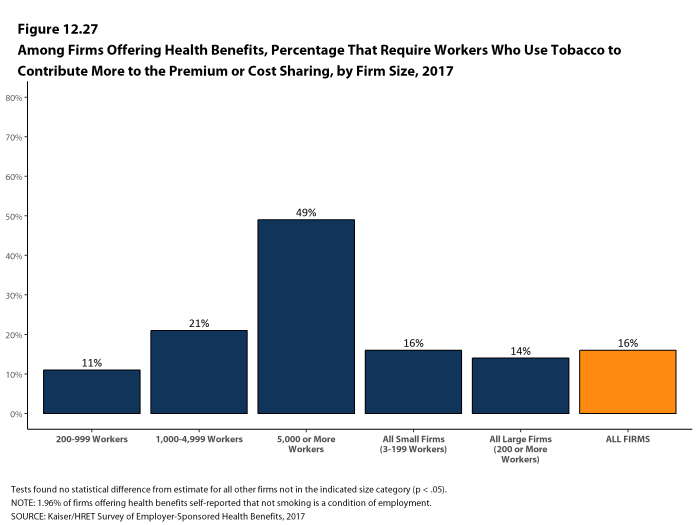
Figure 12.27: Among Firms Offering Health Benefits, Percentage That Require Workers Who Use Tobacco to Contribute More to the Premium or Cost Sharing, by Firm Size, 2017
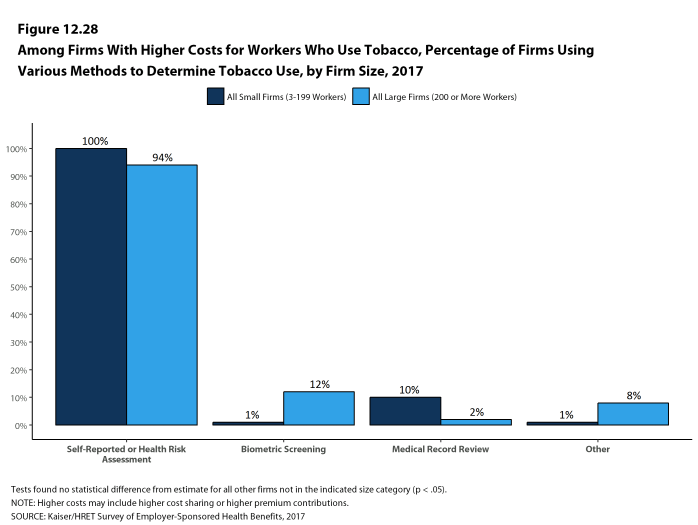
Figure 12.28: Among Firms With Higher Costs for Workers Who Use Tobacco, Percentage of Firms Using Various Methods to Determine Tobacco Use, by Firm Size, 2017
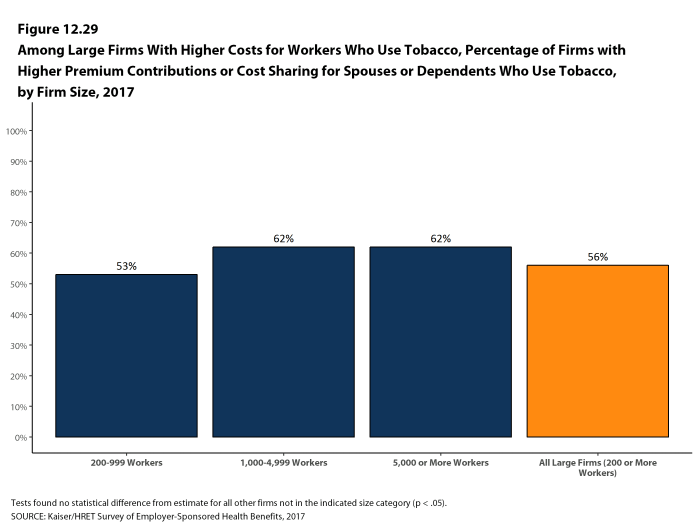
Figure 12.29: Among Large Firms With Higher Costs for Workers Who Use Tobacco, Percentage of Firms With Higher Premium Contributions or Cost Sharing for Spouses or Dependents Who Use Tobacco, by Firm Size, 2017
Section Thirteen: Grandfathered Health Plans
The Affordable Care Act (ACA) exempts certain health plans that were in effect when the law was passed, referred to as grandfathered plans, from some standards in the law, including the requirement to cover preventive benefits without cost sharing, have an external appeals process, or comply with the new benefit and rating provisions in the small group market. In 2017, 23% of firms offering health benefits offer at least one grandfathered health plan, and 17% of covered workers are enrolled in a grandfathered plan.
As in years past, some firms had difficulty with the details of the term “grandfathering”, as described in the provisions of the ACA. We would note that smaller firms in particular appeared to have some confusion about whether or not they are grandfathered. Many smaller firms, even those offering a health plan in effect in March 2010 (when the ACA was enacted), were unsure about whether their plan was grandfathered.
- Twenty-three percent of offering firms report having at least one grandfathered plan in 2017, unchanged from 23% in 2016 [Figure 13.1].
- Seventeen percent of covered workers are enrolled in a grandfathered health plan in 2017 [Figure 13.2].
- The percentage of covered workers enrolled in a grandfathered plan is lower than 2016 (23%), continuing a decline from 26% in 2014, 36% in 2013, and 48% in 2012 [Figure 13.3].
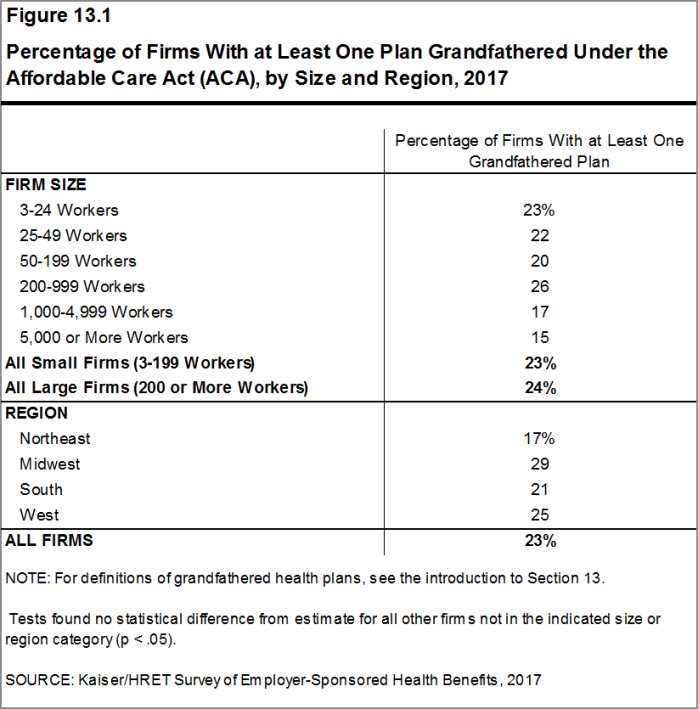
Figure 13.1: Percentage of Firms With at Least One Plan Grandfathered Under the Affordable Care Act (ACA), by Size and Region, 2017
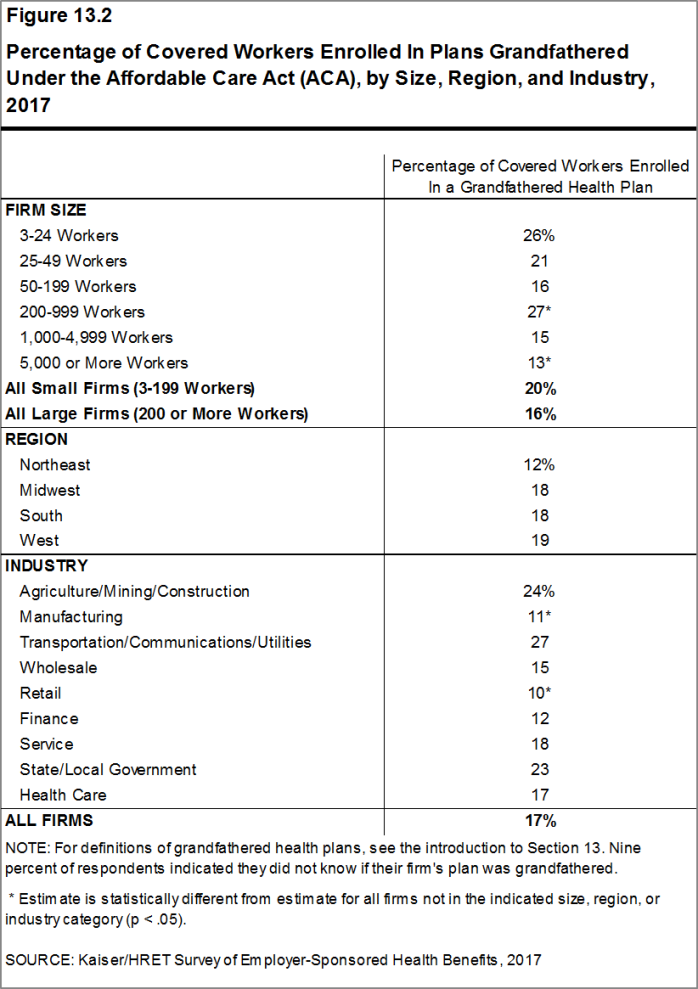
Figure 13.2: Percentage of Covered Workers Enrolled In Plans Grandfathered Under the Affordable Care Act (ACA), by Size, Region, and Industry, 2017
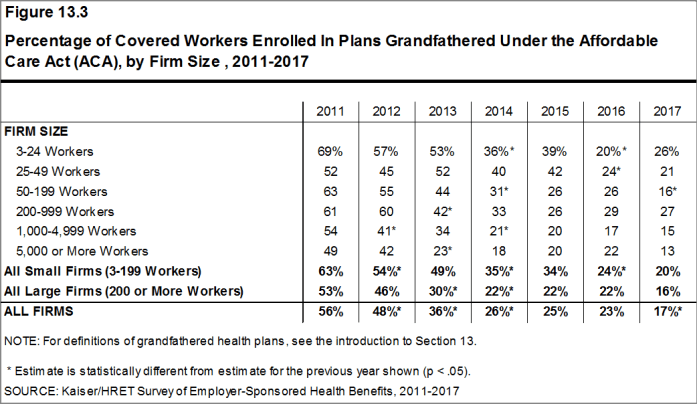
Figure 13.3: Percentage of Covered Workers Enrolled In Plans Grandfathered Under the Affordable Care Act (ACA), by Firm Size , 2011-2017
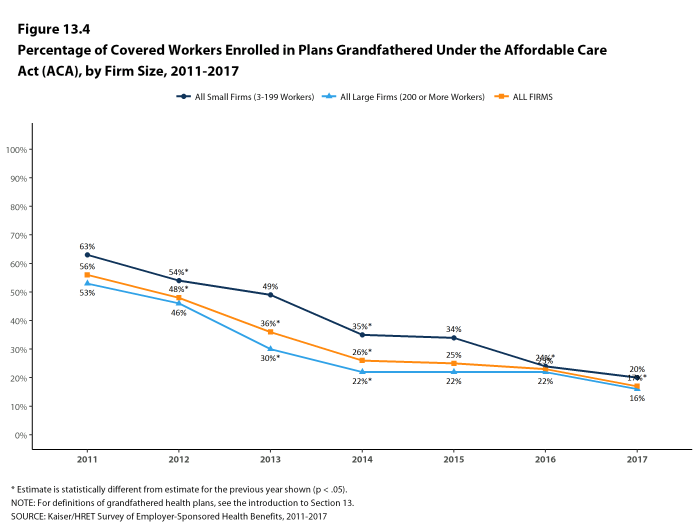
Figure 13.4: Percentage of Covered Workers Enrolled In Plans Grandfathered Under the Affordable Care Act (ACA), by Firm Size, 2011-2017
Section Fourteen: Employer Practices And Health Plan Networks
Employers play a significant role in financing and arranging for health care and health insurance coverage, so their experiences are important factors in health policy discussions. In recent years, employers have included new providers and sites of care, such as retail clinics, and some have pursued changes to their networks to reduce costs or improve quality. There also has been considerable interest in private health exchanges, which could provide firms and workers with a wider array of health plan choices, although thus far enrollment has been low.
SHOPPING FOR HEALTH COVERAGE
Fifty-nine percent of firms offering health benefits reported shopping for a new health plan or a new insurance carrier in the past year, similar to the percentage last year. Small firms (3-199 workers) were more likely to shop for coverage (59%), and firms with 1,000-4,999 workers and firms with 5,000 or more workers were less likely to shop for coverage (36% and 24%, respectively) than firms in other size categories [Figure 14.1].
- Among firms that offer health benefits and who shopped for a new plan or carrier in the past year, 28% changed insurance carriers [Figure 14.2].
- Eighty-eight percent of firms offering health benefits used a broker or consultant to assist in choosing a health plan [Figure 14.3].
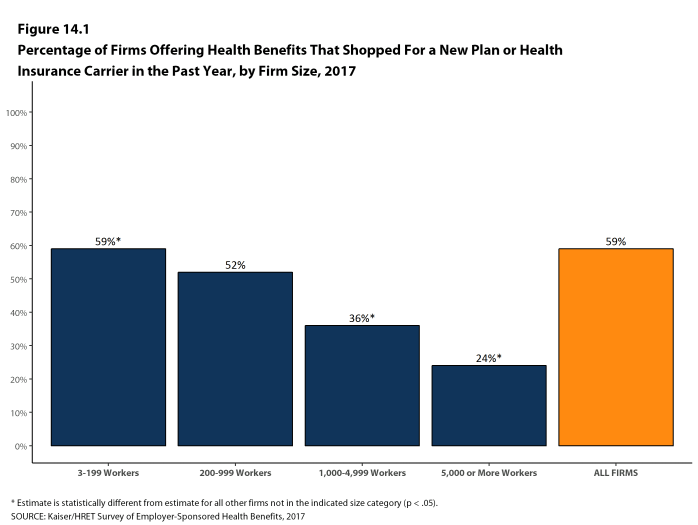
Figure 14.1: Percentage of Firms Offering Health Benefits That Shopped for a New Plan or Health Insurance Carrier In the Past Year, by Firm Size, 2017
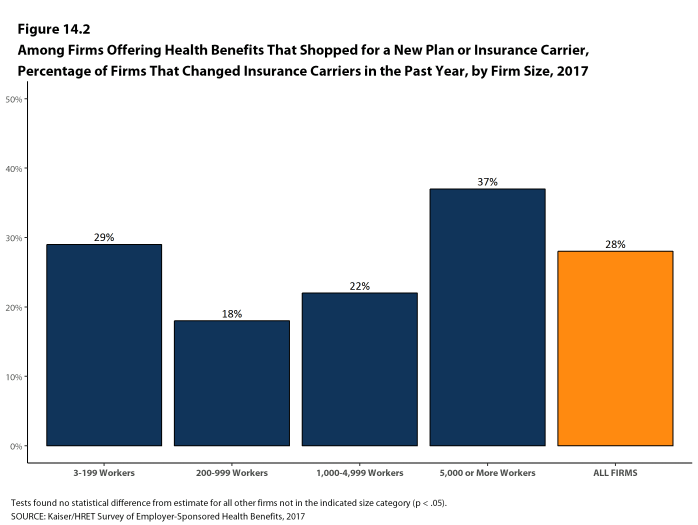
Figure 14.2: Among Firms Offering Health Benefits That Shopped for a New Plan or Insurance Carrier, Percentage of Firms That Changed Insurance Carriers In the Past Year, by Firm Size, 2017
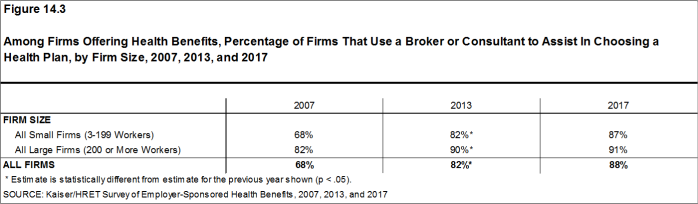
Figure 14.3: Among Firms Offering Health Benefits, Percentage of Firms That Use a Broker or Consultant to Assist In Choosing a Health Plan, by Firm Size, 2007, 2013, and 2017
PROVIDER NETWORKS
Firms and health plans can structure their networks of providers and their cost sharing to encourage enrollees to use providers who are lower cost or who provide better care. A tiered or high-performance network groups providers in the network based on the cost, quality and/or efficiency of the care they deliver. These networks encourage enrollees to visit preferred doctors by either restricting networks to efficient providers, or by having different cost sharing requirements based on the provider’s tier.
- Twelve percent of firms with 50 or more workers that offer health benefits include a high-performance or tiered provider network in their health plan with the largest enrollment, a similar percentage to last year [Figures 14.6 and 14.7].
- Firms with 1,000-4,999 workers (23%) and firms with 5,000 or more workers (31%) are more likely to incorporate a high-performance or tiered network into their largest plan [Figure 14.6].
- Eight percent of firms offering health benefits report that they offer a plan that they considered to be a narrow network plan, similar to the percentage reported last year [Figures 14.4]. Narrow network plans limit the number of providers who can participate in order to reduce costs. Narrow network plans are generally more restrictive than standard HMO networks.
- Firms with 5,000 or more workers offering health benefits are more likely to offer at least one plan with a narrow network than firms of other sizes [Figure 14.4].
- Six percent of firms offering health benefits said that either they or their insurer eliminated a hospital or health system from a provider network in order to reduce the plan’s cost during the last year [Figure 14.4].
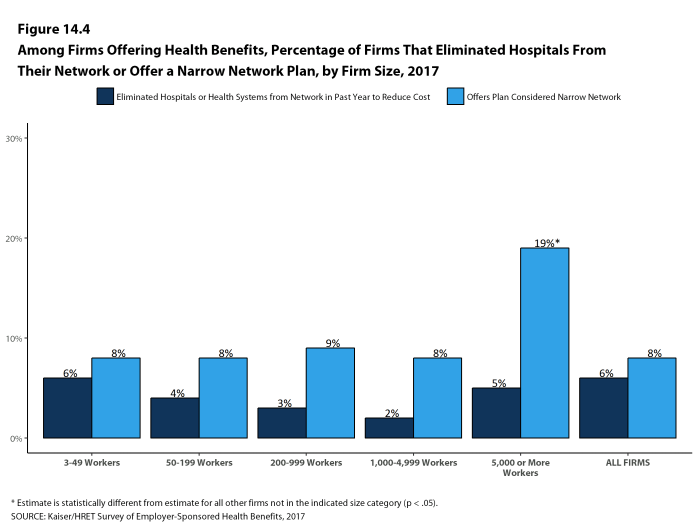
Figure 14.4: Among Firms Offering Health Benefits, Percentage of Firms That Eliminated Hospitals From Their Network or Offer a Narrow Network Plan, by Firm Size, 2017
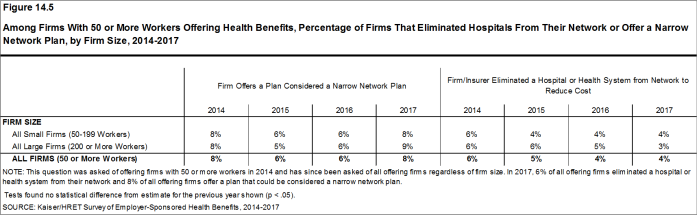
Figure 14.5: Among Firms With 50 or More Workers Offering Health Benefits, Percentage of Firms That Eliminated Hospitals From Their Network or Offer a Narrow Network Plan, by Firm Size, 2014-2017
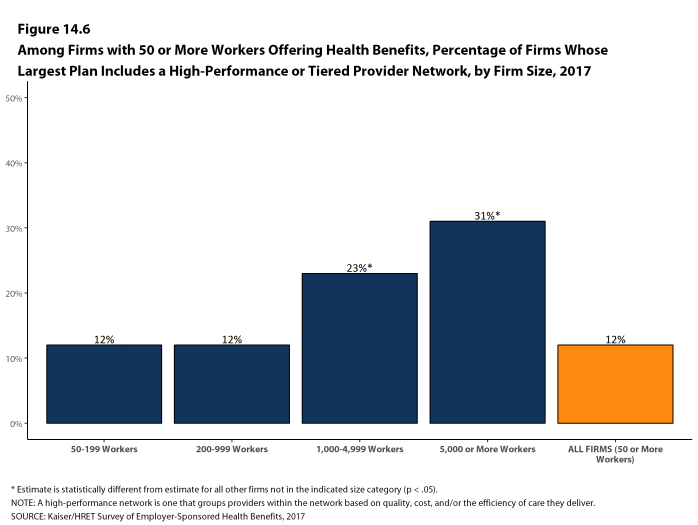
Figure 14.6: Among Firms With 50 or More Workers Offering Health Benefits, Percentage of Firms Whose Largest Plan Includes a High-Performance or Tiered Provider Network, by Firm Size, 2017
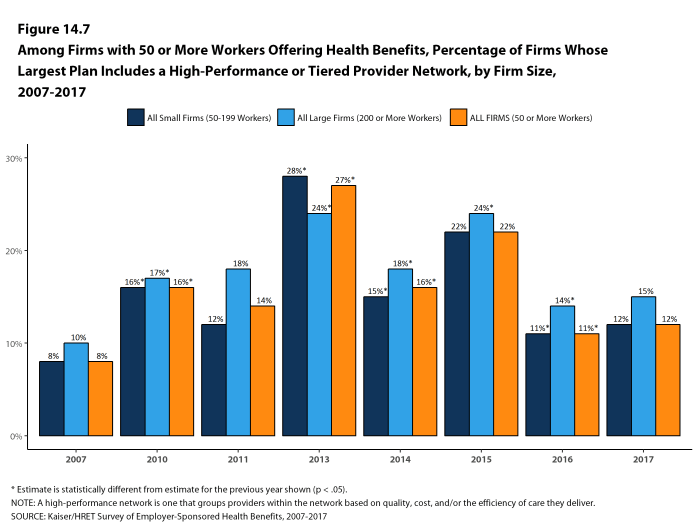
Figure 14.7: Among Firms With 50 or More Workers Offering Health Benefits, Percentage of Firms Whose Largest Plan Includes a High-Performance or Tiered Provider Network, by Firm Size, 2007-2017
ALTERNATIVE CARE SETTINGS: TELEMEDICINE AND RETAIL CLINICS
Firms and health plans are incorporating new sites and methods of care in order to improve convenience and potentially reduce costs.
- Fifty-three percent of firms with 50 or more workers who offer health benefits cover the provision of some health care services through telemedicine in their largest health plan [Figure 14.8]. Telemedicine is the delivery of health care services through telecommunications to a patient from a provider who is at a remote location, including video chat and remote monitoring. This would not include the mere exchange of information via email, exclusively web-based resources, or online information a plan may make available unless a health professional provides information specific to the enrollee’s condition. Larger firms are more likely to cover services provided through telemedicine than smaller firms [Figure 14.8].
- Among firms with 50 or more workers whose plans cover health services through telemedicine, 26% provide a financial incentive for workers to use telemedicine instead of visiting a traditional physician’s office in-person [Figure 14.9].
- The percentage of large firms reporting that they cover services through telemedicine rose significantly in the last year, from 39% last year to 63% this year [Figure 14.10]. We note that we made a small change to the survey question, which could account for some of that change. This is a significant increase in one year, and we will examine this next year to see if the higher prevalence persists.
- Seventy-five percent of firms that offer health benefits cover care received in retail clinics, such as those located in pharmacies, supermarkets and retail stores, in their largest health plan [Figure 14.11]. These clinics are often staffed by nurse practitioners or physician assistants and treat minor illnesses and provide preventive services.
- The percentage of firms covering care received in retail clinics in their largest health plan increased in the last year [Figure 14.12].
- Fifteen percent of firms that cover care at retail clinics provide a financial incentive for workers to visit a retail clinic instead of a traditional physician’s office [Figure 14.11].
- Seventy-three percent of firms that offer health benefits include a nurse hotline in their largest health plan. This is a significant increase from 55% in 2013 [Figure 14.13].
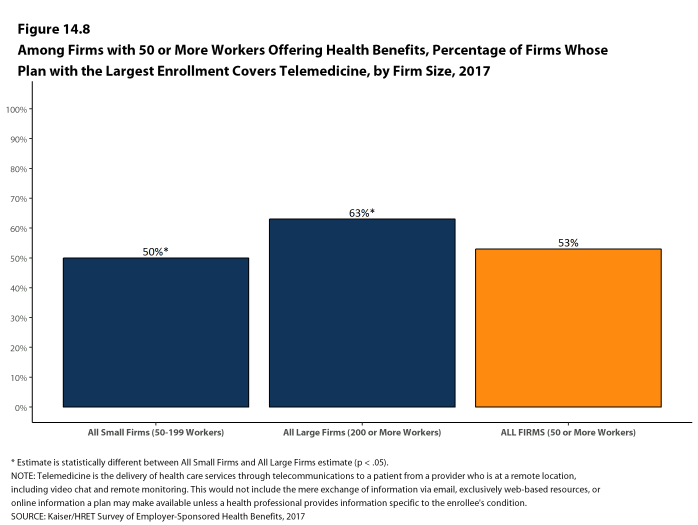
Figure 14.8: Among Firms With 50 or More Workers Offering Health Benefits, Percentage of Firms Whose Plan With the Largest Enrollment Covers Telemedicine, by Firm Size, 2017
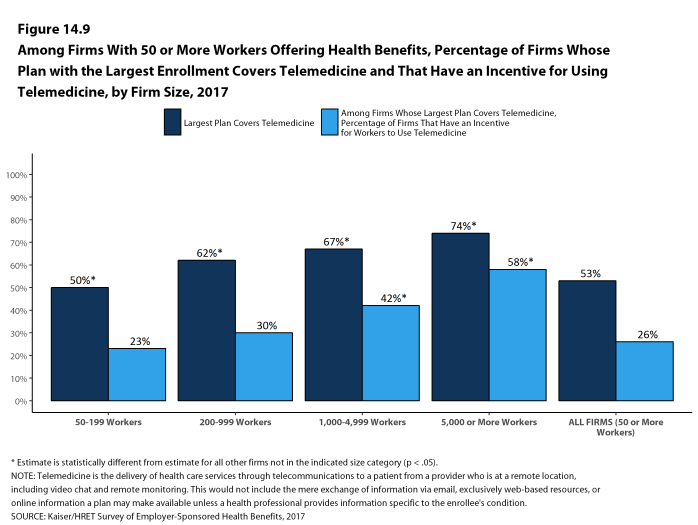
Figure 14.9: Among Firms With 50 or More Workers Offering Health Benefits, Percentage of Firms Whose Plan With the Largest Enrollment Covers Telemedicine and That Have an Incentive for Using Telemedicine, by Firm Size, 2017
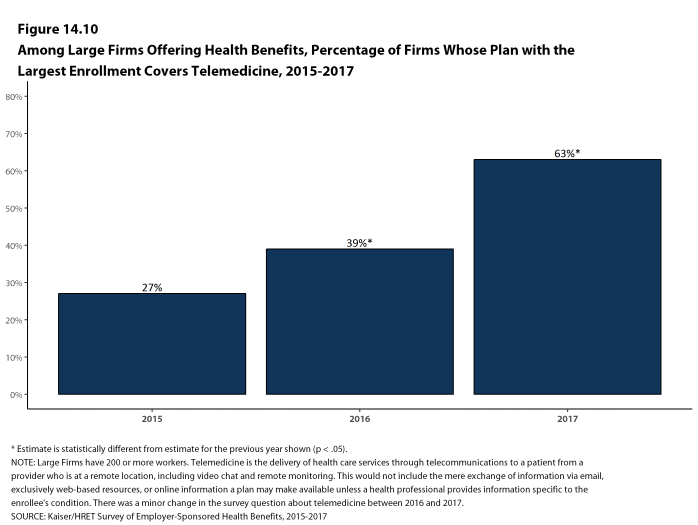
Figure 14.10: Among Large Firms Offering Health Benefits, Percentage of Firms Whose Plan With the Largest Enrollment Covers Telemedicine, 2015-2017
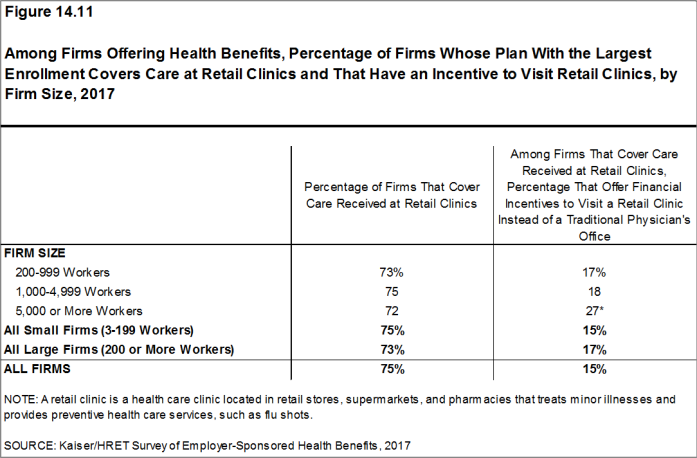
Figure 14.11: Among Firms Offering Health Benefits, Percentage of Firms Whose Plan With the Largest Enrollment Covers Care at Retail Clinics and That Have an Incentive to Visit Retail Clinics, by Firm Size, 2017
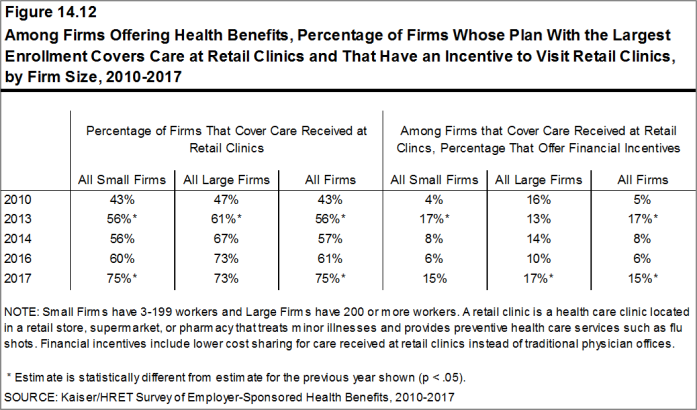
Figure 14.12: Among Firms Offering Health Benefits, Percentage of Firms Whose Plan With the Largest Enrollment Covers Care at Retail Clinics and That Have an Incentive to Visit Retail Clinics, by Firm Size, 2010-2017
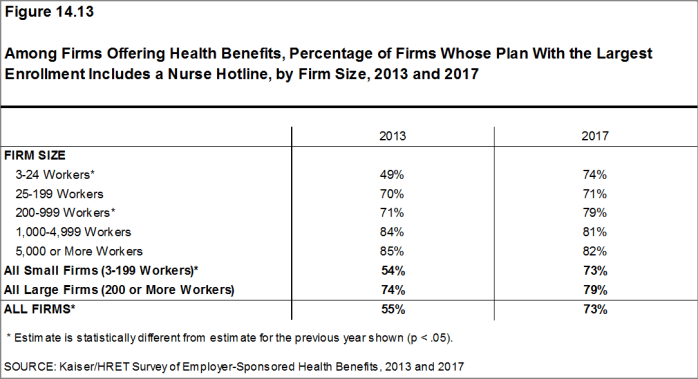
Figure 14.13: Among Firms Offering Health Benefits, Percentage of Firms Whose Plan With the Largest Enrollment Includes a Nurse Hotline, by Firm Size, 2013 and 2017
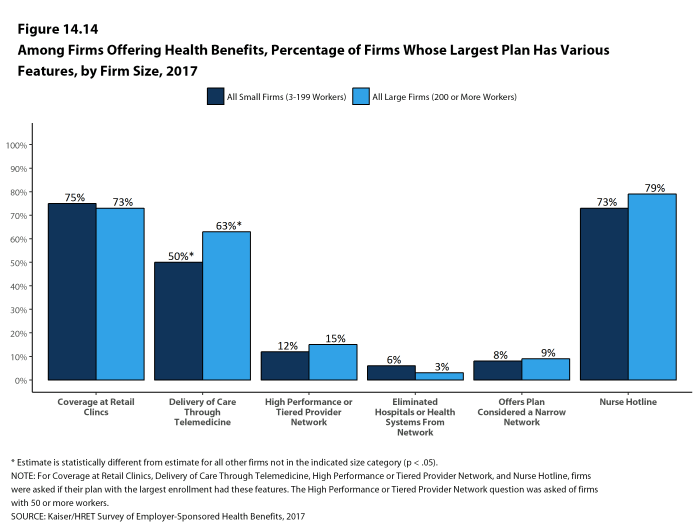
Figure 14.14: Among Firms Offering Health Benefits, Percentage of Firms Whose Largest Plan Has Various Features, by Firm Size, 2017
PRIVATE EXCHANGES AND DEFINED CONTRIBUTIONS
A private exchange is a virtual market that allows employers to provide their workers with a choice of several different health benefit options, often including supplemental or ancillary benefits options. Private exchanges generally are created by consulting firms, insurers, or brokers, and are different than the public exchanges run by the states or the federal government. There is considerable variation in the types of exchanges currently offered: some exchanges allow workers to choose between multiple plans offered by the same carrier while in other cases multiple carriers participate. The exchange operator may establish standards for the plans offered and may negotiate with insurers over the price and services provided. Although there has been considerable attention to the potential of private exchanges to change the market for employer-based coverage, participation thus far has been quite modest.
- Four percent of firms offering health benefits with 50 or more workers offer coverage through a private exchange. These firms provide coverage to 2% of covered workers in firms with 50 or more workers [Figure 14.16]. These percentages are the same as those in 2016.
- Firms offering health benefits with 50 or more workers that do not already offer health benefits through a private exchange were asked whether they had considered offering coverage through a private exchange. Ten percent of these firms are considering such an approach, lower than the percentage last year (18%) [Figure 14.15].
Some firms use a defined contribution approach to contribute toward the cost of health insurance. A defined contribution is a set dollar amount offered to the worker by the employer. Workers may then select one of several plans, paying the difference between the defined contribution and the cost of their chosen health insurance plan. This allows a firm to offer a larger variety of health plans to workers and to structure contributions or other rules to encourage workers to choose more efficient plans. Some private exchanges encourage employers to use a defined contribution approach to encourage competition among the participating insurers.
- Firms offering health benefits with 50 or more workers and that do not already offer benefits through a private exchange were asked whether they had considered using a defined contribution approach. Nineteen percent of these firms were considering such an approach [Figure 14.15].
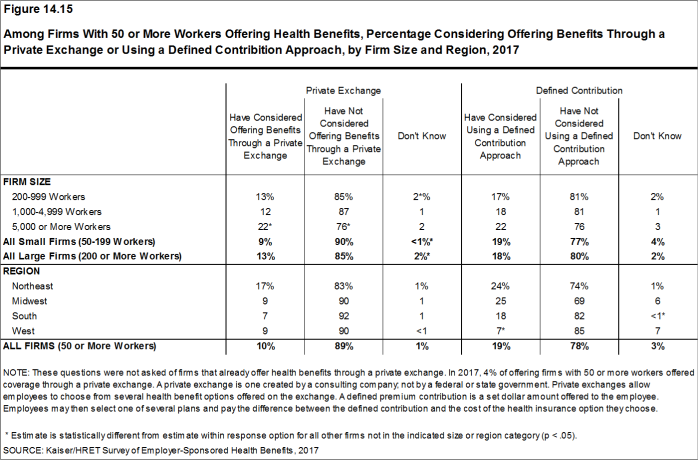
Figure 14.15: Among Firms With 50 or More Workers Offering Health Benefits, Percentage Considering Offering Benefits Through a Private Exchange or Using a Defined Contribition Approach, by Firm Size and Region, 2017
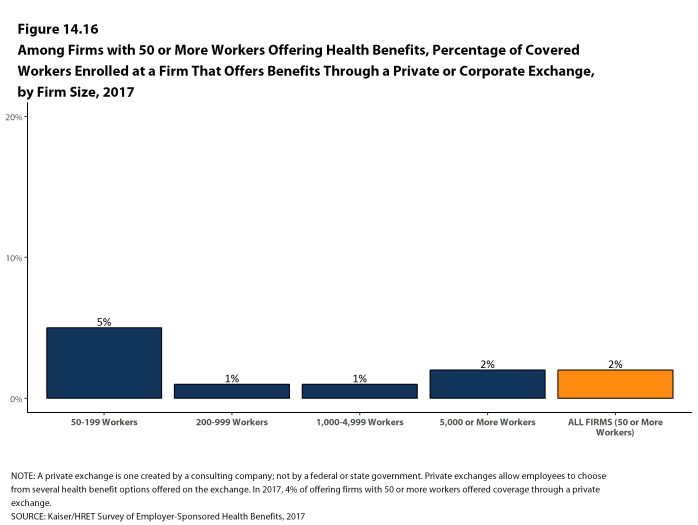
Figure 14.16: Among Firms With 50 or More Workers Offering Health Benefits, Percentage of Covered Workers Enrolled at a Firm That Offers Benefits Through a Private or Corporate Exchange, by Firm Size, 2017
ASSOCIATION HEALTH PLANS AND MEDICAID
- An association health plan is an organization of employers that coordinates coverage in order to reduce costs or improve benefits. Six percent of offering firms with fewer than 250 workers offer health benefits through a trade or professional association health plan [Figure 14.17].
- A substantial share of firms that offer health benefits report having workers who receive coverage from Medicaid. Medicaid is a federally and state-funded program that provides health coverage for people who are poor, aged or disabled. Twenty percent of small firms and 48% of large firms report that they have workers covered by Medicaid. We note that, as expected, there is a significant share of firms, particularly larger firms, that do not know the answer to this question [Figure 14.18].
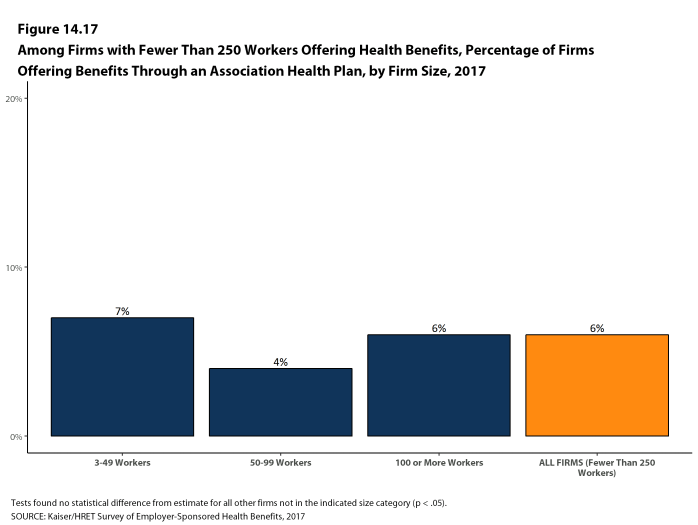
Figure 14.17: Among Firms With Fewer Than 250 Workers Offering Health Benefits, Percentage of Firms Offering Benefits Through an Association Health Plan, by Firm Size, 2017
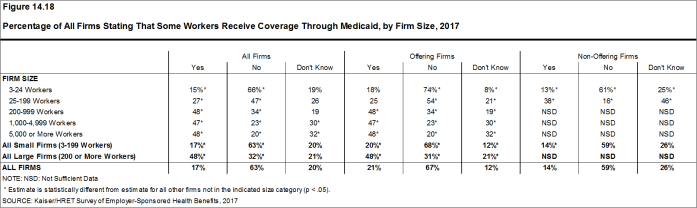
Figure 14.18: Percentage of All Firms Stating That Some Workers Receive Coverage Through Medicaid, by Firm Size, 2017