2017 Employer Health Benefits Survey
Published:
Section 1: Cost of Health Insurance
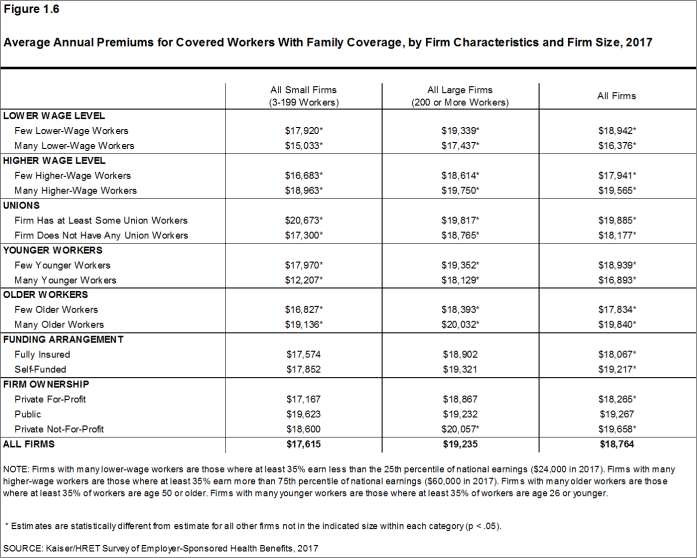
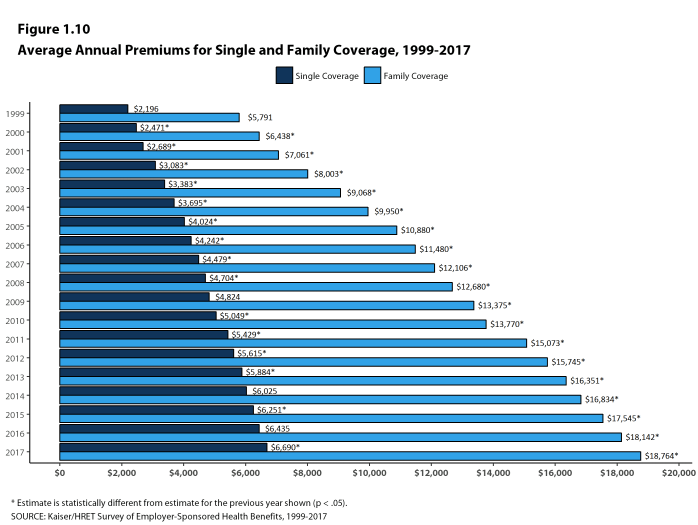
The average annual premiums in 2017 are $6,690 for single coverage and $18,764 for family coverage. The average premium for single coverage increased by 4% since 2016 and the average premium for family coverage increased by 3%. The average family premium has increased 55% since 2007 and 19% since 2012. The average family premium for covered workers in small firms (3-199 workers) ($17,615) is significantly lower than average family premiums for workers in large firms (200 or more workers) ($19,235).
PREMIUM COSTS FOR SINGLE AND FAMILY COVERAGE
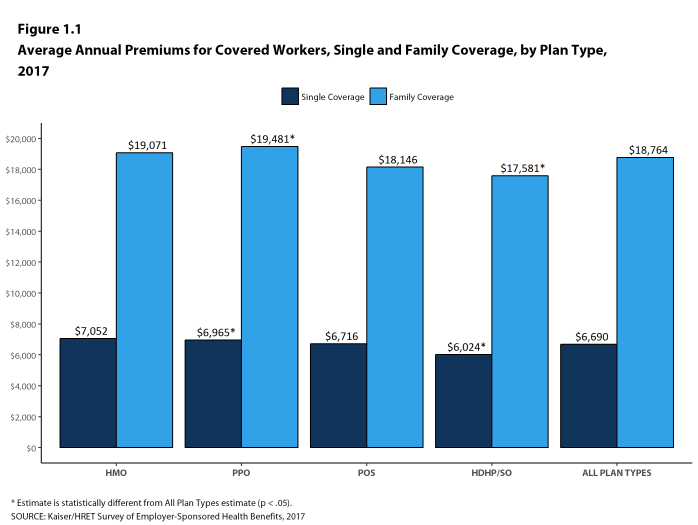
- The average premium for single coverage in 2017 is $6,690 per year. The average premium for family coverage is $18,764 per year [Figure 1.1].
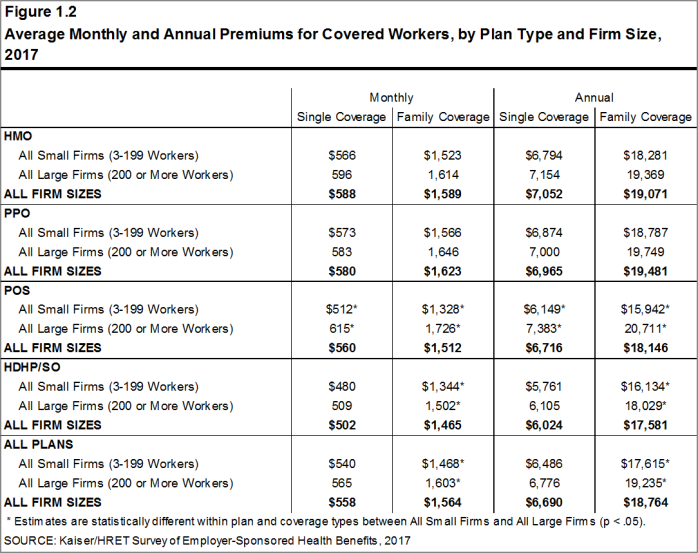
- The average annual premium for family coverage for covered workers in small firms ($17,615) is lower than the average premium for covered workers in large firms ($19,235) [Figure 1.2].
- The average annual premiums for covered workers in HDHP/SOs are lower for single coverage ($6,024) and family coverage ($17,581) than overall average premiums. The average premiums for covered workers enrolled in PPO plans are higher for single ($6,965) and family coverage ($19,481) than the overall plan average [Figure 1.1].
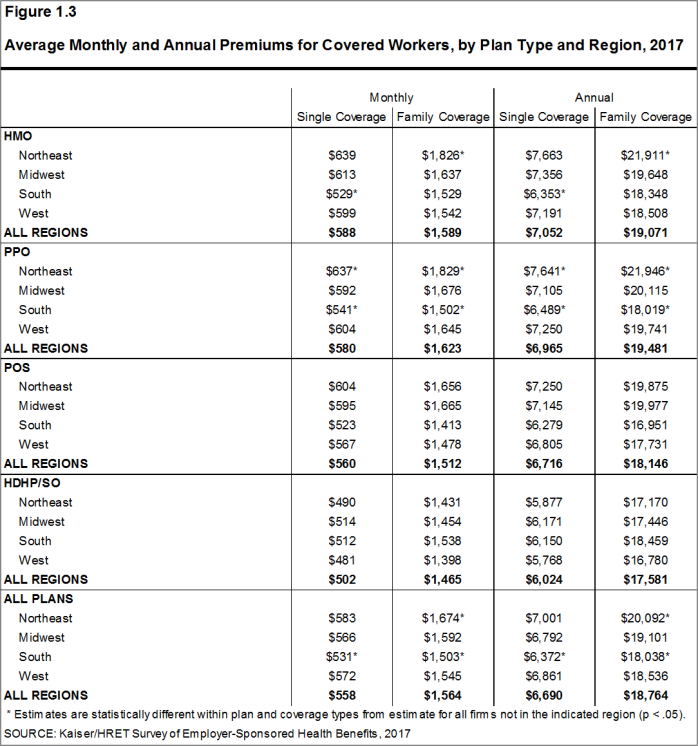
- The average premiums for covered workers are lower in the South ($6,372 for single coverage and $18,038 for family coverage) than the average premiums for covered workers in all other regions. The average premium for family coverage for covered workers in the Northeast ($20,092) is higher than the average family premium for covered workers in all other regions [Figure 1.3].
- The average premiums for covered workers vary across industries, with those in the retail industry being particularly low ($5,716 for single coverage and $16,920 for family coverage) [Figure 1.4].
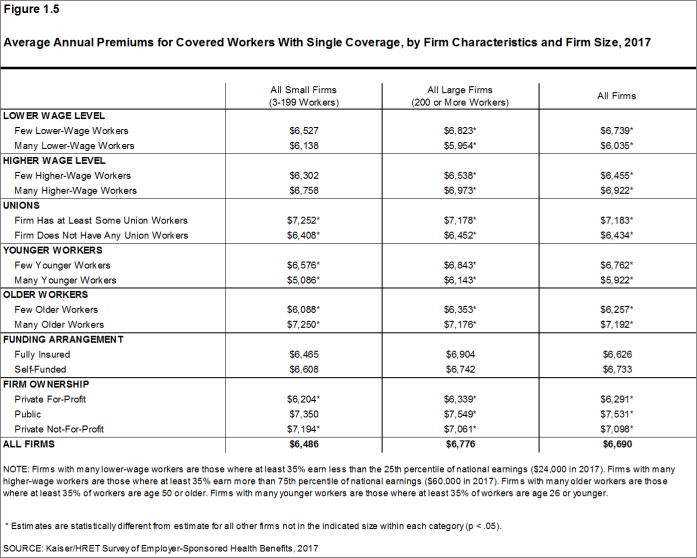
- The average premiums for covered workers in firms with a relatively large share of younger workers (where at least 35% of the workers are age 26 or younger) are lower than the average premiums for covered workers in firms with a smaller share of younger workers ($5,922 vs. $6,762 for single coverage and $16,893 vs. $18,939 for family coverage) [Figures 1.5 and 1.6].
- Premiums also vary by firm wage level. The average premiums for covered workers in firms with a relatively large share of lower-wage workers (where at least 35% of workers earn $24,000 a year or less) are less than the average premiums at firms with a smaller share of lower-wage workers ($6,035 vs. $6,739 for single coverage and $16,376 vs. $18,942 for family coverage) [Figures 1.5 and 1.6].
- The average premiums for covered workers in firms with at least some union workers are higher than the average premiums for covered workers in firms without union workers ($7,183 vs. $6,434 for single coverage and $19,885 vs. $18,177 for family coverage) [Figures 1.5 and 1.6].
- There is also variation in premiums by type of firm ownership. For both single and family coverage, covered workers at private for-profit firms have lower average annual premiums than covered workers at public firms or private not-for-profit firms [Figures 1.5 and 1.6].
Figure 1.1: Average Annual Premiums for Covered Workers, Single and Family Coverage, by Plan Type, 2017
Figure 1.2: Average Monthly and Annual Premiums for Covered Workers, by Plan Type and Firm Size, 2017
Figure 1.4: Average Monthly and Annual Premiums for Covered Workers, by Plan Type and Industry, 2017
Figure 1.5: Average Annual Premiums for Covered Workers With Single Coverage, by Firm Characteristics and Firm Size, 2017
PREMIUM DISTRIBUTION
- There is considerable variation in premiums for both single and family coverage.
- Twenty percent of covered workers are employed in a firm with a single premium at least 20% higher than the average single premium, while 21% of covered workers are in firms with a single premium less than 80% of the average single premium [Figures 1.7].
- For family coverage, 17% of covered workers are employed in a firm with a family premium at least 20% higher than the average family premium, while 21% of covered workers are in firms with a family premium less than 80% of the average family premium [Figure 1.7].
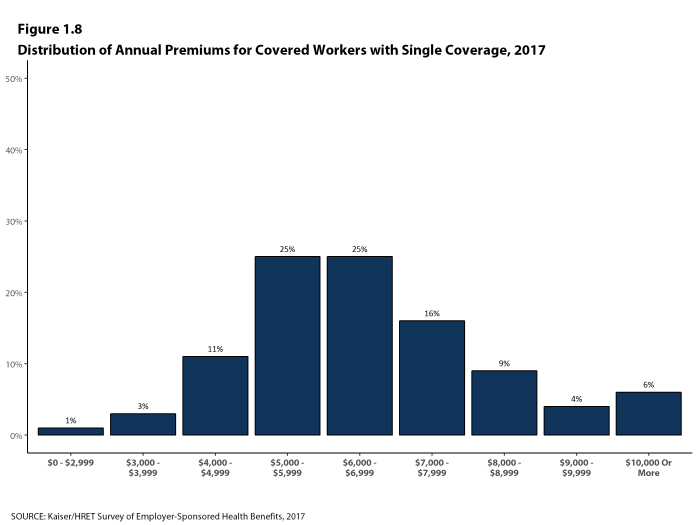
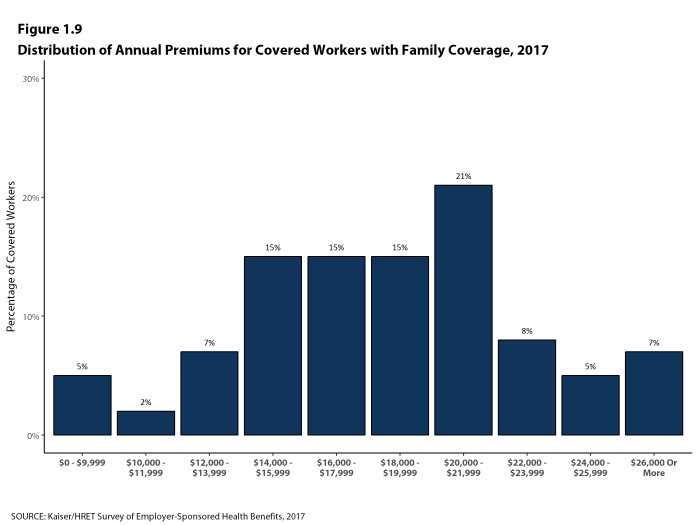
- Six percent of covered workers are in a firm with a premium of at least $10,000 a year for single coverage [Figure 1.8]. Seven percent of covered workers are in a firm with a premium of at least $26,000 a year for family coverage [Figure 1.9].
Figure 1.7: Distribution of Annual Premiums for Single and Family Coverage Relative to the Average Annual Single or Family Premium, 2017
PREMIUM CHANGES OVER TIME
- The average premium for single coverage is 4% higher than the single premium last year and the average premium for family coverage is 3% higher than the average family premium last year [Figure 1.10].
- The average premiums for single and family coverage have grown at the same rate (19%) since 2012.
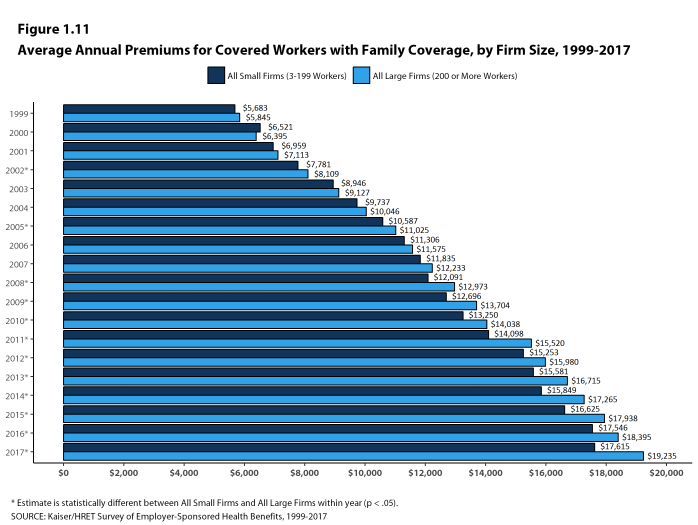
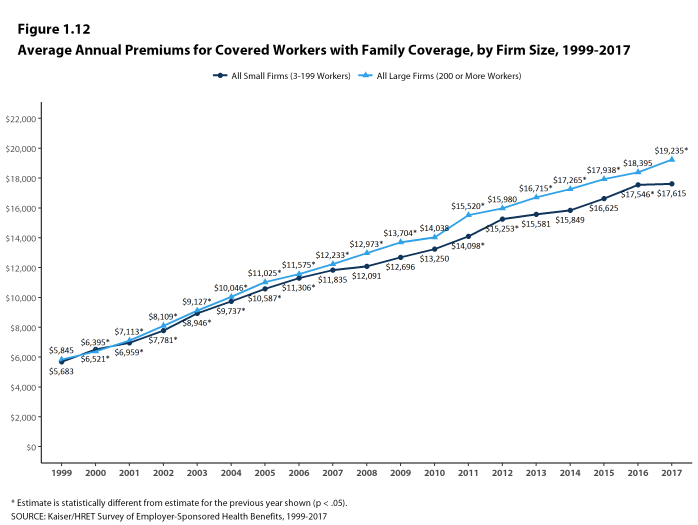
- The average family premiums for both small and large firms have increased at similar rates since 2012 (15% for small firms and 20% for large firms). For small firms, the average family premium rose from $15,253 in 2012 to $17,615 in 2017. For large firms, the average family premium rose from $15,980 in 2012 to $19,235 in 2017 [Figures 1.11 and 1.12].
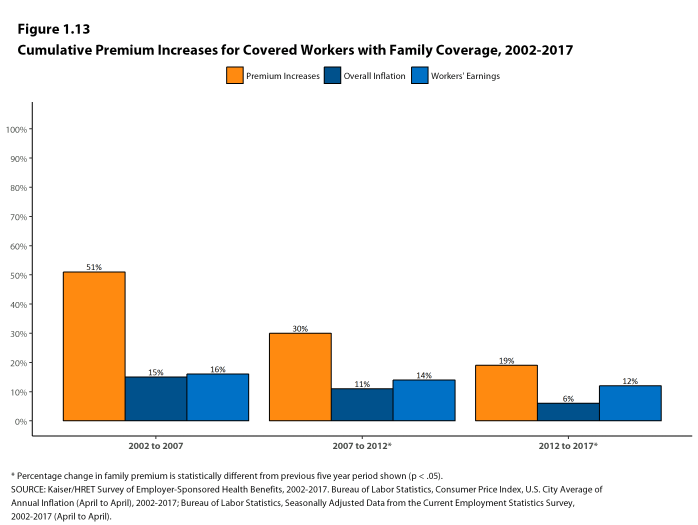
- The $18,764 average family premium in 2017 is 19% higher than the average family premium in 2012 and 55% higher than the average family premium in 2007 [Figure 1.10] . The 19% family premium growth in the last five years is smaller than the 30% growth between 2007 and 2012, or the 51% premium growth between 2002 and 2007 [Figure 1.13].
- The average family premiums for both small and large firms have increased at similar rates since 2007 (49% for small firms and 57% for large firms). For small firms, the average family premium rose from $11,835 in 2007 to $17,615 in 2017. For large firms, the average family premium rose from $12,233 in 2007 to $19,235 in 2017 [Figures 1.11 and 1.12].
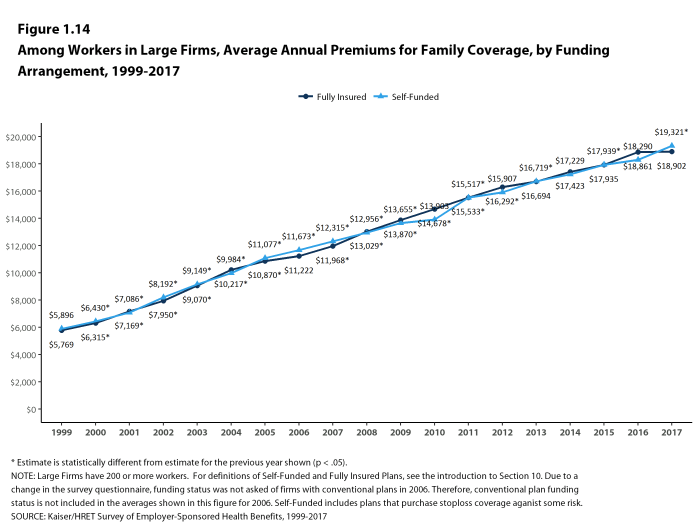
- For covered workers in large firms, over the last five years, the average family premium in firms that are fully insured has grown at a similar rate to the average family premium for covered workers in fully or partially self-funded firms (16% for fully insured plans and 21% for self-funded firms) [Figure 1.14].
Figure 1.11: Average Annual Premiums for Covered Workers With Family Coverage, by Firm Size, 1999-2017
Figure 1.12: Average Annual Premiums for Covered Workers With Family Coverage, by Firm Size, 1999-2017
Sections
- Section 1: Cost of Health Insurance
- Section 2: Health Benefits Offer Rates
- Section 3: Employee Coverage, Eligibility, and Participation
- Section 4: Types of Plans Offered
- Section 5: Market Shares of Health Plans
- Section 6: Worker and Employer Contributions for Premiums
- Section 7: Employee Cost Sharing
- Section 8: High-Deductible Health Plans with Savings Option
- Section 9: Prescription Drug Benefits
- Section 10: Plan Funding
- Section 11: Retiree Health Benefits
- Section 12: Health and Wellness Programs
- Section 13: Grandfathered Health Plans
- Section 14: Employer Practices and Health Plan Networks

