Poll Finding

Women’s Views of Abortion Access and Policies in the Dobbs Era: Insights From the KFF Health Tracking Poll

Published: Apr 5, 2024

Findings

Nearly two years after the Dobbs v. Jackson Women’s Health Organization Supreme Court ruling overturned Roe v. Wade, eliminating federal constitutional protections for abortion, abortion is banned in 14 states and limited by gestational limits in 11 others. The latest polling from KFF finds that women in states where abortion is banned are more likely to report personal connections to people who have had difficulty accessing abortion services since the overturn of Roe. Recent research has documented that many women who live in states where abortion is banned have traveled to other states to secure abortions. This can be costly and require them to take time off from work, find childcare, and in some cases make multiple visits to get abortion services. There have also been reports of women who have been denied abortions even though they meet the state standards for exemptions. Previous reporting from the KFF Health Tracking Poll examines women’s views on abortion policy including by partisanship, which is one of the strongest predictors of these views. This analysis examines women’s views by geography—specifically whether they live in a state where abortion is currently banned, limited, or legal.

One in Seven Women in States With Abortion Bans Say They or Someone They Know Has Had Difficulty Accessing an Abortion

Eight percent of women overall, rising to one in seven (14%) women of reproductive age (ages 18 to 49), say they or someone they know has had difficulty accessing an abortion due to restrictions in their state since Roe was overturned. Women living in states where abortion is banned are twice as likely to report knowing someone who had difficulty accessing an abortion compared to women living in states where abortion is limited or legal. One in seven (14%) women living in states where abortion is banned say they or someone they know has struggled to access an abortion due to restrictions on abortions in their state, including one in five (21%) women ages 18-49 living in these states. Fewer women in states where abortion is limited by gestational periods (6%) or in states where abortion is legal past 22 weeks of gestation (7%) say they or someone they know has experienced such difficulties.

One in Seven Women in States With Abortion Bans Know Someone Who Has Had Difficulty Accessing an Abortion Post-Roe

While there are some small differences in levels of support for abortion restrictions between women living in states where abortion is banned and those living in other states, majorities of women across states—including in those with abortion bans—think abortion should be legal in all or most cases and support a range of policies that protect abortion access.

Regardless of whether abortion in their state is banned, restricted, or legal, a majority of women think abortion should be legal in all or most cases, including two-thirds (67%) of women in states where abortion is banned and seven in ten (71%) in states where abortion is limited by gestational limits. A larger majority (81%) of women in states where abortion is currently legal say abortion should be legal in all or most cases. One in four women living in states where abortion is banned think abortion should be “illegal in most cases,” as do one in five women living in states where abortion is limited by gestational limits (19%) and women living in states where abortion is legal (17%). A small share of women, regardless of their state’s laws, say abortion should be “illegal in all cases” (8% of women living in states where abortion is banned, 10% in states with limited abortion access, 2% in states with legal abortions available).

A Majority of Women in States Where Abortion Is Banned Say Abortion Should Be Legal in All or Most Cases

A majority of women, regardless of the abortion laws in their state, support laws such as protecting abortion access for women experiencing pregnancy-related emergencies such as miscarriages, protecting the right to travel to get an abortion, and guaranteeing a federal right to abortion.

Regardless of the type of abortion restrictions in their state, fewer than half of women support laws that restrict or criminalize abortion access, though there are some variations in the level of support for different policies. Among women living in states where abortion is banned, just under half support establishing a federal 16-week ban on abortions (45%), and four in ten support prohibiting clinics that receive federal funding from providing abortions or referring patients to abortion providers (40%) or making it a crime for health care providers to mail abortion pills to state with abortion bans (38%). One-third support a national ban on mifepristone, the abortion medication (33%).

Fewer women in states where abortion is legal support establishing a federal ban on abortion at 16 weeks (33% vs. 45% among women in states where abortion is banned), likely reflecting underlying political differences between women who live in these types of states. In fact, four in ten (38%) women living in states where abortion is banned or limited either are or lean Republican, compared to about three in ten (28%) women living in states where abortion is legal. The largest predictor of support for these policies is political partisanship, even among women. For a further exploration on these partisanship differences, see previous reporting on this survey.

A Majority of Women in States Where Abortion Is Banned Support Laws Protecting Access to Abortion

The issue of abortion access is likely to emerge in multiple forms in the November 2024 election. A number of states are moving forward with ballot initiatives to protect abortion rights at the state level. In addition, KFF polling shows that one in eight voters (12%) say abortion is the most important issue to their vote, largely comprised of adults who say abortion should be legal and support protections for abortion access. Notably, one in five women of reproductive age in states where abortion is banned say that either they or someone they personally know has had difficulty obtaining an abortion. Support for abortion protections including a federal guarantee to the right to abortion is robust among women, regardless of where they reside. While substantial minorities of women in states with abortion bans support some restrictions on abortion access, two-thirds of women living in these states think abortion should be legal in all or most cases, suggesting a disconnect between what women in these states support and the policies their state lawmakers have enacted.

Methodology

This KFF Health Tracking Poll was designed and analyzed by public opinion researchers at KFF. The survey was conducted February 20-28,2024, online and by telephone among a nationally representative sample of 1,316 U.S. adults in English (1,226) and in Spanish (90). The sample includes 1,036 adults (n=51 in Spanish) reached through the SSRS Opinion Panel either online (n=1,011) or over the phone (n=25). The SSRS Opinion Panel is a nationally representative probability-based panel where panel members are recruited randomly in one of two ways: (a) Through invitations mailed to respondents randomly sampled from an Address-Based Sample (ABS) provided by Marketing Systems Groups (MSG) through the U.S. Postal Service’s Computerized Delivery Sequence (CDS); (b) from a dual-frame random digit dial (RDD) sample provided by MSG. For the online panel component, invitations were sent to panel members by email followed by up to three reminder emails.

Another 280 (n=39 in Spanish) interviews were conducted from a random digit dial telephone sample of prepaid cell phone numbers obtained through MSG. Phone numbers used for the prepaid cell phone component were randomly generated from a cell phone sampling frame with disproportionate stratification aimed at reaching Hispanic and non-Hispanic Black respondents. Stratification was based on incidence of the race/ethnicity groups within each frame.

Respondents in the phone samples received a $15 incentive via a check received by mail, and web respondents received a $5 electronic gift card incentive (some harder-to-reach groups received a $10 electronic gift card). In order to ensure data quality, cases were removed if they failed two or more quality checks: (1) attention check questions in the online version of the questionnaire, (2) had over 30% item non-response, or (3) had a length less than one quarter of the mean length by mode. Based on this criterion, no cases were removed.

The combined cell phone and panel samples were weighted to match the sample’s demographics to the national U.S. adult population using data from the Census Bureau’s 2023 Current Population Survey (CPS), September 2021 Volunteering and Civic Life Supplement data from the CPS, and the 2023 KFF Benchmarking survey with ABS and prepaid cell phone samples. The demographic variables included in weighting for the general population sample are sex, age, education, race/ethnicity, region, civic engagement, frequency of internet use, political party identification by race/ethnicity, and education. The sample of registered voters was weighted separately to match the U.S. registered voter population using parameters above plus recalled vote in the 2020 presidential election by county quintiles grouped by Trump vote share. Both weights account for differences in the probability of selection for each sample type (prepaid cell phone and panel). This includes adjustment for the sample design and geographic stratification of the cell phone sample, within household probability of selection, and the design of the panel-recruitment procedure.

The margin of sampling error including the design effect for the full sample is plus or minus 3 percentage points and for registered voters is plus or minus 4 percentage points. Numbers of respondents and margins of sampling error for key subgroups are shown in the table below. For results based on other subgroups, the margin of sampling error may be higher. Sample sizes and margins of sampling error for other subgroups are available by request. Sampling error is only one of many potential sources of error and there may be other unmeasured error in this or any other public opinion poll. KFF public opinion and survey research is a charter member of the Transparency Initiative of the American Association for Public Opinion Research.

For this report, states are grouped into three categories: states where abortion is banned, states with gestational limits between 6 and 22 weeks LMP, and states where abortion is legal beyond 22 weeks LMP. For more information on state categorizations, see KFF’s Abortion in the United States Dashboard.

GroupN (unweighted)M.O.S.E.
Total1,316± 3 percentage points
Total women686± 5 percentage points
Women in states where abortion is banned (14 states)177± 10 percentage points
Women in states where abortion is limited (11 states)192± 9 percentage points
Women in states where abortion is legal (25 states and DC)309± 7 percentage points
 
Women ages 18-49380± 7 percentage points
News Release

KFF Health News and Cox Media Group’s Series on Social Security Overpayments Wins the Goldsmith Awards’ Inaugural Government Reporting Prize

Published: Apr 4, 2024

KFF Health News and Cox Media Group Television Stations announced today that they received the 2024 Goldsmith Awards’ inaugural Government Reporting Prize for their joint reporting in the series “Overpayment Outrage,” which exposed how the Social Security Administration routinely reduced or suspended monthly checks to take back funds to pay off large debts that were often created by its own miscalculation of people’s benefits.

The investigation revealed that more than two million people each year are hit with overpayments, including those least able to repay the debt, such as individuals who are poor, old, disabled, blind or who suffer from a chronic illness.

The reporting triggered congressional hearings, a “top-to-bottom” review by Social Security officials and increased Senate oversight. Commissioner Martin O’Malley also recently announced sweeping policy changes to stop what he called “clawback cruelty” and “grave injustices.”

The Shorenstein Center on Media, Politics and Public Policy at the Harvard Kennedy School honored KFF Health News and Cox Media Group at the Goldsmith Awards ceremony yesterday with the new prize, which recognizes reporting on how government and public policy implementation works, including how and why it can fail and how it can most effectively and efficiently solve problems.

“This series exposed the significant impact of these mistakes on millions of people, including those who had little to no ability to pay back the government, forcing some people to lose their homes, cars and savings,” said KFF President and CEO Drew Altman, who is the founding Publisher of KFF Health News. “This is why KFF reports on systemic issues like this through our news service—to reveal how people are affected by policy. ”

“We’re honored to receive this prestigious award because it reflects CMG’s commitment to local news and investigative journalism,” said Marian Pittman, CMG’s President of Content. “The team’s relentless efforts to uncover the truth behind complex government policies and their implementation has resulted in tangible changes within the SSA and will directly benefit millions of people impacted by overpayments.”

The series was reported by David Hilzenrath and Fred Clasen-Kelly of KFF Health News and Jodie Fleischer of Cox Media Group. A list of additional contributors is available here.

More on “Overpayment Outrage”Each year the Social Security Administration (SSA) issues billions of dollars in overpayments to recipients whose incomes or other qualifying criteria have changed. Under federal law, the SSA is required to demand repayment of this money, treating it as a debt to the federal government. These clawbacks can happen even decades after the initial overpayments.

In “Overpayment Outrage,” Cox Media Group and KFF Health News examined the overpayment issue and the impacts clawbacks have on vulnerable people. They found that overpayments happen due to rules that are complex and hard to follow, inadequate SSA staffing, outdated limits on assets and lagged or otherwise inaccurate data on income and other beneficiary information. The reporting also laid out potential solutions to address the legislative, funding, and process failures that cause this systemic problem.

About the Reporting PartnershipKFF Health News and Cox Media Group television stations used FOIA requests, reports by the inspector general and SSA and interviews with agency employees, advocates for the disabled and dozens of beneficiaries to piece together the story. What emerged was evidence of a systemic problem in which the SSA routinely reduces or halts monthly benefit checks to reclaim billions of dollars in payments it sent to beneficiaries then later said they should not have received.

After they published the series, hundreds of disability beneficiaries came forward with troubling accounts, including that the government sent them overpayment notices without explanation and threatened to cut off their main source of income with little warning. The agency has since restored benefits to several of the beneficiaries featured in the reporting.

About KFF and KFF Health NewsKFF is a nonprofit health policy research, polling and news organization. Our mission is to serve as a nonpartisan source of information for policymakers, the media, the health policy community and the public. KFF Health News is a national newsroom that produces in-depth and award-winning journalism about health issues and is one of the core operating programs at KFF. KFF Health News has been recognized repeatedly for its journalism, with awards honoring its investigative reports on the American health care system.

Other major KFF programs include Policy Analysis; KFF Polling and Survey Research; and KFF Social Impact Media, which conducts specialized public health information campaigns. A new program on Health Misinformation and Trust will be launched soon.

Experience of the Five Largest Publicly Traded Companies Operating Medicaid Managed Care Plans During Unwinding

Published: Apr 3, 2024

Note: For the latest data on the experiences of the five largest publicly traded companies, view our 2025 brief

At the start of the “unwinding” period, in April 2023, Medicaid enrollment peaked at 94.5 million, an increase of 23 million or 32% from before the pandemic. As of December 2023, Medicaid enrollment declined by more than 9% across states, a decline of over 9 million people. The Centers for Medicare and Medicaid Services (CMS) continues to highlight the role managed care organizations (MCOs) can play in helping people eligible for Medicaid use and keep their coverage, as nearly three-quarters of Medicaid beneficiaries are enrolled in a managed care plan. This brief takes a closer look at the five largest publicly traded companies (also referred to as “parent” firms) operating Medicaid MCOs, which account for half of Medicaid MCO enrollment nationally. This analysis presents the latest parent firm enrollment and financial data (through the end of CY 2023) as well as key takeaways from the firms’ unwinding experience. Information and data reported in this brief come from quarterly company earnings reports and calls, financial filings and other company materials as well as from national administrative data. Key takeaways include:

  • Medicaid Enrollment. From March 2023 to December 2023, Medicaid enrollment declined by nearly 10% across the five firms, tracking the rate of decline seen nationally.
  • Medicaid Revenue. Although firms saw a 10% decline in Medicaid enrollment as of the end of 2023, the firms that report Medicaid-specific revenue information reported year-over-year (2023 over 2022) growth in Medicaid revenue ranging from 3% to 18%.
  • Unwinding Impacts. In earnings calls, firms have discussed the impacts of unwinding, including high procedural disenrollment rates of 70% or above and gaps in member coverage that can extend for several months. Several firms reported states have been making mid-cycle and retrospective rate adjustments to account for the impact of redeterminations on the average risk profile (or “acuity”) of members who remain enrolled.

Medicaid enrollment in the five largest publicly traded companies operating Medicaid MCOs

Five for-profit, publicly traded companies – Centene, Elevance (formerly Anthem), UnitedHealth Group, Molina and CVS Health – account for 50% of Medicaid MCO enrollment nationally (Figure 1). All five are ranked in the Fortune 500, and four are ranked in the top 100, with total revenues that ranged from $34 billion (Molina) to $372 billion (UnitedHealth Group) for 2023. Each company operates Medicaid MCOs in 14 or more states (Figure 2).

Five For-Profit, Publicly Traded Companies Have Half of the Medicaid MCO Market.
Five Firms Have a Wide Geographic Reach in Medicaid, Each With MCOs in 14 or More of the 41 MCO States.

All five firms also operate in the commercial and Medicare markets (Figure 3); however, the distribution of membership across markets varies across firms. Two firms – Molina and Centene – have historically focused predominantly on the Medicaid market. Medicaid members accounted for over 90% of Molina’s overall medical membership and nearly 65% of Centene’s medical membership as of December 2023 (Figure 3). Since the start of unwinding, Medicaid membership as a share of total medical membership has declined for all five firms. The unwinding may be contributing to membership distribution shifts.

The Distribution of Medical Membership Across Markets Varies Across the Five Largest Publicly Traded Companies Operating Medicaid MCOs.

Combined Medicaid enrollment across the five firms decreased by 4.3 million or 9.8% from March 2023 to December 2023 (Figure 4). Similar to the enrollment decline experienced by the five parent firms, national data show total Medicaid/CHIP enrollment declined by more than 9% from March 2023 to December 2023. Changes in “net” enrollment reflect the people who are dropped from Medicaid as well as those who newly enroll, and those who re-enroll within a short timeframe following disenrollment, also known as “churn.” Changes in parent firm enrollment may reflect activity including firm acquisitions or sales and new or lost Medicaid contracts. Although Medicaid enrollment has declined across parent firms since the start of the unwinding, the three firms that report Medicaid-specific revenue information (UnitedHealth, Molina, and Centene) reported year-over-year (2023 over 2022) growth in Medicaid revenue (18%, 6%, and 3%, respectively). Molina reported the medical margin earned by the Medicaid segment was $3.0 billion in 2023 (medical margin = premium revenue – medical costs). Since enrollment declines escalated throughout 2023, it’s possible that the Medicaid revenue picture for these firms could get worse in the coming months. However, it’s also possible that insurers have been able to maintain Medicaid revenues in spite of enrollment declines in part through retrospective rate adjustments.

Medicaid Enrollment Across the Five Firms Decreased Since the End of the Pandemic Continuous Enrollment Period from 44.2 Million to 39.9 Million or 10%.

Impact of unwinding for the five largest publicly traded companies operating Medicaid MCOs

All five firms report monitoring the impact of unwinding, including disenrollment, “churn”, coverage transitions, gaps in coverage, and changes in member acuity. Key highlights from Q2 – Q4 2023 earnings calls include:

  • Procedural Disenrollment. In earnings calls since the start of the unwinding, firms have reported procedural disenrollments make up a large percentage of their total disenrollments. Firms that provided estimates reported procedural disenrollment rates of 70% or above. Procedural disenrollments occur when an enrollee is unable to complete the renewal process. Elevance reported that disenrolled members are facing barriers to renewal, including awareness of the process and actions required to maintain coverage. In Q3 2023, Elevance reported that nearly 40% of their Medicaid members procedurally disenrolled were children/youth (under age 18). KFF tracking shows, overall, about 70% of disenrollments so far have been “procedural,” but the rate varies substantially across states. Many strategies are available to states to minimize procedural terminations, including temporary waivers that allow states to obtain updated enrollee contact information from MCOs, permit MCOs to assist enrollees in completing certain parts of renewal forms, and extend automatic reenrollment into an MCO plan from the standard 60 days up to 120 days.
  • “Churn”. According to firm monitoring, some individuals who have been disenrolled are reenrolling in Medicaid coverage. Firms report continuing with outreach efforts to help people retain or regain their Medicaid coverage or find other affordable coverage. Of the firms that shared this information, Medicaid reenrollment rates ranged from 20-30%. Centene noted that CMS action requiring states to reinstate coverage due to systems issues has impacted reenrollment rates.
  • Coverage Transitions. Firms are also monitoring transitions to coverage through the Affordable Care Act (ACA) Marketplace. All five firms offer a Marketplace plan in many states where they operate a Medicaid MCO, however, there may not be plan alignment if plans operate regionally. Centene reported 10-15% of members disenrolled from Medicaid transitioned to their Marketplace product. Other firms have not provided specific Marketplace transition rates/estimates but note one driver of Marketplace growth has been Medicaid redeterminations. Some individuals eligible for coverage in the Marketplace (which has higher income eligibility thresholds than Medicaid) qualify for plans with zero premiums; however, Medicaid may provide more comprehensive benefits and lower cost-sharing compared to Marketplace coverage. Recent data show that Marketplace signups have reached 21.3 million people, exceeding last year’s record high by another 5 million people. Medicaid unwinding is only one factor contributing to that growth – which is being driven in large part by enhanced premium subsidies – and a relatively small share of people disenrolled from Medicaid are transitioning to Marketplace or Basic Health Plan coverage.
  • Gaps in Coverage. Some enrollees are experiencing gaps in coverage that, according to some firms, can extend for multiple months. This is consistent with a pre-pandemic analysis of national survey data that show two-thirds of enrollees experience a period of uninsurance in the 12 months following Medicaid disenrollment. In focus groups conducted by KFF in September 2023 with Medicaid enrollees who recently completed the renewal process, several participants who were disenrolled reported facing substantial out-of-pocket costs for medically necessary care during gaps in coverage. Focus group participants also reported needing one-on-one assistance from caseworkers and community-based organizations to help them regain Medicaid coverage.
  • Member Acuity. In earnings calls, several firms reported states have been making mid-cycle and retrospective rate adjustments to account for the impact of redeterminations on average member acuity (i.e., health status, which can affect use of services and drugs). Although states may have built enrollment and acuity change assumptions into capitation rates (for 2023 and 2024), states and plans faced considerable uncertainty at the start of the unwinding–understanding that while membership losses would become immediately apparent, new utilization and acuity trends would take longer to discern. Prior to the start of unwinding, plans reported expecting the overall risk profile of members to increase, as they anticipated “stayers” would be sicker than “leavers.” At least one firm noted continued effects of risk corridors (where states and plans agree to share profit or losses) from earlier contract years, requiring plan payback.

Looking Ahead

As of December 2023 (timeframe for this analysis), states were nine months into the unwinding of the Medicaid continuous enrollment provision. It is highly uncertain what national Medicaid enrollment will be at the end of unwinding. Focus groups with enrollees revealed that while many have been able to successfully renew Medicaid coverage, many have been disenrolled due to confusion and barriers to completing the renewal process. While many individuals who are disenrolled may “churn” back to Medicaid or transition to other coverage, unwinding will likely contribute to increases in the number of people who are uninsured. People who are uninsured face more barriers to care, go without needed care, and may experience higher out of pocket costs and medical debt. Changes in the uninsured will depend on whether individuals who are no longer eligible and are disenrolled from Medicaid transition to other coverage, including employer plans and the Marketplace. Medicaid managed care plans have a financial interest in maintaining enrollment in Medicaid and facilitating transitions to the Marketplace (and other products). The five publicly traded firms that are the subject of this analysis account for about half of all Medicaid MCO enrollment nationally. Medicaid managed care plans can continue to assist state Medicaid agencies in communicating with enrollees, conducting outreach and renewal assistance, and in facilitating transitions to Marketplace coverage. Quarterly earnings reports and calls can provide further insight into the impact of the unwinding on Medicaid enrollees, including disenrollments, gaps in coverage and transitions to the Marketplace.

News Release

Survey: LGBT Adults Are Twice as Likely as Others to Say They’ve Been Treated Unfairly or with Disrespect by a Doctor or Other Health Care Provider

1 in 5 LGBT Adults Say They’ve Experienced Homelessness During Their Lives

Published: Apr 2, 2024

A third (33%) of LGBT adults say that a doctor or other health care provider treated them unfairly or with disrespect in the past three years – a rate twice as high as reported by people who don’t identify as LGBT (15%), a new KFF survey reveals. 

The shares who report unfair or disrespectful treatment are similar among LGBT adults across racial and ethnic groups, though Black and Hispanic LGBT adults are more likely than White LGBT adults to say that they experienced poor treatment specifically due to their race or ethnic background. 

In addition, LGBT adults are more likely than non-LGBT adults to report other negative experiences with a health care provider in the past three years, including a provider assuming something about them without asking (40% v. 17%), suggesting they personally were to blame for a health problem (32% v. 15%), or ignoring a direct request or question they asked (32% v. 14%).

“There is no good reason twice as many LGBT adults should be reporting being treated poorly by the health system compared to non-LGBT adults,” KFF President and CEO Drew Altman said. “Health professionals and health care institutions need to take a hard look at these data and themselves.” 

Substantial shares of LGBT adults report a recent negative experience with a provider that led to consequences, such as making them less likely to seek care (39%), leading them to switch providers (36%), or causing their health to get worse (24%).

Most LGBT adults (60%) say that they feel they have to be very careful about their appearance in order to be treated fairly and/or prepare themselves for insults when visiting a doctor or other health care provider.

This new report about LGBT experiences draws on data from KFF’s Survey on Racism, Discrimination, and Health, which examines those issues not only in health care but in other aspects of society, and their relationship to people’s health and well-being.

LGBT Adults More Likely to Experience Homelessness and Report Mental Health Challenges

The survey finds that 1 in 5 (22%) of LGBT adults say that they experienced homelessness at some point in their lives – twice the share among non-LGBT adults. At least a third of lower-income LBGT adults (39%) and Black LGBT adults (35%) say they experienced homelessness during their lives.

When asked to rate their own mental health, 39% of LGBT adults say it is “fair” or “poor.” This includes larger shares of younger LGBT adults (ages 18-29). Overall, about half (54%) of LGBT adults report feeling anxious either “always” or “often” in the past year, while a third report feeling lonely (33%) or depressed (32%) at least often. These rates are all about double the shares among non-LGBT adults.

LGBT adults who report experiencing some form of discrimination in their daily lives are more likely to report feeling lonely, depressed or anxious in the past year than those who rarely or never experience discrimination.

About four in ten (44%) LGBT adults say that they or a family member has ever experienced a severe mental health crisis that resulted in serious consequences such as homelessness, hospitalization, incarceration, self-harm or suicide – about twice the share of non-LGBT adults who report this (19%). Those with large support networks of family and friends are less likely to report such experiences compared to those with small support networks.

Nearly half of LGBT adults (46%) say there was at time in the past three years when they needed mental health services but didn’t get them, including two-thirds (68%) of LGBT adults who describe their mental health as “fair” or “poor.” Among those who received or tried to receive mental health care, roughly half say it was difficult to find a provider who could relate to their background and experience (51%), would take their health insurance (49%), or that they could afford (48%).

The KFF Survey on Racism, Discrimination and Health is a probability-based survey conducted online and via telephone with a total of 6,292 adults, including oversamples of Hispanic, Black, and Asian adults conducted June 6-August 7, 2023. Respondents were contacted via mail or telephone; and had the choice to complete the survey in English, Spanish, Chinese, Korean, or Vietnamese. Survey methodology was developed by KFF researchers in collaboration with SSRS, and SSRS managed sampling, data collection, weighting, and tabulation. The margin of sampling error is plus or minus seven percentage points for LGBT adults (n=521); and two percentage points for non-LGBT adults (n=5,771). LGBT adults are those who identify as lesbian, gay, bisexual, and/or transgender. 

Poll Finding

LGBT Adults’ Experiences with Discrimination and Health Care Disparities: Findings from the KFF Survey of Racism, Discrimination, and Health

Published: Apr 2, 2024

Findings

Introduction

LGBT adults in the U.S. are a growing population who have historically experienced health disparities. Past research shows that LGBT adults face increased challenges when it comes to mental health outcomes and access to care, experiences with serious mental health issues (particularly among trans adults), their physical health (including higher rates of disability among younger LGBT adults), and barriers to accessing and affording needed care. These negative experiences often occur at higher rates among LGBT adults who are younger, lower income, women, or report chronic illness or disability (for more detail on the demographics of LGBT adults, see Appendix). The Biden administration has issued recent executive orders aimed at combatting discrimination and disparities affecting LGBT adults, however, an increasing number of states have enacted policies seeking to restrict access to certain types of care for LGBT people, with youth access to gender affirming care being particularly impacted.

This report focuses on LGBT adults’ experiences with discrimination in their daily lives and in health care settings in addition to experiences with severe mental health crises, homelessness, well-being and stress, and experiences accessing mental health care. It also looks at the relationship between experiences with discrimination and adverse mental health outcomes, and, conversely, the importance of strong, local support networks in mitigating some of these outcomes.

These findings are based on analysis of KFF’s 2023 Racism, Discrimination, and Health Survey. A previous report from the survey focused on individuals’ experiences with racism and discrimination in health care and more broadly, and the relationship of those experiences to health and well-being.

Key Takeaways

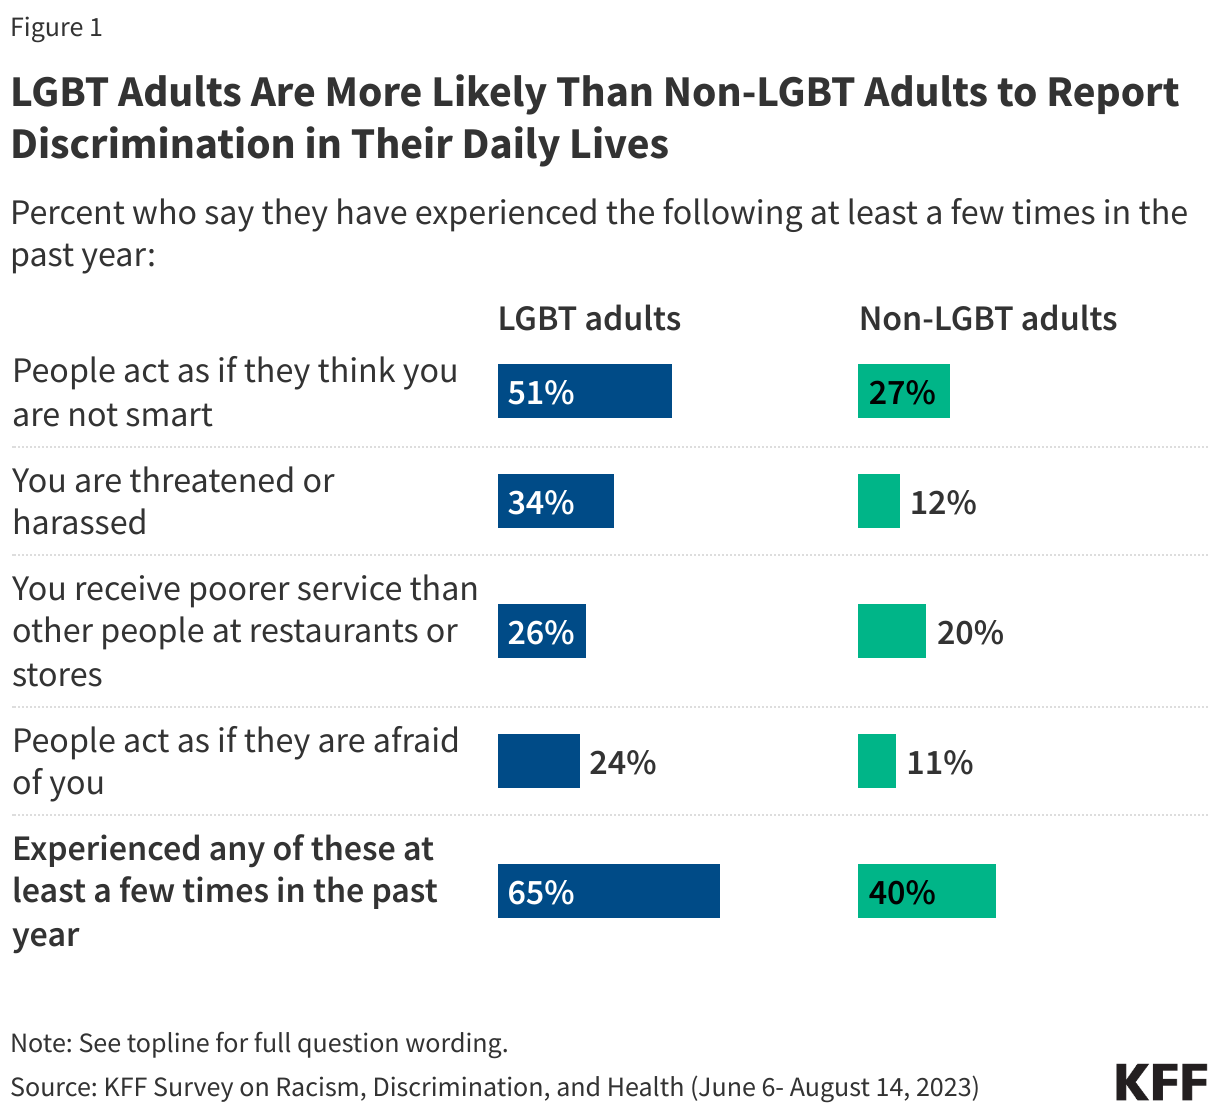
  • LGBT adults face higher rates of discrimination and unfair treatment in their daily lives compared to non-LGBT adults, including in health care settings. About two-thirds (65%) of LGBT adults compared to four in ten (40%) non-LGBT adults say they experienced at least one form of discrimination in their daily life at least a few times in the past year, including receiving poorer service than others at restaurants or stores, people acting as if they are afraid of them or as if they are not smart, being threatened or harassed, or being criticized for speaking a language other than English. LGBT adults are also twice as likely as non-LGBT adults to report negative experiences while receiving health care in the last three years, including being treated unfairly or with disrespect (33% v. 15%) or having at least one of several other negative experiences with a provider (61% v. 31%), including a provider assuming something about them without asking, suggesting they were personally to blame for a health problem, ignoring a direct request or question, or refusing to prescribe needed pain medication. Our previous report from this survey showed that among adults overall, some negative experiences with health care providers were reported at higher rates among Black and Hispanic adults compared to White adults. However, among LGBT adults these experiences appear to cut across racial and ethnic groups, with White LGBT adults reporting many of these experiences at similar rates to their Black and Hispanic peers.
  • LGBT adults are more likely than non-LGBT adults to report adverse consequences due to negative experiences with health care providers and to say they take steps to mitigate or prepare for unfair treatment when receiving care. Larger shares of LGBT adults compared to non-LGBT adults report having a negative health care experience in the past three years that caused their health to get worse (24% v. 9%), made them less likely to seek health care (39% v. 15%), or caused them to switch health care providers (36% v. 16%). Additionally, six in ten LGBT adults say they prepare for insults from health care providers or staff or feel that they need to be careful about their appearance to be treated fairly at least some of the time when seeking care, compared to four in ten (39%) non-LGBT adults who say the same.
  • Among LGBT adults, those who are lower income, younger, and women are more likely to face challenges with discrimination or unfair treatment in their daily life and while receiving health care. For example, eight in ten LGBT adults ages 18-29 and three-quarters of LGBT women (73%) report experiencing discrimination in their daily lives at least a few times in the past year, higher than the shares reported by older LGBT adults and LGBT men. Additionally, LGBT adults with household incomes below $40,000 are more likely than those with higher incomes to say they were treated unfairly or with disrespect by a health provider (41% v. 22%) and to report at least one of several negative experiences with a doctor or health care provider in the past three years (70% v. 51%).
  • Across several measures of mental health and well-being, including experiences with severe mental health crises, LGBT adults report worse outcomes compared to their non-LGBT peers. LGBT adults are more likely than non-LGBT adults to describe their own mental health as “fair” or “poor” and to report frequent worries about work, finances, politics and personal safety, as well as adverse effects of stress like problems with sleep or appetite and worsening chronic conditions. They are also twice as likely as non-LGBT adults to say they or a family member has ever experienced a severe mental health crisis that resulted in serious consequences like homelessness, hospitalization, incarceration, self-harm, or suicide (44% v. 19%). Over half of younger and lower-income LGBT adults report they or a family member experienced a severe mental health crisis.
  • Experiences with discrimination exacerbate mental health challenges for LGBT adults. LGBT adults who experienced discrimination in their daily lives at least a few times in the past year are about twice as likely as those who rarely or never experienced such discrimination to say they always or often felt anxious (65% v. 34%), lonely (42% v. 15%), or depressed (38% vs. 21%) in the past year.
  • For LGBT adults, having a strong local support network is a mitigating factor for experiences with severe mental health crises and regular feelings of loneliness and depression. LGBT adults who have at least a fair amount of friends and family living nearby who they can ask for help or support are less likely than those with fewer people in their support network to report experiences with severe mental health crises among themselves or a family member (54% v. 33%). In addition, LGBT adults with larger local support networks are less likely than those with just a few or no people in their support network to report regularly feeling lonely (25% v. 39%) or depressed (23% v. 40%) in the past year.
  • LGBT adults – including those with fair or poor mental health – are more likely than non-LGBT adults to report going without needed mental health care, with many reporting affordability and accessibility issues of these services. Nearly half of LGBT adults (46%) say there was at time in the past three years when they needed mental health services but didn’t get them, including two-thirds (68%) of LGBT adults who describe their mental health as “fair” or “poor.” Overall, LGBT adults are more than twice as likely non-LGBT adults to say there was a time when they didn’t receive needed mental health services in the past year.
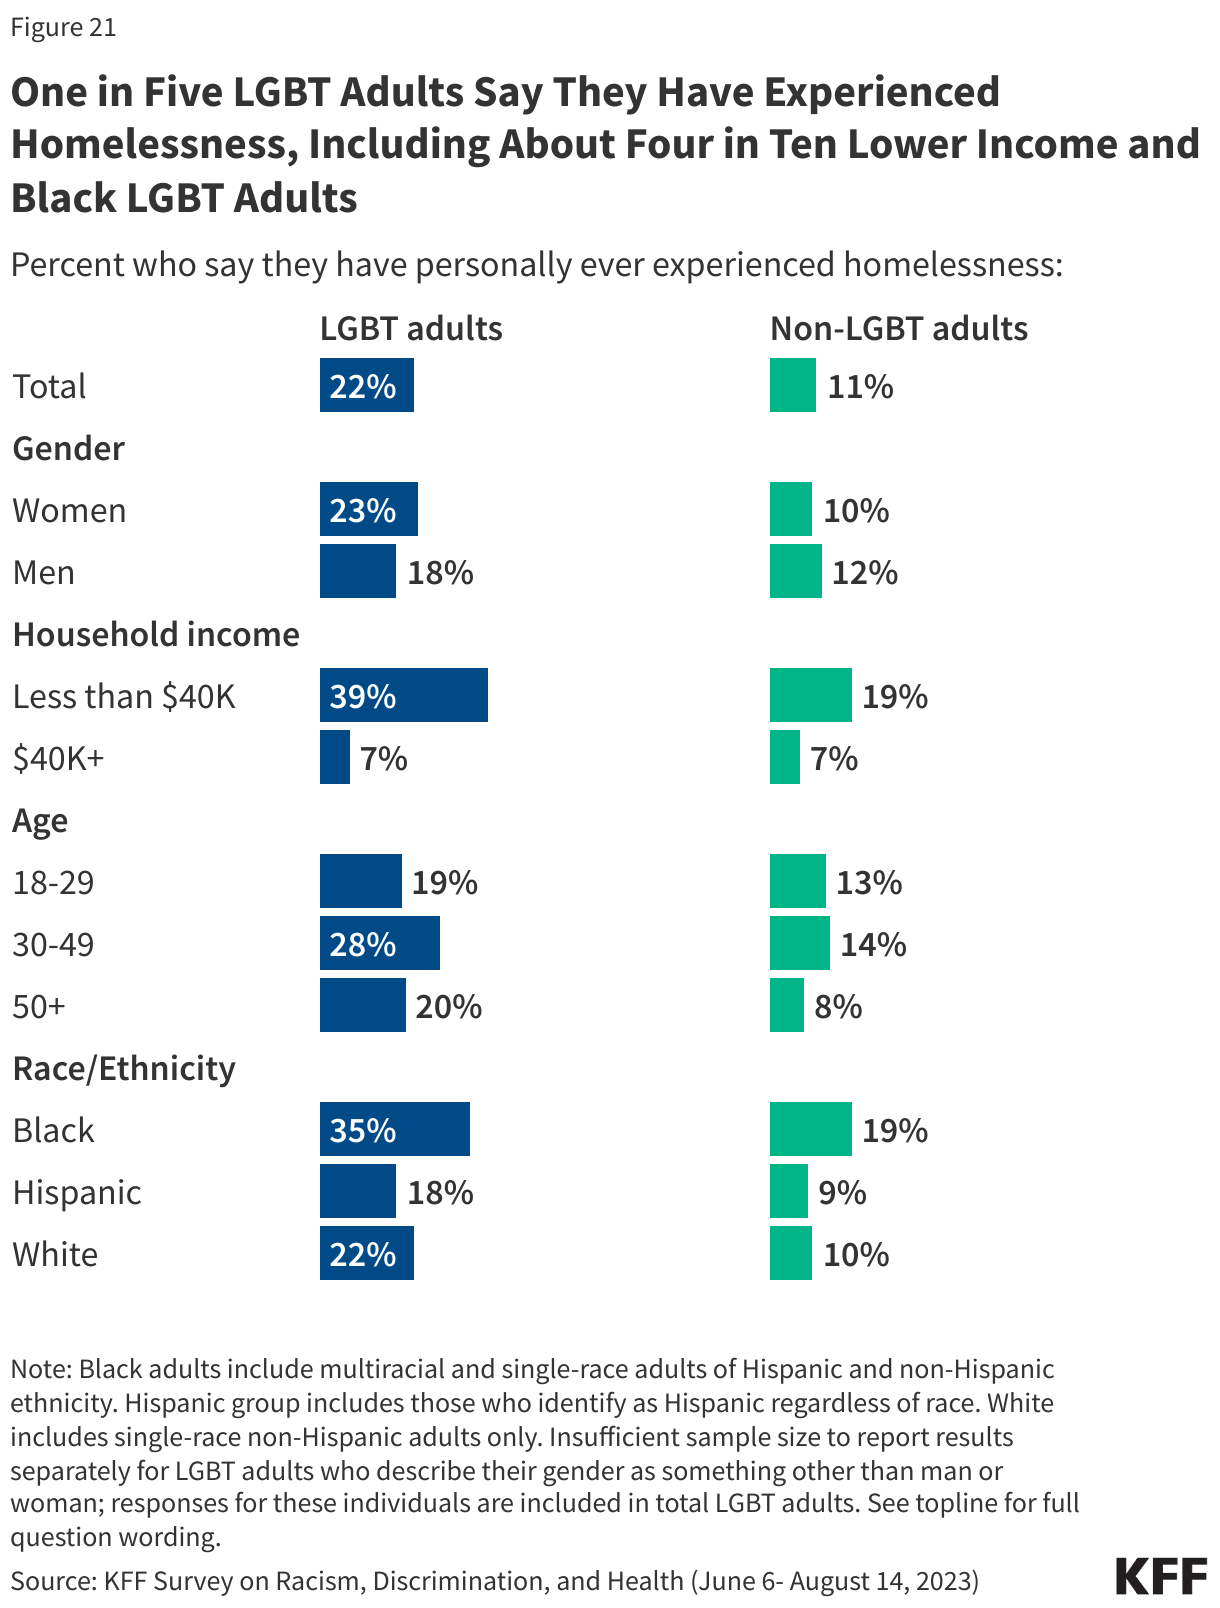
  • LGBT adults are twice as likely as non-LGBT adults to report having experienced homelessness, with larger shares of Black and lower income LGBT adults reporting personal experiences with homelessness. One in five (22%) LGBT adults say they have ever experienced homelessness – twice the share of non-LGBT adults who report this. The share of LGBT adults reporting experiences with homelessness rises to four in ten among lower income LGBT adults (39%) and about one-third of Black LGBT adults (35%).

This survey’s findings underscore and enhance our understanding of the ongoing challenges LGBT adults in the U.S. face, including with respect to experiences with stigma and discrimination and poorer mental health outcomes compared to non-LGBT peers. Indeed, these findings are likely intertwined. That is, experiences of stigma and discrimination can lead to challenges with mental health, particularly at a time when LGBTQ people’s rights and access to social institutions, including health care, have been called into question and politicized. The survey finds that in several cases, these challenges are faced most profoundly by LGBT women, young people, and those with lower incomes, highlighting some groups who may benefit most from additional support and resources.

The challenges revealed in this data also identify areas where additional attention to, and policy making around, social determinants of health, provider training, non-discrimination protections, addressing stigma, and combating social isolation, could improve LGBT people’s well-being, including in terms of access to care. Federal policy making may play an especially important role in addressing discrimination and access to care, given the patchwork of access and protection at the state level.

LGBT Adults’ Experiences with Discrimination in Daily Life

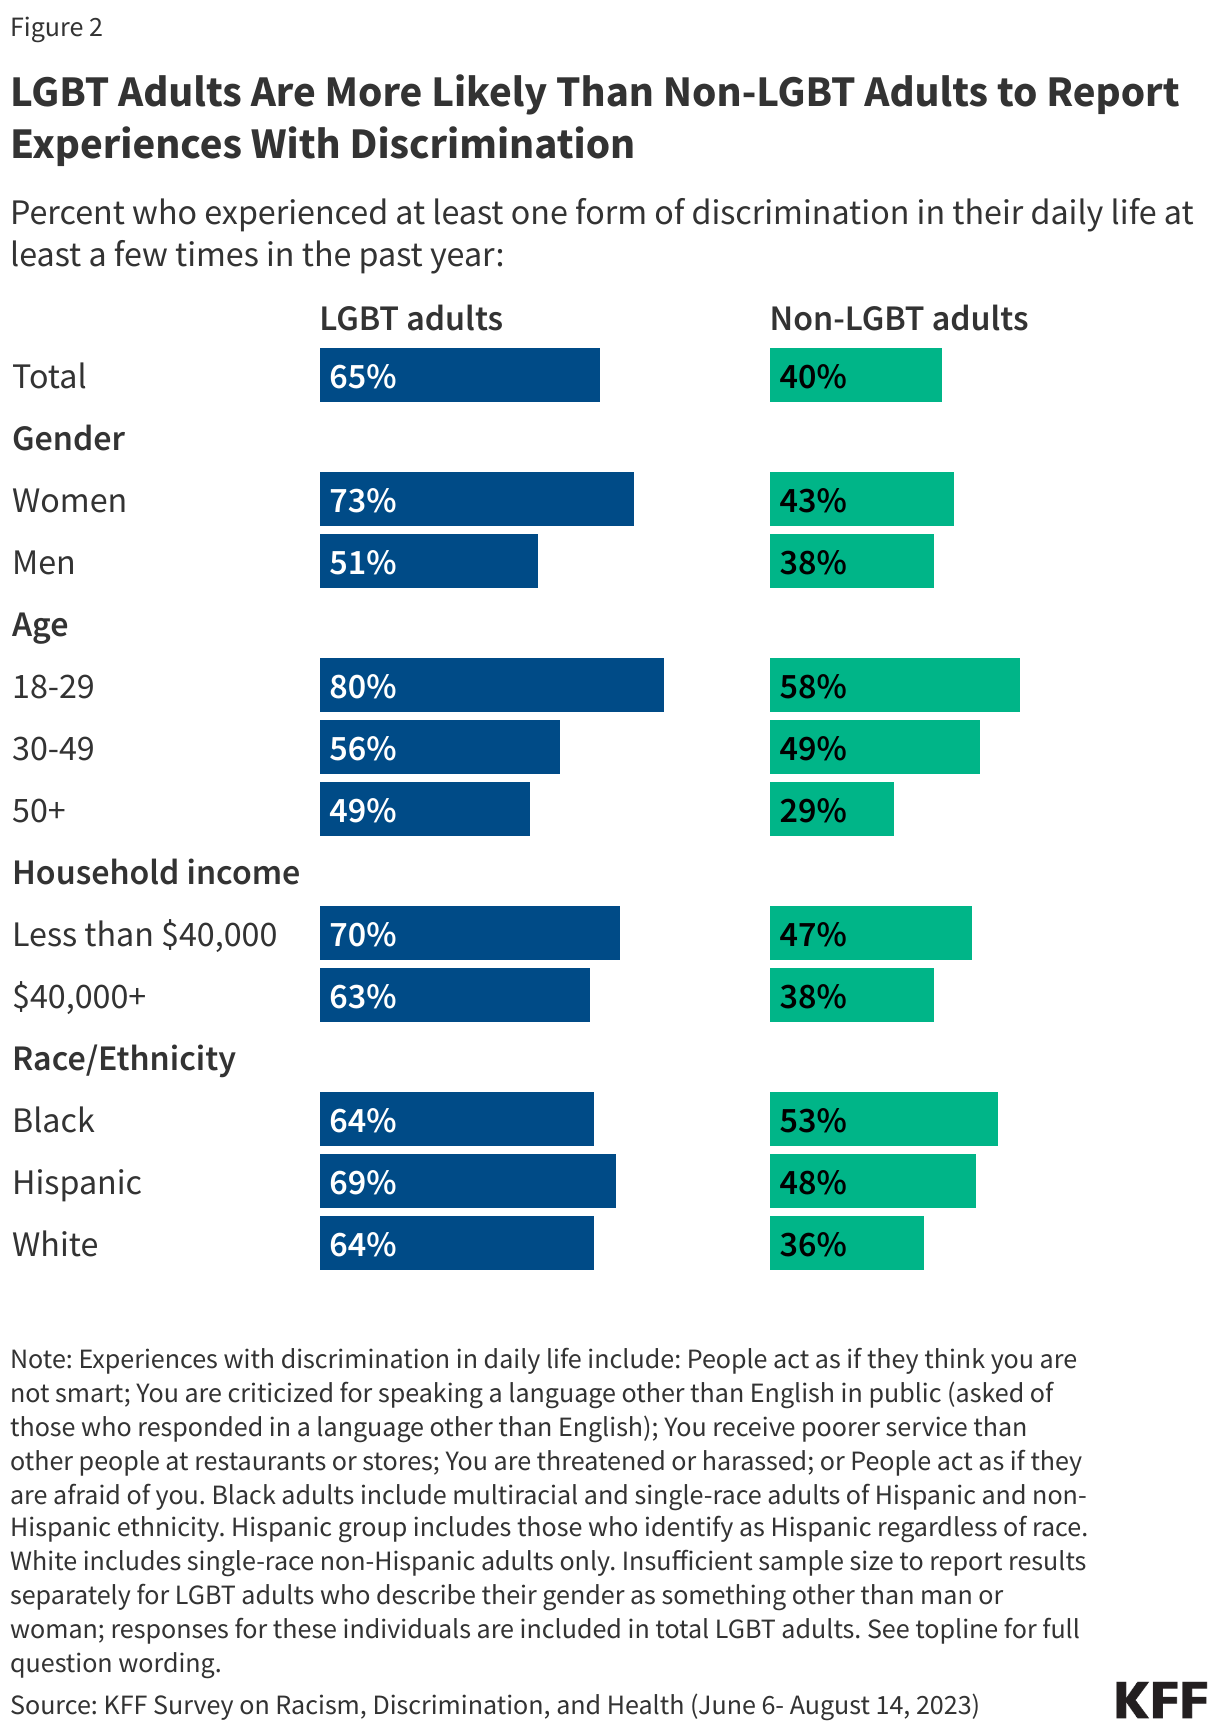
About two-thirds (65%) of LGBT adults say they experienced at least one type of discrimination in their daily life at least a few times in the past year compared to four in ten (40%) non-LGBT adults. LGBT adults are consistently more likely than non-LGBT adults to report specific types of discrimination asked about on the survey, which include people acting as if they are not smart (51% v. 27%), being threatened or harassed (34% v. 12%), receiving poorer service than others in restaurants or stores (26% v. 20%), and people acting as if they are afraid of them (24% v. 11%).

LGBT Adults Are More Likely Than Non-LGBT Adults to Report Discrimination in Their Daily Lives

Across demographics including gender, income, and age, LGBT adults are consistently more likely than non-LGBT adults to report experiencing at least one form of discrimination in their daily lives at least a few times a year. For example, seven in ten LGBT adults with household incomes below $40,000 report experiencing discrimination in their daily life at least a few times in the past year compared to about half (47%) of non-LGBT adults in the same income group. Hispanic and White LGBT adults are more likely than their non-LGBT peers to report experiencing discrimination at least a few times in the past year, while there is not a statistically significant difference in the share of Black LGBT adults and Black non-LGBT adults who report these experiences.

Among LGBT adults, women and younger adults are more likely to report experiences of discrimination than LGBT men and older LGBT adults. The share of LGBT adults who report experiencing at least one type of discrimination rises to eight in ten among those ages 18-29, compared to about half of those ages 30 and older. LGBT women are more likely than LGBT men to report experiencing discrimination in their daily life in the past year (73% v. 51%). The shares of LGBT adults reporting at least one type of discrimination in their daily lives do not differ significantly across race and ethnicity or income groups.

LGBT Adults Are More Likely Than Non-LGBT Adults to Report Experiences With Discrimination

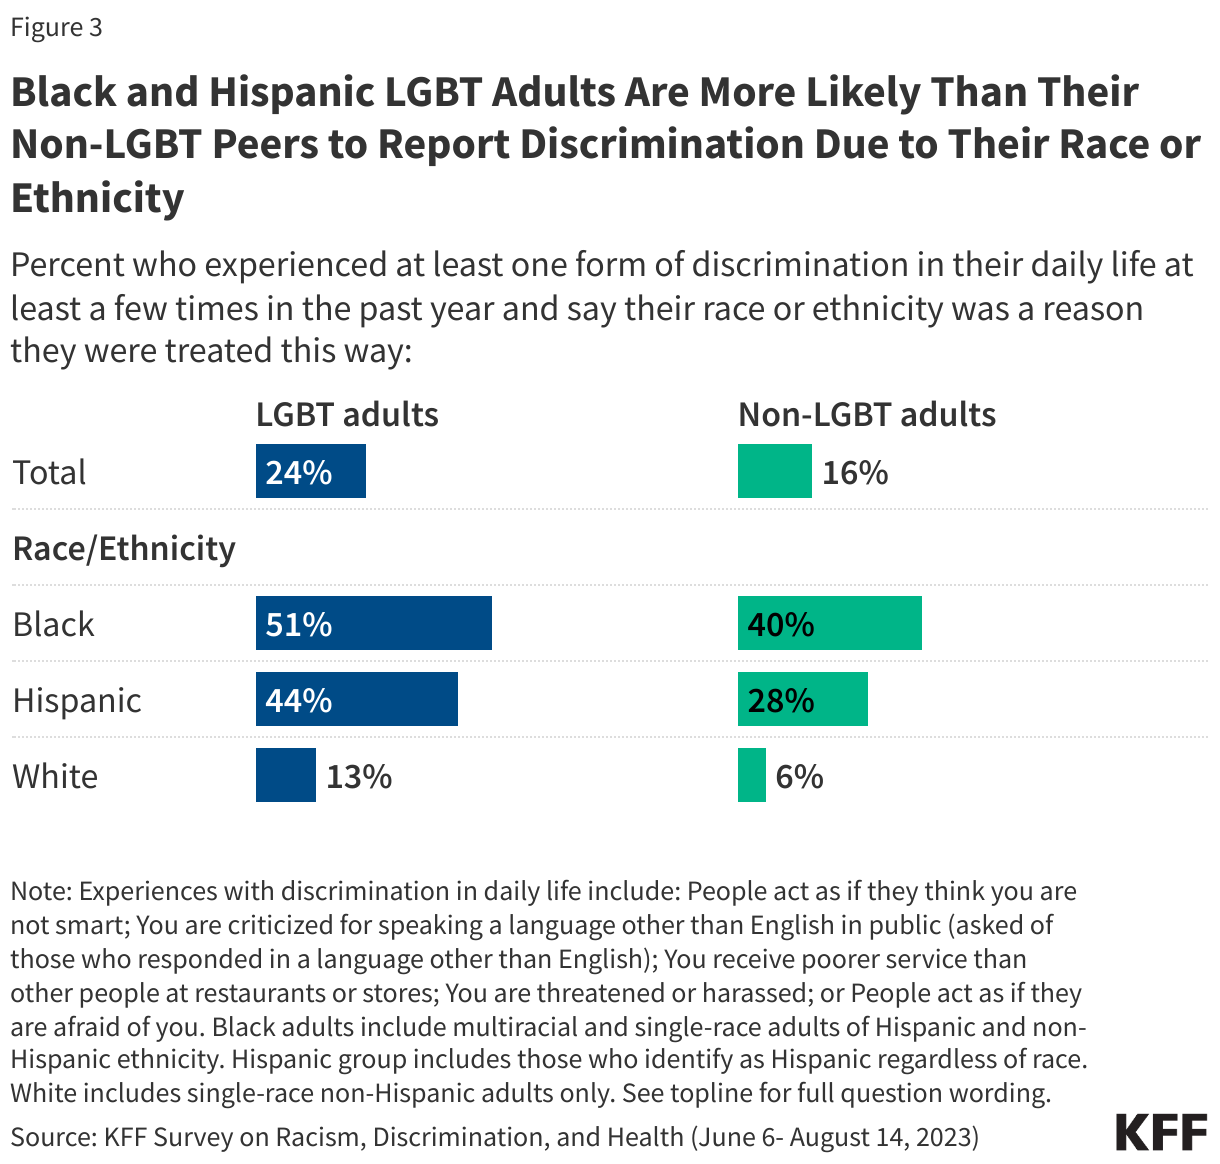
Black and Hispanic LGBT adults are more likely than their non-LGBT peers to say they experienced discrimination in their daily life and their race or ethnicity was a reason for these experiences. About half (51%) of Black LGBT adults and four in ten (44%) Hispanic LGBT adults say they experienced discrimination in the past year and their race or ethnicity was a reason they were treated this way compared to fewer non-LGBT Black adults (40%) and Hispanic adults (28%) who say the same. Few White LGBT adults (13%) and White non-LGBT adults (6%) report experiencing discrimination based on their race or ethnicity.

Black and Hispanic LGBT Adults Are More Likely Than Their Non-LGBT Peers to Report Discrimination Due to Their Race or Ethnicity

Experiences With Health Care Providers

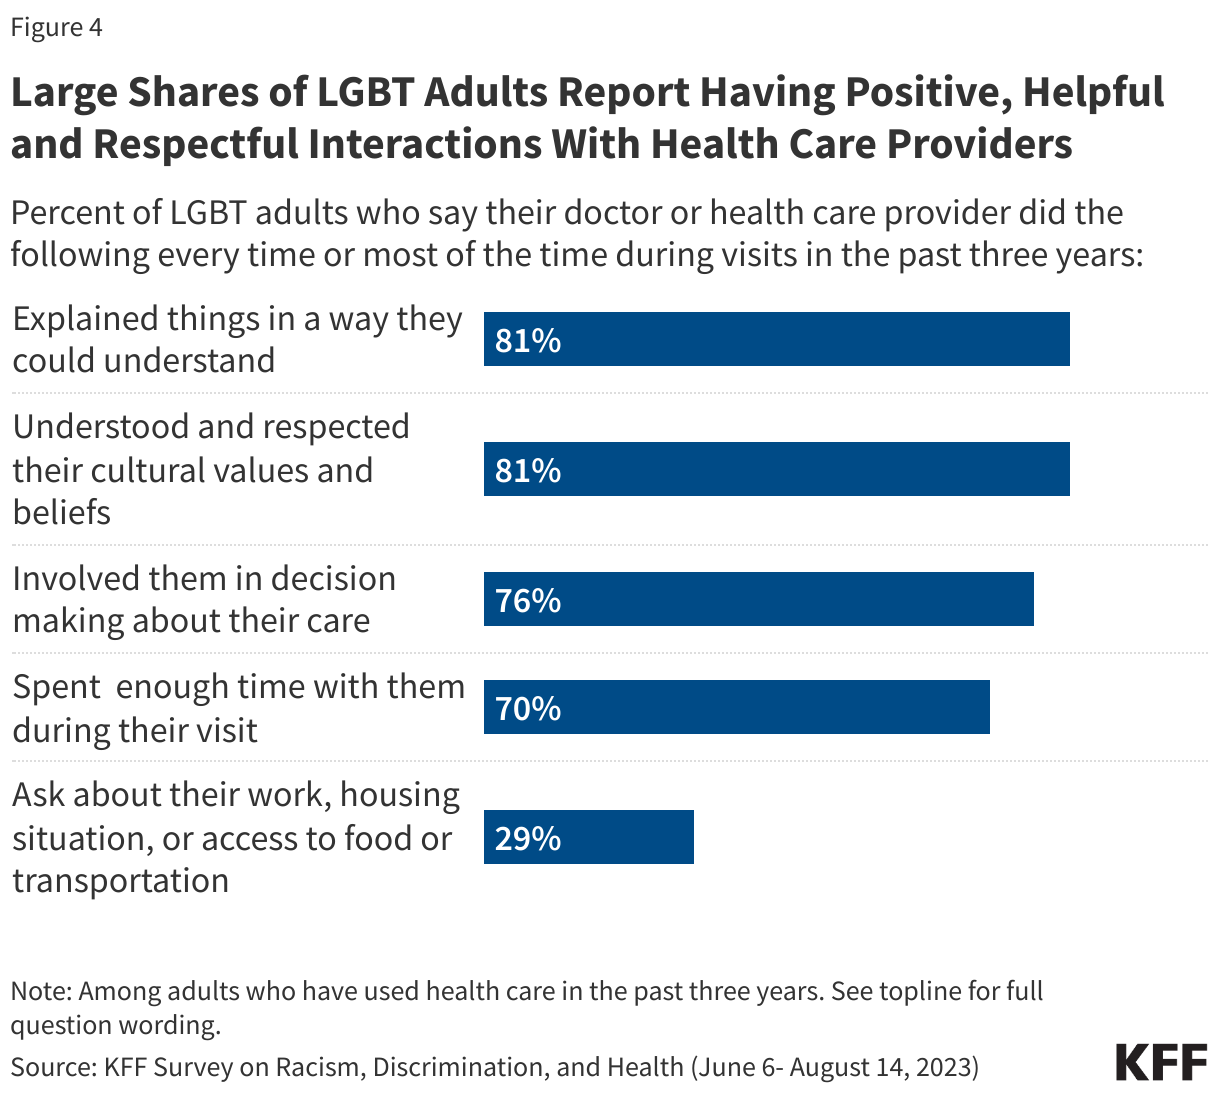
Most LGBT adults report having positive interactions with health care providers at least most of the time. Consistent with previously reported findings among adults overall, large shares of both LGBT and non-LGBT adults who have used health care in the past three years report having positive and respectful interactions with their health care providers, with at least seven in ten saying their doctor or provider did the following at least “most of the time” during visits in the past three years: explained things in a way they could understand (81%); understood and respected their cultural values and beliefs (81%); involved them in decision making about their care (76%); and spent enough time with them during their visit (70%). A much smaller share of LGBT adults (29%) say their doctor or provider asked them about their work, housing situation, or access to food or transportation at least most of the time during visits.  Among LGBT adults, consistently large shares across demographic groups report having these positive provider interactions at least most of the time in the past three years.

Large Shares of LGBT Adults Report Having Positive, Helpful and Respectful Interactions With Health Care Providers

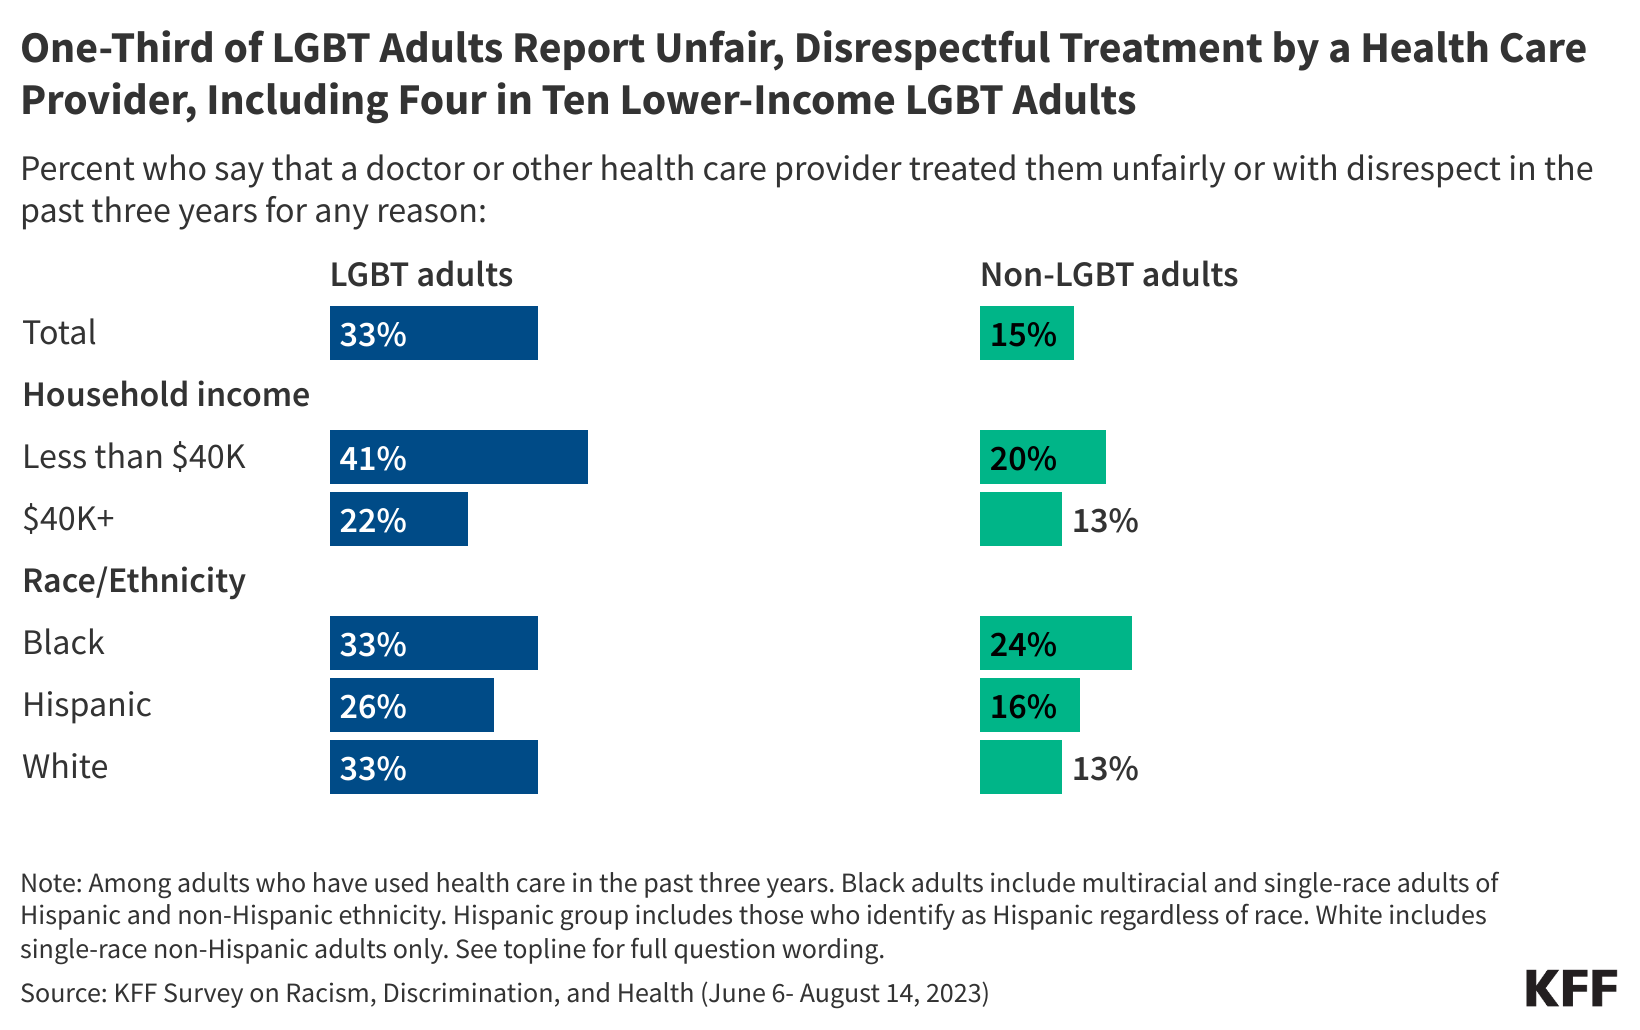
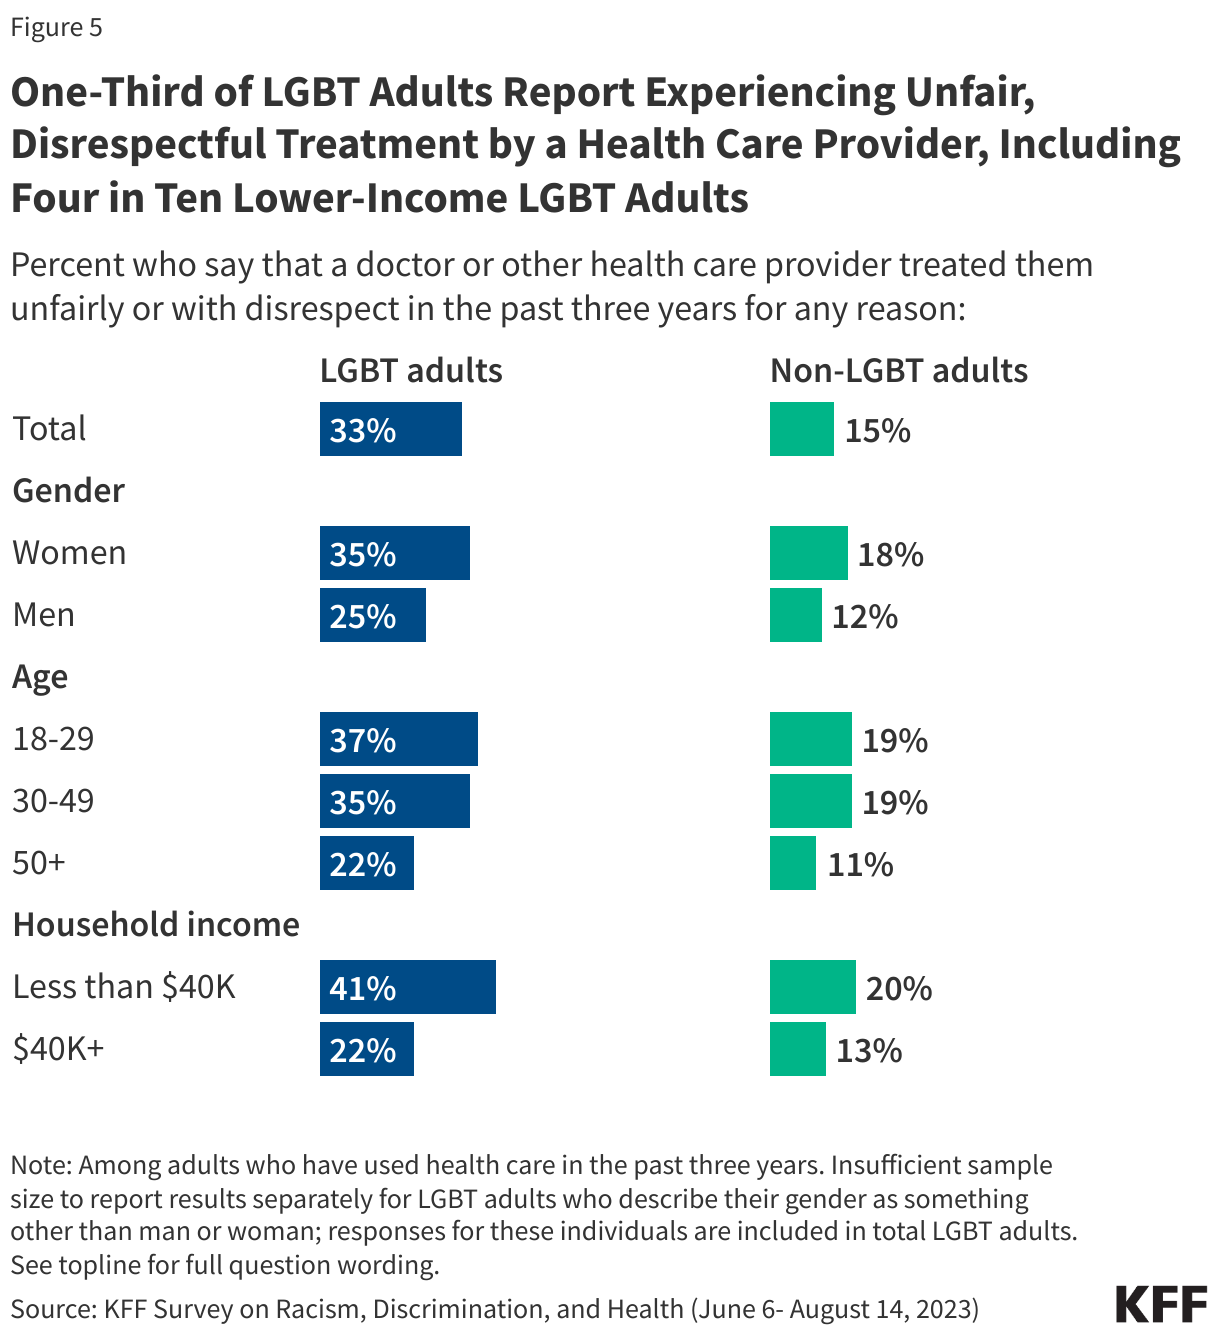
Despite these overall positive experiences, LGBT adults are more likely than non-LGBT adults to report unfair or disrespectful treatment by providers while receiving health care, with even larger shares among younger LGBT adults and those with lower incomes reporting these experiences. LGBT adults who have used health care in the past three years are twice as likely as non-LGBT adults (33% v. 15%) to say they were treated unfairly or with disrespect by a doctor or health care provider for any reason in the past three years. These differences hold across some demographic groups, with LGBT adults consistently more likely than non-LGBT adults to report unfair or disrespectful treatment regardless of income, gender, or age.

The shares of LGBT adults reporting unfair or disrespectful treatment include four in ten (41%) with household incomes below $40,000 who are more likely than LGBT adults with higher incomes (22%) to report unfair treatment. Among LGBT adults, those ages 18-29 are more likely than those ages 50 and over to report unfair treatment in the past three years.

One-Third of LGBT Adults Report Experiencing Unfair, Disrespectful Treatment by a Health Care Provider, Including Four in Ten Lower-Income LGBT Adults

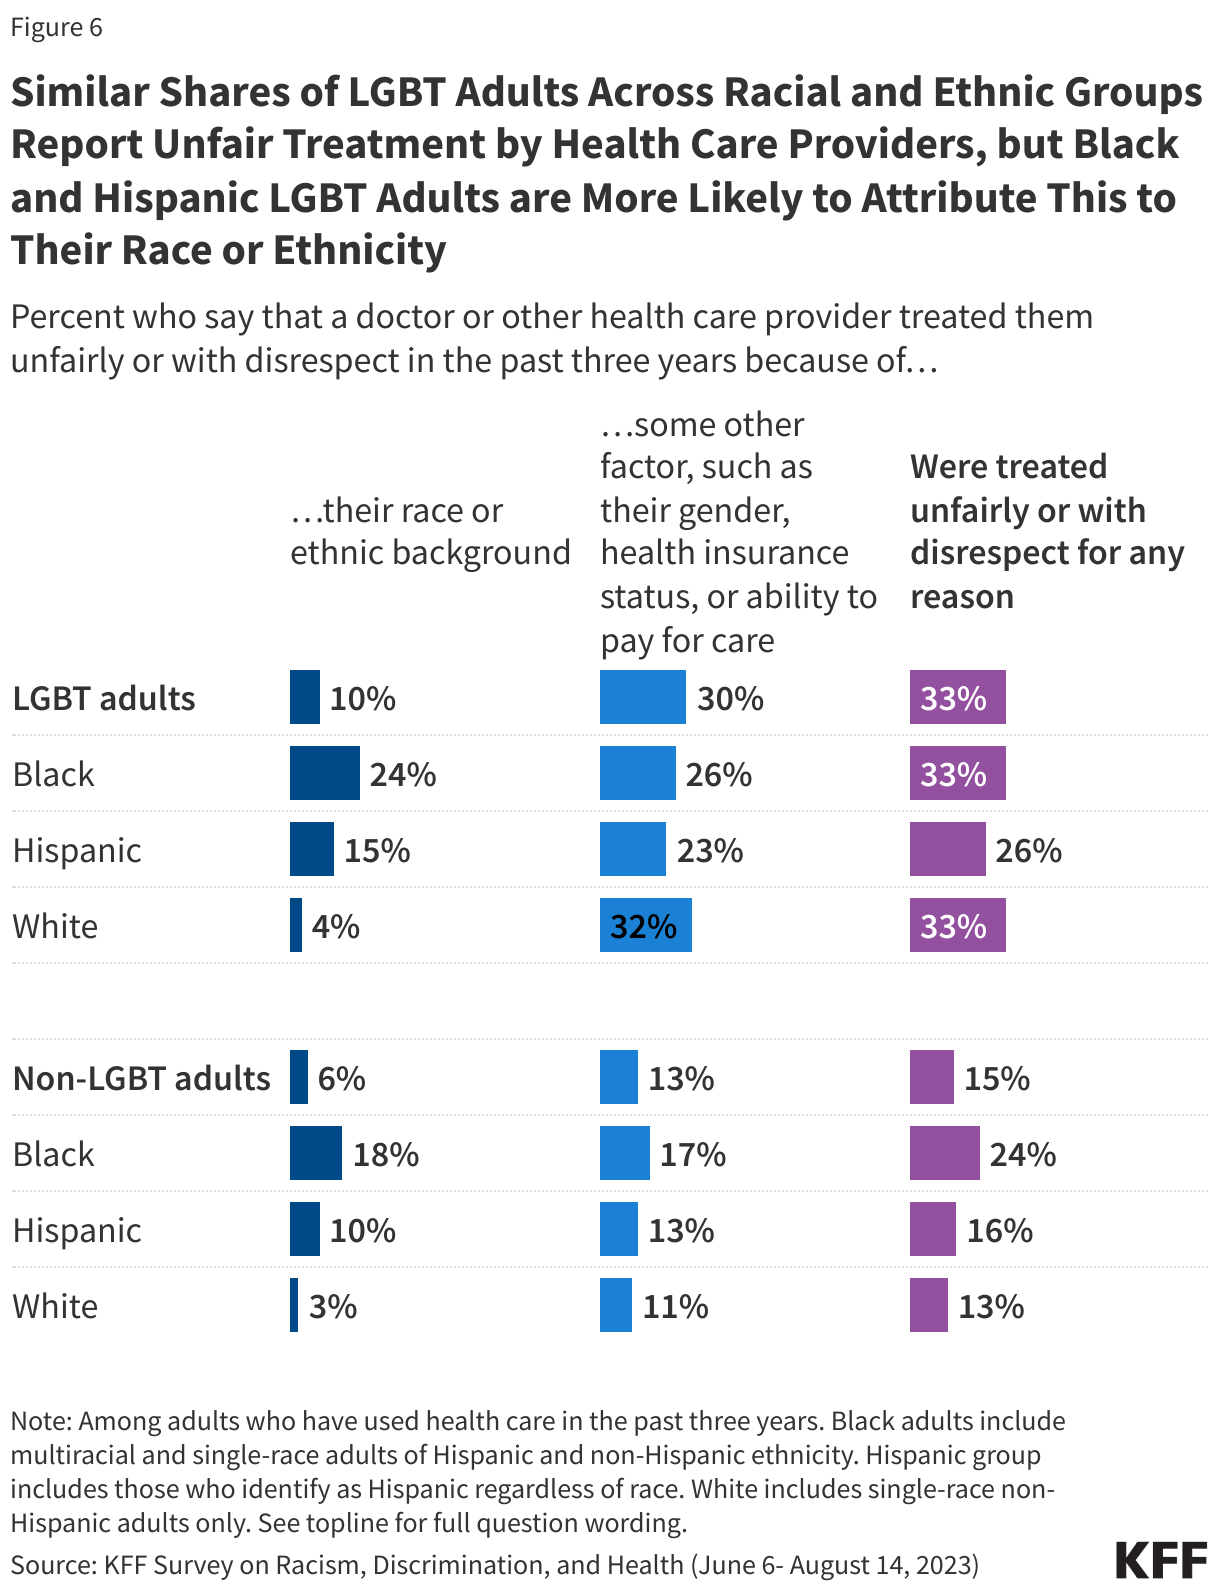
Black and Hispanic LGBT adults are more likely than their White counterparts to report being treated unfairly or with disrespect by a health care provider because of their racial or ethnic background, but unfair treatment for other reasons cuts across racial and ethnic groups among LGBT adults. A quarter (24%) of Black LGBT adults and 15% of Hispanic LGBT adults who used health care in the past three years say they were treated unfairly or with disrespect by a doctor or health care provider in the past three years because of their racial or ethnic background compared to fewer White LGBT adults (4%). When adding in the shares who say they were treated unfairly for some other reason such as their gender, health insurance status, or ability to pay for care, the combined shares reporting unfair treatment for any reason are similar across Black (33%), Hispanic (26%), and White (33%) LGBT adults.

Notably, across race and ethnicity LGBT adults are more likely than their non-LGBT peers to say a doctor or health care provider treated them unfairly or with disrespect in the past three years because of something besides their race or ethnicity, including among Black adults (26% vs. 17%), Hispanic adults (23% vs. 13%), and White adults (32% vs. 11%).

Similar Shares of LGBT Adults Across Racial and Ethnic Groups Report Unfair Treatment by Health Care Providers, but Black and Hispanic LGBT Adults are More Likely to Attribute This to Their Race or Ethnicity

In Their Own Words: Descriptions of Being Treated Unfairly or Disrespectfully by Health Care ProvidersIn open-ended responses describing instances of unfair treatment by health care providers, LGBT adults describe being interrogated about their sex lives, having their gender identity dismissed, and being ignored or disregarded.

“Despite repeatedly refusing opioids and pain medication, I was assumed to be and treated as if I was trying to scam them into providing me with drugs. When picking up my prescribed medication at a pharmacy, I was told that it was against policy to provide me with my medication, with no further reasoning provided. When I calmly asked for more explanation, they threatened to call the police. When doctors have found out about my LGBTQIA identity, they have interrogated me about my sex life repeated.” – 26-year-old LGBT adult from Virginia

“I am a transgender woman and I still have my legal name, outside of my Gender Clinic… every other doctor I’ve gone to has used my deadname and misgendered me despite me introducing myself as my chosen name and gender.” – 18-year-old LGBT adult from New York

“A male doctor was condescending about health information that I am already well-educated on and did not explain well all of the options available to me re: birth control and family planning. I also felt insulted by a comment he made about my sexual history, which may have been directed at my bisexuality.” – 23-year-old LGBT adult from Alabama

“They acted as if I wasn’t there as if I was not human.”– 38-year-old LGBT adult from Ohio

“Seemed dismissed as a person. Just received minimal care and not any respect as a person with a health issue. Felt like just a bother to their day.”– 24-year-old LGBT adult from Tennessee

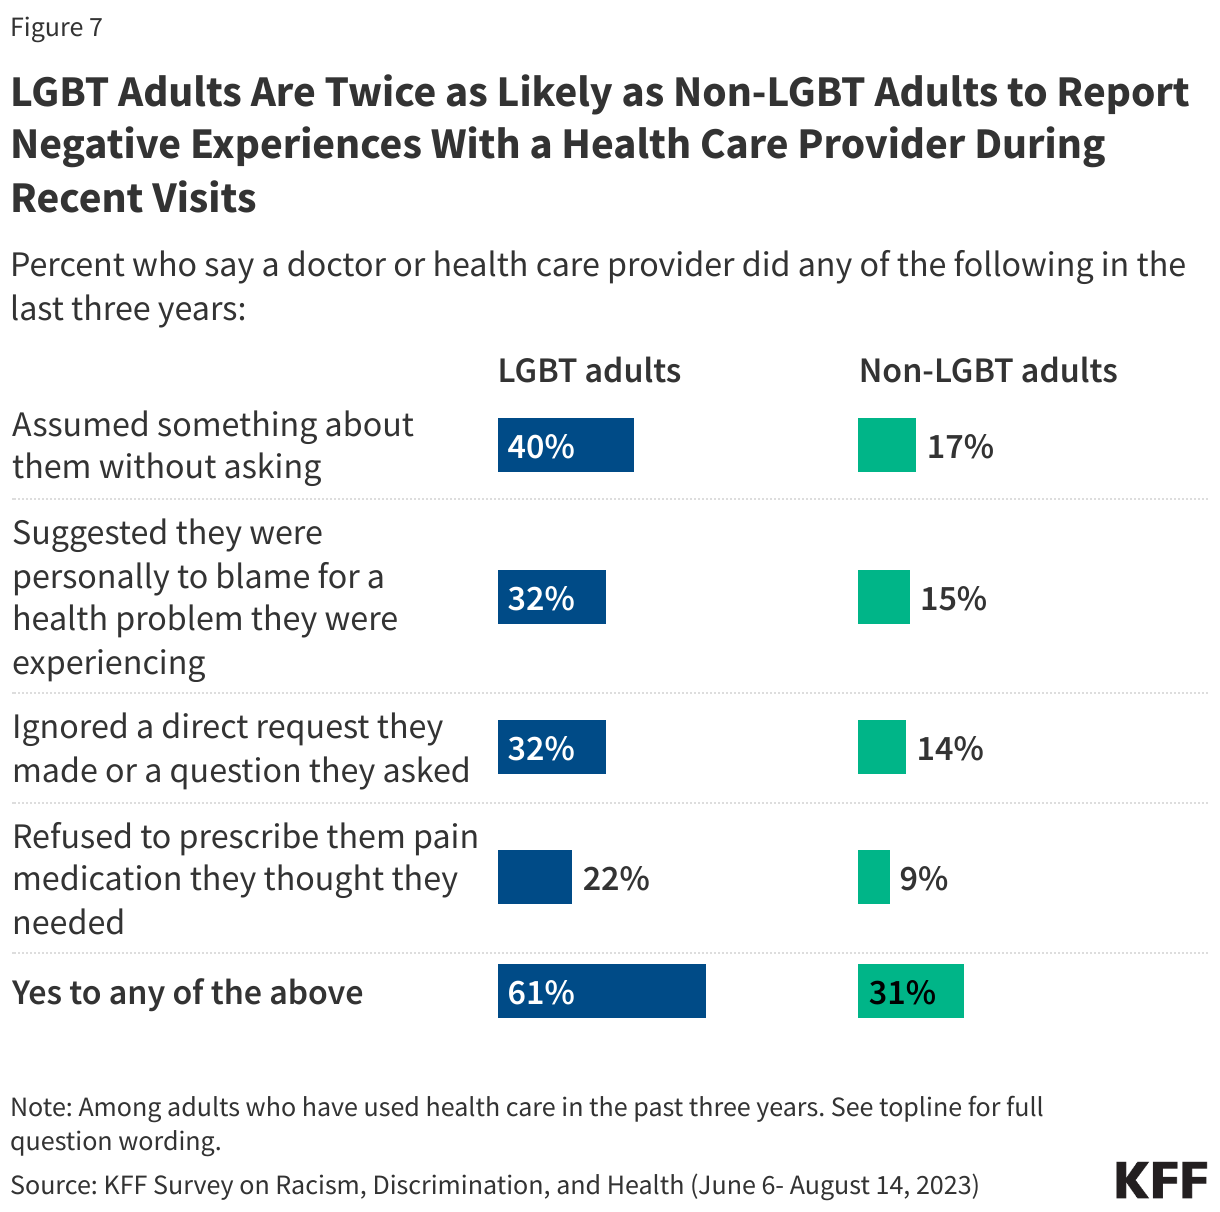
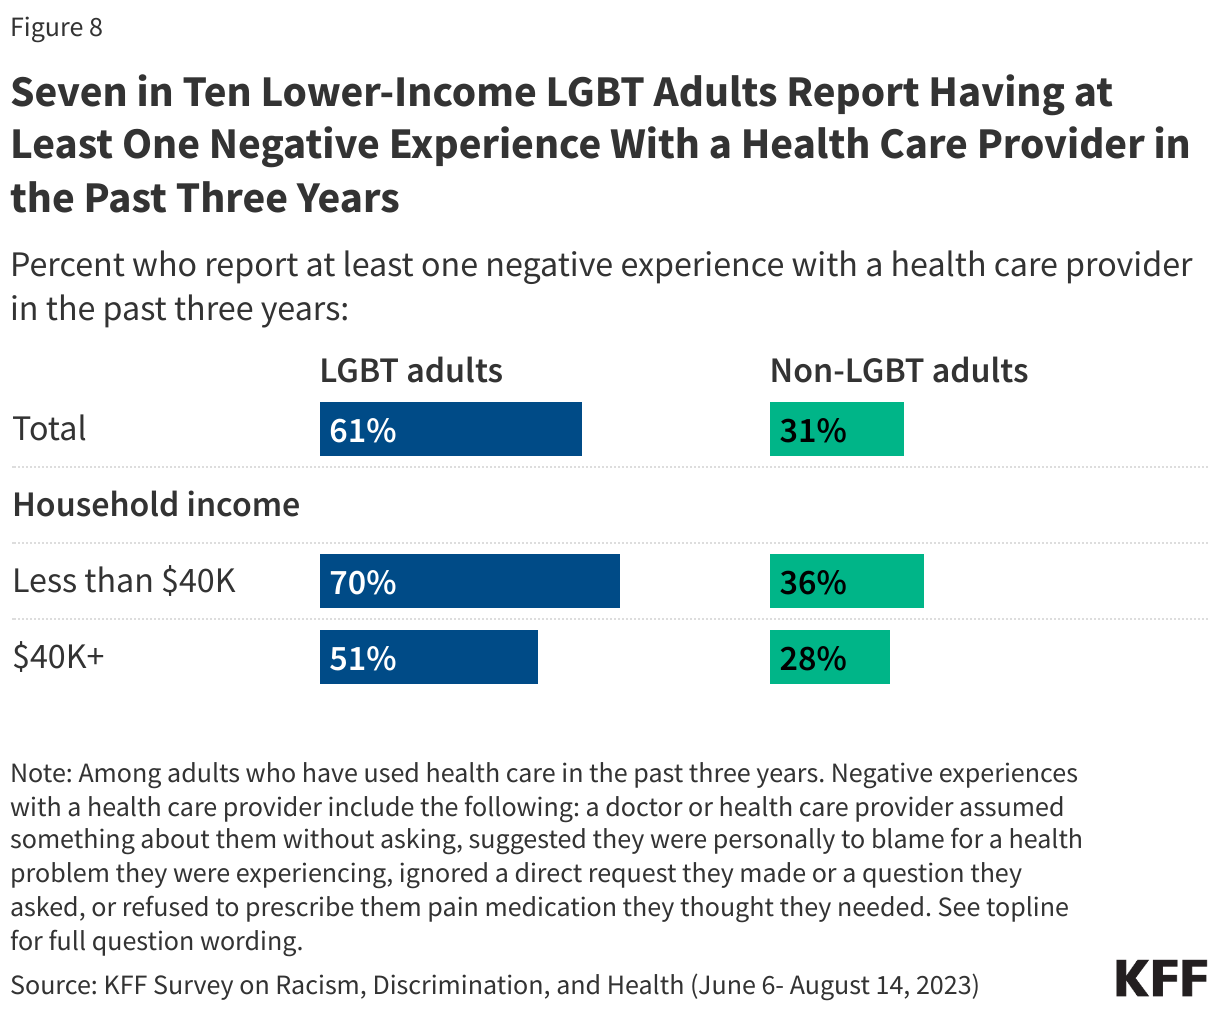
In addition to general unfair and disrespectful treatment by health care providers, six in ten (61%) LGBT adults report at least one of several negative experiences with a health care provider in the last three years compared to three in ten (31%) non-LGBT adults. Regarding specific negative experiences measured in the survey, LGBT adults are twice as likely as non-LGBT adults to report that a doctor or provider assumed something about them without asking, suggested they were personally to blame for a health problem, ignored a direct request or a question they asked, or refused to prescribe needed pain medication.

LGBT Adults Are Twice as Likely as Non-LGBT Adults to Report Negative Experiences With a Health Care Provider During Recent Visits

Lower-income LGBT adults are more likely to report negative provider experiences. Overall, seven in ten LGBT adults with household incomes below $40,000 report at least one of these negative experience with a health care provider in the past three years compared to about half (51%) of those with higher incomes. While lower income adults overall are more likely to report at least one of these negative provider experiences, among lower income adults, LGBT adults are still about twice as likely as non-LGBT adults to report at least one of these experiences (70% v. 36%).

Seven in Ten Lower-Income LGBT Adults Report Having at Least One Negative Experience With a Health Care Provider in the Past Three Years

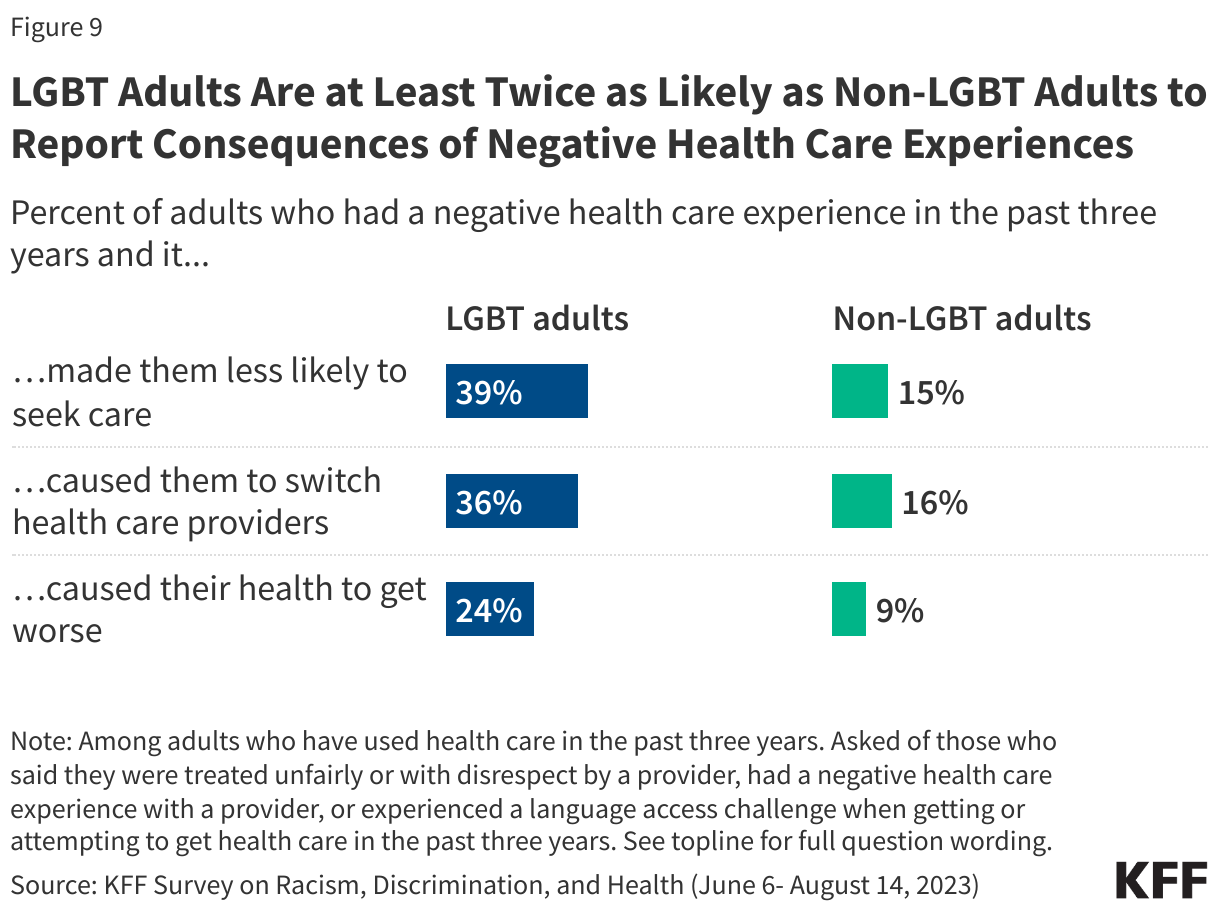
Many LGBT adults say negative health care experiences have had consequences on their willingness to seek care and on their physical health. LGBT adults are at least twice as likely as non-LGBT adults to report having a negative health care experience – including being treated unfairly or with disrespect, a negative provider interaction, or difficulty with language access – in the last three years that caused their health to get worse (24% v. 9%), made them less likely to seek health care (39% v. 15%), or caused them to switch health care providers (36% v. 16%).

LGBT Adults Are at Least Twice as Likely as Non-LGBT Adults to Report Consequences of Negative Health Care Experiences

Reflecting these negative experiences, most LGBT adults say they take steps to try to mitigate or prepare for unfair treatment during health care visits. Six in ten LGBT adults say they prepare for possible insults or feel they need to be careful about their appearance to be treated fairly at least some of the time during health care visits compared to fewer non-LGBT adults who say the same (39%). Our previous report from the Racism, Discrimination and Health Survey found that among all adults, Black, Hispanic, Asian, and American Indian and Alaska Native adults are more likely than White adults to report these experiences. This analysis finds that these experiences cut across racial and ethnic groups among LGBT adults, with similar shares of Black (63%), Hispanic (61%) and White (60%) LGBT adults saying they have to be careful about their appearance to be treated fairly or prepare for insults during visits with health care providers at least some of the time.

Six in Ten LGBT Adults Say They Feel They Have to Be Careful About Their Appearance or Prepare for Insults During Health Care Visits

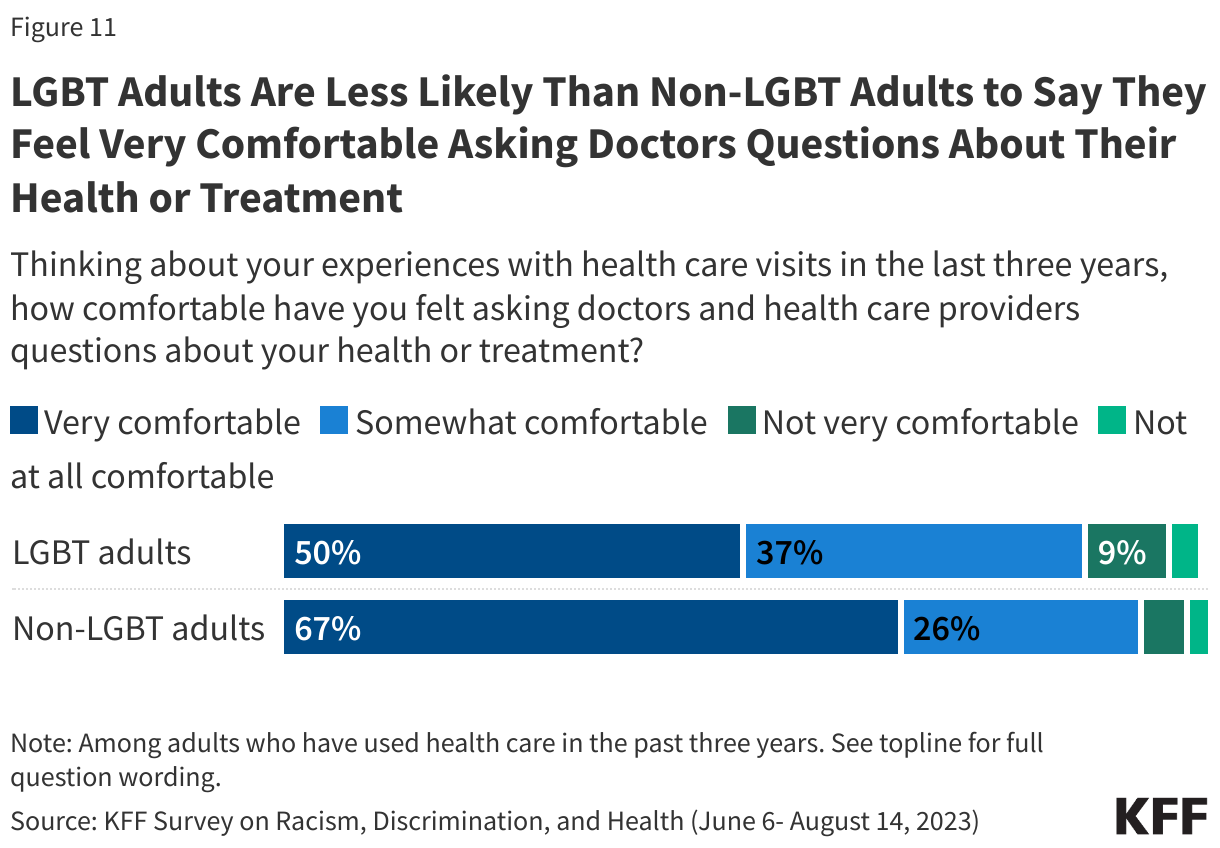
LGBT adults also express less comfort asking questions during health care visits compared to non-LGBT adults, which may have implications for the quality of care they receive. Half (50%) of LGBT adults who have used health care in the past three years say they have felt “very comfortable” asking doctors and other health care providers questions about their health or treatment during visits in the past three years, smaller than the share of non-LGBT adults who say the same (67%). While most LGBT adults – including similar shares across race and ethnicity, gender, income, age and coverage type – say they feel at least “somewhat comfortable” asking a doctor or provider these questions, one in eight (12%) say they feel “not very” or “not at all comfortable.”

LGBT Adults Are Less Likely Than Non-LGBT Adults to Say They Feel Very Comfortable Asking Doctors Questions About Their Health or Treatment

Mental Health and Well-being Among LGBT Adults

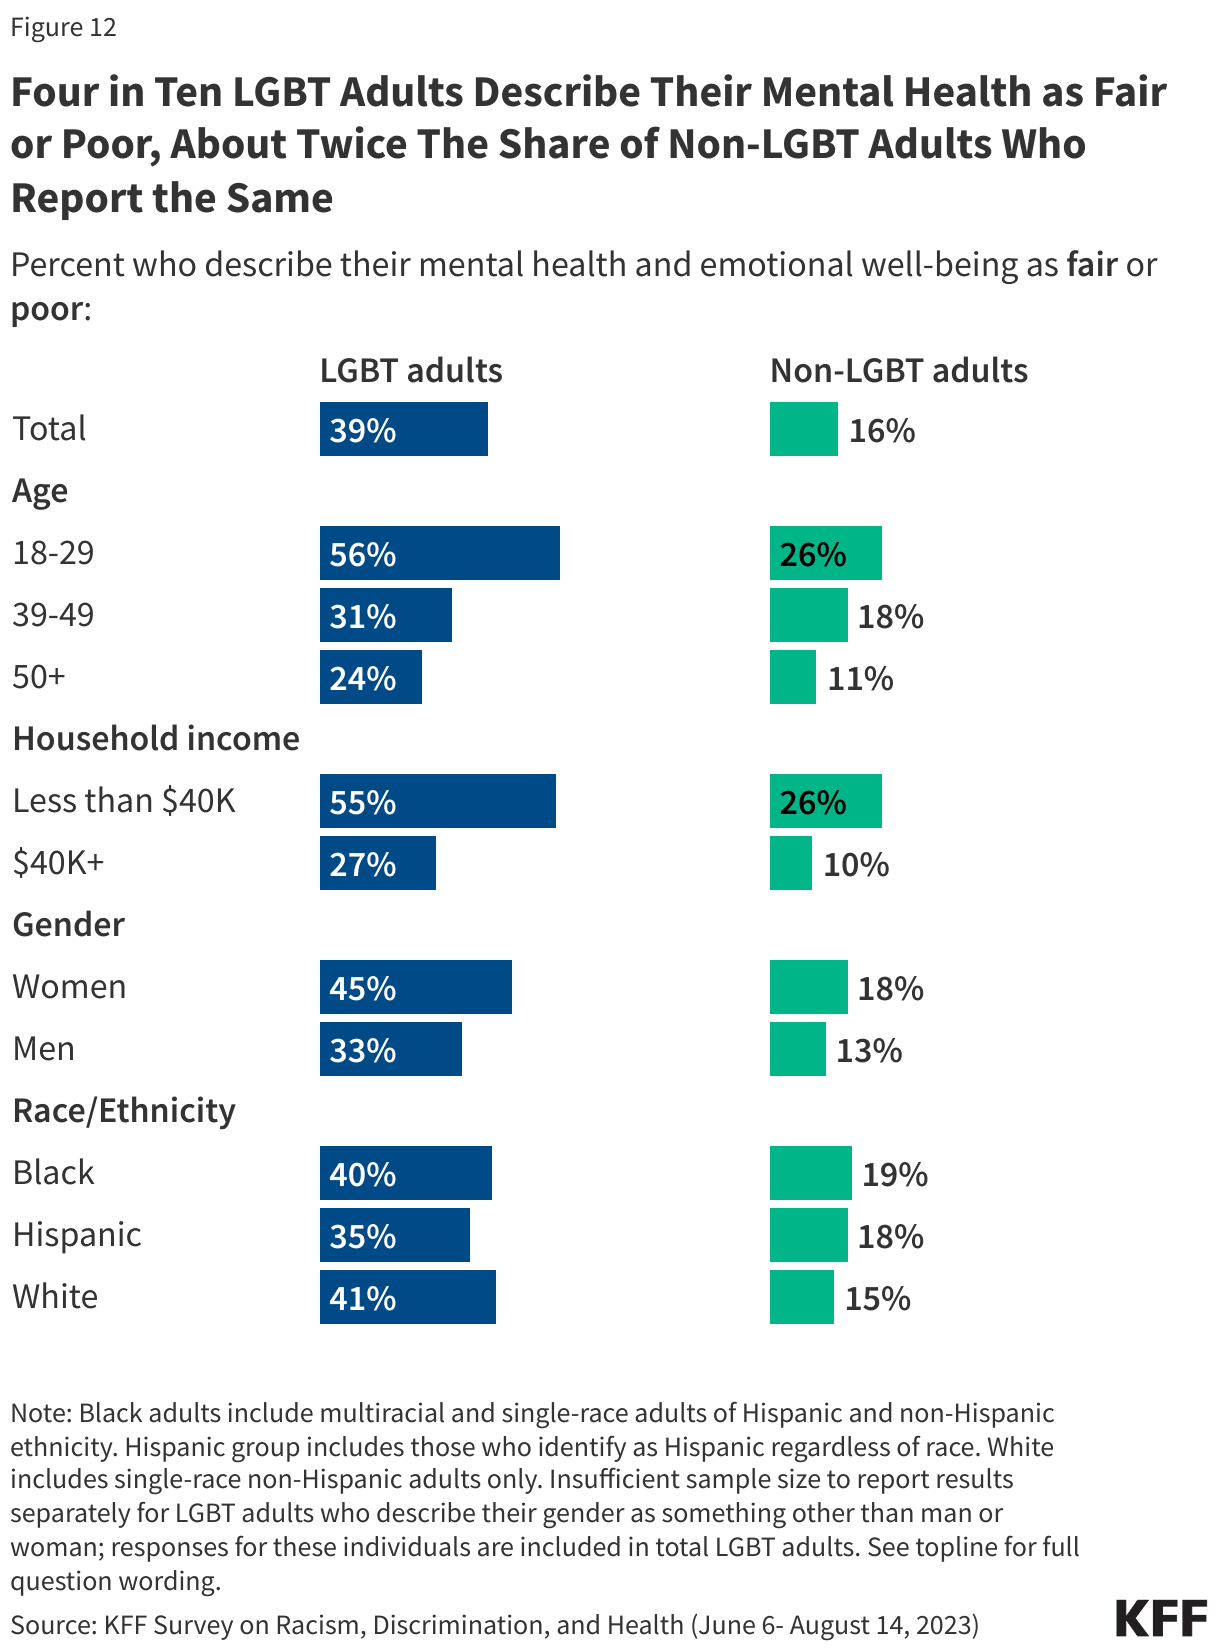
Four in ten LGBT adults describe their mental health as “fair” or “poor,” rising to over half of younger LGBT adults and those with lower incomes. Consistent with previous surveys, LGBT adults are more likely than non-LGBT adults to describe their mental health and emotional well-being as either “fair” or “poor” (39% v. 16%). LGBT adults with household incomes below $40,000 are about twice as likely as LGBT adults with higher incomes to report fair or poor mental health (55% v. 27%), as are LGBT adults ages 18-29 compared to those ages 50 and older (56% v. 24%). Across racial and ethnic groups, about four in ten Black (40%), Hispanic (35%) and White (41%) LGBT adults describe their mental health as fair or poor.

Four in Ten LGBT Adults Describe Their Mental Health as Fair or Poor, About Twice The Share of Non-LGBT Adults Who Report the Same

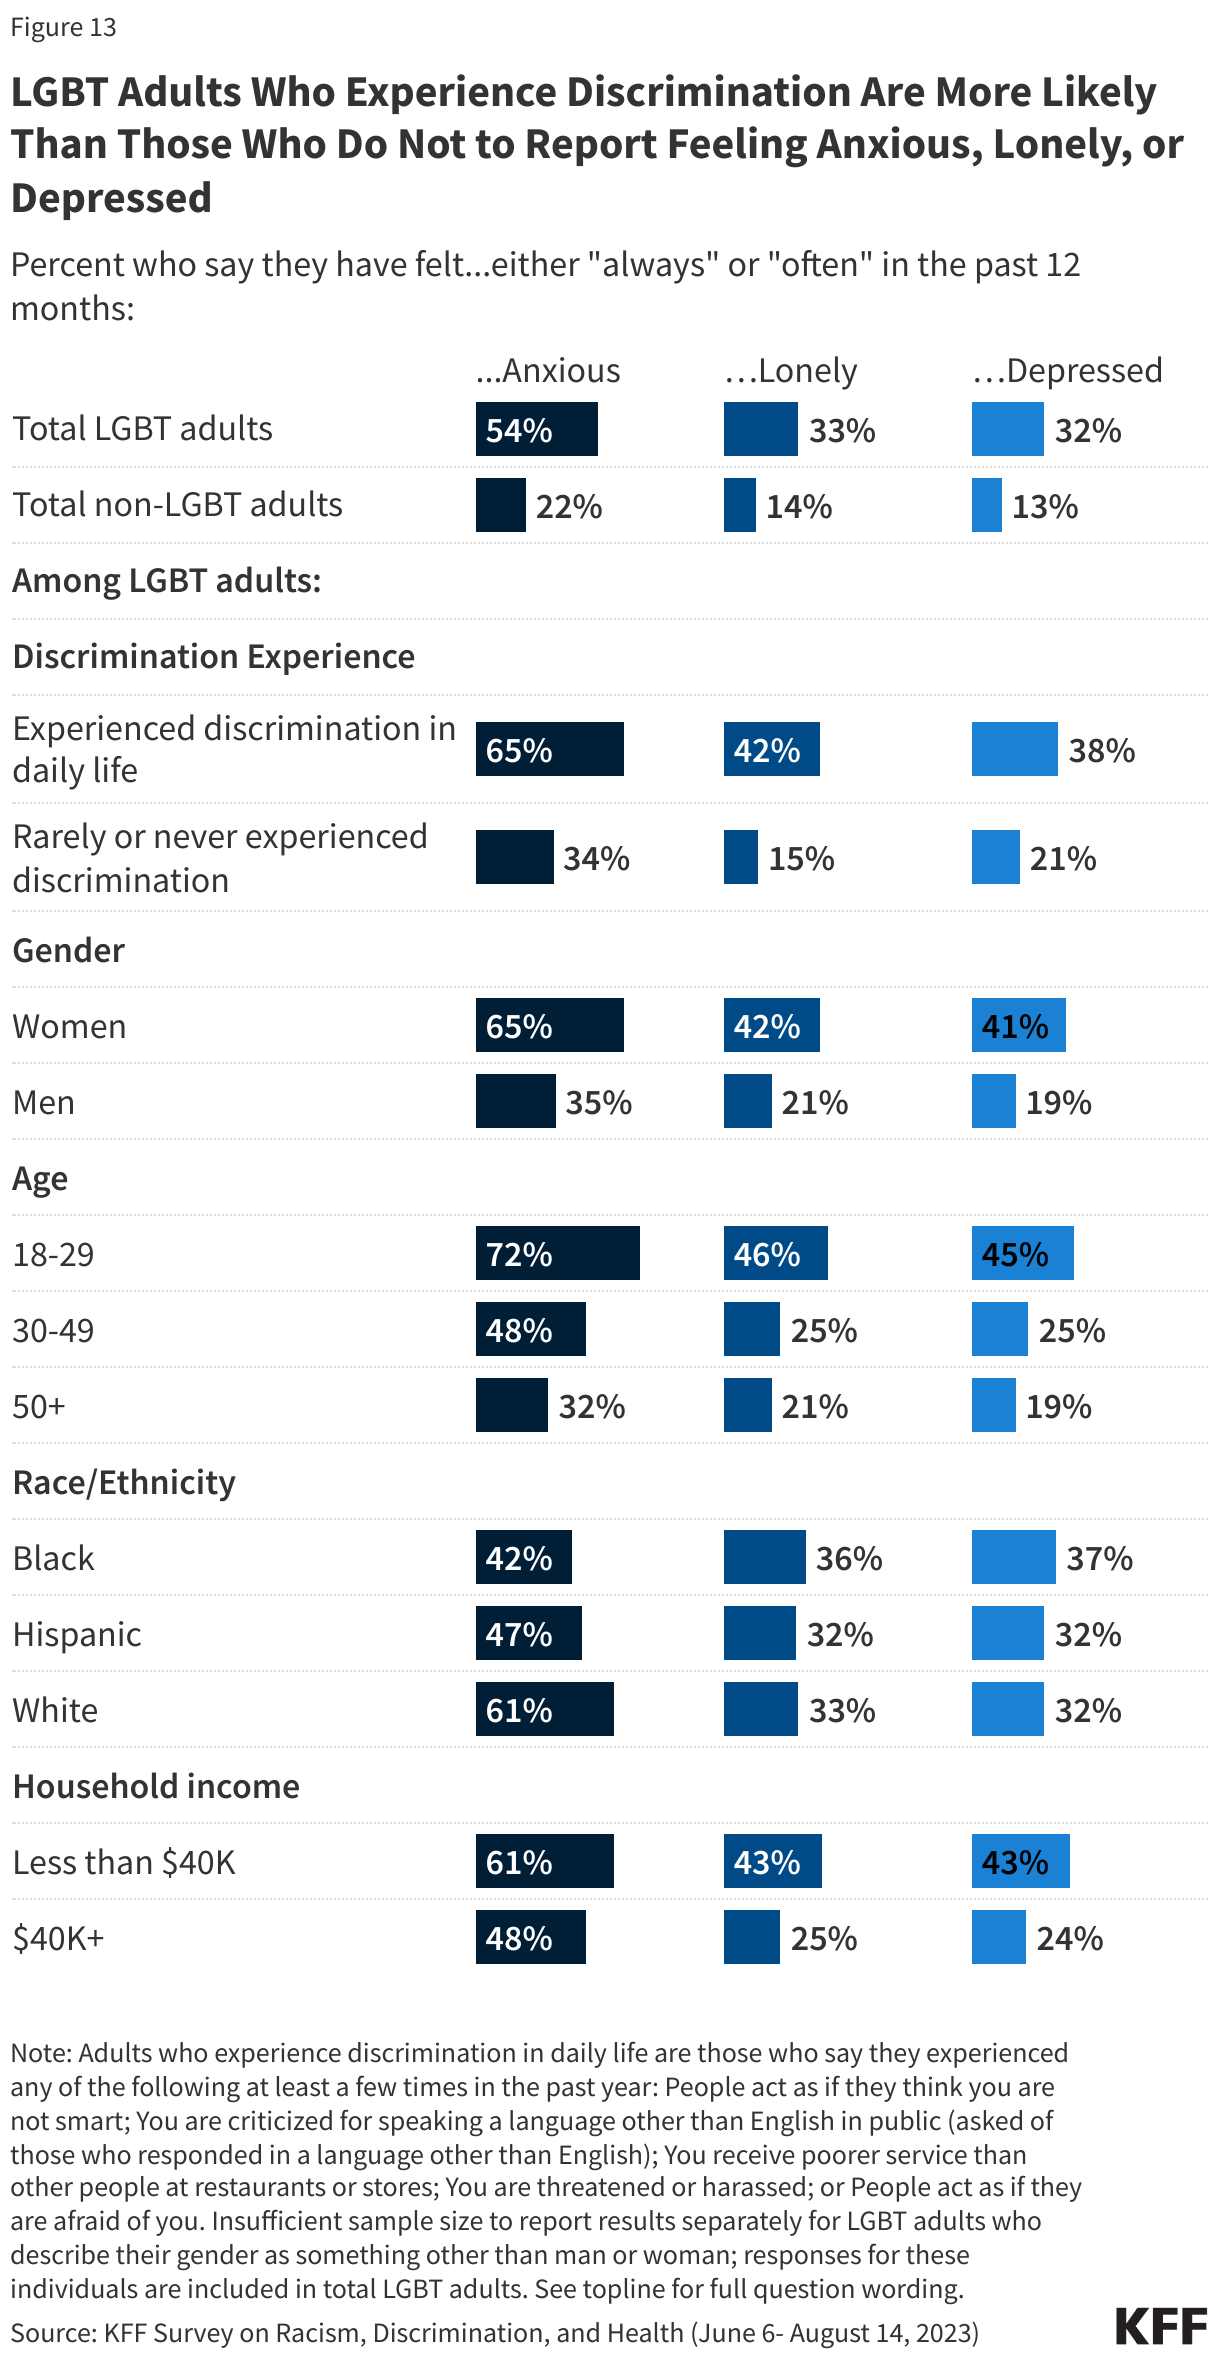
LGBT adults report more frequent feelings of loneliness, anxiety, and depression compared to non-LGBT adults, and experiences with discrimination exacerbate these challenges for LGBT adults. Overall, about half (54%) of LGBT adults report feeling anxious either “always” or “often” in the past year, while a third report feeling lonely (33%) or depressed (32%) at least often – more than twice the shares of non-LGBT adults who report the same. Other surveys have similarly found that larger shares of LGBT people report symptoms of anxiety and depression than non-LGBT adults.

Similar to differences reported among adults overall, LGBT adults who have experienced at least one form of discrimination in their daily lives in the past year are more likely to report feeling lonely, depressed or anxious in the past year than those who rarely or never experienced discrimination in daily life. Among LGBT adults with discrimination experiences in the past year, two-thirds (65%) say they “always” or “often” felt anxious in the last 12 months, compared to about half the share of LGBT adults who rarely or never experienced discrimination (34%). LGBT adults with discrimination experience are nearly three times as likely as LGBT adults who rarely or never experience discrimination to say they felt lonely “always” “often” in the past year (42% v. 15%) and are more likely to report feeling depressed at least often in the past year (38% v. 21%). While other underlying factors beyond discrimination may contribute to these differences, the relationship between feelings of loneliness, anxiety, and depression and experiences with discrimination among LGBT adults remains significant even after controlling for other demographic characteristics including race and ethnicity, education, income, gender, and age1 . LGBT women, younger adults, and lower income adults all more likely than LGBT men, older adults and higher income adults, respectively, to report these feelings at least often in the past year.

Similar shares of LGBT adults across racial and ethnic groups report feeling any of these ways in the past year, though White LGBT adults (61%) are more likely than Black (42%) LGBT adults to report feelings of anxiety. Structural inequities and a lack of culturally sensitive screening tools may contribute to underdiagnosis and underreporting of mental illness among people of color. Underreporting of mental health issues among people of color may also be explained by diagnostic disparities among children of color whose behavior is more likely to be characterized as disruptive or criminal rather than as a mental health issue. For more information, see KFF’s issue brief on mental health and substance use disorders by race and ethnicity.

LGBT Adults Who Experience Discrimination Are More Likely Than Those Who Do Not to Report Feeling Anxious, Lonely, or Depressed

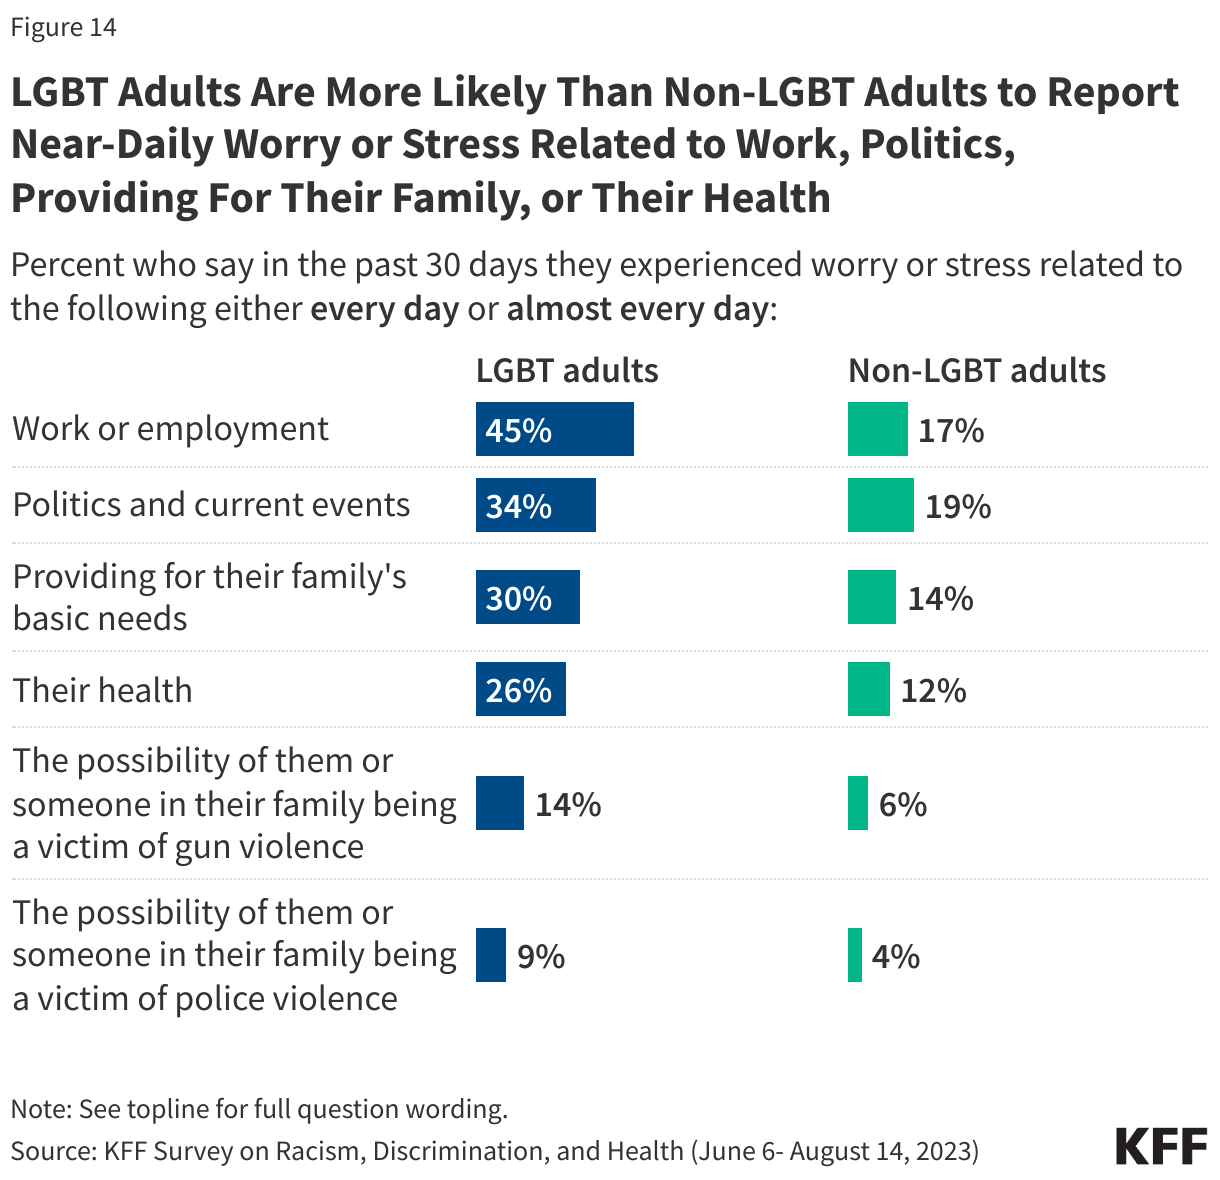
LGBT adults are more likely than non-LGBT adults to report near-daily worry and stress over several factors, such as their work, politics, their health, and the possibility of being a victim of violence. Larger shares of LGBT adults compared to non-LGBT adults say they experienced worry or stress in the past 30 days either “every day” or “almost every day” related to work or employment (45% v. 17%), politics and current events (34% v. 19%), providing for their family’s basic needs (30% v. 14%), their health (26% v. 12%), and the possibility of someone in their family being a victim of gun violence (14% v. 6%) or a victim of police violence (9% v. 4%).

LGBT Adults Are More Likely Than Non-LGBT Adults to Report Near-Daily Worry or Stress Related to Work, Politics, Providing For Their Family, or Their Health

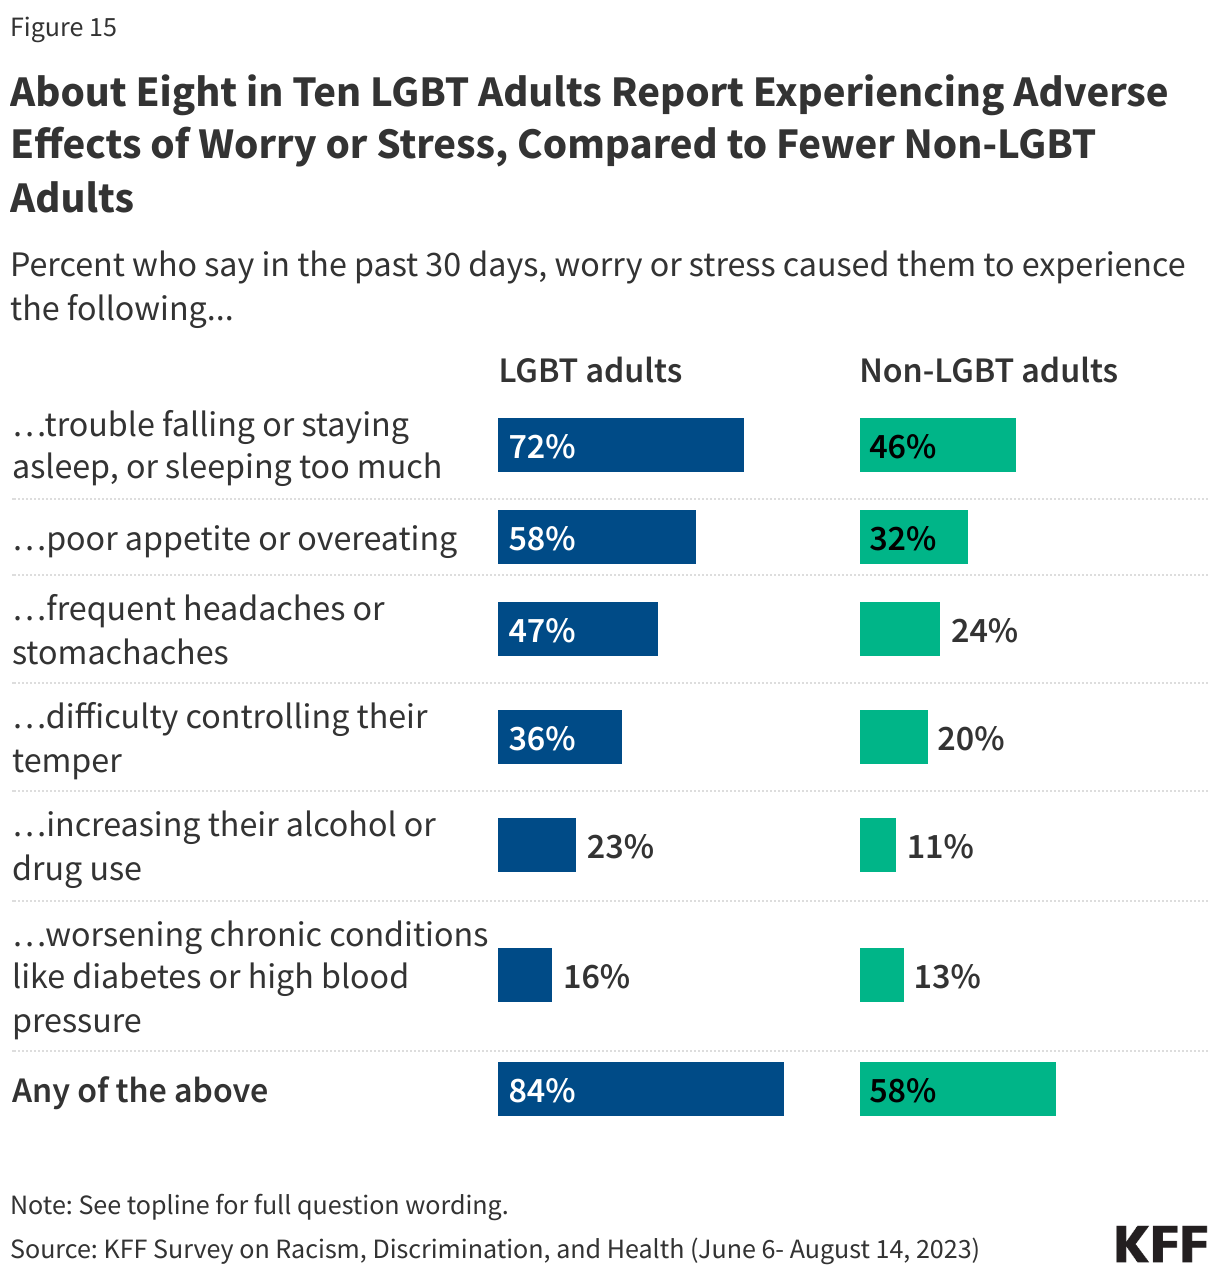
Eight in ten LGBT adults report experiencing adverse effects of worry or stress in the past 30 days, over 20 percentage points higher than the share of non-LGBT adults who report this. About eight in ten (84%) LGBT adults report experiencing at least one adverse effect of worry or stress in the past month compared to about six in ten (58%) non-LGBT adults. This includes a majority who report trouble falling asleep, staying asleep, or sleeping too much (72%) or poor appetite or overeating (58%). About half of LGBT adults say worry or stress has caused them to experience frequent headaches or stomachaches (47%). LGBT adults also report difficulty controlling their temper (36%), increasing their alcohol or drug use (23%), or worsening chronic conditions like diabetes or high blood pressure (16%).

About Eight in Ten LGBT Adults Report Experiencing Adverse Effects of Worry or Stress, Compared to Fewer Non-LGBT Adults

The Role of Support Networks

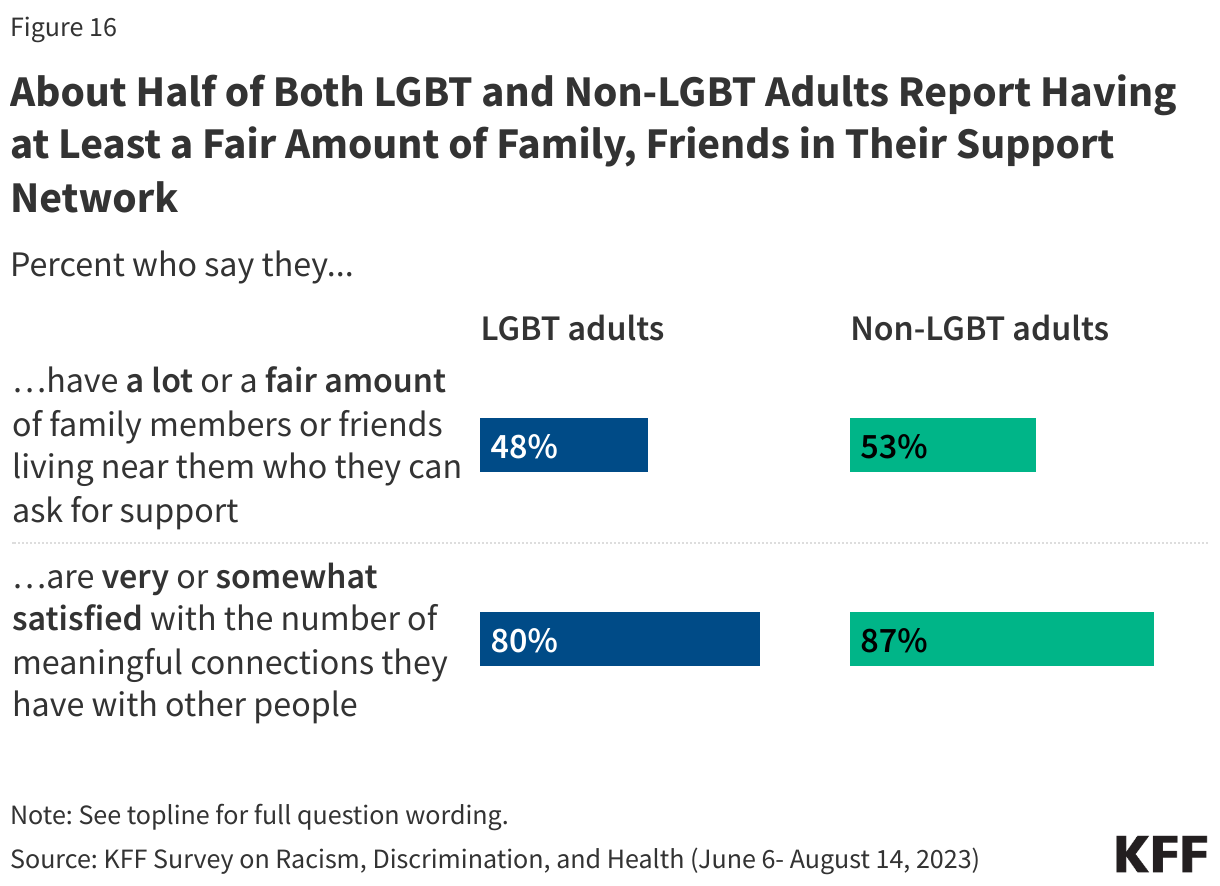
About half of LGBT adults lack a strong local support network, but most are satisfied with the number of meaningful connections they have with other people. Social support networks can be an important resource for mental health and well-being. About half (48%) of LGBT adults say they have “a lot” or “a fair amount” of family members or friends living near them who they can ask for help or support while the other half (52%) say they have “just a few” or “none.” These shares are similar among non-LGBT adults and among LGBT adults across demographics like race and ethnicity, gender, age, and income.

While about half of LGBT adults report having few family members and friends they can ask for support, eight in ten LGBT adults say they are satisfied with the number of meaningful connections they have with other people, compared to slightly larger shares of non-LGBT adults who say the same (87%). Among LGBT adults, large shares across race and ethnicity, gender, age and income report being either “very” or “somewhat satisfied” with the number of meaningful connections they have with other people.

About Half of Both LGBT and Non-LGBT Adults Report Having at Least a Fair Amount of Family, Friends in Their Support Network

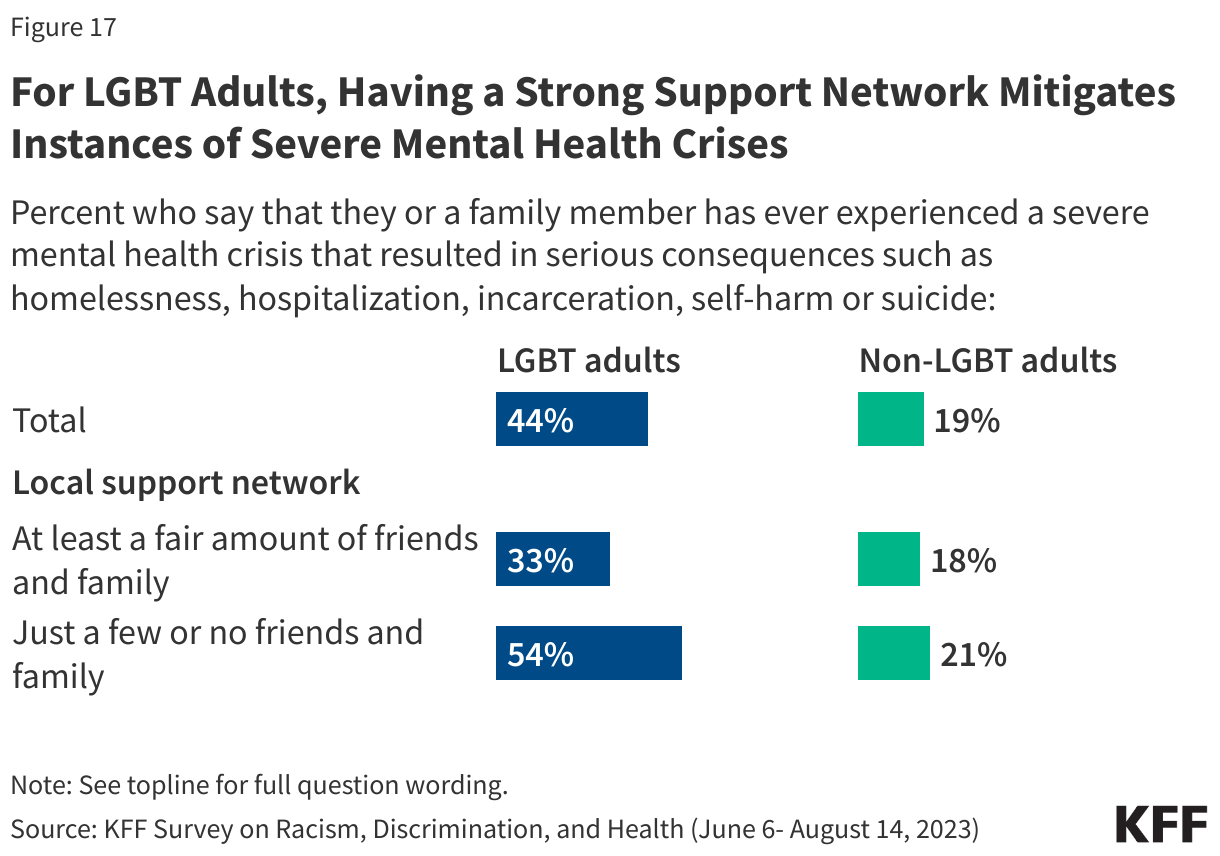
LGBT adults are twice as likely as non-LGBT adults to report experiences with a severe mental health crisis that resulted in serious consequences; however, having a robust local support network mitigates these challenges for LGBT adults. About four in ten (44%) LGBT adults say that they or a family member has ever experienced a severe mental health crisis that resulted in serious consequences such as homelessness, hospitalization, incarceration, self-harm or suicide – about twice the share of non-LGBT adults who report this (19%). Among LGBT adults, the share who report personal or familial experiences with a severe mental health crisis rises to over half for those with incomes under $40,000 (56%) and those ages 18-29 (55%).

LGBT adults with relatively more family and friends in their support network, however, are less likely to report experiences with severe mental health crises compared to those with fewer family and friends whom they can ask for support. One-third (33%) of LGBT adults who say they have “a lot” or “a fair amount” of family or friends living near them who they can ask for support say that they or a family member has experienced a severe mental health crisis resulting in serious consequences; however, this rises to roughly half (54%) among LGBT adults who say they have “just a few” or no family and friends whom they can ask for support. Similar shares of non-LGBT adults, regardless of the amount of family and friends in their support network, report experiences with a severe mental health crisis.

For LGBT Adults, Having a Strong Support Network Mitigates Instances of Severe Mental Health Crises

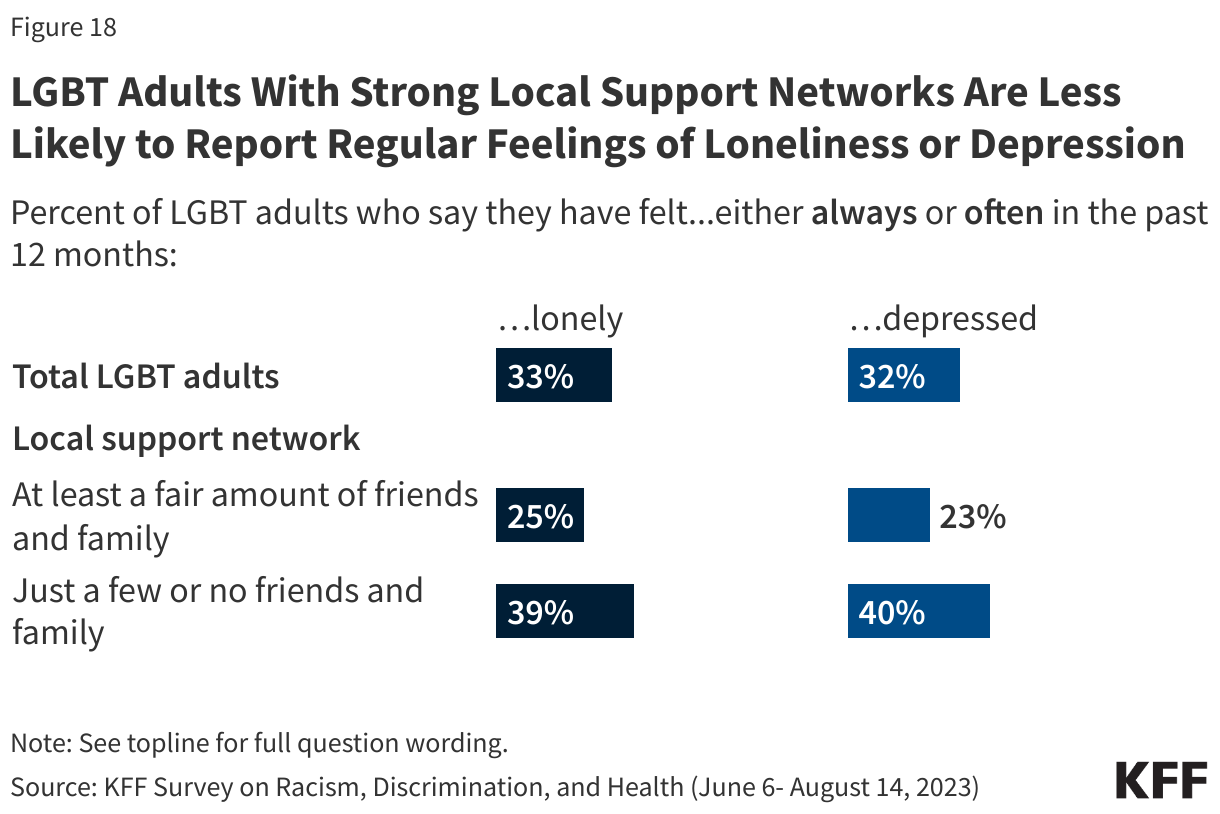
For LGBT adults, having a strong support network mitigates challenges with regular feelings of loneliness and depression. LGBT adults who say they have “a lot” or a “fair amount” of nearby family and friends they can ask for support are less likely than those with just a few or no people in their local support network to report “always” or “often” feeling lonely (25% v. 39%) or depressed (23% v. 40%) in the past year.

LGBT Adults With Strong Local Support Networks Are Less Likely to Report Regular Feelings of Loneliness or Depression

Access and Use of Mental Health Services

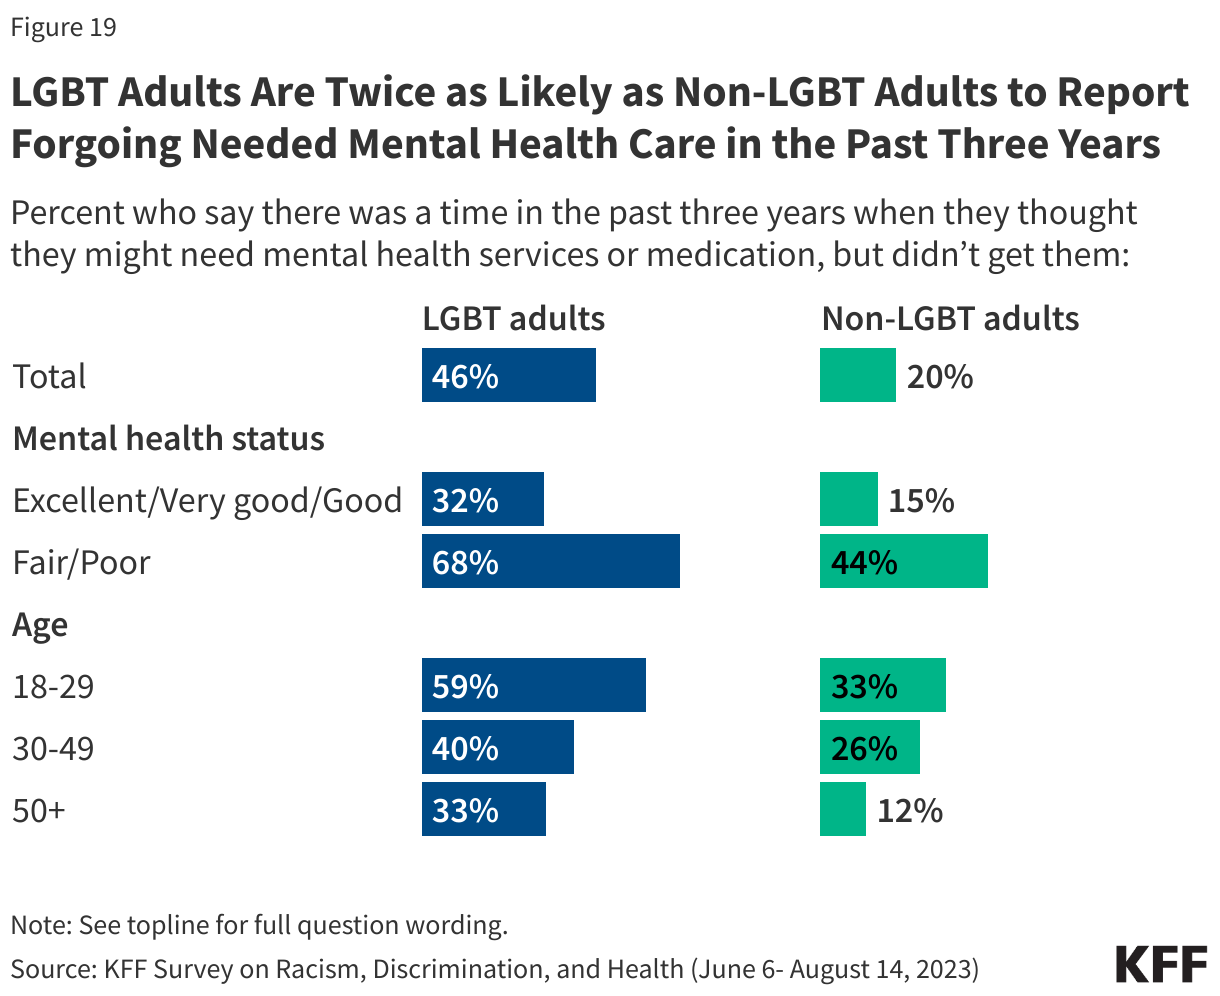
LGBT adults are more likely than non-LGBT adults to report forgoing needed mental health care, particularly among those in fair or poor mental health and younger adults. Consistent with previous surveys, about half (46%) of LGBT adults say there was a time in the past three years when they thought they might need mental health services but didn’t get them, more than twice the share of non-LGBT adults who say so (20%).

The shares who report forgoing needed mental health services rises to two-thirds (68%) among LGBT adults who describe their mental health as “fair” or “poor” and six in ten (59%) among those ages 18-29. LGBT adults with self-reported “fair” or “poor” mental health are more likely than non-LGBT adults with fair or poor mental health to report forgoing needed mental health services (68% v. 44%). Similarly, across age groups, LGBT adults are consistently more likely than their non-LGBT counterparts to say they didn’t get needed mental health care. The shares of LGBT adults who report forgoing needed mental health services in the past three years do not differ significantly across gender, income, coverage type, or race or ethnicity.

About half (46%) of LGBT adults report receiving mental health services in the past three years, about twice the share of non-LGBT adults who report receiving such services (22%). These findings are consistent with other surveys that show LGBT adults and youth are more likely than others to utilize mental health care than their peers.

LGBT Adults Are Twice as Likely as Non-LGBT Adults to Report Forgoing Needed Mental Health Care in the Past Three Years

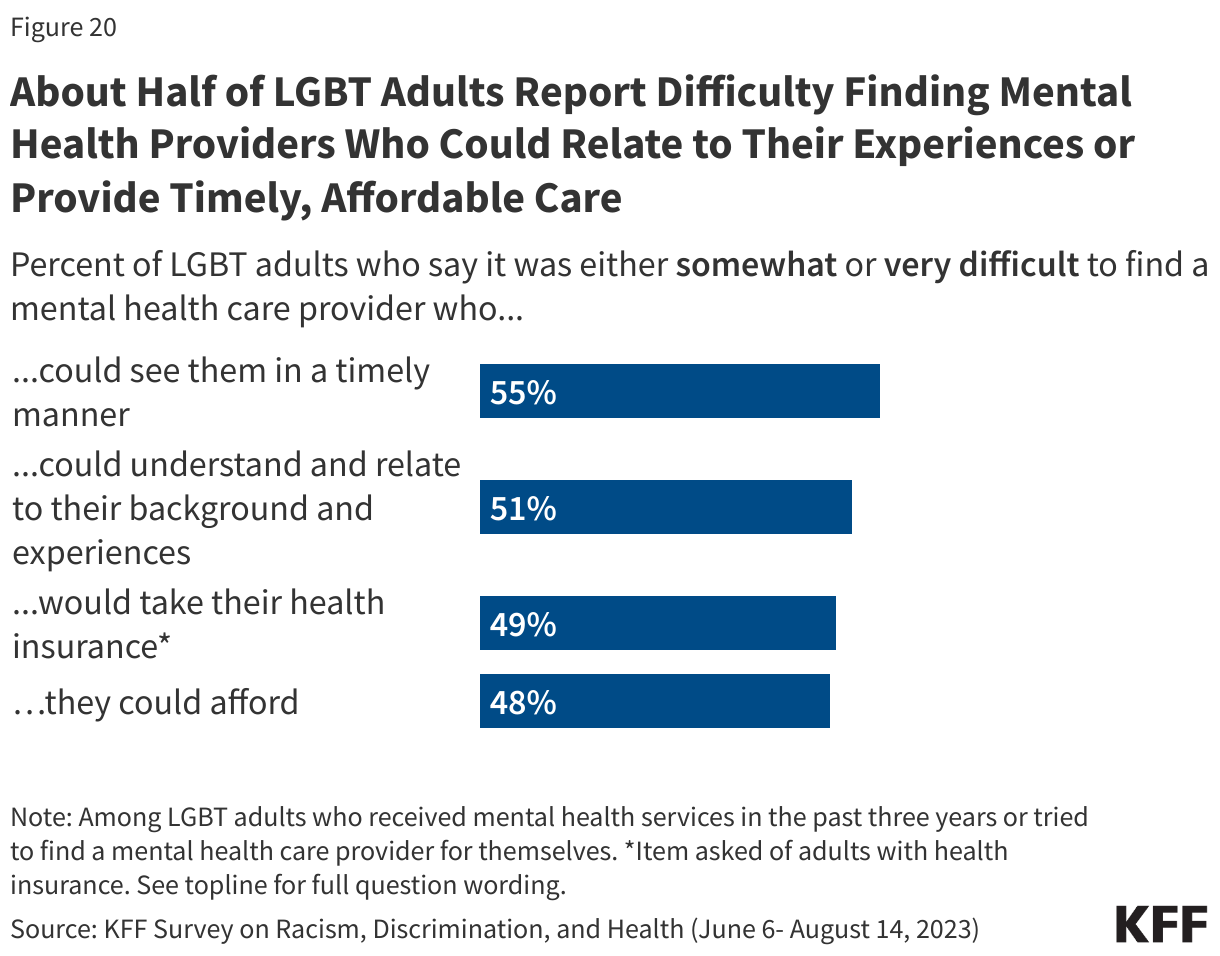
Affordability and accessibility of providers are reported barriers to receiving mental health care for many LGBT adults, as is the ability to find a provider who can relate to their background and experiences. Among LGBT adults who either received or tried to receive mental health services for themselves in the past three years (55% of LGBT adults overall), roughly half say that it was difficult to find a mental health care provider who they could see in a timely manner (55%), who could relate to their background and experiences (51%), who would take their health insurance (49% among those with health insurance), or that they could afford (48%).

Among those who received or tried to receive mental health services for themselves, LGBT adults are more likely than non-LGBT adults to report having difficulty finding a mental health care provider who could see them in a timely manner (55% v. 43%) or, among those with health insurance, that would take their insurance (49% v. 34%).

About Half of LGBT Adults Report Difficulty Finding Mental Health Providers Who Could Relate to Their Experiences or Provide Timely, Affordable Care

Experiences with Homelessness

Housing is a core social determinant of health, meaning that housing experiences, including quality and stability, have broad impacts on health, mental health, and well-being. Housing insecurity can foster or exacerbate mental health challenges and make it more challenging to meet health needs or other social obligations. Likewise severe mental health challenges can make addressing housing needs more challenging.

Notable shares of LGBT adults, including larger shares of Black and lower-income LGBT adults – report personal experiences with homelessness, and LGBT adults are more likely than non-LGBT adults to report having been homeless. One in five (22%) LGBT adults say they have ever experienced homelessness – twice the share of non-LGBT adults who report this (11%). The share of LGBT adults reporting experiences with homelessness rises to four in ten among lower income LGBT adults (39%) and one-third of Black LGBT adults (35%). Among Black adults, those who are LGBT are more likely than non-LGBT Black adults to report having been homeless (35% v. 19%), and lower income LGBT adults are more likely than non-LGBT adults in the same income group to report experiences with homelessness (39% v. 19%).

One in Five LGBT Adults Say They Have Experienced Homelessness, Including About Four in Ten Lower Income and Black LGBT Adults

Appendix: Demographics of LGBT adults

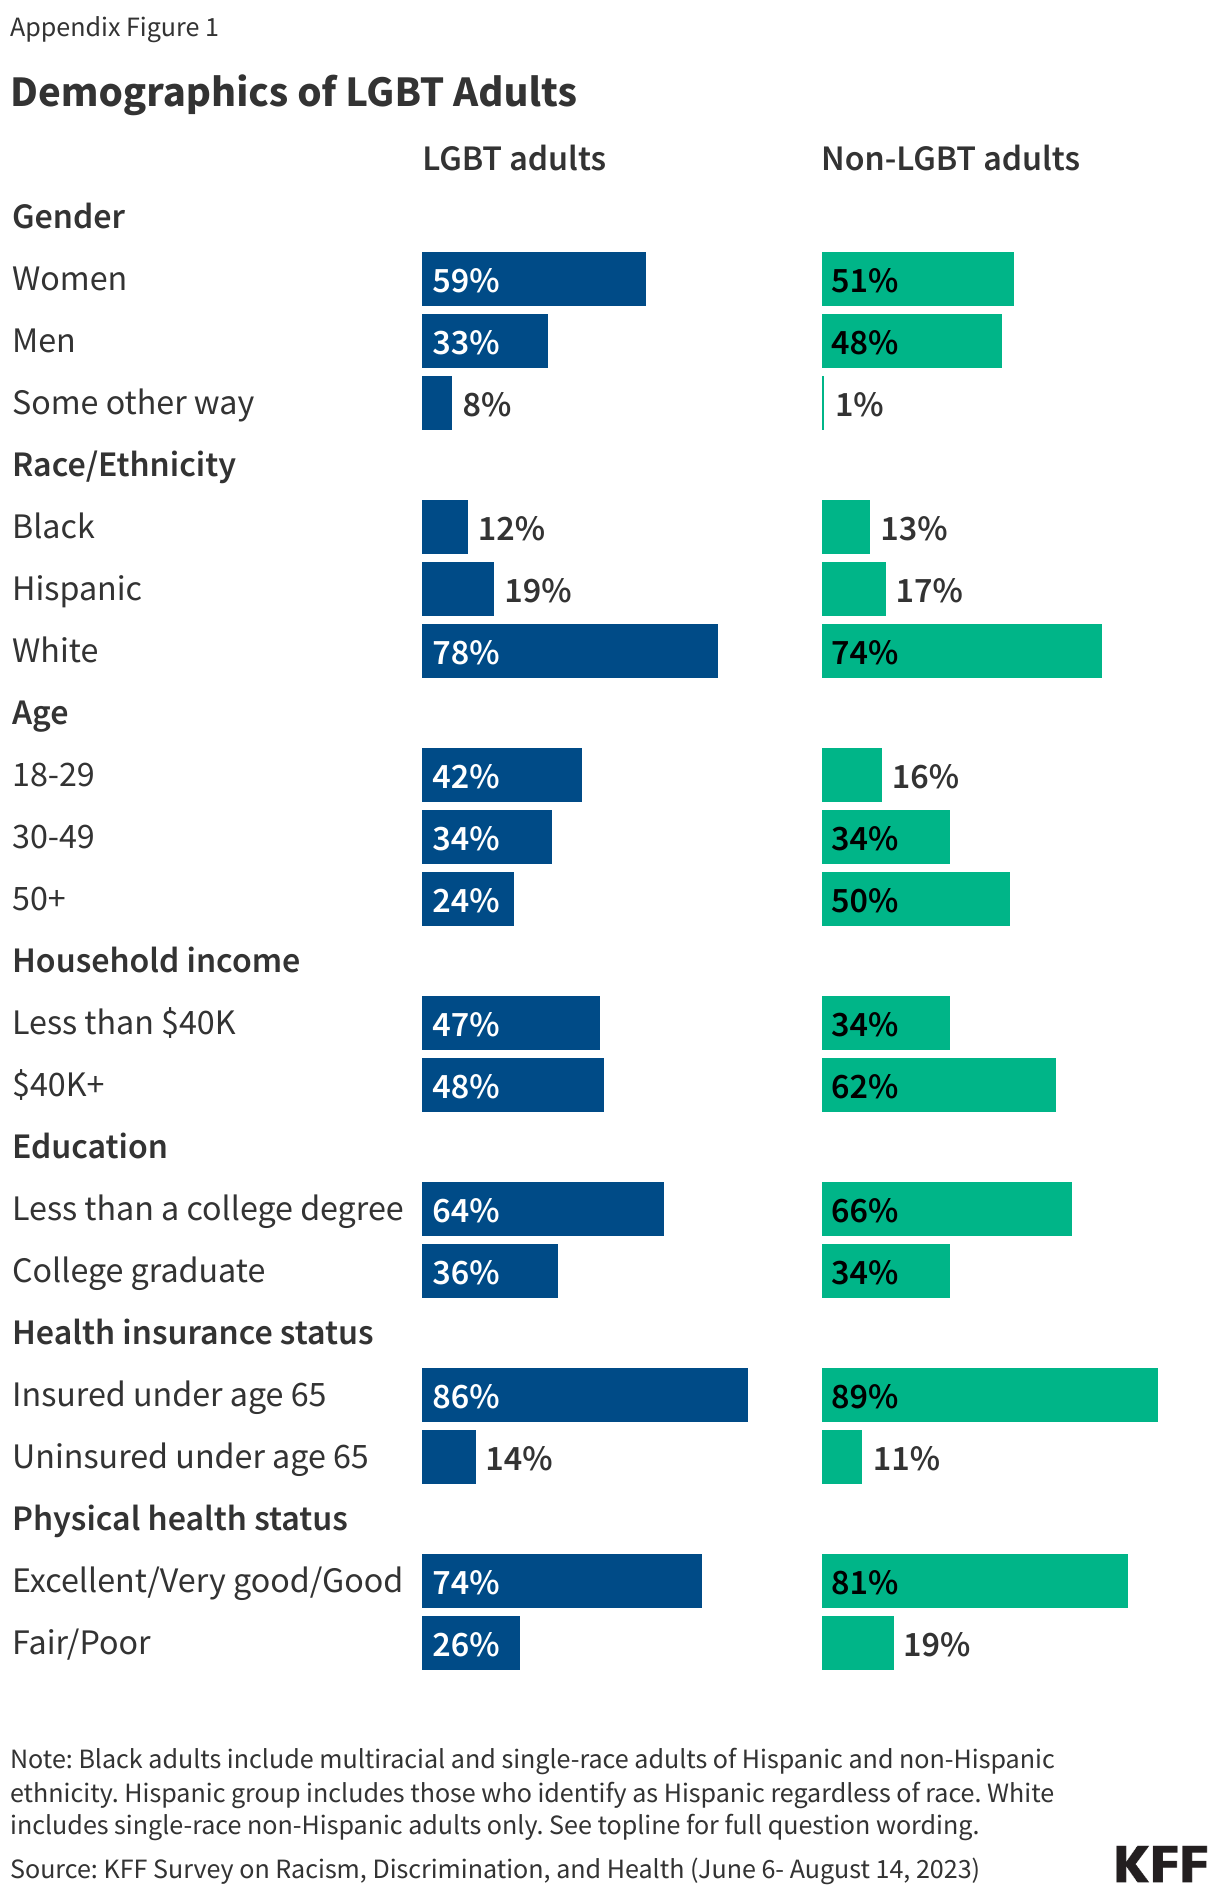
In this report, LGBT adults include those who identify as either lesbian, gay, bisexual, and/or transgender in a question that allows individuals to self-select as either one, multiple, or none of these options. Gender identity was measured separately from LGBT identity. Respondents could choose to describe their gender as a man, a woman, or in some other way. The LGBT men and women samples include individuals who selected that gender, including those who identify as transgender. While the sample size for LGBT individuals who selected “some other way” in the gender identity question is insufficient to report on separately, responses for these individuals are included in the total LGBT sample.

Overall, (and consistent with prior surveys) LGBT adults are younger than non-LGBT adults: about four in ten (42%) LGBT adults are between the ages of 18 and 29 compared to about one in six (16%) non-LGBT adults. LGBT adults are also more likely to have lower incomes, with about half (47%) reporting household incomes below $40,000 compared to one-third (34%) of non-LGBT adults. LGBT adults are more likely than non-LGBT adults to describe their physical health as “fair” or “poor” (26% v. 19%).

The demographics of LGBT and non-LGBT adults, however, are similar when it comes to race and ethnicity, education, and health insurance status among those under the age of 65.

Demographics of LGBT Adults

Methodology

The Survey on Racism, Discrimination, and Health was designed and analyzed by researchers at KFF. The survey was conducted June 6 – August 14, 2023, online and by telephone among a nationally representative sample of 6,292 U.S. adults in English (5,706), Spanish (520), Chinese (37), Korean (16), and Vietnamese (13).

The sample includes 5,073 adults who were reached through an address-based sample (ABS) and completed the survey online (4,529) or over the phone (544). An additional 1,219 adults were reached through a random digit dial telephone (RDD) sample of prepaid (pay-as-you-go) cell phone numbers. Marketing Systems Groups (MSG) provided both the ABS and RDD sample. All fieldwork was managed by SSRS of Glen Mills, PA; sampling design and weighting was done in collaboration with KFF.

Sampling strategy:The project was designed to reach a large sample of Black adults, Hispanic adults, and Asian adults. To accomplish this, the sampling strategy included increased efforts to reach geographic areas with larger shares of the population having less than a college education and larger shares of households with a Hispanic, Black, and/or Asian resident within the ABS sample, and geographic areas with larger shares of Hispanic and non-Hispanic Black adults within the RDD sample.

The ABS was divided into areas (strata) based on the share of households with a Hispanic, Black, and/or Asian resident, as well as the share of the population with a college degree within each Census block group. To increase the likelihood of reaching the populations of interest, strata with higher incidence of Hispanic, Black, and Asian households, and with lower educational attainment, were oversampled in the ABS design. The RDD sample of prepaid (pay-as-you-go) cell phone numbers was disproportionately stratified to reach Hispanic and non-Hispanic Black respondents based on incidence of these populations at the county level.

Incentives:Respondents received a $10 incentive for their participation, with interviews completed by phone receiving a mailed check and web respondents receiving a $10 electronic gift card incentive to their choice of six companies, a Visa gift card, or a CharityChoice donation.

Community and expert input:Input from organizations and individuals that directly serve or have expertise in issues facing historically underserved or marginalized populations helped shape the questionnaire and reporting. These community representatives were offered a modest honorarium for their time and effort to provide input, attend meetings, and offer their expertise on dissemination of findings.

Translation:After the content of the questionnaire was largely finalized, SSRS conducted a telephone pretest in English and adjustments were made to the questionnaire. Following the English pretest, Cetra Language Solutions translated the survey instrument from English into the four languages outlined above and checked the CATI and web programming to ensure translations were properly overlayed. Additionally, phone interviewing supervisors fluent in each language reviewed the final programmed survey to ensure all translations were accurate and reflected the same meaning as the English version of the survey.

Data quality check:A series of data quality checks were run on the final data. The online questionnaire included two questions designed to establish that respondents were paying attention and cases were monitored for data quality including item non-response, mean length, and straight lining. Cases were removed from the data if they failed two or more of these quality checks. Based on this criterion, 4 cases were removed.

Weighting:The combined cell phone and ABS samples were weighted to match the sample’s demographics to the national U.S. adult population using data from the Census Bureau’s 2021 Current Population Survey (CPS). The combined sample was divided into five groups based on race or ethnicity (White alone, non-Hispanic; Hispanic; Black alone, non-Hispanic; Asian alone, non-Hispanic; and other race or multi-racial, non-Hispanic) and each group was weighted separately. Within each group, the weighting parameters included sex, age, education, nativity, citizenship, census region, urbanicity, and household tenure. For the Hispanic and Asian groups, English language proficiency and country of origin were also included in the weighting adjustment. The general population weight combines the five groups and weights them proportionally to their population size.

A separate weight was created for the American Indian and Alaska Native (AIAN) sample using data from the Census Bureau’s 2022 American Community Survey (ACS). The weighting parameters for this group included sex, education, race and ethnicity, region, nativity, and citizenship. For more information on the AIAN sample including some limitations, adjustments made to make the sample more representative, and considerations for data interpretation, see Appendix 2.

All weights also take into account differences in the probability of selection for each sample type (ABS and prepaid cell phone). This includes adjustment for the sample design and geographic stratification of the samples, and within household probability of selection.

The margin of sampling error including the design effect for the full sample is plus or minus 2 percentage points. Numbers of respondents and margins of sampling error for key subgroups are shown in the table below. Appendix 1 provides more detail on how race and ethnicity was measured in this survey and the coding of the analysis groups. For results based on other subgroups, the margin of sampling error may be higher. All tests of statistical significance account for the design effect due to weighting. Dependent t-tests were used to test for statistical significance across the overlapping groups.

Sample sizes and margins of sampling error for other subgroups are available by request. Sampling error is only one of many potential sources of error and there may be other unmeasured error in this or any other public opinion poll. KFF public opinion and survey research is a charter member of the Transparency Initiative of the American Association for Public Opinion Research.

GroupN (unweighted)M.O.S.E.
Total LGBT adults521± 7 percentage points
Total non-LGBT adults5,771± 2 percentage points

Endnotes

  1. A logistic regression model was conducted to test whether the relationship between discrimination experience and feelings of anxiety, loneliness, and depression among LGBT adults held after controlling for demographics including income, education, age, gender, and race and ethnicity. ↩︎

The ‘Pandemic Agreement’: What it is, What it isn’t, and What it Could Mean for the U.S.

Published: Apr 1, 2024

This brief was updated on June 18 to reflect developments at the 2024 World Health Assembly.

Member states of the World Health Organization (WHO) are in the process of negotiating a new international ‘pandemic agreement’ (also referred to as a ‘pandemic accord’ or ‘pandemic treaty’). Since 2021, member states have held a series of meetings to draft this new agreement. Earlier this year it was expected the process would culminate with a vote on a final text at this year’s World Health Assembly (WHA) in May 2024 but due to a lack of consensus on a number of articles, member states chose to extend the timeline for negotiations until next year, with an expectation that a final vote on any agreement would take place at the May 2025 WHA (potentially earlier if agreement is reached before then).

The Biden administration has supported the concept of an agreement, and has been engaged in negotiations since the process launched. At the same time, several issues have been raised by U.S. policymakers and others, including whether and how the U.S. should ultimately choose to become a party to the agreement. . Given that the negotiating timeline has been extended into next year, the outcome of the U.S. Presidential election this fall is likely to have significant implications for U.S. positions on the agreement and its participation in negotiations in 2025.  If President Trump were to be elected, for example, it is unclear if he would support an agreement, given his criticism of WHO and his move to withdraw from the organization when he was President, as well as his overall “America First” approach to international engagement.

What is the Pandemic Agreement?

The pandemic agreement is a potential international agreement currently being negotiated by the 194 member states of the WHO, including the U.S. Many governments and WHO leadership felt it was necessary to develop a new agreement to address some of the weaknesses in capacities and lack of international cooperation that occurred during the global response to COVID-19. The formal negotiation process (known as the International Negotiating Body, or INB) was launched in 2021. In the view of the WHO Director-General, there would be three key benefits to a new agreement: driving a more equitable global response, helping safeguard national health systems, and enhancing cooperation among member states during pandemics.

According to the latest publicly available draft text (dated 13 March), the overall objective of this new pandemic agreement is to help the world “prevent, prepare for and respond to pandemics.” Among the provisions included (all of which are still being negotiated) are definitions and principles, aspirational goals for improving pandemic preparedness and response capacities, supply chain and logistics, communication, and oversight and implementation for the agreement, with some of the more contested and debated provisions being financing for pandemic preparedness and response, pathogen access and benefit sharing (PABS), intellectual property rights, technology transfer and research and development for pandemic-related products. Also a topic for debate has been the inclusion of the concept of common but differentiated responsibilities (CBDR), meant to address equity concerns by asking richer countries to take on greater obligations to address common goals in pandemic preparedness and response than poorer countries.

What are possible outcomes of the agreement negotiations?

Earlier this year, it was expected there would be a vote on an agreement the 2024 WHA meeting, which occurred in May. However, given the lack of consensus on a number of issues in the agreement, member states decided they needed more time for negotiations and extended the INB’s mandate through May 2025. The next formal INB meeting is scheduled for July 2024, with additional negotiating meetings expected beyond that and into next year. There is an expectation that member states will vote on a final text of any agreement at the WHA in May 2025.

If member states vote in favor, the agreement would be adopted as one of several different types of international legal agreements allowed under the WHO Constitution. Which form it takes is the subject of ongoing negotiation at the INB, but possibilities include a “treaty”, a “regulation” or a “resolution”/”decision,” each of which has specific characteristics and implications (see Table 1).

  • Treaty: Proponents of the agreement, and most member states, have supported a “treaty” as the preferred outcome as it is expected to have the greatest influence and broadest potential scope. Indeed, the latest draft of the agreement includes text that indicates adoption and ratification as a treaty (Article 34), but this could change. However, a treaty would have the highest bar to clear in terms of votes needed for approval, subsequent ratification by a minimum number of member states to enter into force, and only would apply to member states that do ratify the treaty.
  • Regulation: If the agreement is approved as a “regulation,” in contrast, it would enter into force immediately for all member states (unless they opt-out), but this form could be seen as less influential compared to a treaty and could have some limitations on the issues it can directly address.
  • Resolution or Decision: Finally, WHO member states could choose to approve an agreement as a “resolution” or “decision”, which would essentially be a statement of support for certain principles without specific legal or other obligations for member states and would therefore be seen as the weakest and least ambitious form of agreement.
Potential Legal Forms for a WHO-Based Pandemic Agreement

What has been the U.S. engagement with and positions on the agreement so far?

The Biden Administration has been actively participating in the negotiations since the INB was formed in 2021. Co-led by the State Department and the Department of Health and Human Services, the U.S. representatives’ stated goals are to “ensure any agreement will leave all countries better prepared for pandemics, allow data and laboratory samples to be shared more quickly and transparently, and support more equitable global access to drugs, vaccines, and tests during health emergencies.” Earlier this year the U.S. supported completing negotiations and holding a vote on the agreement at this year’s WHA meeting but joined other member states in voting to extend the negotiations until next year given the lack of consensus on several issues in the text. However, Biden Administration officials have stated they are optimistic about reaching consensus eventually, and that the “contours of the agreement are in place”.

With closed-door negotiations still ongoing, information about U.S. positions on different components of the agreement is limited and may be subject to change. Statements from officials indicate U.S. support for the overall principles in the draft agreement, such as the aspirational goals for building pandemic preparedness capacities and calls for international cooperation. U.S. officials also have come out in favor of a some kind of PABS system where countries would commit to share pathogen samples and information, and manufacturers of vaccines, drugs and other pandemic-related products would “set aside a dedicated percentage of production for equitable distribution during pandemics.” In contrast, U.S. representatives have made critical comments about the idea of requiring intellectual property rights on pandemic-related products to be waived on a temporary basis during a pandemic, saying “eliminating intellectual property protections will not effectively improve equitable access during pandemic emergencies, and will in fact harm the systems that have served us well in the past”. While U.S. officials have voiced support for voluntary technology transfer goals in the agreement, they have been critical of including language that requires mandatory technology transfer. At recent INB meetings, U.S. officials have voiced opposition to the common but differentiated responsibilities (CBDR) concept and argued against creating a new pooled funding mechanism for pandemic preparedness and response through the agreement.

What objections are being raised in the U.S. about the agreement, and is there evidence supporting these objections?

Some U.S. policymakers and observers have raised objections to the agreement in part or in full. Below are some of the commonly expressed objections, and available evidence regarding the objections:

  • Concerns about U.S. sovereignty and/or ceding authority to WHO. Some Republican members of Congress have expressed concerns that an agreement would threaten U.S. sovereignty and could cede power to WHO. However, regardless of which type of instrument is ultimately adopted, an agreement would not change WHO’s power or member state sovereignty. WHO itself is not to be a party to an agreement, but rather its role is to provide a forum for the negotiations held by member states themselves. The current draft (Article 24) makes this point explicitly, saying the agreement “should not be interpreted” as providing WHO with any authority over domestic laws or policy. There is no mechanism included or possible for punishing member states for not meeting the goals of the agreement. Biden administration representatives involved in the negotiations have similarly stated that an agreement would not provide WHO with “…any authority to direct U.S. health policy or national health emergency response actions.” In addition, governments can choose not to be a party, opt out, or register reservations for any agreement. The U.S. government has regularly submitted reservations to other international agreements regarding federalism and its obligations, including to the WHO-based IHR revision approved in 2005.
  • Concerns about financial burden on U.S. taxpayers and/or U.S. companies. Some Republican lawmakers have expressed concerns than an agreement would require U.S. contributions, placing a financial burden on U.S. taxpayers. In addition, some lawmakers and pharmaceutical industry groups have raised concerns that an agreement would require contributions from U.S. pharmaceutical companies involved in producing pandemic-related products (such as tests, treatments, and vaccines), placing an undue financial burden on those companies. At this time, there is no language in the draft agreement text requiring contributions from member states such as the U.S. However, the text does propose (Article 20) a “Coordinating Financial Mechanism” to support global pandemic preparedness efforts, which would include a “pooled fund” drawing from several sources including voluntary contributions from governments. It also includes language (Article 12) creating a system for pathogen access and benefit sharing (PABS), for which manufacturers of pandemic-related products such as pharmaceutical companies may be expected to pay annual contributions (amounts not specified) to support the PABS system and would be expected to provide WHO (or another mechanism for global sharing) a 10% share of their production of relevant diagnostics, therapeutics, or vaccines at no cost plus an additional share (10%) at reduced prices during pandemics. Current draft language (Article 12) also proposes that manufacturers can make further voluntary, non-monetary contributions “such as capacity-building activities, scientific and research collaborations, non-exclusive licensing agreements, arrangements for transfer of technology and know-how.”
  • Concerns about intellectual property rights, and implications for U.S. pharmaceutical company innovation and development of pandemic-related products. S. lawmakers from both parties, along with pharmaceutical industry groups, have raised concerns that an agreement could “undermine” intellectual property (IP) rights and pharmaceutical innovation by requiring companies to “give away” IP protections on pandemic-related products they develop, thereby reducing incentives to invest in research and development of such products. At this time, the revised draft text of the agreement does not require companies to give up IP protections. One section (Article 11) recommends countries and companies consider supporting “time-bound waivers of intellectual property rights” in order to speed or scale up manufacturing of pandemic related products but the preamble of the current draft recognizes “protection of intellectual property rights is important for the development of new medical products,” while also recognizing concerns about IP on prices of those products.
  • Concerns about transparency of U.S. positions on the agreement provisions and its adoption. Civil society groups and others have raised questions about the transparency of U.S. engagement with the agreement negotiations, and the lack of access to draft negotiating texts. While throughout the process an official draft negotiating text has been released on only a few occasions, this is in large part due to the multiple parallel closed-door negotiations that took place earlier focusing on different sections of the agreement, resulting in a lack of an “interpretable” text given the amount of edits being suggested by member states. In addition, policymakers and others have criticized the U.S. negotiators for not being transparent about whether they will seek ratification of the agreement through the U.S. Senate, allowing a role for Congress in its consideration, or seek to approve an agreement solely through Executive Agreement. While Senate ratification followed by Presidential signature is the formal process by which treaties are ratified under the U.S. Constitution, the U.S. President has the option of acceding to a treaty/agreement through executive action alone, without the advice and consent of the Senate.1  In fact, the great majority (estimated at over 90%) of all U.S. international legal agreements are approved via executive action rather than formal Senate approval.

A few other concerns have been raised about the agreement, for which there is little evidence. For example, some Republican members of Congress have raised a concern that the agreement would direct U.S. tax dollars to be used to fund abortion overseas. However, there is no evidence – in statements from participating governments, the WHO, or in the text of the draft itself – indicating funds associated with agreement are meant to or could be used in support of abortion, which in any case is not an activity linked to the pandemic preparedness capacity-building that is the subject of the agreement. Further, U.S. law and current policies have long prohibited U.S. foreign assistance from supporting abortion overseas. Another concern raised by some Republicans and other stakeholders is that China has undue influence at WHO and therefore the validity of any agreement negotiated under WHO is compromised. The origin of the agreement can be traced back as an initiative of primarily European member states rather than China, and China’s role has been that of one of many member states rather than a controlling force shaping negotiations.

Looking Ahead

While agreement has been reached on some articles of a draft pandemic agreement, there is also much that remains to be determined in terms of the specific wording and content and indeed whether an agreement will be reached at all. Member states remain engaged in rounds of negotiations and much could change between now and a final version of the agreement. The expectation is that the negotiations will conclude in 2025, and given that U.S. elections will be held in November 2024 there remains some uncertainty about the future of U.S. engagement. This is especially true if President Trump were to be elected, given his prior administration’s history of speaking out against WHO and moving to withdraw the U.S. from WHO membership, as well as his more general “America First” approach to international engagement. With Republican lawmakers and associated groups echoing those calls to withdraw U.S. support for WHO, U.S. engagement with and approval of any future agreement could be very different depending on the 2024 electoral results.

  1. For further information on the process and implications of U.S. international treaty adoption, see reports from KFF and Congressional Research Service. ↩︎

Variability in Payment Rates for Abortion Services Under Medicaid

Published: Mar 28, 2024

Issue Brief

Figure 2 was updated on June 3, 2024 to add reimbursement amounts for mifepristone and misoprostol in Washington.

Key Takeaways

  • There is tremendous variability in how much states reimburse for abortion services in states that use state funds to pay for abortions for their Medicaid enrollees (global rates for medication abortion: $162 (RI) to $665 (NM), D&C procedures: $146 (WA) to $1,000 (NY), D&E procedures: $248 (WA) to $1,300 (NY)). IL reimburses $1,920 for a D&E procedure, which is a global payment that includes all other services provided with the procedure.
  • Although clinical care is more complicated after the first trimester, reimbursement rates do not increase significantly to reflect the increased complexity and higher costs associated with abortion care later in pregnancy (median reimbursements: $334 for D&C vs. $570 for D&E).
  • In recent years, some states, such as Illinois, New York, New Mexico, and Maryland have significantly boosted their Medicaid reimbursement rates to support abortion access in their states in the face of abortion bans and restrictions in states across the nation. For example, six states have more than doubled their reimbursement rates for D&C procedures and five states for D&E procedures since 2017.

Medicaid is a joint federal and state program and Medicaid payment rates, which are set by the states, have been the focus of policy attention since its early days. Generally speaking, Medicaid reimbursement rates have historically been lower than those paid by Medicare and are even lower relative to private insurance rates. These lower rates have been cited as a disincentive to Medicaid provider participation, which limits the pool of providers willing to serve Medicaid enrollees and constrains their access to care.

Under Medicaid, payment for abortion services has been further complicated by the federal Hyde Amendment, which has banned the use of any federal funds for abortion since 1977, only allowing exceptions for pregnancies that endanger the life of the pregnant person, or that result from rape or incest. In 19 states and the District of Columbia where abortion is not banned, Medicaid programs do not pay for any abortions beyond the Hyde exceptions, meaning that low-income pregnant enrollees seeking abortions have to pay for the services out-of-pocket or rely on donations from abortion funds to help cover the costs. Since the Dobbs decision overturning Roe v Wade, 14 states have banned abortion with only very limited exceptions and nearly all the abortion providers in those states have either closed their services or moved to other states.

Currently, 17 states use their own state funds to pay for abortions for women with Medicaid in circumstances beyond the federal limitations set in the Hyde Amendment and abortion remains legal in these states (Figure 1). Unlike other services used by Medicaid enrollees in which the costs of care are divided between the federal and state government, the states bear the full cost of abortion care.

Women Covered by Medicaid in 19 States & DC Where Abortion Is Not Banned Have Extremely Limited Abortion Coverage Due to Hyde Amendment

Currently, 44% of reproductive age women with Medicaid coverage live in states that use their own funds to pay for abortion services for Medicaid enrollees in circumstances beyond the federal Hyde limitations. A fifth (21%) of women with Medicaid coverage live in a state where abortion is banned, and a third (35%) live in a state where there is no ban, but abortion coverage is currently restricted by the Hyde Amendment.

In research conducted before the Dobbs decision, even when Medicaid does reimburse for abortion services, providers have reported lower reimbursement rates from Medicaid compared to self-pay. For example, a 2020 study reviewed 2017 Medicaid and Medicare physician fees schedules for dilation and curettage (D&C) and dilation and evacuation (D&E) procedures for 45 states and D.C. They found median Medicaid reimbursement rates for a first- and second-trimester abortion would cover 37% and 41% of what a self-pay patient would be charged for the procedure, respectively. The study did not address the fees for abortions after the second trimester.

To understand the state of Medicaid payment for abortion services post-Dobbs, KFF researchers reviewed Medicaid physician fee schedules for medication and procedural abortions in states that do not ban abortion, including both states that use state funds to pay for abortions for Medicaid enrollees and states that only pay for abortions in the cases of pregnancies resulting from rape, incest, or life endangerment. The reimbursement rates presented are for fee-for-service (FFS) claims, as managed care rates are not typically publicly available. While many pregnant people covered by Medicaid are enrolled in managed care organizations (MCOs), FFS rates are an important window for understanding reimbursement levels, and in many states, the FFS rates are the minimum payment level for MCO plans. The reimbursement rates presented in this brief are for non-facility (e.g., outpatient clinics or physician’s offices) provider-only rates (e.g., excluding any facility rates) since most abortions are performed outside of a hospital setting. Some states, such as Massachusetts and Connecticut, have different reimbursement rates for freestanding clinics providing family planning and abortion services, which are often higher than provider fee schedule rates, and those rates were used when available. Some states use supplemental payments and additional facility fee payments when they reimburse providers (e.g., California and Oregon), but these are not always posted and are not reflected in this analysis.

Some states use a bundled reimbursement for abortion services where services provided with the abortion are included in the bundled payment rate, while other states use unbundled billing and providers can bill for all additional services provided with the abortion. Other services often billed for on the day of the abortion in states that use unbundled codes may include an ultrasound, medication administration, a nerve block, and Rh testing, which are outlined in coding guides developed by the Reproductive Health Access Project for manual vacuum aspiration abortion and medication abortion. Median reimbursement amounts for each of these services from state Medicaid physician fee schedules are reported below.

Medication Abortion

In 2023, medication abortion accounted for 63% of all abortions. The two-drug regimen is FDA approved to terminate pregnancies up to 10 weeks in the U.S. Despite the wide use of medication abortion, fewer states publicly report reimbursement rates for medication abortion than for procedures. Medication abortion can be billed using three separate procedure codes and often all three codes are billed at the same time. There are codes for mifepristone/Mifeprex (S0190), misoprostol (S0191), as well as a global medication abortion code (S0199) that includes all associated services and supplies (e.g., patient counseling, office visits, confirmation of pregnancy by HCG, ultrasound to confirm duration of pregnancy, ultrasound to confirm completion of abortion). However, not all states reimburse for all three of the codes for medication abortion. States typically take two different approaches to reimburse for services provided to patients that receive medication abortion: (1) a bundled global payment using the global medication abortion code (S0199) in addition to the medications; or (2) payment for separate services, like ultrasounds and Rh testing, in addition to the medications. Sixteen states that use state funds to pay for abortion services for Medicaid enrollees list reimbursement for at least one of the three medication abortion codes, with 12 reimbursing for the global medication abortion code, 14 reimbursing for mifepristone, and 14 listing reimbursement for misoprostol. The median Medicaid reimbursement for the global medication abortion code (S0199) is $448, ranging from a low of $81 in Rhode Island to a high of $570 in New Mexico (Figure 2). The median reimbursement for mifepristone is $78, ranging from a low of $43 in Washington to a high of $99 in Maine. The median reimbursement for misoprostol, a drug that is used in other obstetric procedures, is $1 and ranges from $1 to $5. If the median amounts for all three medication abortion codes are summed, the median reimbursement for medication abortion is $527. However, the range across states is quite large, from $162 in Rhode Island to $665 in New Mexico.

While most states that use their own funds to pay for abortion services for Medicaid enrollees list reimbursement rates for medication abortion, only half of states that follow Hyde restrictions list reimbursement rates for medication abortion and median reimbursement in these states is substantially lower (see Appendix Figure 2).

Fee-For-Service Reimbursement for Medication Abortion in States That Cover Abortion Services for Medicaid Enrollees

For the states that do not used the bundled code for medication abortion, the rates for the two drugs range from $68 in Alaska to $91 in New Jersey. In these states, providers may bill for other services — such as an office visit, an ultrasound, or Rh testing – which could potentially add hundreds of dollars to the amount reimbursed, as shown in Table 1.

Median Fee-For-Service Reimbursement Amounts for Services Typically Billed with Unbundled Medication Abortion in States That Cover Abortion Services for Medicaid Enrollees

Of note, these rates are for medication abortion provision in outpatient clinics or physician’s office. Currently, approximately 16% of all abortions are medication abortions provided through telehealth. This report does not specifically address the reimbursement rates for these services which are likely different since they do not include components of care such as the ultrasound.

D&C Procedures

Dilation and curettage (D&C) is a common abortion procedure that can be used up to approximately 16 weeks of gestation. Medicaid physician fee schedules for fee-for-service reimbursement rates were published online for D&C procedures in all 17 states that use state funds to reimburse for abortion services for Medicaid enrollees (Figure 3). The median reimbursement for a D&C procedure in these states was $334, ranging widely from $146 in Washington to $1,000 in New York. Some states have substantially boosted their payment rates in recent years, notably, NY, IL, CT, NM, MD and NJ have more than doubled their payment rates since 2017 (Figure 3). Nonetheless, in many states, the increases have been quite modest over the past 7 seven years. In states that only reimburse for abortions in cases of pregnancies resulting from rape, incest, and life endangerment, payment rates were considerably lower (see Appendix Figure 1).

Fee-For-Service Reimbursement for D&C Procedures in the States That Cover Abortion Services for Medicaid Enrollees

Other services may be billed and reimbursed on the day of a procedural abortion, which could include an ultrasound, medication administration like lidocaine and methergine, or a nerve block for pain, as well as Rh testing and Rh immunoglobulin administration. Not all states reimburse for all of these extra services, and not all providers may necessarily be billing for all the possible services (Table 2). Some states like Illinois and New Mexico reimburse the abortion procedure (59840 and 59841) as a bundled code and will not pay for other related services when these codes are billed. Therefore, Illinois and New Mexico were removed from the calculations in the table below detailing median amounts for other services that may be provided on the day of the abortion.

Median Fee-For-Service Reimbursement Amounts for Services Typically Billed with a D&C Procedure in States That Cover Abortion Services for Medicaid Enrollees

D&E Procedures

For a dilation and evacuation (D&E) procedure, which is often used in the second trimester, the reimbursement rates similarly varied widely by state (Figure 4). In states that fund abortion services for Medicaid enrollees the median reimbursement for a D&E procedure was $570, ranging from a low of $248 in Rhode Island and Washington to a high of $1,920 in Illinois. States that substantially increased D&C rates from 2017 to 2024 also significantly increased D&E rates, notably Illinois increased reimbursement rates for D&E by 860% and NY and NM more than doubled their rates.

Fee-For-Service Reimbursement for D&E Procedures in the 17 States That Cover Abortion Services for Medicaid Enrollees

Similar to D&C procedures, the median reimbursement for D&E procedures in states that pay for abortions for Medicaid enrollees is higher than in states that only cover abortions in cases of rape, incest, and life endangerment (see Appendix Figure 2). Given that D&E procedures are typically provided later in pregnancy, it is striking that some states are reimbursing the same amount or just slightly higher for this more complicated procedure than a D&C, which is typically done earlier in pregnancy. Additionally, it seems that some states have not raised their Medicaid abortion reimbursement levels since at least 2017 (California and Hawaii) although these states are anticipated to increase their payment rates in the near future.

Like D&C procedures, providers can often bill for other services provided with the D&E procedure, such as ultrasounds, medications, nerve blocks, and the office visit, if the code is not a bundled code (Table 3). Similar to D&C procedures, Illinois and New Mexico use bundled payments for D&E procedures that include all other services provided with the D&E procedures and, therefore, are not included in the calculations in the table below.

Median Fee-For-Service Reimbursement Amounts for Services Typically Billed With a D&E Procedure in States That Cover Abortion Services for Medicaid Enrollees

More than half of reproductive aged women with Medicaid live in states where abortion is either banned or the cases under which Medicaid will cover an abortion are extremely limited. Medicaid enrollees living in these states may have to rely on abortion funds or help from family and friends to pay for their abortion services, or they may forgo getting services altogether. In the Guttmacher Institute’s survey of abortion patients conducted between June 2021 and July 2022, they found 22% of abortion patients living in abortion restrictive states relied on financial subsidies from abortion funds or clinic discounts to pay for their abortion compared to 11% of abortion patients living in abortion-rights protective states. In the year after Dobbs, abortion funds reported a spike in requests for financial support to access abortions, but due to an increase in demand and costs and a decrease in donations, some abortion funds have had to significantly reduce support. The longer someone has to wait to receive abortion services, the more expensive the services become for those who have to pay out of pocket. Conversely, the Guttmacher Institute found that more than four in ten people obtaining abortions in protected states used Medicaid to cover the cost of their abortion, underscoring the importance of Medicaid access in states where the provision of abortion remains legal.

The costs of providing abortions has also grown in all states as the costs of medical equipment and personnel increase annually. In addition, there are specific expenses associated with providing abortion care with which other outpatient clinics do not have to contend. Abortion clinics have added security costs to keep their staff and patients safe from anti-abortion activities, such as extra security guards, cameras, staff background checks, and bulletproof windows. Increased safety concerns and costs have made it difficult to retain their workforce. All of these aspects of providing abortion care make adequate reimbursement for abortion services an even more important consideration if the abortion provider network is to be sustained in states where abortion is not banned.

On the Horizon

A few states have made efforts in recent years to bump up their reimbursement rates for abortion services, most notably New Mexico, New York, and Illinois. These higher payments could increase abortion providers’ willingness to participate in Medicaid, potentially reducing the financial barriers experienced by people with lower incomes who have to pay for their abortion out-of-pocket or rely on financial assistance from abortion funds. However, despite the increased complexity of D&E procedures, the Medicaid payments are not substantially higher than reimbursements for first trimester D&C procedures. And while reimbursement for care after the second trimester is not addressed in this report it likely represents an even more complex procedure and higher costs for providers.

California has recently proposed increasing Medi-Cal reimbursement rates for both abortion procedures and medication abortion to $1,150 regardless of method, which would be the highest reimbursement for medication abortion across all states. However, in other states, the lack of adequate Medicaid reimbursement for these services may further exacerbate reproductive access inequities for people with low incomes.

In states where abortion remains legal, there has been a sizable increase in the number of abortions. Adequate Medicaid reimbursement for both procedural and medication abortions can improve the financial stability of clinics in these states. It can also potentially increase the number of providers who can serve patients with Medicaid coverage as well as other patients seeking abortions both in-state and from states where abortion is banned or restricted.

Appendix

Fee-For-Service Reimbursement for D&C Procedures in States That Only Reimburse for Abortions in Cases of Rape, Incest, and Life Endangerment
Medicaid Reimbursement for Second Trimester Procedural Abortions (D&E) in States That Only Reimburse for Abortions in Cases of Rape, Incest, and Life Endangerment
Medicaid Fee-For-Service Physician Fee Schedule Reimbursement Amounts for Abortion Procedures, 2017 to 2024
Medicaid Fee-For-Service Physician Fee Schedule Reimbursement Amounts for Medication Abortion, 2024

SUD Treatment in Medicaid: Variation by Service Type, Demographics, States and Spending

Published: Mar 28, 2024

Substance use disorders (SUDs), including opioid and alcohol use disorders (OUDs and AUDs), are a major public health issue affecting millions of Americans. SUDs contribute to a growing number of deaths, with alcohol-induced and opioid overdose fatalities rising sharply in recent years, especially during the pandemic. Opioid overdose deaths grew by 63% during the pandemic, to 81,051 in 2022, and alcohol-induced deaths increased by 31%, to 51,244 in the same year. Despite this, SUDs often go undiagnosed, unrecorded and untreated in healthcare settings.

As a dominant payer of behavioral health services, Medicaid can be a lever to expand access to a range of behavioral health services, including treatment for SUD. This analysis examines Medicaid claims data from 2020 to understand clinically-identified rates of SUD (referred to as diagnoses throughout the brief) as well as treatment patterns across SUD services, how treatment rates vary across groups of Medicaid enrollees and states and spending among Medicaid enrollees aged 12-64 who have a diagnosed SUD. Although claims data provide the clearest picture of the use of Medicaid-covered services among enrollees, they may exclude treatment for enrollees in some circumstances, such as when services are provided by Indian Health Services, schools or as part of bundled payment rates (see Methods for more details).

Key takeaways include:

  • Claims data show that 7.2% of Medicaid enrollees aged 12-64 have a diagnosed SUD. This may underestimate prevalence of SUDs because screening/referral practices vary and SUD diagnoses often go unrecorded without treatment. For example, data from the 2020 National Survey on Drug Use and Health, shows that 18% of Medicaid enrollees 12-64 have a SUD as NSDUH may capture undiagnosed SUDs. As a result of lower diagnosis rates in claims data, estimates of treatment rates using claims data might appear higher than they really are since they do not account for the total number of enrollees with SUD.
  • Nearly three-quarters of those with a diagnosed SUD in claims data used substance use treatment or supportive services in 2020, but there are wide variations across service type. For example, treatment rates for counseling/therapy and medication treatment were higher than other service types. Medication treatments rates are much higher for those diagnosed with OUD (63%) than those with AUD (10%), although medication treatment is recommended for both (see Box 1).
  • Enrollees who are Black, Hispanic and Asian as well as youth and young adults have lower overall SUD treatment rates than other groups. Only 4 in 10 Black enrollees with diagnosed OUDs received medication—a treatment rate substantially lower than their White counterparts (nearly 7 in 10). Youth and young adults have lower SUD treatment rates across most SUD services compared to people aged 27 to 44, particularly for medication. About 12% of youth with diagnosed OUD receive medication treatment, compared to 63% overall.
  • Substantial state-level variation exists in SUD treatment overall and by specific service. Treatment rates across states show wide variation, with up to 50 percentage point differences in treatment rates for some services.
  • Spending for enrollees with an SUD diagnosis is twice as much as those without a SUD (about $1,200 vs. $550 per month on average).

Treatment is key to addressing SUDs and reducing overdoses, deaths and other health or social complications. However, the rates at which Medicaid enrollees receive treatment can vary due to a wide range of factors including the availability and capacity of the behavioral health workforce and treatment facilities, provider participation in Medicaid and Medicaid coverage policies for SUD treatment services. In addition, treatment rates may be affected by the shortage of a diverse and culturally competent workforce as well as personal beliefs and societal stigmas. Understanding variations in treatment rates, particularly in areas or populations with lower rates, can help inform policy options to address SUD.

What are the rates and characteristics of Medicaid enrollees with a diagnosed SUD?

Overall, 7.2% of Medicaid enrollees have a diagnosed SUD in 2020 Medicaid claims data. SUDs can include alcohol or opioid use disorders, but can also include many others such as marijuana, stimulant and hallucinogen use disorders. Because OUD and AUD are the most commonly diagnosed SUDs in Medicaid claims data, and they account for over 80% of all alcohol and drug deaths, this analysis focuses on those conditions specifically as well as SUD overall (which includes all types). Medicaid claims data may underestimate the prevalence of SUDs because screening/referral practices vary and SUD diagnoses often go unrecorded without treatment. For example, data from the 2020 National Survey on Drug Use and Health shows that 18% of Medicaid enrollees 12-64 have a SUD as NSDUH may capture undiagnosed SUDs.

Medicaid enrollees who are White, American Indian and Alaska Native (AIAN), male or older than age 26 have higher rates of diagnosed SUD. These patterns are also generally consistent across OUD and AUD, with one exception. For AUD, diagnosis rates are highest among the oldest age group (45 to 64), whereas diagnosis rates for OUD are highest for people aged 27 to 44 (Figure 1).

Rates of Diagnosed Substance Use Disorders Among Medicaid Enrollees

What SUD services do Medicaid enrollees diagnosed with SUD receive?

Substance use treatment can be provided in a variety of settings and may include different treatment modalities, medication, and supportive services. For descriptions of these treatments and service types, see Table 1 below. Self-help treatments, such as Alcoholics Anonymous (AA) and Narcotics Anonymous (NA), may also play a role in treatment but are not included in this analysis.

Substance Use Disorder treatment or supportive services can be delivered through a variety of services and settings

Nationally, approximately three-quarters (74%) of Medicaid enrollees with diagnosed SUDs received treatment or supportive services in 2020. Counseling/therapy, medication and other services (including screening/assessment) have the highest utilization rates. A smaller share (19%) of enrollees diagnosed with SUD receive inpatient or residential services, with the lowest share receiving partial hospitalization or intensive outpatient services (8%). Supportive services are used by about one in seven enrollees (Figure 2). These estimates exclude the use of some services in states where certain providers have the option to bundle services or use a single code to bill for multiple services. They also exclude services for which providers did not directly bill Medicaid, such as those provided through Indian Health Services, free clinics, schools or through self-help groups such as AA and NA.

About three-quarters of Medicaid enrollees diagnosed with a substance use disorder received some type of treatment or supportive service in 2020

Medicaid enrollees diagnosed with an OUD generally have higher treatment rates than those with AUD, with the widest variation for medication treatment. Approximately 2.9% of enrollees have a diagnosed OUD and/or 2.6% have a diagnosed AUD (Figure 1). Enrollees diagnosed with OUD tend to have higher treatment rates than those diagnosed with AUD. Variation is most pronounced in medication treatment—with 63% of those with diagnosed OUD receiving medication treatment compared to 10% for AUD (Figure 2). This wide difference in treatment rates exists even though medications for both OUD and AUD are effective and recommended (Box 1). While rates of medication use for AUD are low across payers, progress has been made in increasing OUD medication rates within Medicaid. However, a substantial gap remains—with about one-third of Medicaid enrollees diagnosed with OUD not receiving medication treatment. Several factors may contribute to the OUD medication treatment gap, including difficulty filling buprenorphine prescriptions at pharmacies, low provider prescribing, state and federal policies as well as a number of other factors.

Box 1: Medication Treatment for SUD

Understanding Medication Treatments for Opioid Use Disorder (OUD): Medication treatment is recognized as a core component of OUD treatment.

  • Approved Medications: Three medications are FDA approved to treat OUD: methadone, buprenorphine and naltrexone. Methadone and buprenorphine are controlled substances. Methadone was introduced in the 1960s and is only distributed through federally registered opioid treatment programs (OTP). Buprenorphine—a controlled substance—has been approved for OUD treatment since 2002. Other medication treatments are also sometimes used.
  • Clinical Guidelines: Pharmacotherapy is recommended for most individuals with OUD, including some adolescents and pregnant women, with some modifications. Both methadone and buprenorphine are acknowledged for their high efficacy in treating OUD. 

Understanding Medication Treatments for Alcohol Use Disorder (AUD): Medication treatment is recognized as a core component of treatment for many people with AUD.

  • Approved Medications: Three medications are FDA approved to treat AUD: disulfiram, acamprosate and naltrexone. Disulfiram has been around the longest, since the 1950s and other AUD medications were not approved until the 1990s or later. Other medication treatments are also sometimes used.
  • Clinical Guidelines: Pharmacotherapy is recommended for many people with moderate or severe AUD and treatment recommendations have strengthened in recent years. Current research is considered insufficient to recommend medication treatment for adolescents and pregnant women. Naltrexone and acamprosate are acknowledged for their high efficacy in treating AUD.

How does use of SUD services vary by demographics and geography?

Among those with a diagnosed SUD, Black, Hispanic and Asian Medicaid enrollees generally receive SUD treatment at lower rates than White enrollees. White enrollees tend to have the highest treatment rates across categories of treatment. Black enrollees with OUD are far less likely to receive recommended medication treatment (4 in 10 compared to nearly 7 in 10 of their White counterparts). Asian enrollees have lower rates of counseling/therapy than White enrollees. While AIAN enrollees have higher medication treatment rates for OUD (relative to many other groups), their rates for other categories, such as counseling/therapy and supportive care, tend to be more variable. Various factors, including low provider cultural competency and fewer treatment options in diverse communities, as well as perceived need for treatment and personal beliefs related to seeking help, may all play a role in the variation of treatment rates across racial and ethnic groups. In addition, limitations in claims data, such as differences in the data quality of race and ethnicity variables, differences in how often SUDs are diagnosed and recorded and potential exclusion of treatment services provided by Indian Health Services can affect observed treatment rates across racial and ethnic groups (see Methods).

Substance Use Disorder Treatment Varies Considerably by Race, Ethnicity, and Age

Youth and young adults have lower overall SUD treatment rates than older age groups—with treatment rates particularly low for OUD medication treatment among youth. Overall, about 65% of youth and young adult Medicaid enrollees use some type of treatment or service for SUD, compared to 78% for the 27 to 44 age group (Figure 3). Diagnosed SUD is far lower among youth (1.3%) and young adults (5.4%) compared to those aged 27 to 44 (11.2%) (Figure 1). The most notable age-related variation is for medication treatment, with 69% of enrollees aged 27 to 44 receiving medication for OUD, compared to 12% of youth (Figure 3). Medication treatment is currently recommended for some adolescents with OUD. Medication treatment rates for adolescents with AUD are also very low, but medication treatment is not part of current recommendations due to insufficient evidence (Box 1). Males and females use SUD care at similar rates across all types of treatment.

Average utilization of SUD treatment services varies substantially across states. Supportive services, medications for OUD, and inpatient/residential services show particularly wide ranges in treatment rates. Rates for any substance use treatment among diagnosed enrollees range from 53% for the lowest state up to 89% for the highest state. The range across states is particularly pronounced for supportive services and medications for OUD (from 0.1% to 53% for supportive services and 34% to 87% for medication for OUD). Variation is also quite wide for inpatient and counseling services (Figure 4).

There is a Wide Range of Substance Use Disorder Treatment and Service Rates Across States

Although 74% of enrollees are getting some type of treatment or service, 26% of those diagnosed are not getting any services and there is wide variation across states. In the lowest treatment states, 33% to 47% of diagnosed enrollees do not receive any SUD treatment or support services (Figure 5).

Considerable State-by-State Variation in Any SUD Medication or Service, Counseling/Therapy, and Medication Treatment for Opioid Use Disorder

Several states have consistently higher SUD treatment rates across multiple categories. Connecticut, Delaware and Vermont stand out for higher treatment rates across various treatment services. Conversely, there are states with consistently lower treatment rates across categories, including Arkansas, Georgia, Mississippi and Texas (Figure 5). Variation in treatment rates reflects a combination of factors, including differences in states’ coverage policies, state or community efforts to expand access to treatment, treatment infrastructure and workforce, provider participation with Medicaid, and differences in states’ data and the extent to which SUD diagnoses and treatments are captured in the claims data (see Methods).

How does spending for people with SUD compare to overall spending?

Average Medicaid spending is twice as high for enrollees with a SUD diagnosis compared with other enrollees: Over $1,200 per month and less than $550 per month respectively. Notably, spending is highest for those diagnosed with AUD, at approximately $1,400 per month per enrollee. This pattern of higher spending for individuals with a SUD diagnosis is consistent across all age groups (Figure 6).

Average Monthly Spending for Medicaid Enrollees with a Substance Use Disorder (SUD) is Twice That of Medicaid Enrollees Without a SUD

Why is there variation in SUD treatment rates?

This analysis may overestimate SUD treatment rates and may underestimate certain types of treatment. As a result of lower diagnosis rates in claims data, estimates of treatment rates using claims data might appear higher than they really are, as they don’t account for the total number of enrollees with SUD. Several factors may contribute to underdiagnosis, including limited provider screening/referral practices, insufficient provider training for SUD, reduced healthcare use for some populations, and stigma. Expanding screening beyond traditional settings or increasing care integration could improve identification of those in need of SUD services. Although the data may overstate treatment rates as a whole, some specific treatments may be missing in cases where states allow bundled payments that roll several types of SUD treatment and supportive services into a single code. This may result in lower recorded utilization for some services, particularly supportive services and may also impact counseling/therapy rates.

Among enrollees diagnosed with an SUD, there is notable variation in treatment rates for opioid use disorder compared to alcohol use disorder. Overall OUD treatment rates generally exceed those for AUD, likely reflecting a greater policy focus on addressing the opioid crisis. Differences are most acute for medication, where treatment rates for OUD medication exceed AUD medication rates by more than 6-fold. A few factors may help explain why medications for AUD may be less utilized, relative to OUD, including lower awareness and understanding of medication treatment options for AUD among clinicians and patients, uncertainties about medication effectiveness, and challenges finding psychosocial support. While excessive alcohol use can lead to a number of health issues, it typically lacks the acute mortality risks associated with opioid/fentanyl use, which may reduce the urgency to initiate AUD medication treatment. Treatment patterns may differ for other specific types of SUD.

Availability of substance use treatment infrastructure and workforce may play a role in variation in treatment rates for certain populations. For example, youth and young adults receive SUD treatment at lower rates, potentially due to a shortage of specialized facilities for this population. Some states are addressing treatment needs by adding coverage for services in non-traditional settings, such as schools, though it isn’t clear whether these services will appear in Medicaid claims data. Lower treatment rates for some racial and ethnic groups may contribute to higher overdose death rates. Factors such as low provider cultural competency in care, lack of diversity in the behavioral health workforce, personal beliefs and societal stigmas, perceived need for treatment and limited treatment infrastructure or fewer treatment options in diverse communities may all play a role.

Substantial state-level variation in treatment rates exist and may reflect differences in covered services, workforce, infrastructure, state characteristics and the nature of their Medicaid payment systems and data. States expanded coverage for SUD services in recent years. Access to services not only depends on Medicaid coverage of services and the availability of facilities and beds, but also on the presence of a behavioral health workforce to keep facilities operational and to provide treatment services. Other state Medicaid efforts that have focused on addressing the opioid epidemic and other SUDs include reducing prior authorization barriers for buprenorphine, expanding telehealth access, adding OTC Narcan to formularies and exploring pre-release Medicaid coverage for incarcerated populations. There have been federal efforts to expand access to SUD treatment and the President’s budget includes a number of provisions to further strengthen behavioral health, some of which include expanding funding for the State Opioid Response grant program, expanding behavioral health services in schools and strengthening the behavioral health workforce.

Medicaid unwinding may lead to loss or interruptions in coverage for people who depend on Medicaid for SUD treatment. Coverage interruptions could disrupt enrollee access to necessary treatment and increase the risk of overdose or complications. The recent resumption of Medicaid renewals following a three-year pandemic halt, known as the ‘Medicaid unwinding’,  has led to millions of individuals losing Medicaid coverage. Many people who lose Medicaid have alternative insurance options. However, for those who rely on Medicaid to cover SUD treatment, the loss of Medicaid coverage could disrupt their access to ongoing SUD treatment. Such a loss may disrupt treatment and increase overdose or complication risks.

This work was supported in part by Well Being Trust. KFF maintains full editorial control over all of its policy analysis, polling, and journalism activities.


Methods

Medicaid Claims Data: This analysis used the 2020 T-MSIS Research Identifiable Files including  the inpatient (IP), long-term care (LT), other services (OT), and pharmacy (RX) claims files merged with the demographic-eligibility (DE) files from the Chronic Condition Warehouse (CCW).

Identifying SUD Diagnoses: This analysis identified SUD diagnoses using the Behavioral Health Service Algorithm (BHSA) reference codes provided by The Urban Institute. The BHSA identifies SUD with ICD-9 and ICD-10 diagnosis codes, procedure codes, service codes, and National Drug Codes (NDCs). “Any SUD” is a comprehensive category that includes SUDs that involve alcohol, opioids, marijuana, inhalants, sedatives, hallucinogens, psychostimulants, and/or substances labeled as “other” or “unspecified” in claims data. This analysis also separately examined alcohol and opioid use disorders.

See: Victoria Lynch, Lisa Clemans-Cope, Paul Johnson, Marni Epstein, Doug Wissoker, and Emma Winiski. Behavioral Health Services Algorithm. Version 3. Washington, DC: Urban Institute, 2022.

Identifying SUD Utilization and Medicaid Treatment Services Categories of Care: The Urban Institute’s BHSA also identified use of the following SUD treatment service categories:

  • Medication Treatment (OUD/AUD) which includes medications that the FDA has approved for OUD/AUD treatment, other replacement medications, and some psychiatric medications used to treat SUD;.
  • Inpatient or Residential Care;
  • Intensive Outpatient Program (IOP) or Partial Hospitalization Program (PHP);
  • Therapy/Counseling;
  • Supportive Services (includes case management/care coordination, peer supports, vocational training, and other supportive services); and
  • Other Treatment (includes SBRIT screening, assessment, management and evaluation codes, crisis intervention, and services not categorized elsewhere)People who receive one or more type of treatment are considered to have received “any treatment.”

Spending: Spending data includes fee-for-service spending as well as per member per month payments to Medicaid managed care.

Enrollee Inclusion Criteria: This analysis includes enrollees ages 12 to 64 who had full Medicaid or CHIP coverage for at least one month. Treatment rates were similar if the sample was limited to enrollees with at least six months of full coverage.

State Inclusion Criteria: To assess the usability of states’ data, the analysis examined quality assessments from the DQ Atlas for claims volume and managed care encounters and compared the percentage of people with SUD to estimates from the 2021 National Survey on Drug Use and Health (NSDUH) state estimates (due to the unavailability of 2020 NSDUH data).The analysis excluded any states that had both a “High Concern/ Unusable” DQ Atlas assessment and a difference between the NSDUH and claims-based estimates  greater than 10.9 percentage points (which corresponded to the 75th percentile of the distribution of differences). Washington D.C. was excluded based on these criteria, leaving 50 states in the analysis.

For reporting by race/ethnicity, the analysis excluded states with “High Concern/Unusable” DQ Atlas assessments. Among the states in the main analysis, 19 were excluded  (AL, AZ, AR, CO, CT, HI, IA, KS, LA, MD, MA, MO, NY, OR, RI, SC, TN, UT, and WY). This left 31 states for reporting by race/ethnicity (Figure 3).

Limitations of Claims Data:

  • Claims data not capture everyone with SUD because screening/referral practices vary and diagnoses may not be recorded if treatment isn’t received. As a result, the treatment rates calculated from claims data may represent an upper bound of treatment rates since they don’t reflect the full pool of people will SUD.
  • Some states allow bundled payments that rolls several types of SUD treatment and supportive services into a single code, which may result in lower utilization rates for some services and in some states. Services not reimbursed by Medicaid will not appear in claims data.
  • Due to the continuous enrollment provision enacted at the start of the pandemic, Medicaid enrollment increased. Higher enrollment may have implications for service utilization rates in 2020. However, sensitivity tests show similar service utilization in 2019 and 2020 among those diagnosed an SUD. 

National Survey on Drug Use and Health. The National Survey of Drug Use and Health (NSDUH) asks nationally representation sample of respondents 12 and older about substance use and symptoms of substance use disorders. Those who exceed certain thresholds are classified as having a SUD. This analysis uses the 2020 NSDUH public use file and includes Medicaid enrollees between the ages of 12 and 64 who met DSM-V criteria for a SUD involving alcohol or illicit drugs. Illicit drugs include marijuana, cocaine, heroin, hallucinogens, inhalants, methamphetamine and the misuse of prescription psychotherapeutic drugs (i.e., pain relievers, tranquilizers, stimulants, and sedatives). Urban Institute’s BHSA includes the same substances as well as codes for “other” or “unspecified” substances.  NSDUH captures people who may not have a clinically identified or diagnosed case, so rates of SUD are higher than claims data across demographic groups; however, NSDUH may still underestimate SUD prevalence. NSDUH only collects data from people with an address–excluding those who are unhoused, institutionalized, or incarcerated–which is relevant because these populations may have higher rates of substance use disorders.

Appendix

Rates of Diagnosed Substance Use Disorder Among Medicaid Enrollees

What are the Recent Trends in Health Sector Employment

Authors: Emma Wager, Imani Telesford, Paul Hughes-Cromwick, Krutika Amin, and Cynthia Cox
Published: Mar 27, 2024

This updated chart collection takes a deep dive into employment data to analyze how jobs and wages in the health sector have changed since the COVID-19 pandemic. Unlike past recessions, health sector employment saw a big drop in early 2020 but has rebounded since. As of February 2024, the health sector added 66,700 jobs over the previous month. Jobs in the health sector are 5.7% higher than in February 2020 (the previous peak), compared to 3.4% in all other sectors.

Still, not all health sector employment trends have recovered. While hospitals and physicians’ offices have returned to pre-pandemic employment levels, industries such as elderly care and skilled nursing care facilities continue to see relatively low employment. Employment in elderly care facilities reached a low of 869,500 in January of 2022 and has been growing slightly since. These facilities had 974,600 employees nationwide in February 2020, and 965,100 in February of 2024—a 1% decrease. Skilled nursing care facilities have seen an 8.3% drop in employment since February of 2020.

The chart collection is available on the Peterson-KFF Health System Tracker, an online information hub dedicated to monitoring and assessing the performance of the U.S. health system

PEPFAR’s Short-Term Reauthorization Sets an Uncertain Course for Its Long-Term Future

Published: Mar 27, 2024

After months of partisan negotiations and wrangling over the federal budget, Congress finally agreed to spending levels for the remainder of fiscal year 2024, passing an omnibus funding bill on March 23, 2024, that was then signed by President Biden. Tucked into this agreement was a short-term reauthorization of the President’s Emergency Plan for AIDS Relief (PEPFAR, the U.S. government’s global HIV response), its fourth reauthorization. Widely regarded as one of the most successful global health programs in history and credited with saving millions of lives, PEPFAR had been caught up in the broader U.S. political debate over abortion, which had effectively stalled its reauthorization for the first time in what has otherwise been a long, bipartisan history of support. With the new omnibus bill, PEPFAR has been reauthorized until March 25, 2025, without the inclusion of any controversial provisions or changes related to abortion, sought by some. Still, while this latest step provides the program with some short-term certainty, including signaling bipartisan support (albeit limited), it marks a significant departure from PEPFAR’s past. The outcome of the presidential election and Congressional races determining control of the House and Senate could have significant implications for PEPFAR and the millions of people it serves.

Why PEPFAR Reauthorization Was Stalled

As we explored in an earlier analysis, the latest reauthorization of PEPFAR was drawn into the broader U.S. debate about abortion, even though U.S. law prohibits the use of U.S. foreign assistance, including PEPFAR funding, for abortion. The Biden administration and a wide range of stakeholders had been seeking a five-year, “clean” reauthorization of PEPFAR (an extension of the dates of expiring provisions without any changes to program language or requirements), but abortion was first publicly raised in PEPFAR reauthorization discussions in early May. A coalition of organizations opposed to abortion rights, a conservative think tank’s report, and a member of Congress raised concerns that PEPFAR may be supporting abortion, and they criticized the Biden administration’s support for global sexual and reproductive health and rights, including in PEPFAR’s latest strategy document. There was also a call for Congress to reinstate and apply the “Mexico City policy” to PEPFAR (see box).

The Mexico City policy – first instituted in 1984 but not currently in effect – is a policy that required foreign non-governmental organizations (NGOs) to certify that they would not perform or promote abortion as a method of family planning using funds from any source as a condition for receiving certain U.S. funding. Typically put in place through executive order, it first applied to PEPFAR in 2017 under an expanded version of the policy instituted by President Trump, which was rescinded by President Biden in 2021 (prior to that time, when it was in place, PEPFAR was not subject to this policy).

In response, PEPFAR stated that it does not provide a platform for abortion, sent official communication to its implementers regarding current law and policy in this area, and revised its strategy to clarify that “sexual and reproductive health services” has a specific meaning in the PEPFAR context and reiterated that “PEPFAR does not fund abortions, consistent with longstanding legal restrictions on the use of foreign assistance funding related to abortion. In addition, no evidence was produced to indicate that PEPFAR supported any prohibited activities. Despite the lack of evidence, however, reauthorization of the program was effectively stalled, and there was uncertainty about whether the program would be reauthorized again.

What the Omnibus Bill Does, and the Difference Between Authorizing and Appropriations Legislation

The omnibus funding bill that passed on March 23, 2024, funds the government for the remainder of the current fiscal year and also included a short-term reauthorization of PEPFAR, marking the fourth time PEPFAR has been reauthorized (although each prior time, it was reauthorized for five-year periods; see Table 1). The language in the bill extended eight time-bound requirements in PEPFAR’s legislation through March 25, 2025 (essentially, halfway through FY 2025). These included seven provisions that had “sunset” or expired at the end of FY 2023 (September 30, 2023) and one provision that would have sunset at the end of FY 2024 (see Table 2). These requirements will “sunset” again if not addressed through a future PEPFAR reauthorization or another legislative vehicle.

More generally, there is an important distinction between “authorizing” and “appropriations” legislation. Authorizing (or reauthorizing) legislation establishes programs and policies, oversight and reporting requirements, and provides guidance to appropriators on funding amounts and conditions. It may include time-bound provisions or may provide no end date for programs to operate, which they can do as long as they are funded. Such legislation can be put forward as a standalone bill or attached to another legislative vehicle, such as appropriations legislation (which is the case with this latest omnibus bill). Appropriations legislation provides budget authority, allowing funding to be provided to an agency or program; absent an authorization (or reauthorization), an appropriations bill can have the effect of allowing the continued operation of an existing program by providing funding. PEPFAR was created in 2003 through authorizing legislation (The Leadership Act), which established the program, its structure, and other program aspects without including any end date or sunsetting of the program (with the exception of some provisions). This means that PEPFAR largely operates under permanent authorities of U.S. law that allow for the program to continue as long as Congress appropriates funding. The omnibus bill also appropriated bilateral funding for PEPFAR at the same level as the prior year.

Table 1

PEPFAR Legislation

Full TitleCommon TitlePublic Law #YearsFunding Authorization Level
United States Leadership Against HIV/AIDS, Tuberculosis, and Malaria Act of 2003“The Leadership Act”P.L. 108-25FY 2004 – FY 2008$15 billion
Tom Lantos and Henry J. Hyde United States Global Leadership Against HIV/AIDS, Tuberculosis, and Malaria Reauthorization Act of 2008“The Lantos-Hyde Act”P.L. 110-293FY 2009 – FY 2013$48 billion
PEPFAR Stewardship and Oversight Act of 2013“The PEPFAR Stewardship Act”P.L. 113-56FY 2014 – FY 2018Did not specify authorization for funding
PEPFAR Extension Act of 2018“The PEPFARExtension Act”P.L. 115-305FY 2019 – FY 2023Did not specify authorization for funding
Department of State, Foreign Operations, and Related Programs Appropriations Act, 2024“Extension of Certain Requirements of PEPFAR”P.L. 118-47FY 2024 – March 25 of FY 2025 (March 25, 2025)Did not specify authorization for funding
Note: Current law is reflected in the consolidation of PEPFAR authorizing legislation in U.S. Code: 22 USC Chapter 83: United States Leadership Against HIV/AIDS, Tuberculosis, and Malaria.Source: KFF analysis of PEPFAR legislation.
Table 2
 

Current Status of PEPFAR Reauthorization’s Time-Bound Provisions


Topic of ProvisionDescription
1. HIV Bilateral Funding Allocation: Treatment, Care, Nutrition and Food SupportRequires that more than half of funds appropriated or otherwise made available for bilateral HIV be expended for treatment, care, and nutrition and food support for people living with HIV (through March 25, 2025)
2. HIV Bilateral Funding Allocation: Orphans and Vulnerable Children (OVC)Requires that not less than 10% of funds appropriated or otherwise made available for bilateral HIV be expended for programs targeting orphans and other children affected by, of vulnerable to, HIV (through March 25, 2025)
3. Global Fund Contribution: 1/3 CapLimits U.S. contributions to the Global Fund to not exceed 33% of all funds donated to the Global Fund during a specified period (“1/3 cap”) (through March 25, 2025, calculated from FY 2004)
4. Global Fund Contribution: Use of Funds Withheld Due to 1/3 CapAuthorizes that any of the U.S. contribution to the Global Fund withheld due to the 1/3 cap may be used for bilateral HIV, TB, and malaria programs (through March 25, 2025)
5. Global Fund Contribution: Withholding Obligation of 20% Pending CertificationRequires withholding 20% of annual U.S. contribution to the Global Fund pending certification of certain accountability and transparency benchmarks by the Secretary of State* (through March 25, 2025)
6. Global Fund Contribution: Withholding Portion if Funds Expended to Certain GovernmentsRequires withholding a portion of the U.S. contribution to the Global Fund, the next fiscal year, equal to the amount expended by the Global Fund to country governments determined by the Secretary of State to have “repeatedly provided support for acts of international terrorism” (through March 25, 2025)
7. Annual Treatment Providers StudyDirects the Global AIDS Coordinator to annually complete a study of treatment providers for HIV programs, including spending by the Global Fund and partner countries (through March 25, 2025)
8. Oversight Plans of Inspectors GeneralDirects various agencies’ inspectors general to jointly develop coordinated annual plans for overseeing HIV, malaria, and TB programs (through March 25, 2025)
Note: As of March 23, 2024. * In certain years, Congress directed the withholding to be 10%, rather than 20%.Source: KFF analysis of Further Consolidated Appropriations Act, 2024 (P.L. 118-47) and KFF, PEPFAR Reauthorization: Side-by-Side of Legislation Over Time.

Looking Ahead

After months of uncertainty surrounding reauthorization, which had created confusion and other challenges for the program, this latest step provides the program with some certainty for the time being. The short-term reauthorization signals a demonstration of bipartisan support, including by Congressional leadership – albeit limited – allowing it to move forward without any changes or controversial provisions around abortion (despite those sought by some). It also extends the program’s authorities past the next presidential election, thereby taking PEPFAR somewhat out of the direct line of sight of presidential politics for now. Finally, the bill also included funding for PEPFAR through the end of FY 2024 (which ends September 30, 2024).

At the same time, this latest development marks a departure from PEPFAR’s long-term history of strong support across party lines through multiple Congresses and administrations. It is possible that there will be more polarized debates over PEPFAR and its funding in the future, particularly as March 2025 and the end of the short-term reauthorization draws closer. Moreover, despite the latest reauthorization extending beyond the election, the outcome itself could have significant consequences for PEPFAR, beyond the debate about reauthorization. If President Trump is elected once again, he will almost certainly reinstate the Mexico City policy to apply to PEPFAR (and global health more generally), and it’s possible its reach could be expanded even further, including to encompass all U.S. foreign aid rather than just global health, as recommended in the Heritage Foundation’s Project 2025 report, intended as a blueprint for a Trump administration. While President Biden’s reelection would mean the Mexico City policy would remain rescinded, Republican control of one or both houses in Congress could result in continued controversy over PEPFAR and abortion. Regardless of electoral outcomes, the ground upon which PEPFAR sits has already shifted, potentially changing the political and programmatic calculus for PEPFAR in the years ahead.