5 Key Facts About Children with Special Health Care Needs and Medicaid

Published: Apr 18, 2025

Options under consideration in Congress to reduce Medicaid spending to help pay for tax cuts could have major implications for children with special health care needs. Medicaid provides comprehensive health coverage to about 4 in 10 children nationwide, including over 8 in 10 children in poverty, and is a major source of coverage for children with special health care needs. Medicaid also accounts for over half of all long-term care spending, including home care, which can provide the support children with special health care needs require to live at home with their families. Major cuts to federal Medicaid funding would put states at significant financial risk, forcing them to make tough choices about reducing the number of people covered, covering fewer benefits, or reducing payment rates for physicians, hospitals, nursing homes, and other providers. Proposals to limit federal spending on Medicaid could potentially result in reductions in eligibility or coverage or make it more difficult for children with special health care needs to access the care they need. Amid debates to limit federal Medicaid support, this brief analyzes key characteristics of children with special health care needs and explores how Medicaid provides coverage for them.

1. Medicaid is a major source of coverage for children with special health care needs.

Children with special health care needs (CSHCN) are “children who have chronic physical, developmental, behavioral, or emotional conditions and who require health and related services of a type or amount beyond that required by children generally”. An estimated 19 million or more than one-quarter of children have special health care needs in the US (Appendix Table 1).

Medicaid (in addition to CHIP) covers more than four in ten children with special health care needs compared with one-third of children without special health care needs (Figure 1). Medicaid is the only source of coverage for one in three children with special health care needs, while another 9% have Medicaid to supplement private insurance. Medicaid covers services that private insurance typically does not, including long-term care and home care, and has cost-sharing protections that help keep health care more affordable for families. Further, when compared with children without special health care needs, larger shares of children with special health care needs are White or Black, while smaller shares are Hispanic or Asian, and a larger share of children with special health care needs are male compared with children without special health care needs.

Children with special health care needs utilize more health care services, including inpatient, outpatient, emergency, and specialty care, and account for a larger share of health care expenditures compared with children without special health care needs. KFF analysis also shows Medicaid spending per child enrolled through an eligibility pathway for children with disabilities (known as the Katie Beckett pathway) was almost six times higher ($17,500) than Medicaid spending per child overall ($3,023).

Medicaid is a Major Source of Health Coverage for Children With Special Health Care Needs

2. The share of children with special health care needs covered by Medicaid varies by state.

The share of children with special heath care needs covered by Medicaid (in addition to CHIP) ranges from under 30% in Utah, Hawaii, and Illinois to 60% or higher in Mississippi, Louisiana, and Arkansas (Figure 2, Appendix Table 1). This includes children covered by Medicaid alone as well as those with Medicaid to supplement private insurance.

Factors that can contribute to state Medicaid programs covering more children with special health care needs include Medicaid income eligibility limits in the state and the state’s disability-related eligibility pathway options. Children with special health care needs may be eligible for Medicaid on the basis of age and income alone or through pathways that are specific to people with disabilities. Federal Medicaid rules require states cover children with household incomes up to 138% of the federal poverty level (FPL), but all states opt to expand financial eligibility to higher income levels. As of January 2025, the median financial eligibility level for Medicaid/CHIP children nationally was 255% FPL ($67,957/year for a family of three) but ranged from 190% to 405% FPL across states. States are also generally required to cover children who receive Supplemental Security Income, which provides monthly income to low-income children whose physical or mental impairments result in marked and severe functional limitations and are expected to last for at least 12 months or result in death.

States may choose to offer other disability-related pathways, which have higher income limits. There are two pathways that are specific to children. Children who qualify for Medicaid through those pathways may have both Medicaid and private health insurance, which reflects the fact that private insurance often does not cover all of the services that children with I/DD typically need. Under the Katie Beckett option, 43 states cover children under age 19 who are disabled and living at home and who would be eligible for Medicaid if they were living in an institution. Available in 9 states, the Family Opportunity Act pathway is an optional program for states to adopt that provides coverage to children with significant disabilities living at home. This program allows children with disabilities whose family income is below 300% FPL to buy into Medicaid.

Managed care is the dominant delivery system for people enrolled in Medicaid, and most states cover at least some children with special health care needs through comprehensive, risk-based managed care organizations (MCOs). However, how managed care plans structure their health care delivery for children with special health care needs varies by state.

The Share of Children With Special Health Care Needs Covered by Medicaid Varies by State

3. Children with special health care needs covered by Medicaid have greater health care needs compared with private insurance.

Children with special health care needs covered by Medicaid are more likely to have an intellectual or developmental disability (I/DD) compared with children with special health care needs covered by private insurance alone (Figure 3). I/DD are typically diagnosed during childhood and include a number of conditions (see Methods). Just under half (44%) of children with Medicaid alone and over half (56%) with Medicaid and private insurance have an I/DD compared with 28% of private insurance. Rates of physical health conditions among children with special health care needs are similar across Medicaid alone (66%), Medicaid and private (67%), and private insurance alone (63%). Rates of behavioral health conditions are similar for Medicaid alone (57%) and private insurance alone (55%) but higher for children with both Medicaid and private insurance (61%).

Children with special health care needs covered by Medicaid are also more likely to have multiple chronic conditions and report functional difficulties compared with private insurance alone. One-third (33%) of children with Medicaid alone and almost half of children (47%) with Medicaid and private insurance report having four or more chronic conditions, compared with almost one-fifth (18%) of those covered by private insurance. Children with special health care needs and Medicaid also report more functional difficulties (one or more, two or more, four or more functional difficulties) compared with children with private insurance only. Functional difficulties impact the day-to-day life of children with special health care needs and can include challenges such as difficulty concentrating, walking or climbing stairs, dressing or bathing, or problems with hearing or vision. Children with both Medicaid and private insurance typically have the greatest health care needs, with larger shares of children with Medicaid and private reporting multiple co-occurring chronic conditions (data not shown) as well as four or more chronic conditions.

Children With Special Health Care Needs Covered by Medicaid Have Greater Health Care Needs Compared With Private Insurance

4. EPSDT helps children with special health care needs meet their health care needs and protects them from high out-of-pocket costs.

Medicaid’s benefit package for children, Early and Periodic Screening, Diagnostic and Treatment (EPSDT), provides a set of comprehensive health care services to Medicaid enrollees under age 21. Under EPSDT, states are required to cover all screening services for children as well as any services “necessary… to correct or ameliorate” a child’s physical or mental health condition. Through the EPSDT benefit, Medicaid provides more comprehensive coverage for these children than the typical private insurance plan and increases access to needed services that improve the quality of daily life. Under EPSDT, states provide primary care and screenings for developmental and behavioral health conditions, as well as for vision, hearing, and dental conditions. States also cover needed therapies, long-term care and home care, assistive technology, and non-emergency medical transportation. Some children with special health care needs covered by Medicaid also receive services and supports from Title V agencies, which can include the coordination of EPSDT with other federal programs like supplemental food programs.

Due in part to the EPSDT benefit, children with special health care needs and Medicaid alone are more likely to report that their benefits are adequate to meet their needs and that they can see needed providers compared with children with private insurance alone (Figure 4). Medicaid generally protects beneficiaries from high out-of-pocket costs; parents of children with special health care needs and Medicaid alone are more likely to report their out-of-pocket costs are reasonable and under $1000 compared with those with private insurance alone.

Children with special health care needs can encounter barriers to coverage and care when transitioning out of children’s Medicaid eligibility pathways and the EPSDT benefit. Families of children with special health care needs who are aging out of child benefits report that there is frequently a lack of clear information available to them and that they are often unprepared for the transition. Medicaid eligibility for children generally and for children with disabilities is typically more expansive than that of adults, meaning some children with special health care needs could lose Medicaid coverage when they age out (especially in states that have not expanded Medicaid under the Affordable Care Act). Adult Medicaid benefits are typically more limited than EPSDT, resulting in potential decreases in services relative to what is available to children with special health care needs.

EPSDT Helps Children With Special Health Care Needs Meet Their Health Care Needs and Protects From High Out-of-Pocket Costs

5. Medicaid coverage can facilitate access to care for children with special health care needs in school.

There are an estimated 7 million children, or 10% of all children in the U.S., who currently have special education plans, and over two-thirds of these children have special health care needs. This includes children receiving special education services under a special education or early intervention plan (often an Individualized Education Plan (IEP) or Individualized Family Service Plan). Medicaid covers half of all children with special education plans compared with one-third of children without special education plans (Figure 5). The share varies by state, ranging from about 30% in New Jersey, Utah, and DC to about 70% in West Virginia, Arkansas, and Kentucky (Appendix Table 1). If a child is eligible for both special education services and Medicaid, federal law requires state Medicaid programs to pay for services that are both educationally and medically necessary. This is an exception to the general rule that usually makes Medicaid the payer of last resort when other sources of coverage are available. If a device or service included in a child’s special education plan under the Individuals with Disabilities Education Act (IDEA) is also medically necessary, then Medicaid is obliged to pay before the school district (see 34 CFR Sections 300.301-300.306).

School-based Medicaid supports can include reimbursement for medically necessary services that are part of a student’s IEP as well as reimbursement for eligible health services provided more broadly for students with Medicaid coverage. Medicaid may cover a range of health services provided to children in schools including health screening services, speech or physical therapy for children with disabilities, and a range of medically necessary physical, mental health, and SUD services. As youth mental health concerns have grown in recent years, both the federal government and states have worked to increase access to behavioral health services by expanding school-based care for students. This includes leveraging Medicaid to improve and address gaps in school-based behavioral health services.

Medicaid Coverage Can Facilitate Access to Care for Children With Special Health Care Needs in School

Appendix

Share of Children with Special Health Care Needs or a Special Education Plan Covered by Medicaid in 2023, by State

Methods

Data: This analysis uses the 2023 National Survey of Children’s Health (NSCH), the most current data available.

Defining CSHCN: The NSCH continues to use the CSHCN Screener to identify children with special health care needs. To meet the criteria for having a special health care need, a child must experience a health consequence that is due to a medical or other health condition that has lasted or is expected to last for 12 months or longer. However, research has shown that some children with special health care needs may be excluded from this definition, and, in 2024, the definition of CSHCN was slightly broadened to incorporate more children who may need supportive services. The CSHCN screener remains in use and is the basis of the expanded definition, which is used in this analysis. Using the original definition, 15 million or 21% of children ages 0-17 have special health care needs compared with 19 million or 26% of children using the expanded definition.

Identifying chronic conditions: This analysis identifies any chronic condition as having one or more conditions from a list of 24 health conditions asked about in the 2023 survey (following methodology from the Data Resource Center). Those 24 health conditions were then categorized into three groups: physical, behavioral, and I/DD. To the extent possible across data sources, these definitions align with other KFF analysis of chronic conditions.

  • Physical: Allergies, asthma, autoimmune disease, cerebral palsy, type 2 diabetes, epilepsy or seizure disorder heart condition, frequent/severe headaches/migraines, blood disorders, cystic fibrosis, hearing problems, and vision problems.
  • Behavioral: Tourette syndrome, anxiety problems, depression, behavioral or conduct problems, and ADD/ADHD.
  • I/DD: Down syndrome, developmental delay, intellectual disability, speech or other language disorder, learning disability, autism or ASD, and fetal alcohol spectrum disorder.

Limitations: The NSCH is based on parent recollection, and studies have shown there can be differences between self-reported survey data and claims data. This analysis breaks down indicators by health insurance coverage status for children with special health care needs but does not include estimates for uninsured children or children who did not report coverage status. This is due to many of the estimates for these children not meeting the minimum standards for reliability.

Analysis of USAID’s Active and Terminated Awards List: How Many Are Global Health?

Published: Apr 17, 2025

The U.S. is the largest donor government to global health and has prioritized health within its foreign assistance activities to a greater degree than other donor governments. In addition to being the largest donor, the U.S. operates programs, provides technical assistance, participates in international health organizations, conducts research, and more. Since the start of his second term, President Trump has taken numerous actions impacting U.S. global health efforts including pausing foreign aid while conducting of review of existing programs, elimination of the U.S. Agency for International Development (USAID), which manages the majority of U.S. global health funding, and signing several executive actions placing restrictions on U.S. global health activities. These efforts have significant implications for existing U.S. programs and left large gaps in the donor landscape.

Most recently, as part of its foreign aid review, the Trump administration notified Congress of the number of USAID awards it intends to terminate and those it will continue. The list included more than 6,200 awards, of which more than 5,300 were listed as terminated and almost 900 as remaining active. These awards total more than $36.0 billion in un-obligated funding, including $27.7 billion in terminated awards and $8.3 billion for awards remaining active. While it is unknown whether this will be the final list, it provided the first official indication of the administration’s plans for the U.S. foreign assistance portfolio, including for global health activities. A recent KFF analysis examined some of the questions raised by the list. This analysis provides an assessment of the number of active and terminated global health project awards (detailed methods are provided below).

Findings

Global health awards account for 12% of all awards on the list but the majority (53%) of all unobligated funding. Of the more than 6,200 awards on the list, 770 (12%) are identifiable as global health awards. These awards represent an estimated $19.1 billion in unobligated funding (defined by the administration as the difference between the total award value1  and the amount already obligated), or 53% of all unobligated funding.

80% of global health awards are listed as terminated, totaling $12.7 billion in unobligated funding. Of the 770 global health awards identified, 615 (80%) are listed as terminated, slightly below the share of all awards terminated (86%). These terminated awards include support for polio vaccination programs, activities aimed at improving maternal and child health (MCH), efforts to strengthen infectious disease detection systems around the world, HIV treatment projects, family planning support, and more. Collectively, terminated health awards total $12.7 billion in unobligated funding, or 67% of unobligated funding for global health ($19.1 billion). The remaining 155 global health awards remain active, totaling $6.3 billion, or 33%, of the global health unobligated funding total.

Many global health awards are multi-sectoral, spanning more than one global health area, with HIV/AIDS accounting for the greatest number. Of the 770 awards identified, 289 specify activities that address more than one of the six main global health sub-sectors, which include: HIV/AIDS; tuberculosis (TB); malaria; maternal and child health (MCH); family planning/reproductive health (FPRH); and nutrition. Awards that included HIV/AIDS activities accounted for the greatest number (379), followed by MCH (266), and FP/RH (233) (see Figure 1).

Total Number of Global Health Awards, by Sub-sector

By sub-sector activity, the share of awards terminated range between 71% for HIV and 86% for MCH and nutrition. Most of the awards for each sub-sector activity were terminated. MCH and nutrition had the largest share of terminated awards (86% for both sub-sectors), followed by FPRH (85%), malaria (80%), tuberculosis (79%), and HIV (71%) (see Figure 2).

Terminated share of Global Health Awards, by Sub-sector

Methodology

To assess which awards on the deduplicated USAID list were health-related, we first attempted to match award IDs for all awards on the list (6,232) with activity project numbers in https://www.foreignassistance.gov/, the US government’s database of all foreign assistance funding. This database includes the U.S. government sector area for awards (e.g., health, education, agriculture, etc.) and sub-sectors within each of these (e.g., HIV, TB, malaria), allowing for official coding of the data for any matched award. Of the total, 3,129 awards matched. For the 3,103 that did not match, we first excluded any award on the list issued by USAID’s Bureau for Humanitarian Assistance (BHA) and Bureau for Democracy, Conflict and Humanitarian Assistance (DCHA), which are considered humanitarian assistance awards but not health assistance, leaving awards issued by all other offices, including the Bureau for Global Health (GH), and individual USAID missions. Of these, we reviewed their award text descriptions to determine whether the award included identifiable health activities and if there was information to further identify the sub-sector activities of the award, including HIV, tuberculosis (TB), malaria, maternal and child health (MCH), nutrition, and family planning and reproductive health (FPRH). An award that included HIV/TB activities was coded as HIV. We did not include awards for water, sanitation, and hygiene (WASH) as health because these awards can include infrastructure projects, water management programs, and other activities that are not included under U.S. global health programs.2  Where an award description included activities in more than one sub-sector (either in https://www.foreignassistance.gov/ or in our hand-coding), all of these sub-sectors were counted, resulting in a larger number of award activities by health sub-sector than the total number of health awards. Our approach likely understates the total number of global health awards (and associated funding amount) due to the limited nature of the information included in the description for many awards that did not match with https://www.foreignassistance.gov/ data. For example, there were many awards for ocean freight contracts that did not indicate what was being shipped, which could have included items for global health programs, as well as many awards listing individual consultant names or construction projects, some of which also could be related to health. Our analysis of health sub-sectors also is limited in that it is possible that for those spanning more than one sector, only part of the award was kept active (or terminated), and our approach would include all sub-sectors. Lastly, if an award was listed twice, each with the same status (both were listed as either active or terminated), one of the duplicated lines was removed (one instance for global health); if an award was listed twice, each with a different status (one active and one terminated), both were removed from the list (one instance for global health).

  1. It is not clear how the total award value was calculated. In some cases, the award value seems to capture anticipated appropriations by Congress for future fiscal years, and therefore may overstate the value of the award as well as the unobligated balance. ↩︎
  2. The Trump administration has indicated it will not be providing any funding for bilateral FP/RH activities or for the United Nations Population Fund (UNFPA). ↩︎

How has the Burden of Chronic Diseases in the U.S. and Peer Nations Changed Over Time?

Authors: Imani Telesford, Matt McGough, Delaney Tevis, Lynne Cotter, and Cynthia Cox
Published: Apr 16, 2025

Chronic, non-communicable diseases are the leading cause of death worldwide and make up 8 of the 10 top causes of death in the U.S. Across several chronic diseases, the U.S. has a higher burden of illness than peer nations. The reasons why are complex and include differences in how health care is managed, poverty, diet and exercise, and more.

This chart collection compares rates of chronic diseases, such as obesity, hypertension, diabetes, asthma, kidney disease, depression, chronic obstructive pulmonary disease (COPD), and cancer in the U.S. to other countries of similar size and wealth, including Australia, Austria, Belgium, Canada, France, Germany, Japan, the Netherlands, Sweden, Switzerland, and the U.K.

The analysis is available through the Peterson-KFF Health System Tracker, an information hub dedicated to monitoring and assessing the performance of the U.S. health system.

The Effect of Delaying the Selection of Small Molecule Drugs for Medicare Drug Price Negotiation

Published: Apr 16, 2025

President Trump has just signed an executive order outlining several proposals related to prescription drug prices, including efforts to “improve upon” the Inflation Reduction Act, a law signed by President Biden in 2022 with several provisions to lower prescription drug costs for people with Medicare and reduce drug spending by the federal government. In the new executive order, the Secretary of HHS is directed to work with Congress to implement a change in the Medicare Drug Price Negotiation Program to delay negotiation of so-called “small molecule” drugs beyond 7 years after FDA approval under current law. This change would mean that small molecule drugs would be on the market longer before they are eligible to be selected for Medicare drug price negotiation, which could lead to higher Medicare prescription drug spending, higher prices, and potentially higher Medicare Part D premiums.

Under current law, high-spending drugs can be selected for negotiation if they are brand-name drugs or biological products without generic or biosimilar equivalents, and at least 7 years (for small molecule drugs) or 11 years (for biologics) past their FDA approval or licensure date when the list of drugs selected for negotiation is published by the Centers for Medicare & Medicaid Services (CMS). This translates into 9 years for small molecule drugs or 13 years for biologics following FDA approval when Medicare’s negotiated prices take effect. Consistent with the new Trump administration executive order, some members of Congress have proposed legislation supported by the pharmaceutical industry to exempt small molecule drugs from selection for negotiation for an additional 4 years so that both types of drugs would be on the market for 11 years prior to being eligible for selection and for 13 years prior to Medicare’s negotiated prices taking effect.

Compared to biologics, small molecule drugs, which often take the form of pills or tablets, are typically cheaper and easier to manufacturer, easier for patients to take, and less expensive on average. Consequently, the shorter timeframe for selection of small molecule drugs has been characterized by its critics as a so-called “pill penalty,” with the pharmaceutical industry claiming that making small molecule drugs eligible for negotiation sooner than biologics will discourage investment in these drugs. However, changing the law to further delay the selection of small molecule drugs for Medicare price negotiation would come at a cost to Medicare and beneficiaries by giving drug companies 4 additional years of setting their own prices on these drugs prior to being eligible for negotiation by the federal government, unless combined with other changes to prevent higher spending.

If Medicare was not allowed to negotiate prices for small molecule drugs until 11 years after FDA approval, rather than 7 years, more than half of the Part D drugs that were selected for price negotiation in the first or second rounds – 13 out of 25 – would not have been eligible at the time drugs were selected. During the first round of negotiation (for negotiated prices taking effect in 2026), 5 of the 10 selected Part D drugs would not have been eligible for negotiations, based on the number of years since they were approved by the FDA. For the second round of negotiation (for negotiated prices taking effect in 2027), 8 of the 15 drugs would not have been selected (Figure 1, ‘Selected drugs’ tab and Table 1).

A 4-year delay in selecting small molecule drugs for price negotiation would have exempted several drugs with high total gross Medicare Part D spending in the first and second rounds of negotiation. For example, Eliquis and Jardiance, 2 of the top 3 drugs based on total gross Medicare Part D spending selected in the first round, would have been ineligible that year based on their FDA approval dates. Similarly, 2 of the top 3 drugs selected in the second round, Ozempic/Rybelsus/Wegovy (semaglutide) and Trelegy Ellipta, would have been ineligible for selection based on their approval dates. (Despite having an injectable form like many biologics, Ozempic has a molecular structure that enables it to be regulated and approved under the same pathway as small molecule drugs.)

To illustrate the implications of this potential change, under current law, small molecule drugs qualified for selection in round two of negotiation if they were approved by the FDA at least 7 years before the February 1, 2025 publication date of the list of selected drugs, or February 1, 2018, which translates to 9 years before the round two negotiated prices take effect in 2027. Ozempic was approved on December 15, 2017, which is more than 7 years before February 1, 2025, and was eligible for selection in round two under current law. However, if selection of small molecule drugs had been delayed an additional 4 years, as has been proposed, Ozempic would have been ineligible for selection. By extending the period from 7 years to 11 years after FDA approval before small molecule drugs can be selected for negotiation, Ozempic would not be eligible for negotiation until after December 5, 2028, and would have 13 years following FDA approval before Medicare’s negotiated price took effect.

If Medicare Was Unable to Negotiate Prices for Small Molecule Drugs Until 13 Years After FDA Approval, Rather Than 9 Years, More Than Half of the Previously Selected Drugs, With Total Gross Part D Spending of $61 Billion, Would Not Have Qualified

The 13 drugs that would have been ineligible to be selected for negotiations during the first and second rounds under a 4-year delay for small molecule drugs accounted for two-thirds of total gross Medicare Part D spending on the 25 selected drugs, or $61 billion out of $91 billion. The 5 small molecule drugs that would have been ineligible for selection during the first round of negotiations account for $32.4 billion (64%) of the $50.5 billion total gross Part D spending on all 10 selected drugs. This is based on spending between June 2022 and May 2023, the period used to determine gross Part D spending to select drugs for the first round of price negotiation (Figure 1, ‘Spending’ tab).

The 8 drugs that would have been ineligible for selection in the second round account for $28.7 billion (71%) of the $40.7 billion in total gross Part D spending on all 15 selected drugs. This is based on spending between November 2023 and October 2024, the period used to determine gross Part D spending to select drugs for the second round of price negotiations.

If small molecule drugs had been subject to an additional 4-year delay from their FDA approval date prior to being eligible for selection in the first two rounds of Medicare drug price negotiation, Medicare would have had to select several other drugs with lower total gross Part D spending in order to round out the list of selected drugs in each year. This suggests that enacting this change in law could increase Medicare spending relative to current law due to lower savings associated with drug price negotiation, with potentially higher drug prices and premiums for Part D enrollees. While the Trump administration’s executive order suggests that other reforms could be implemented to prevent an increase in overall costs to Medicare and beneficiaries associated with this policy change, it did not specify the details of those changes.

Of the 25 Medicare Part D Drugs Selected for Price Negotiation for 2026 and 2027, 13 Drugs Would Have Been Ineligible If Negotiated Prices Were Unavailable for Small Molecule Drugs Until 13 Years After FDA Approval, Rather Than 9 Years

This work was supported in part by Arnold Ventures. KFF maintains full editorial control over all of its policy analysis, polling, and journalism activities.

How States Verify Citizenship and Immigration Status in Medicaid

Published: Apr 16, 2025

Note: This brief was updated on April 17, 2025 to clarify the groups that are exempt from the five-year waiting period in Medicaid and CHIP.

Medicaid is the primary program providing comprehensive coverage of health and long-term care to 83 million low-income people in the U.S. Medicaid is jointly financed by states and the federal government but administered by states within broad federal rules. In addition to meeting federal and state income and residency requirements, eligibility for coverage under Medicaid and the Children’s Health Insurance Program (CHIP) is limited to U.S. citizens and certain lawfully present immigrants. Federal Medicaid funds cannot be used to cover undocumented immigrants. Undocumented immigrants also are excluded from other federally-funded health programs, including Medicare and the Affordable Care Act Marketplaces.

On February 19, 2025, the Trump administration issued an executive order to “end taxpayer subsidization of open borders”, which includes language calling for enhanced verification systems to ensure taxpayer-funded benefits exclude unauthorized immigrants and requires federal agencies to identify sources of federal funding for undocumented immigrants. Current federal rules require states to verify an eligible immigration status through the Department of Homeland Security (DHS) as part of the process for determining Medicaid eligibility. Despite these requirements, Republicans in Congress have submitted legislation to prohibit state Medicaid programs from covering undocumented immigrants. Public confusion about immigrants’ eligibility for federal programs also persists, with slightly less than half of adults either unsure or incorrectly believing undocumented immigrants are eligible for health insurance programs paid for the federal government. This brief describes federal citizenship and immigration status eligibility and eligibility verification requirements for Medicaid.

What are Medicaid eligibility requirements for immigrants?

Federal rules limit Medicaid and Children’s Health Insurance Program (CHIP) eligibility to U.S. citizens and certain lawfully present immigrants; undocumented immigrants are not eligible for federally-funded coverage. In general, in addition to meeting other eligibility requirements, lawfully present immigrants must have a “qualified non-citizen” status to be eligible for Medicaid or CHIP (Table 1), and many, including most lawful permanent residents or “green card” holders, must wait five years after obtaining qualified status before they may enroll. These immigrants may enroll in Marketplace coverage and receive subsidies during this five-year waiting period. Some immigrants with qualified status, such as asylees and refugees, do not have to wait five years to enroll in Medicaid and CHIP coverage. Some immigrants, such as those with temporary protected status, are lawfully present but do not have a qualified status and are not eligible for Medicaid and CHIP coverage even after a five-year wait. Individuals with Deferred Action for Childhood Arrivals (DACA) status are not eligible for Medicaid or CHIP, and implementation of a Marketplace coverage expansion for them remains subject to ongoing litigation. States have the option to cover lawfully residing children and pregnant people in Medicaid or CHIP without the five-year waiting period otherwise known as the Immigrant Children’s Health Improvement Act (ICHIA) option. States can also provide prenatal care and pregnancy related benefits to targeted low-income children beginning at conception through the CHIP From-Conception-to-End-of-Pregnancy (FCEP) option regardless of their parent’s citizenship or immigration status. Some states provide fully state-funded coverage to fill gaps in coverage for immigrants, including lawfully-present immigrants and undocumented immigrants.

Immigration Status and Eligibility for Medicaid/CHIP

Emergency Medicaid reimburses hospitals for emergency care provided to individuals ineligible for Medicaid due to their immigration status. Emergency Medicaid spending reimburses hospitals for emergency care they are obligated to provide to individuals who meet other Medicaid eligibility requirements (such as income) but do not have an eligible immigration status, including undocumented immigrants and lawfully present immigrants who remain ineligible for Medicaid or CHIP. Emergency services include those requiring immediate attention to prevent death, serious harm or disability, although states have some discretion to determine reimbursable services. Spending on Emergency Medicaid accounts for less than 1% of total Medicaid expenditures. Without Emergency Medicaid, the costs of emergency care would be shifted to hospitals that are required to treat individuals in emergency situations or fully to states.

How do states verify citizenship and immigration status to determine Medicaid eligibility?

States must verify citizenship and immigration status with the Social Security Administration (SSA) and DHS to determine eligibility for Medicaid coverage at the initial application. Applicants who are U.S. citizens must provide documentation of citizenship, or states must verify the applicant’s Social Security number with the SSA. Applicants who are not U.S. citizens must provide documentation showing that they have a qualified immigration status eligible for Medicaid coverage (Figure 1). States verify immigration status through the DHS Systematic Alien Verification for Entitlements (SAVE) system, which can provide automatic real-time verification. If the system cannot provide real-time verification, DHS employees conduct an additional review and request documentation of eligible immigration status. Applicants cannot self-attest to having an eligible immigration status without documentation for the state, with the exception of qualified immigrants exempt from the five-year wait due to a military connection. Current federal rules prohibit states from requiring applicants to disclose the immigration status of non-applicants, such as household members, which is not relevant to eligibility determination, and the SAVE system cannot be used for non-criminal immigration enforcement.

States are required to provide Medicaid benefits to applicants during a “reasonable opportunity period” of 90 days while their immigration status is being verified, if they otherwise meet all eligibility criteria. The reasonable opportunity period is allowed when the SAVE system cannot verify immigration status in real-time and the state needs to conduct additional review and collect additional documentation to verify the qualified immigration status. This period gives applicants the opportunity to correct information in SAVE or submit additional documentation in support of their application. States may extend the period if they need more time to complete verification or if applicants are attempting to correct issues with documentation. States are entitled to receive federal matching funds for expenditures for Medicaid services provided to individuals during the reasonable opportunity period, regardless of whether eligibility ultimately is verified. If states determine an applicant ineligible for Medicaid coverage due to their immigration status at any point during the reasonable opportunity period, they must terminate eligibility within 30 days. This may also occur if applicants do not provide additional requested documentation or correct any discrepancies in the application. Applicants have the right to dispute the state’s decision in a fair hearing process, but states are not required to provide Medicaid benefits during this time.

In some cases, states need to reverify immigration status as part of Medicaid annual redetermination of eligibility processes. States do not need to re-verify immigration status for most enrollees during the annual renewal if that status is unlikely to change (e.g., the enrollee is a lawful permanent resident). However, immigrant children and pregnant people who have been lawfully residing in the U.S. for less than five years receiving coverage through the ICHIA option must have their immigration status re-verified at renewal. If, at any point during the coverage period, the state receives information about a change in an enrollee’s immigration status that might affect ongoing eligibility, the state is required to act on that change in circumstance to review eligibility and request additional documentation from the enrollee if needed.

The Impact of Medicaid and Title X on Planned Parenthood

Published: Apr 16, 2025

This data note was updated on April 30, 2025 to correct the number of sites participating in Title X and affected by the Title X funding freeze.

Medicaid and Title X, the federally funded family planning program, reimburse or fund Planned Parenthood clinics to provide contraceptive care, STI testing, pregnancy testing, and gynecological services to low-income and uninsured individuals. Over the past decade, policy makers who oppose abortion have attempted to block Planned Parenthood sites from obtaining state or federal funds largely due to their provision of abortion services. However, federal Medicaid dollars can only be used to pay for abortions under Hyde exceptions: rape, incest, and life endangerment and the Title X statute specifies that no federal funds appropriated under the program “shall be used in programs where abortion is a method of family planning.” A loss of Medicaid and Title X funding will likely mean that affected Planned Parenthood clinics will have fewer resources to serve low-income clients, could have longer wait times for those who seek care, and low-income patients could face limits to contraceptive access and STI screening. Ultimately, some of the clinics may be forced to close with impacts in many communities across the county.

Planned Parenthood and Medicaid

The Supreme Court of the United States is currently considering a case, Medina v. Planned Parenthood South Atlantic, that could ultimately have implications on whether states can disqualify Planned Parenthood clinics from their network of Medicaid participating providers. This would directly impact Medicaid beneficiaries who rely on Planned Parenthood for a broad range of sexual and reproductive health services. Based on claims from the 2021 Transformed Medicaid Statistical Information System (T-MSIS) data, one in ten (11%) reproductive age women covered by Medicaid who received family planning services got their care at a Planned Parenthood clinic (Figure 1). All state Medicaid programs are required to cover family planning services, which include contraception, STI services, Pap smears, and pelvic and breast exams free of cost-sharing to all their beneficiaries. The share of Medicaid beneficiaries using family planning services who rely on Planned Parenthood ranges from three in ten women with Medicaid in California (29%), to no women in in North Dakota and Wyoming where Planned Parenthood does not have a presence. Texas officially excluded Planned Parenthood from the state’s Medicaid program on March 10, 2021, so a limited number of claims were identified.

Planned Parenthood Clinics Provide Family Planning Services to Medicaid Beneficiaries in Almost All States

While Planned Parenthood clinics have been targeted because many provide abortion services, the majority of people go to Planned Parenthood clinics for contraceptive services, STI testing, pregnancy testing, and gynecological services. Nearly nine in ten female Medicaid beneficiaries ages 15 to 49 who got family planning care at a Planned Parenthood clinic in 2021 received contraceptive services and over half received STI services (Figure 2). Nearly half also got gynecological services like a Pap smear, HPV screening, or a pregnancy test.

The Majority of Medicaid Beneficiaries Who Received Family Planning Services at a Planned Parenthood Clinic Received Contraceptive and STI Services

Planned Parenthood and Title X

The Title X program supports a network of approximately 4,000 clinics across the country to offer free or reduced cost family planning services to low-income and uninsured people. Nationally, 297 Planned Parenthood clinics in 34 states and DC, over half (54%) of Planned Parenthood clinics nationwide, participate in the Title X program (Figure 3). Planned Parenthood grantees applied for and qualified to receive a total of $20.6 million to provide services to low-income and uninsured women and men, accounting for 8% of the total $261 million awarded nationally for Title X funding. Other Title X grantees also include Planned Parenthood sites in their network of clinics.

Figure 3

The same week oral arguments were heard for Medina v. Planned Parenthood South Atlantic, the US Department of Health and Human Services (HHS) announced that they were withholding Title X awards from 16 of the 86 Title X grantees across the country, which include all of the Planned Parenthood grantees. Additionally, the funding freeze impacted other organizations that include Planned Parenthood sites in their networks of clinics. While the funding freezes do not impact all Planned Parenthood clinics, overall, 144 Planned Parenthood clinics in 20 states are directly affected by the freeze. Title X grantees that were not affected by the funding freeze received partial FY2025 awards.

Figure 4

Methods

Data: This analysis used the 2021 Release 1 T-MSIS Research Identifiable Files, specifically the other services (OT) claims files merged with the demographic-eligibility (DE) files, limiting to females ages 15 to 49.

Identifying Planned Parenthood Providers: To identify family planning services provided at a Planned Parenthood clinic the NPPES NPI Registry was used to search for Planned Parenthood and PPFA in the Organization Name field to create a list of Planned Parenthood organization NPIs.

Identifying Family Planning Services: Diagnosis and procedure codes in the other services header and line claims files were used to identify the following family planning services: contraceptive services, STI services, gynecological services including Pap smear and HPV testing, as well as pregnancy testing. A family planning diagnosis was required for inclusion. A list of diagnosis and procedure codes is available upon request.

State exclusion criteria: GA, IL, and MS were excluded due to data quality concerns. These states had unusable data in the following categories according to the DQATLAS: GA’s Billing Provider NPI data and MS’s Service Users – OT. There were no Planned Parenthood providers identified in IL despite their extensive network of Planned Parenthood clinics, which leads us to believe there is an issue with the Billing Provider NPI.

10 Things to Know About Rural Hospitals

Published: Apr 16, 2025

The financial health of rural hospitals has been an ongoing concern for some policymakers. More recently, these concerns have been amplified in the context of the concurrent budget resolution that passed the House and Senate in April 2025, with instructions for the House to reduce federal Medicaid spending by up to $880 billion or more over the next decade. The financial challenges of rural and other financially vulnerable hospitals have also been raised in the context of proposals to achieve Medicare savings through site-neutral payment reforms, which would align Medicare payment rates for a given outpatient service across different sites of care. Strains on hospital finances could have implications for both access to care as well as local economies, including in rural areas. Hospitals are the sixth largest employer nationally when comparing industry subsectors. As policymakers consider reductions in Medicaid and Medicare spending, some are considering options to support rural and safety-net hospitals.

In light of these policy discussions, this brief presents ten things to know about rural hospitals, using data from Medicare cost reports, the American Hospital Association (AHA) Survey Database, and other sources (see Methods for more details). Rural hospitals are defined as those in nonmetropolitan areas (and urban hospitals as those in metropolitan areas), in line with a definition used by the Medicare Payment and Advisory Commission (MedPAC), though there are several ways of defining “rural” (see Methods). The federal government also includes nonmetropolitan in its definition of “rural” for certain Medicare rural payment designations. Rural areas are further broken out in this brief into those that are adjacent to metropolitan areas and those that are not. Rural counties that are not adjacent to metropolitan areas are referred to as the “most rural” areas. The analyses focus on community hospitals or non-federal general short-term hospitals that comprise the majority of all hospitals, unless stated otherwise. (See Methods for additional information about the definition of rural and the analytic sample.)

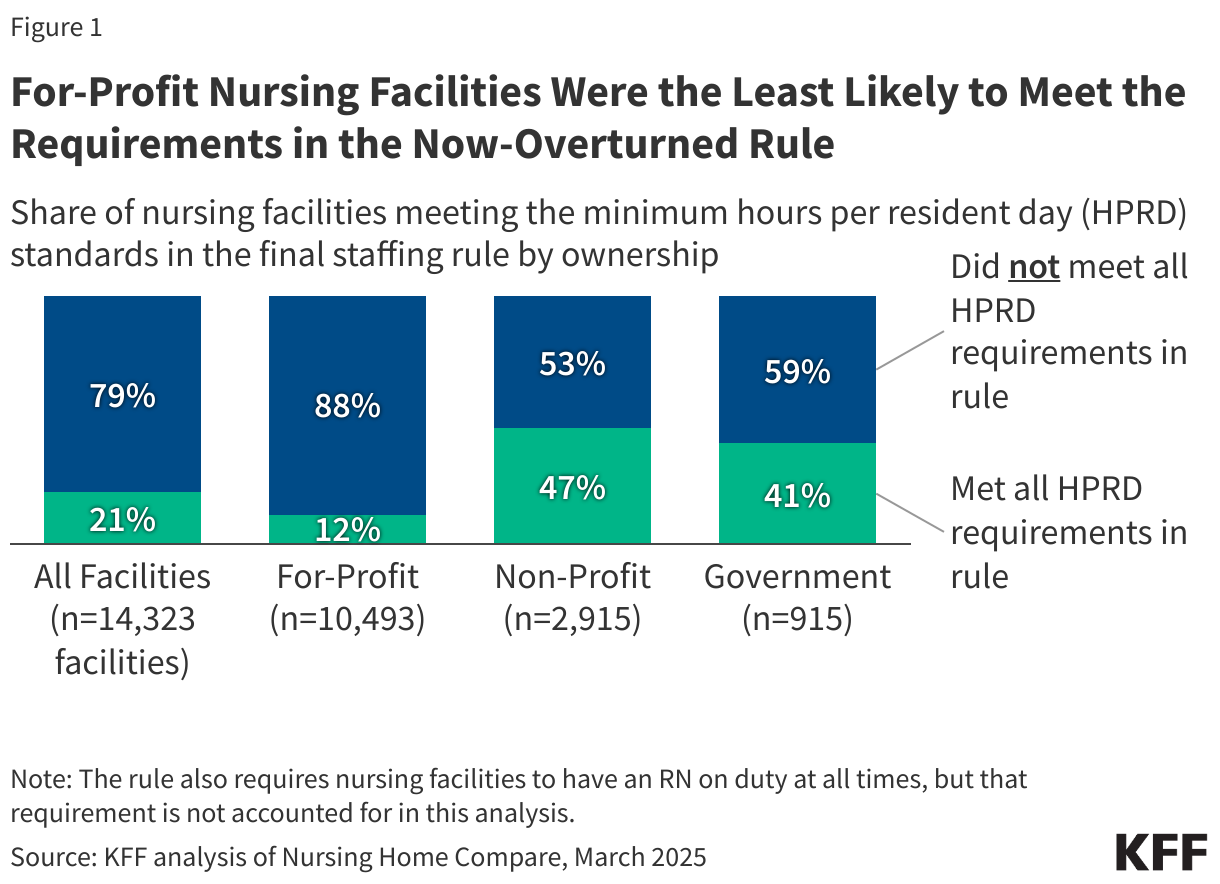
Although rural hospitals more frequently have negative operating margins than urban hospitals, more than half had positive operating margins in 2023 (the most recent year of data available), and nearly one fifth (19%) had margins of at least 10%. Rural hospitals in states that have not adopted the Affordable Care Act (ACA) Medicaid expansion were more likely to have negative margins than rural hospitals in expansion states. Among rural hospitals, negative margins were more common among those in the most rural areas, while positive margins were more common among those that had more beds, higher occupancy, were affiliated with a health system, and were not government-owned in 2023.

1. Rural hospitals account for about one third of all community hospitals nationwide and at least a third of all hospitals in most states

About one third (35%) of all community hospitals were in rural areas in 2023 (Figure 1), or 1,796 rural community hospitals. Rural hospitals accounted for only 8% of all discharges nationwide, in part because they tend to be smaller and serve less densely populated areas, contributing to lower volumes than urban hospitals. Forty-six million people lived in rural areas in 2023 as it is defined in this issue brief, most of whom (88%) resided in a county with a hospital.

Rural hospitals operate in nearly every state (48) and account for at least a third of hospitals in most (31) states. In 17 states, rural hospitals accounted for at least half of all hospitals, including states in the Northwest, South, Midwest, and West. Rural hospitals accounted for at least 70% of hospitals in seven states, five of which border each other in the Great Plains: Montana, Nebraska, South Dakota, North Dakota, and Wyoming.

Over two fifths (44%) of rural hospitals were in areas that are not adjacent to metropolitan areas. These hospitals represented 3% of all hospital discharges and operated in 43 states. Fifteen million people lived in rural areas not adjacent to a metro area in 2023 compared to 31 million in rural adjacent areas.

Rural hospitals provide varying types of inpatient and outpatient services. For example, about half of rural hospitals provide obstetrics care (53%), intensive medical and surgical care (50%), and care through a certified trauma center (52%). In 2023, Medicare began to offer a new rural emergency hospital (REH) designation, which provides support to hospitals that operate 24/7 emergency departments but do not provide inpatient care, recognizing that some regions cannot support a broader suite of services.

Rural hospitals tend to have fewer beds, are less likely to be part of a broader health system, are less likely to have for-profit ownership, and are more likely to be government-owned than urban hospitals according to prior KFF analysis, and they are also more likely to have low inpatient occupancy rates. For example, as might be expected, a larger share of rural hospitals (50%) than urban hospitals (14%) have 25 or fewer beds. One third of rural hospitals are owned by a state or local government versus 10% of urban hospitals. About half of all rural hospitals are part of a broader health system, as compared to more than three quarters of all urban hospitals (52% versus 78%). Consolidation may allow providers to operate more efficiently and help struggling providers keep their doors open in underserved areas, but it could also reduce competition—which may lead to higher prices and lower quality—and make hospitals less responsive to their local communities.

Rural Hospitals Account for 35% of All Community Hospitals Nationwide and at Least a Third of All Hospitals in Most States

2. Medicare covered a larger share of hospital discharges in rural than urban areas in 2023, while private insurance covered a smaller share and Medicaid covered a similar share

Medicare covered a larger share of discharges in rural versus urban areas (53% versus 45%) while Medicaid covered a similar share (19% versus 21%) and private insurance (not including Medicare and Medicaid plans) covered a smaller share (19% versus 24%). Private insurers generally reimburse at higher rates than Medicare and Medicaid.

With Medicaid covering about one fifth of discharges in rural areas, any substantial reduction in Medicaid spending could have a large impact on rural hospital finances, particularly given the lower margins of rural hospitals. In addition to providing primary coverage for many patients, Medicaid also provides secondary coverage for many beneficiaries who are dually enrolled in Medicare.

Medicare Covered a Larger Share of Hospital Discharges in Rural Than Urban Areas in 2023, While Private Insurance Covered a Smaller Share and Medicaid Covered a Similar Share

3. Medicaid covered nearly half of all births in rural areas, the vast majority of which were in hospitals, in 2023

Medicaid covered 1.5 million births in 2023—representing 41% of all U.S. births—and financed nearly half (47%) of births in rural areas (Figure 3). Births are the most common reason for a hospital inpatient stay. The vast majority (96%) of births in rural areas occurred in a hospital in 2023 according to KFF analysis of CDC data.

Decreases in Medicaid spending could accelerate the closure of obstetrics service lines in rural hospitals, in addition to affecting the availability of services at rural hospitals more generally. From 2010 to 2022, 238 rural hospitals closed obstetrics units while only 26 hospitals opened new units. Low Medicaid reimbursement rates and difficulty recruiting and retaining providers were cited as the biggest challenges to providing obstetrics care in rural areas, according to the Government Accountability Office.

Medicaid Covered Nearly Half of All Births in Rural Areas, the Vast Majority of Which Were in Hospitals, in 2023

4. A larger share of rural than urban hospitals had negative margins in 2023, though more than half of all rural hospitals had positive margins

Despite the government support that most rural hospitals receive, a larger share of rural hospitals had negative operating margins than did urban hospitals in 2023 (44% versus 35%) (Figure 4). A larger share of rural hospitals in areas that were not adjacent to a metropolitan area (i.e., that were in the most rural areas) had negative margins than did rural hospitals in areas adjacent to a metropolitan area (49% versus 40%). Operating margins reflect profit margins earned on patient care and other operating activities, rather than profits earned on other sources, such as investments.

At the same time, more than half (56%) of all rural hospitals had positive operating margins. Further, while about one sixth (15%) of all rural hospitals had margins less than -10%, about one fifth (19%) had margins greater than 10% (data not shown). In other words, financial conditions as measured by operating margins varied substantially across rural hospitals.

Rural hospitals may face financial and operational challenges for a number of reasons. For example, rural hospitals tend to have low patient volumes, stemming from low and declining populations in rural areas and rural patients bypassing local hospitals for treatment at urban facilities. Low patient volumes may lead to higher costs on average—e.g., to the extent that the fixed costs of operating a hospital, such as building upkeep and maintaining a minimum number of administrative and clinical staff, are spread across fewer patients—and limit the ability of rural hospitals to offer specialized services. Many rural areas also have a particularly hard time attracting and retaining health care workers.  Both urban and rural hospitals have encountered financial challenges since the start of the COVID-19 pandemic, including rising labor and supply costs, although there are signs that hospital finances have been recovering.

A Larger Share of Rural Than Urban Hospitals Had Negative Margins in 2023, Though More Than Half of All Rural Hospitals Had Positive Margins

5. Among rural hospitals, positive margins were more common among those that had more beds, higher occupancy, were affiliated with a health system, and were not government-owned in 2023.

Large, high occupancy, system-affiliated, and non-government rural hospitals were more likely than other rural hospitals to have positive margins. While 56% of rural hospitals overall had positive margins, the share was larger among hospitals with at least 200 beds (73%), with occupancy rates of at least 75% (70%), and that were affiliated with a broader system (63%). For-profit and nonprofit rural hospitals also more frequently had positive margins (62% and 61% respectively) than rural hospitals overall.

While 44% of rural hospitals overall had negative margins, about half of rural hospitals that had 26-99 beds (52%) and were not affiliated with a broader health system (51%) had negative margins. The likelihood of having negative margins tended to decrease with lower occupancy rates and fewer beds, except that hospitals with 25 or fewer beds were less likely to have negative margins than average. That may reflect the fact that this group mostly includes critical access hospitals, which receive additional government support.

More than half of non-federal, government-owned hospitals (54%)—which make up a third of rural community hospitals—had negative margins. Most government-owned hospitals in rural areas included in this analysis are operated by a county or hospital district.

Among Rural Hospitals, Positive Margins Were More Common Among Those That Had More Beds, Higher Occupancy, Were Affiliated With a Health System, and Were Not Government-Owned in 2023

6. The ACA Medicaid expansion has helped improve hospital finances, and may especially benefit rural hospitals

State Medicaid expansion under the Affordable Care Act has had financial benefits for hospitals according to several studies. The financial impact of Medicaid expansion for at least certain measures may be most evident among rural hospitals, small hospitals, and hospitals that see a higher proportion of low-income patients, based on some of this research.

Half (50%) of rural hospitals in states that had not adopted the ACA Medicaid expansion as of the beginning of 2023 had negative margins in that year, compared to four tenths (41%) of rural hospitals in expansion states. Differences were larger among hospitals in the most rural areas (i.e. in rural areas not adjacent to metropolitan areas). In those regions, about six tenths (59%) of hospitals in non-expansion states had negative margins compared to less than half (45%) of rural hospitals in expansion states. Differences between expansion and non-expansion states could reflect the effects of expansion on hospital finances but could also reflect a variety of unique state circumstances, such as demographics, hospital ownership and cost structure, commercial reimbursement rates, and state and local health and tax policy.

Rural Hospitals Were More Likely to Have Negative Margins in 2023 in States That Had Not Expanded Medicaid

About two thirds (69%) of the rural hospital closures from 2014 to 2024 occurred in states that had not expanded Medicaid at the time according to KFF analysis of data from the UNC Sheps Center. (The Sheps Center has a broader definition of “rural” than used in this brief, such as by including critical access hospitals in metropolitan areas).

7. Hospital closures outpaced openings in rural areas from 2017 to 2024, and many rural hospitals have dropped specific service lines over time.

From 2017 to 2024, 62 rural hospitals closed compared to 10 that opened, a net reduction of 52 hospitals. (Closures refer to hospitals that eliminate inpatient services—aside from those that convert to rural emergency hospitals—or cease operations altogether). Over the longer twenty-year period from 2005 to 2024, 193 rural hospitals closed according to the UNC Sheps Center (which uses a broader definition of “rural” than this brief). The small number of studies that have evaluated the association between consolidation with rural hospital closures and service eliminations have had mixed results.

Aside from closing altogether, rural hospitals have also dropped certain service lines over time. For instance, according to one analysis, the share of rural hospitals offering obstetrics care dropped from 57% in 2010 to 48% in 2022. The share among urban hospitals also dropped over that period (from 70% to 64%) but remained higher than in rural areas in 2022 (64% versus 48%). Government relief funds may have helped some rural hospitals stay open and maintain certain service lines during the COVID-19 pandemic. The new REH hospital designation in 2023 may have helped prevent some rural hospitals from closing according to MedPAC.

Rural hospital closures often raise concerns about access to care and the local economy. When a rural hospital closes, patients may have to travel further to obtain services, which could lead some to forgo care altogether. Closures may be especially problematic for people who have difficulty traveling long distances and for people with time-sensitive conditions, such as heart attacks and childbirth. Research suggests that rural hospital closures lead to increased unemployment (including among non-healthcare industries), lower income levels, and slower economic growth.

While there has been interest among some policymakers in sustaining rural hospitals, doing so may be difficult in certain scenarios—such as in areas with shrinking populations—and could involve tradeoffs. For instance, although rural hospitals can help the local population access care, it is also possible that some of the services they offer can be provided at a lower cost through telehealth or freestanding rural outpatient clinics. Further, while traveling to large regional hospitals may be burdensome for patients in some cases, it is also possible that these hospitals may offer higher quality of care in certain scenarios.

Hospital Closures Outpaced Openings in Rural Areas From 2017 to 2024

8. Medicare provides additional funding for the large majority (96%) of rural hospitals through special payment designations

Traditional Medicare includes special payment designations targeted towards rural hospitals that can increase payments through the inpatient and outpatient prospective payment systems (IPPS), by reimbursing hospitals based on their costs, or by providing monthly facility payments. The Medicare-dependent designation and an expansion of low-volume hospital adjustments are not permanent but have been renewed over time. Congress passed a continuing resolution in March 2025 that extends these policies through September 30, 2025, and proposed legislation in the Senate would make them permanent.

A hospital may only be designated as one of the following:

  • Critical access hospitals (CAHs) are rural hospitals with at most 25 beds that are a minimum distance from other facilities (with some exceptions) and meet other requirements. Medicare pays CAHs 101% of inpatient and outpatient costs (although with sequestration, it reimburses below cost). CAHs receive an estimated $3 to $4 billion in higher payments annually according to a 2022 MedPAC report. CAH is the most common designation, accounting for more than half (59%) of rural hospitals in 2023 (Figure 7).
  • Sole community hospitals (SCHs) are hospitals that are the only source of short-term, acute inpatient care in a region. Medicare reimburses some SCHs at higher rates than they would have received under IPPS, including based on historical costs. Since 2006, CMS has also increased OPPS rates for rural SCHs. SCHs receive $0.8 billion in higher payments annually (including low-volume adjustments to SCHs) according to a 2022 MedPAC report.
  • Medicare-dependent hospitals (MDHs) are small rural hospitals with high Medicare inpatient shares. Medicare pays MDHs higher rates based on historical costs if greater than IPPS rates. MDHs receive $0.1 billion in higher payments annually according to a 2022 MedPAC report.
  • Rural emergency hospitals (REHs) are rural hospitals that operate 24/7 emergency departments but do not provide inpatient care. REHs are reimbursed at 105% of standard OPPS rates and receive monthly facility payments. This designation became available in 2023, recognizing that some areas cannot support a broader suite of services. MedPAC has estimated that REHs cost an additional $30 million in 2023, much lower than original CMS projections for 2023 ($408 million), possibly because fewer hospitals converted to REHs in 2023 than originally anticipated. Nineteen hospitals converted in 2023 (most of which did so in the second half of the year) and an additional 18 converted in 2024 according to the UNC Sheps Center.

There are two additional rural designations that can be applied to a hospital, with additional benefits:

  • Low-volume hospitals (LVHs) are hospitals with few discharges that are a minimum distance from other facilities. They receive up to 25% higher payments through the IPPS. LVHs receive $0.4 billion in higher payments annually according to a 2022 MedPAC report.
  • Rural referral centers (RRCs) are hospitals that generally either treat patients from across a large region or treat complex cases. Some RRCs are eligible for higher IPPS base payments, among other benefits. Although RRCs are sometimes referred to as a rural payment designation, most (73%) are not in rural areas based on KFF analysis of cost report data. There is no recent estimate for the value of this designation.

While these special payment designations are available for hospitals discharges covered by traditional Medicare, Medicare Advantage accounts for a rising share of discharges across the nation, and is growing more rapidly in nonmetropolitan areas, which may pose additional challenges for rural hospitals. Hospitals in rural areas and elsewhere have raised concerns about the growth of Medicare Advantage, pointing to payment delays and denials and lower reimbursement than traditional Medicare. According to the American Hospital Association, Medicare Advantage reimburses rural hospitals at lower rates than traditional Medicare on average. MedPAC has noted that Medicare Advantage plans do not pay REHs monthly facilities payments (in contrast to traditional Medicare), and at least some providers have said they do not receive increased Medicare Advantage payments equivalent to the payment bumps under traditional Medicare rural payment designations. Whether or to what extent rural hospitals experience revenue declines as Medicare Advantage covers a larger share of Medicare patients is unclear.

Medicare Provides Additional Funding for the Large Majority (96%) of Rural Hospitals Through Special Payment Designations

Other federal programs or policies also provide additional support for rural hospitals. For instance, Medicare adjusts IPPS and OPPS reimbursements based on the wages hospitals pay in a given area (known as the Wage Index), which generally results in lower reimbursement for rural hospitals. However, sole community hospitals and rural referral centers can be more easily reclassified to areas that receive higher reimbursements through the Wage Index. Many state Medicaid programs also have special payment rules for hospitals in rural areas, such as by paying higher rates or based on costs or through supplemental payments. HRSA also administers several programs providing grants, technical support, workforce development, and other assistance to rural hospitals and rural providers more generally. As another example, the Center for Medicare & Medicaid Innovation (CMMI) recently concluded its test of the Pennsylvania Rural Health Model, which provided rural hospitals with an all-payer global budget and was intended to reduce costs, increase quality, and improve the sustainability of rural hospital finances.

Rural hospitals can also benefit from other programs or payment policies that are available to certain hospitals across the country. This includes higher Medicare reimbursement for Disproportionate Share Hospitals, tax-exempt status for nonprofit hospitals, and participation in the 340B Drug Pricing Program, which requires manufacturers participating in Medicaid to sell outpatient drugs to eligible nonprofit and government providers at a substantial discount, with the intent of supporting entities caring for low-income and other underserved populations. In 2023, critical access and sole community hospitals alone purchased $1.5 billion in 340B drugs.

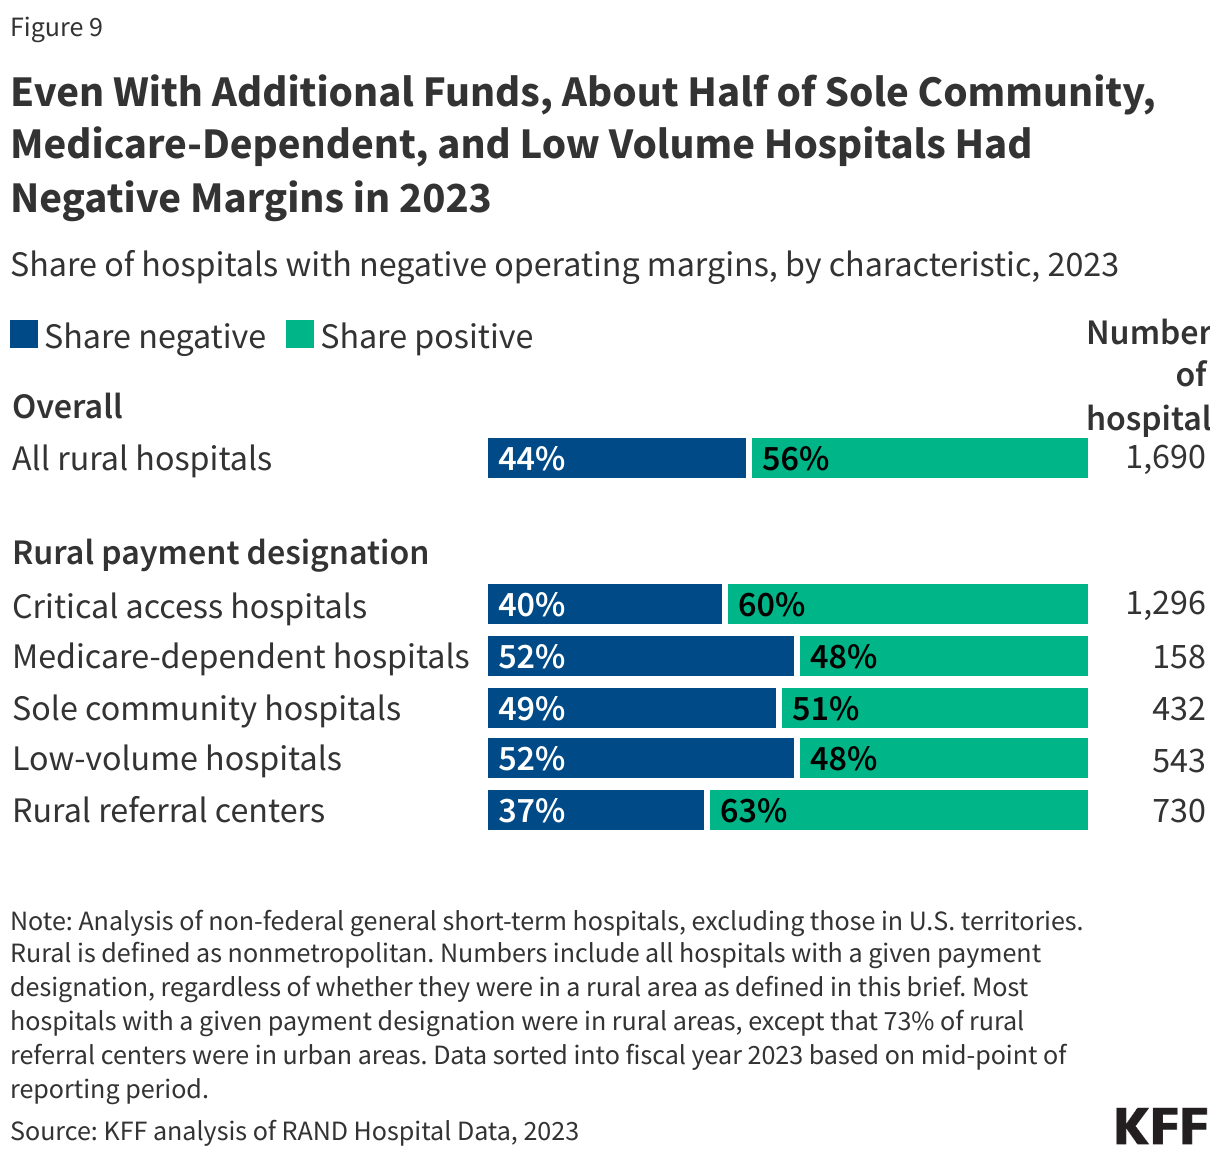
9. Even with additional funds, about half of sole community, Medicare-dependent, and low-volume hospitals had negative margins in 2023.

About half of sole community hospitals (49%), Medicare-dependent hospitals (52%), and low-volume hospitals (52%) had negative margins in 2023. As discussed below, there have been proposals to increase Medicare reimbursement for these facilities. A smaller share of critical access hospitals (40%) and rural referral centers (37%) reported negative margins in 2023 than hospitals in other designated categories, such as sole community hospitals.

Even With Additional Funds, About Half of Sole Community, Medicare-Dependent, and Low-Volume Hospitals Had Negative Margins in 2023

10. Significant reductions in federal spending on health care under consideration would have direct or indirect implications for rural hospitals

The House and Senate passed a concurrent budget resolution in April 2025 with instructions for the House Energy & Commerce Committee to reduce the federal deficit by at least $880 billion over ten years, which the Congressional Budget Office and other analysts have confirmed would require significant cuts to Medicaid. Large reductions in Medicaid would likely have significant implications for hospitals, given that hospital care accounted for about one third of Medicaid spending in 2023. Options under consideration for reducing Medicaid spending include targeting state directed payments to hospitals or restricting states’ ability to fund Medicaid through provider taxes. Because provider taxes disproportionately fund supplemental payments to hospitals, restricting them as a revenue source is likely to result in lower funding for hospitals broadly, including for rural hospitals. Also being considered among other options is reducing the federal share of funding for Medicaid expansion, which has helped improve hospital finances. The hospital industry has been lobbying Congress against proposed cuts, arguing that reductions in Medicaid spending would threaten access to care at hospitals.

Also being discussed are site-neutral payment reforms that would achieve Medicare savings by aligning Medicare payment rates for a given outpatient service across different sites of care. These reforms would reduce payments to hospitals, with the impact varying based on the extent to which a given hospital relies on Medicare outpatient revenues and other factors. MedPAC estimated that one approach applying to on- and off-campus hospital outpatient departments (HOPDs) would lead to relatively large decreases in Medicare revenues for smaller and rural hospitals. Other research has found that off-campus HOPDs—the focus of some reforms—account for a smaller share of outpatient revenues in rural versus urban areas.

Some Members of Congress have expressed concern about the impact of site-neutral payment reforms on rural hospitals, though these reforms would likely not apply to many rural hospitals. Site-neutral payment reforms would likely only apply to OPPS reimbursement and would therefore not affect critical access hospitals, which are reimbursed based on costs and account for most rural hospitals (59%; see Figure 7). CMS has excluded sole community hospitals (20% of rural hospitals) from an existing regulation that extends site-neutral payments to clinic visits at off-campus HOPDs, and it is possible that future policies may do the same. Senators Cassidy and Hassan released a framework for site-neutral reforms in November 2024 that would reinvest some of the savings by increasing reimbursement for sole community, Medicare-dependent, and low-volume hospitals, as well as for urban and suburban safety-net hospitals and certain essential services.

Members of Congress have proposed various policies to prop up rural hospitals that could also be used to soften the impact of cuts to federal spending. For example, bills introduced during the last Congress would expand support for rural emergency hospitals, allow for increased reimbursement for Medicare-dependent and sole community hospitals, and eliminate Medicare sequestration for rural hospitals. More recently, Republicans released a menu of options for reducing federal spending in February 2025, which included an offsetting measure that would expand the rural emergency hospital program. Notably, the list of options did not include new sources of funding for urban safety-net hospitals, even though some of the major options for cutting spending would likely have a disproportionate impact on these facilities, including large cuts in Medicaid spending and reductions in Medicare uncompensated care and bad debt payments.


Methods

Urban hospitals are defined as those operating in a metropolitan area, while rural hospitals are defined as those operating in nonmetropolitan areas. A metropolitan area is a county or group of counties that contains at least one urban area with a population of 50,000 or more people. Nonmetropolitan areas include micropolitan areas—which are counties or groups of counties that contain at least one urban area with a population of at least 10,000 but less than 50,000—and noncore areas (areas that are neither metropolitan nor micropolitan). The analysis further breaks down rural areas into those that are adjacent to metropolitan areas (defined as the “most rural” areas in this brief) and those that are not adjacent to metropolitan counties.

There are many different ways of defining rural areas, each of which would capture a different number of hospitals with different characteristics. The Appendix below includes examples of different definitions created by various federal agencies. This analysis defines rural as nonmetropolitan, in line with a definition used by MedPAC, and given the policy relevance of nonmetropolitan areas. The federal government defines “rural” areas as including nonmetro areas and other regions in some instances, such as when administering additional support through Medicare for critical access hospitals, Medicare-dependent hospitals, sole community hospitals, and rural emergency hospitals. Nonetheless, the definition of rural in this brief includes some areas that others would consider to be urban and excludes some areas that others would consider to be rural. For example, the Federal Office of Rural Health Policy (FORHP), which is part of HRSA, uses a broader definition of rural, noting that some large unpopulated regions, such as the Grand Canyon, are in metropolitan counties.

Data for this analysis came from the following sources:

  • American Hospital Association (AHA) Annual Survey. Data from an annual survey of all hospitals in the United States and its associated areas. Used for analyses of rural hospital prevalence, hospital discharges, hospital services, payer mix, and system membership.
  • RAND Hospital Data. A cleaned and processed version of annual cost reports that Medicare-certified hospitals are required to submit to the federal government. Used for analyses of hospital margins and special Medicare payment designations.
  • UNC Sheps Center lists of rural hospital closures and rural emergency hospitals. The former tracks closures among short-term, general acute care, non-federal hospitals in nonmetropolitan and certain other areas and among critical access and rural emergency hospitals. Closure data was was matched to KFF data on Medicaid expansion status and date of expansion to determine the expansion status of a given state when a given rural hospital closure occurred. The latter was used to identify rural emergency hospitals.
  • Census Bureau population estimates. This analysis relied on annual population estimates from July 1, 2023 (excluding U.S. territories) from the Census Bureau’s Population Estimates Program.
  • MedPAC publications. MedPAC’s March 2025 Report and July 2022 Data Book were used to identify rural hospital openings and closures over time,

This analysis categorized counties and county equivalents as urban (metropolitan) or rural (nonmetropolitan) areas and divided rural areas into those that are or are not adjacent to metropolitan areas based on 2024 Urban Influence Codes from the USDA, as follows:

  • Urban
  • 1: Large metro (in a metro area with at least 1 million residents)
  • 4: Small metro (in a metro area with fewer than 1 million residents)
  • Rural, adjacent to a metro area
  • 2: Micropolitan, adjacent to a large metro area
  • 3: Noncore, adjacent to a large metro area
  • 5: Micropolitan, adjacent to a small metro area
  • 6: Noncore, adjacent to a small metro area
  • Rural, not adjacent to a metro area (“most rural”)
  • 7: Micropolitan, not adjacent to a metro area
  • 8: Noncore, not adjacent to a metro area and contains a town of at least 5,000 residents
  • 9: Noncore, not adjacent to a metro area and does not contain a town of at least 5,000 residents

This analysis uses different groups of hospitals depending on the analysis, as described in the figure notes. Analyses primarily using AHA data focused on community hospitals—which are short-term, non-federal, general and specialty hospitals that are open to the general public—and exclude hospitals in U.S. territories. There were 1,796 community hospitals in rural areas in 2023, representing 92% of all hospitals in rural areas.

Analyses of hospital margins relied primarily on RAND Hospital Data and focused on non-federal general short-term hospitals, excluding those in U.S territories. Those analyses also included other sample restrictions, such as ignoring certain outlier values. Operating margins were approximated as (revenues minus expenses) divided by revenues after removing reported investment income and charitable contributions from revenues. The Methods section of a prior KFF analysis of operating margins includes additional details, such as the limitations of available financial data. Our analyses of margins included 1,690 hospitals in rural areas in 2023. Data for certain characteristics were missing for 1% or less of the sample with margins data.

The analysis of the share of rural hospitals with special payment designations focused on non-federal general short-term and rural emergency hospitals (excluding those in U.S territories), which included 1,787 hospitals in 2023.


Appendix

Examples of Rural Definitions Created by Federal Agencies

Office of Management and Budget (OMB). OMB defines Core Based Statistical Areas (CBSAs), which include metropolitan and micropolitan areas. A metropolitan area is a county or group of counties that contains at least one urban area (as defined by the Census) with a population of 50,000 or more people. A micropolitan area is a county or group of counties that contains at least one urban area with a population of at least 10,000 but less than 50,000. This brief defines “rural” as nonmetropolitan, as do many researchers and MedPAC, though OMB itself does not do so. The federal government defines “rural” to include nonmetro areas and other regions in some instances, such as when administering additional support through Medicare for critical access hospitals, Medicare-dependent hospitals, sole community hospitals, and rural emergency hospitals.

Federal Office of Rural Health Policy (FORHP). FORHP is an office within the Health Resources and Services Agency (HRSA) that distributes grants, technical assistance, and other support to rural areas, including rural hospitals. FORHP defines “rural” as all nonmetropolitan counties, as well as well as some portions of metropolitan counties based on population density, terrain ruggedness, and commuting patterns.

United States Department of Agriculture (USDA). The USDA Economic Research Service (ERS) maintains multiple definitions of rurality, including Rural-Urban Continuum Codes (RUCC), Rural-Urban Commuting Areas (RUCA), and Urban Influence Codes (UIC). Various federal programs use these definitions to administer support for health care and other resources (such as broadband access and housing) in rural areas.

Census Bureau. The Census Bureau classifies urban areas as census blocks (which are smaller geographic areas than counties) with at least 2,000 housing units or where more than 5,000 people reside. Rural areas are regions outside of urban areas. Federal transportation funds are based in part on this classification.

This work was supported in part by Arnold Ventures. KFF maintains full editorial control over all of its policy analysis, polling, and journalism activities.

Title X Grantees and Clinics Affected by the Trump Administration’s Funding Freeze

Published: Apr 15, 2025

This data note was updated on April 28, 2025 to update the number of sites affected by the funding freeze.

Title X provides federal funding to support clinics across the country to provide comprehensive family planning services to low-income and uninsured individuals. Federal support assists nearly 4,000 clinics across the country to provide services to 2.8 million clients in all 50 states, D.C. and U.S. territories.

Over the last decade, there have been major changes to the program’s regulations based on shifting administrations’ priorities. The program underwent significant changes during the first Trump Administration when the regulations were revised to disqualify clinics that had co-located abortion services and provided abortion referrals. Over 1,000 clinics were no longer eligible for Title X funds. The Biden Administration reversed the Trump Administration regulations and funding was restored to many of these clinics. Recent actions by the current Trump Administration indicate that their efforts to disqualify clinics from funding will resume.

On March 31, 2025, almost one in five (16 out of 86) of the current Title X grantees received notification that their year 4 funding of a 5-year project period would be temporarily withheld. This funding freeze affects all 9 of the Planned Parenthood grantees, in addition to 7 other nonprofit grantees. These grantees fund networks of clinics that include health departments, federally qualified health centers, school-based providers, and Planned Parenthood clinics. The remaining grantees received partial FY2025 awards. KFF estimates that a total of 879 clinics (24% of all Title X clinics) in 23 states are affected by the funding freeze (Table 1).

Figure 1

Title X Grantees and Clinics Affected by the Trump Administration's Funding Freeze

According to one estimate, up to 834,000 people may lose access to Title X-funded care if these funds are not released. These are largely low-income and uninsured individuals that go to Title X clinics to get free or reduced cost contraception and STI testing. It is anticipated that in addition to this administration’s efforts to withhold funds, that new regulations restoring the previous Trump Administration’s policies will be promulgated in the near future.

Texas Judge Overturns Controversial Nursing Facility Staffing Rule

Published: Apr 11, 2025

On Monday, April 7, Judge Matthew Kacsmaryk in the US District Court for Northern Texas ruled to overturn key elements of a Biden administration rule that established the first-ever minimum staffing ratios for nursing facilities. The court’s opinion stated that the regulations ultimately overstepped CMS’ authority, noting “the agency lacks authority to eliminate consideration of a facility’s nursing ‘needs’ when prescribing minimum staffing standards”, and “any regulatory response must be consistent with Congress’s legislation governing nursing homes.”

The rule, finalized to address long-standing concerns about the effect of staffing shortages on the quality of care in nursing homes, has been mired in controversy since it was issued. The nursing home industry opposed the rule, suggesting it was too burdensome and costly, and could lead to nursing facility closures. Resident and family advocates and others supported the new staffing standards to address well-documented concerns about substandard facility conditions, unattended residents, and poor patient care. According to one estimate, the rule was projected to save 13,000 lives each year. In April 2022, the National Academies of Science, Engineering, and Medicine also recommended minimum staffing levels as part of its comprehensive report to improve nursing home quality.

The ruling overturned two requirements that were slated to phase in over time, but take effect no later than 2029 for all facilities:

  1. Facilities must have a registered nurse (RN) on duty 24 hours a day, 7 days a week (24/7 requirement);
  2. Facilities must have a minimum of 3.48 hours per resident day of total nursing care, including at least 0.55 hours of RN care and 2.45 hours of nurse aide care.

Before the rule had passed, the only federal requirements for nursing facility staffing were that, irrespective of facility size, there had to be one RN on staff for 8 consecutive hours a day and at least one RN or licensed practical nurse working for the remaining 16 hours. There were no requirements for nurse aides or minimum staffing ratios that would account for facility size. Updated data maintain that about 1 in 5 nursing facilities meet the now-overturned minimum staffing hour requirements, and the percentage of for-profit facilities (12%) that meet the requirements is lower than that of non-profit (47%) and government-owned facilities (41%).

For-Profit Nursing Facilities Were the Least Likely to Meet the Requirements in the Now-Overturned Rule

The court left several other requirements from the staffing rule intact, including the requirement for state Medicaid agencies to report the percentage of Medicaid payments for institutional long-term care that are spent on compensation for direct care workers and support staff.

The future of nursing home regulation is unclear, though President Trump’s first term may provide some insight. During President Trump’s first term, CMS proposed regulations that rolled back or relaxed many of the 2016 Obama-era regulations, categorizing them as “unnecessary, obsolete, or excessively burdensome.” Those rollbacks were not finalized under his first term, though the Administration may reissue them or issue similar ones. Another open question is the fate of regulations issued under the Biden Administration aimed at promoting transparency around nursing facility ownership.

Congress has been considering legislative proposals as part of a tax and spending package to overturn the nursing home staffing rule which could have included up to $22 billion in savings over the next 10 years. It is unclear how the CBO will score these proposals in light of the recent court ruling, and it could depend on future court decisions and actions by the administration. The House budget resolution includes up to $880 billion or more in federal Medicaid reductions. Such reductions in Medicaid spending could have implications for nursing facility residents, since Medicaid covers 63% of all nursing home costs nationwide, and could lead to reductions in Medicaid payment rates for nursing homes, making it harder for nursing facilities to bolster staffing to improve the quality of patient care.

This work was supported in part by The John A. Hartford Foundation. KFF maintains full editorial control over all of its policy analysis, polling, and journalism activities.

PEPFAR Reauthorization: Side-by-Side of Legislation Over Time

Published: Apr 10, 2025

Overview

The President’s Emergency Plan for AIDS Relief (PEPFAR) is the U.S. government’s global effort to combat HIV and the largest global health program in the world devoted to a single disease (for more information, see PEPFAR). First proposed by President George W. Bush in 2003, PEPFAR was authorized that same year and has been reauthorized four times since, including its latest – a short-term extension that marks a significant departure from past five-year PEPFAR reauthorizations (see Table 1). PEPFAR’s authorizing legislation governs the U.S. bilateral HIV response, as well as participation in the Global Fund to Fight AIDS, Tuberculosis and Malaria (Global Fund) and bilateral assistance for tuberculosis (TB) and malaria programs. These legislative vehicles have permanently authorized most of the program within U.S. law but have also created some time-bound provisions; other than these time-bound provisions, PEPFAR does not need to be reauthorized to continue to operate, as long as Congress appropriates funding for the program. The recent short-term reauthorization extended the program until March 25, 2025, but since its timebound provisions have now lapsed, what happens after this point is uncertain and likely to be affected by the ongoing Trump administration actions related to global health as well as the current complex outlook for PEPFAR. This brief provides a detailed comparison of PEPFAR’s authorizing legislation over time and highlights those authorities that are time-bound (see Tables 2 and 3).

PEPFAR Legislation

Legislative Changes to PEPFAR Over Time

After first setting the broad parameters for PEPFAR and creating its main structures in 2003, PEPFAR’s subsequent authorizing legislation has made several key changes to the program, as the HIV response has evolved and as PEPFAR has moved from an emergency response to one supporting longer-term sustainability and epidemic control. These include changes to funding authorization levels and spending directives, as well as requirements for reporting and oversight. Among the major changes over time are:

  • Funding authorization levels: The Leadership Act authorized $15 billion during PEPFAR’s first five-year period (FY 2004 – FY 2008), which marked a significant increase in funding for HIV by the U.S. government. The Lantos-Hyde Act authorized even more, with $48 billion over the next five-year period (FY 2009 – FY 2013). Subsequent reauthorizations have not included specific authorization of funding amounts.
  • Spending directives: Congress has provided several spending directives to PEPFAR through its authorizing legislation, although these have generally been relaxed over time. For example, in the Leadership Act, Congress required that at least 33% of prevention funds be spent on abstinence-until-marriage programs during the FY 2004 – FY 2009 period. This was relaxed in the Lantos-Hyde Act, which removed the 33% directive and replaced it with a requirement of “balanced funding” for prevention, to be accompanied by a report to Congress if less than half of prevention funds were spent on abstinence, delay of sexual debut, monogamy, fidelity, and partner reduction activities in any host country with a generalized epidemic.
  • Reporting, monitoring, and transparency: Each of the authorizing bills has included reporting requirements to provide Congress and others with data and information about the program and to support oversight and evaluation. For example, the Leadership Act and the Lantos-Hyde Act required the Institute of Medicine to conduct evaluations of PEPFAR; however, this has not been included in subsequent reauthorizations. On the other hand, all authorizations have required the Inspectors General of several U.S. agencies (the Department of State, the Department of Health and Human Services, and the U.S. Agency for International Development) to jointly develop coordinated annual plans for overseeing U.S. government global HIV, TB, and malaria programs.

It is important to note that Congress has also made changes to PEPFAR through other legislative vehicles. For example, Congress has used appropriations legislation in certain years to change the amount of withholding required from the annual U.S. contribution to the Global Fund, pending certification of certain benchmarks by the Secretary of State. Still, by the time of the Stewardship Act in 2013, a decade after PEPFAR’s creation, most changes have been relatively minor, focused on adding new or refining existing reporting requirements.

Permanent and Time-Bound Authorities

PEPFAR operates largely under permanent authorities of U.S. law that allow for ongoing funding and the continuation of the major structures of the program, such as the Office of the Global AIDS Coordinator at the Department of State (now within the Bureau of Global Health Security and Diplomacy) as well as the position of Global AIDS Coordinator, U.S. participation in the Global Fund, and annual reporting on PEPFAR efforts. Absent a reauthorization, the PEPFAR program would continue, provided funds are appropriated. At the same time, a subset of PEPFAR’s congressionally-mandated requirements are time-bound and are currently lapsed, having been extended through only March 25, 2025 (approximately midway through FY 2025). Of these, two relate to how HIV funding is allocated, four specify requirements related to the U.S. contribution to the Global Fund, and two address reporting or oversight (see Table 2).

Current Status of PEPFAR Time-Bound Provisions

Detailed Comparison

Table 3 provides a detailed comparison of PEPFAR’s authorizing legislation over time, by key topic. Time-bound provisions are specified. The recent short-term reauthorization’s extension of these provisions is reflected in The PEPFAR Extension Act column.

Side-by-Side of PEPFAR Legislation