A Closer Look at Deficiencies in Nursing Homes
About 1.2 million older adults and younger people with disabilities live in 14,700 nursing homes in the U.S., and the Department of Health and Human Services (HHS) reports that after age 65, over one-third of adults use some nursing home care, which may include long-term care in a nursing facility or post-acute care provided in a skilled nursing facility. Nursing home quality of care has been a longstanding issue, and the high mortality rate in nursing homes during the COVID-19 pandemic highlighted and intensified the consequences of poor quality of care.
Amid changes to federal oversight of nursing homes during the Trump administration — including rescinding the nursing home staffing rule issued by the Biden administration, prioritizing inspections that are triggered by complaints over routine inspections, and suspending the deadline to report detailed ownership information — this issue brief provides an overview of the nursing home inspection process and the types of deficiencies (e.g., failures to meet federal safety and quality requirements) identified during these inspections. While nursing homes can also receive deficiencies for fire safety and emergency preparedness, this analysis, as well as previous KFF analysis and published state-level data, only include health deficiencies. Health deficiencies are those related to clinical care, medical treatment, and daily living conditions of nursing home residents while fire safety and emergency preparedness deficiencies are related to adherence to fire safety and building codes. The term “deficiency” in this brief is used interchangeably with “health deficiency.” This analysis uses detailed deficiency data from Nursing Home Compare, a publicly available dataset that provides information on quality of care in each nursing home. This analysis also reports examples of real nursing home deficiencies taken from inspection reports from the most recent inspection cycle. See methods for more details. Key takeaways include:
- The Centers for Medicare and Medicaid Services (CMS) uses unannounced, on-site nursing home inspections (also known as surveys) to identify deficiencies in nursing homes. There are two types of surveys: standard surveys (part of a regular schedule) and complaint surveys (in response to a complaint).
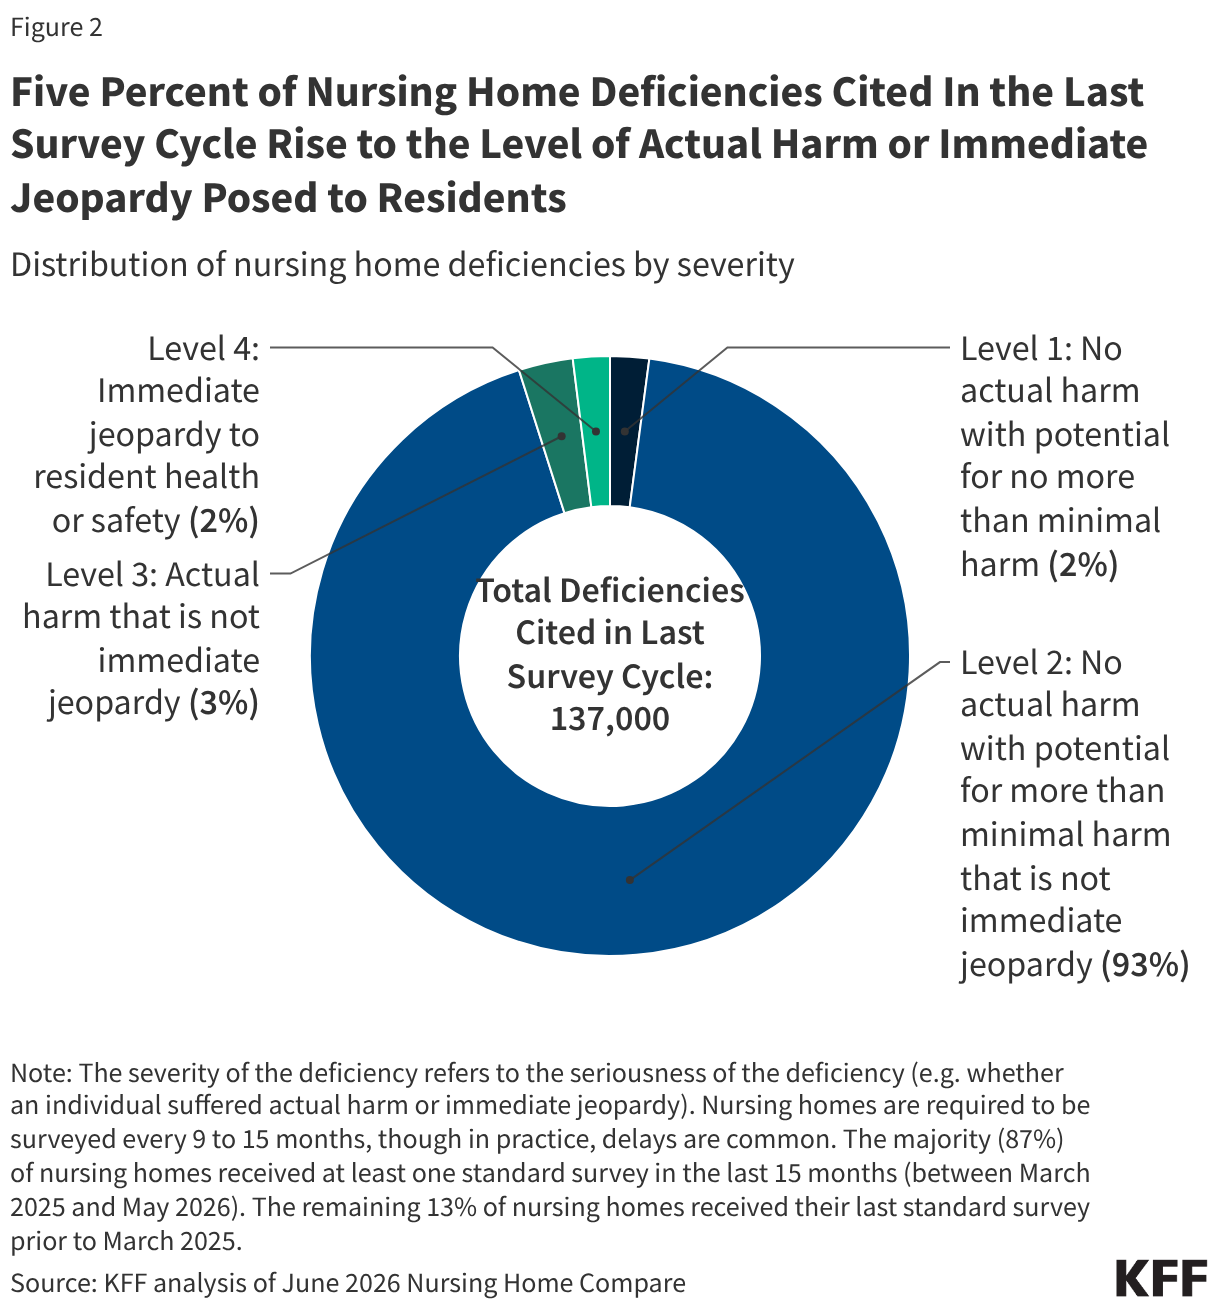
- Five percent of all nursing home deficiencies cited in the last survey cycle rise to the level of actual harm or immediate jeopardy posed to residents. These are deficiencies that have caused, or are likely to cause, serious injury, harm, impairment, or death to a resident.
- The vast majority of nursing home deficiencies did not cause actual harm to residents but had the potential to cause harm.
- Nursing homes with lower levels of staffing are more likely to receive deficiencies that cause serious harm or immediate jeopardy to residents when compared to nursing homes with higher levels of staffing.
The nursing home survey and certification process is a federal-state partnership designed to ensure that nursing homes comply with health and safety standards. In order to receive federal funding from the Medicare or Medicaid programs, nursing homes must meet conditions of participation, which include complying with health and safety standards. To enforce the conditions of participation, CMS partners with state agencies to conduct unannounced, on-site nursing home inspections, also known as standard surveys. Standard surveys are used to identify “deficiencies” in nursing homes, which are defined as a nursing home’s failure to meet a federal requirement for participation in Medicare or Medicaid.
While CMS primarily relies on states to accurately collect information on deficiencies, the agency also conducts on-site “Federal Monitoring Surveys,” (e.g., “validation inspections”) in nursing homes to verify the accuracy of state inspections. There are two main types of validation inspections: 1) comparative inspections, in which CMS conducts an independent inspection within 60 days of the state agency to compare results and 2) “Resource and Support” inspections, in which CMS accompanies the state surveyor to provide support and observe. In May 2026, CMS released guidance to state agency directors that noted that there would be fewer federal “validation inspections” in FY 2026 due to the 2025 federal government shutdown.
Federal law requires that all nursing homes must receive a standard survey at least once every nine to fifteen months, though in practice, some states may not inspect all facilities within this time frame. While state agencies generally conduct standard surveys at least once every 15 months, staffing shortages and relaxed oversight can lead to delays. States have flexibility to conduct inspections more frequently at nursing homes that have historically had quality issues and less frequently at nursing homes that have had fewer quality issues. Recent data show that while a majority (87%) of nursing homes received at least one standard survey in the last 15 months (between March 2025 and May 2026), about ten percent of nursing homes received a standard survey between January 2024 and February 2025, and the remaining three percent of nursing homes have not had a standard survey since prior to January 2024.
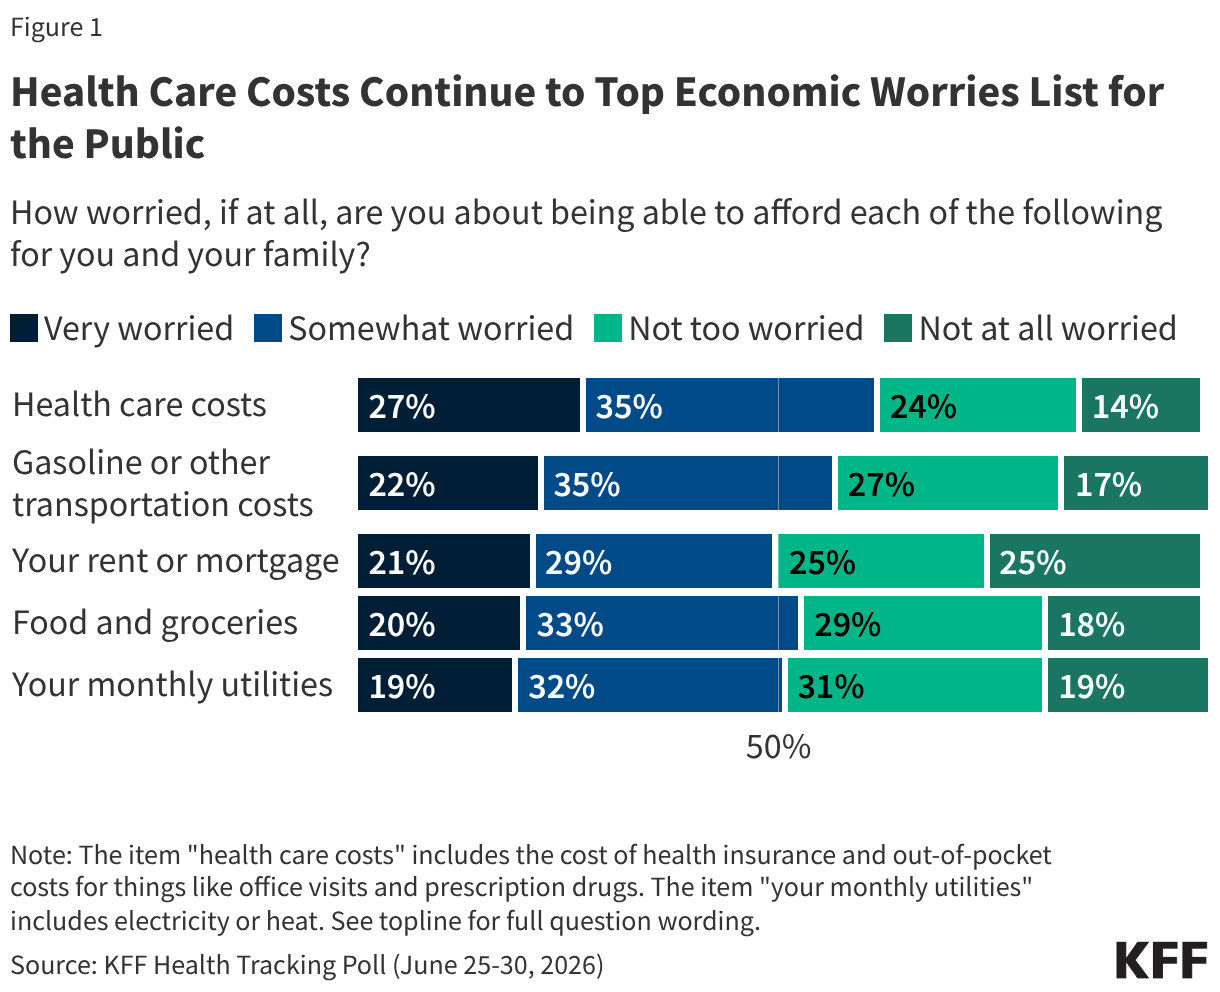
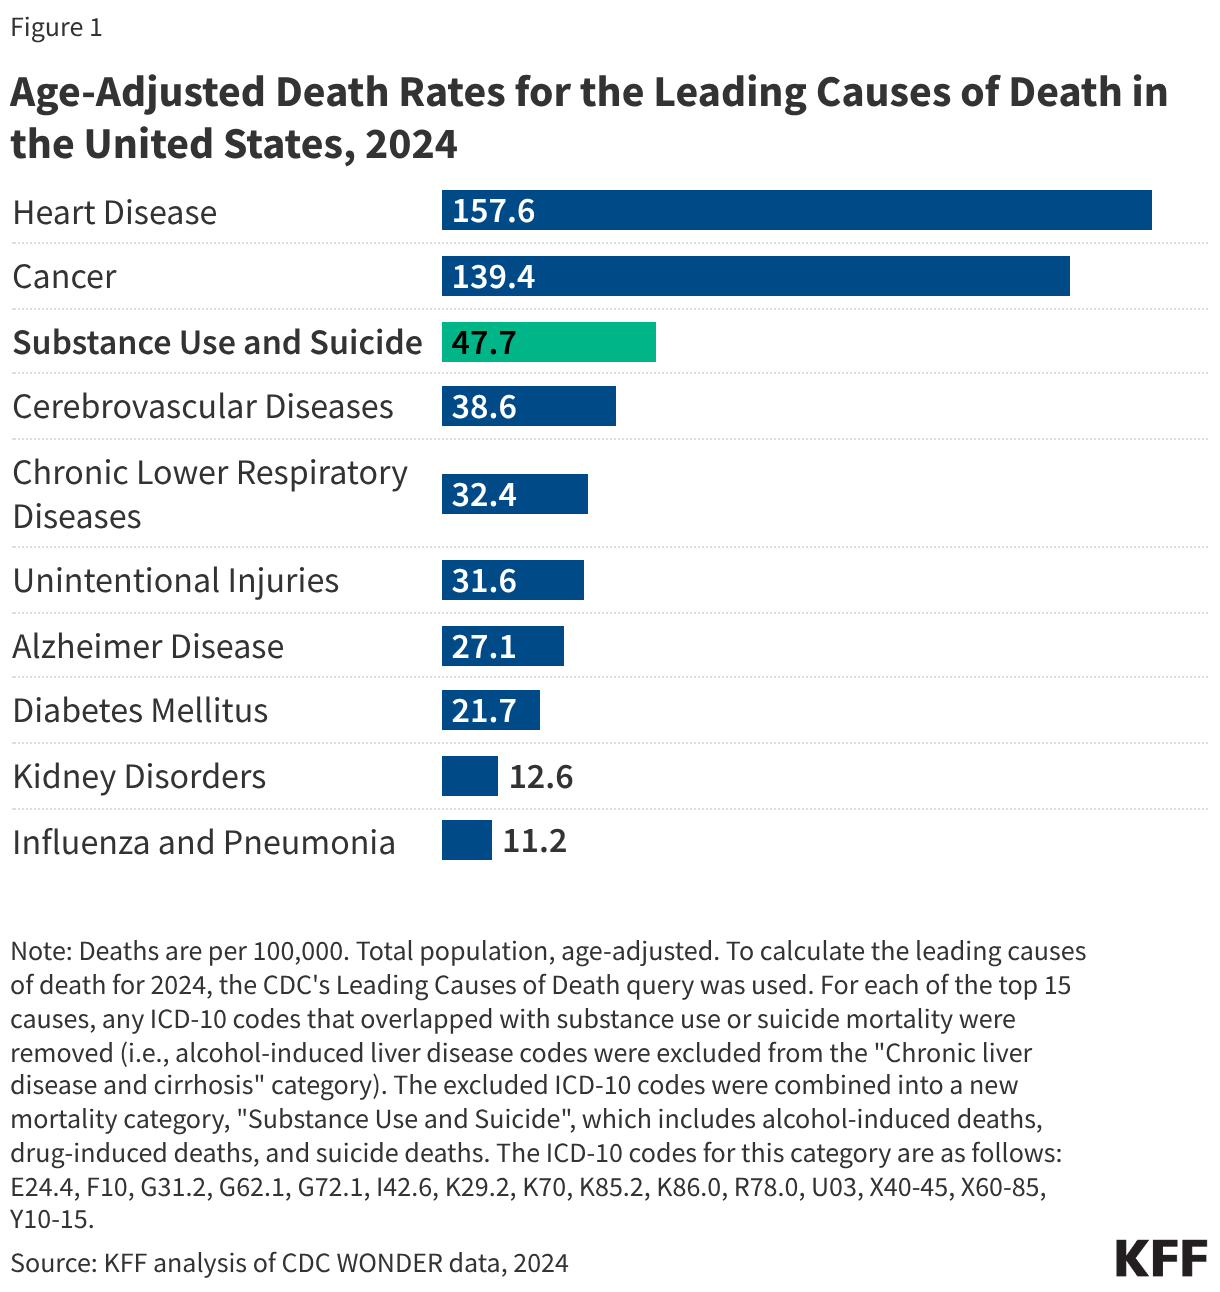
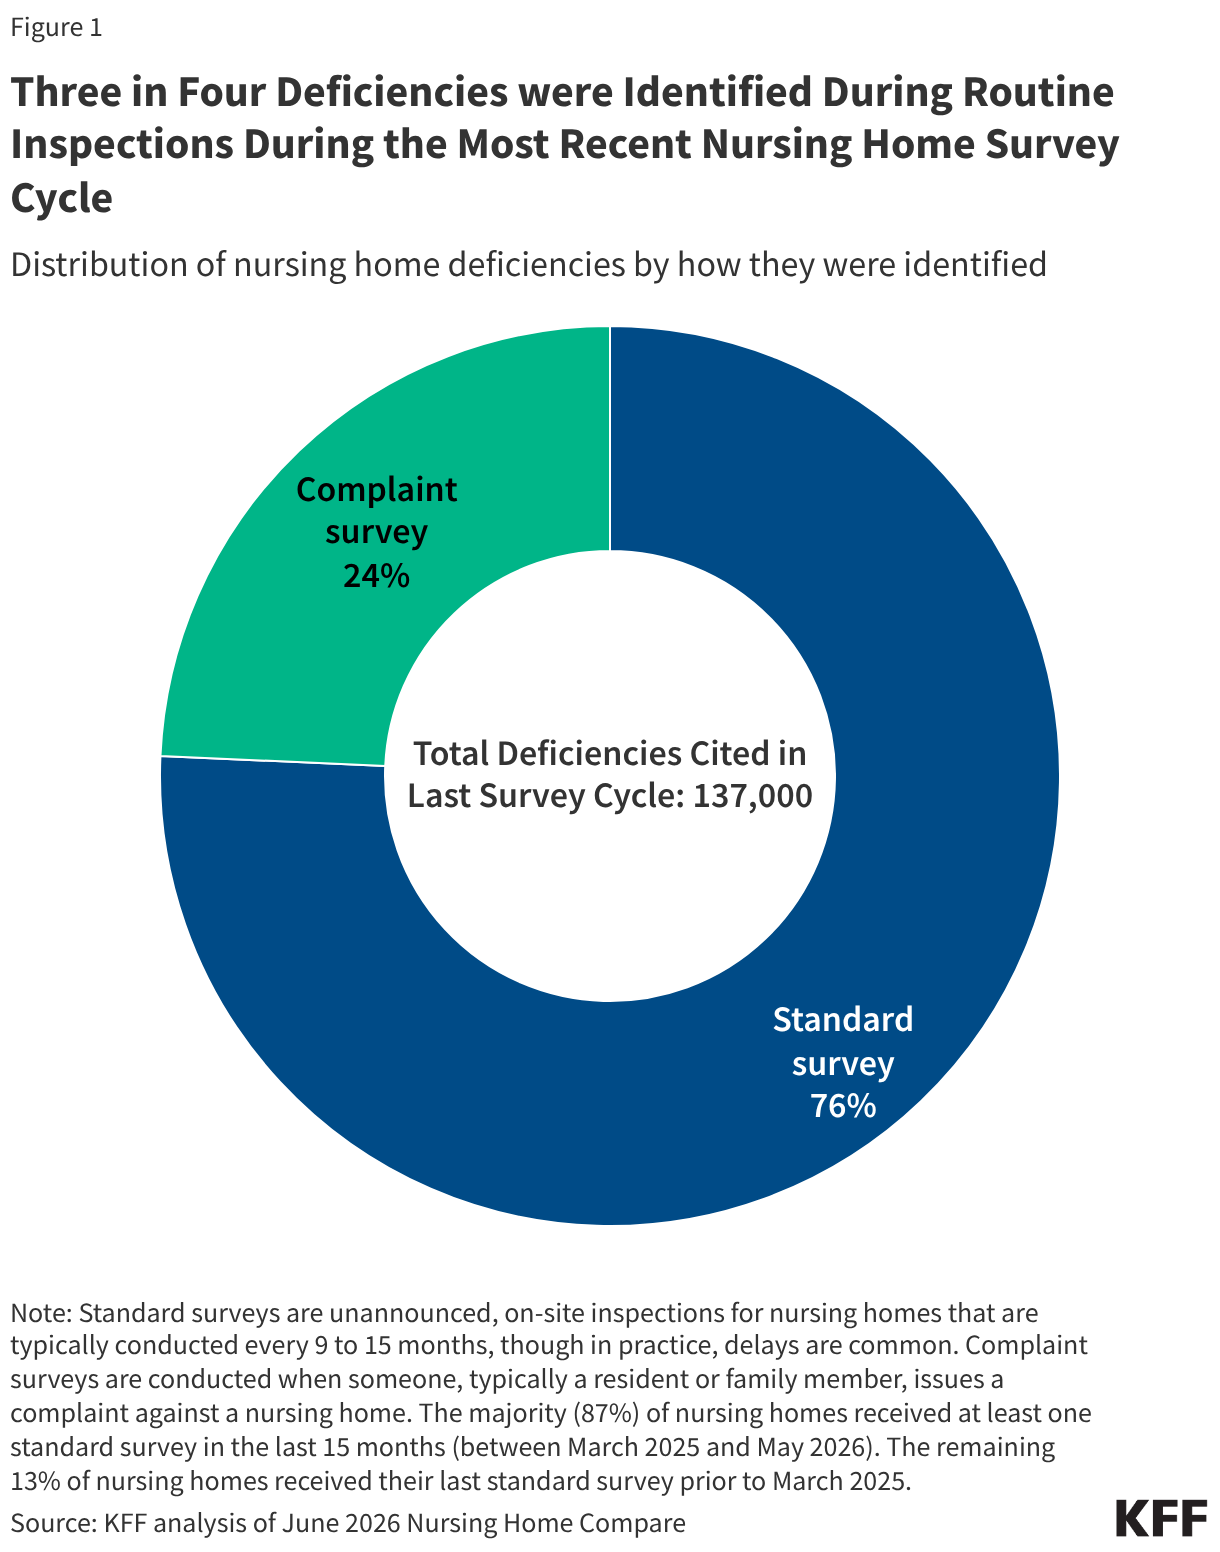
Nursing homes also undergo complaint surveys, which is how one in four nursing home deficiencies were identified in the most recent survey cycle (Figure 1). Complaint surveys are conducted when someone, typically a resident or family member, issues a complaint against a nursing home. This triggers an inspection that investigates potential noncompliance with federal requirements that protect the health, safety, and welfare of nursing home residents. The remaining three-quarters of deficiencies were identified in a standard survey.
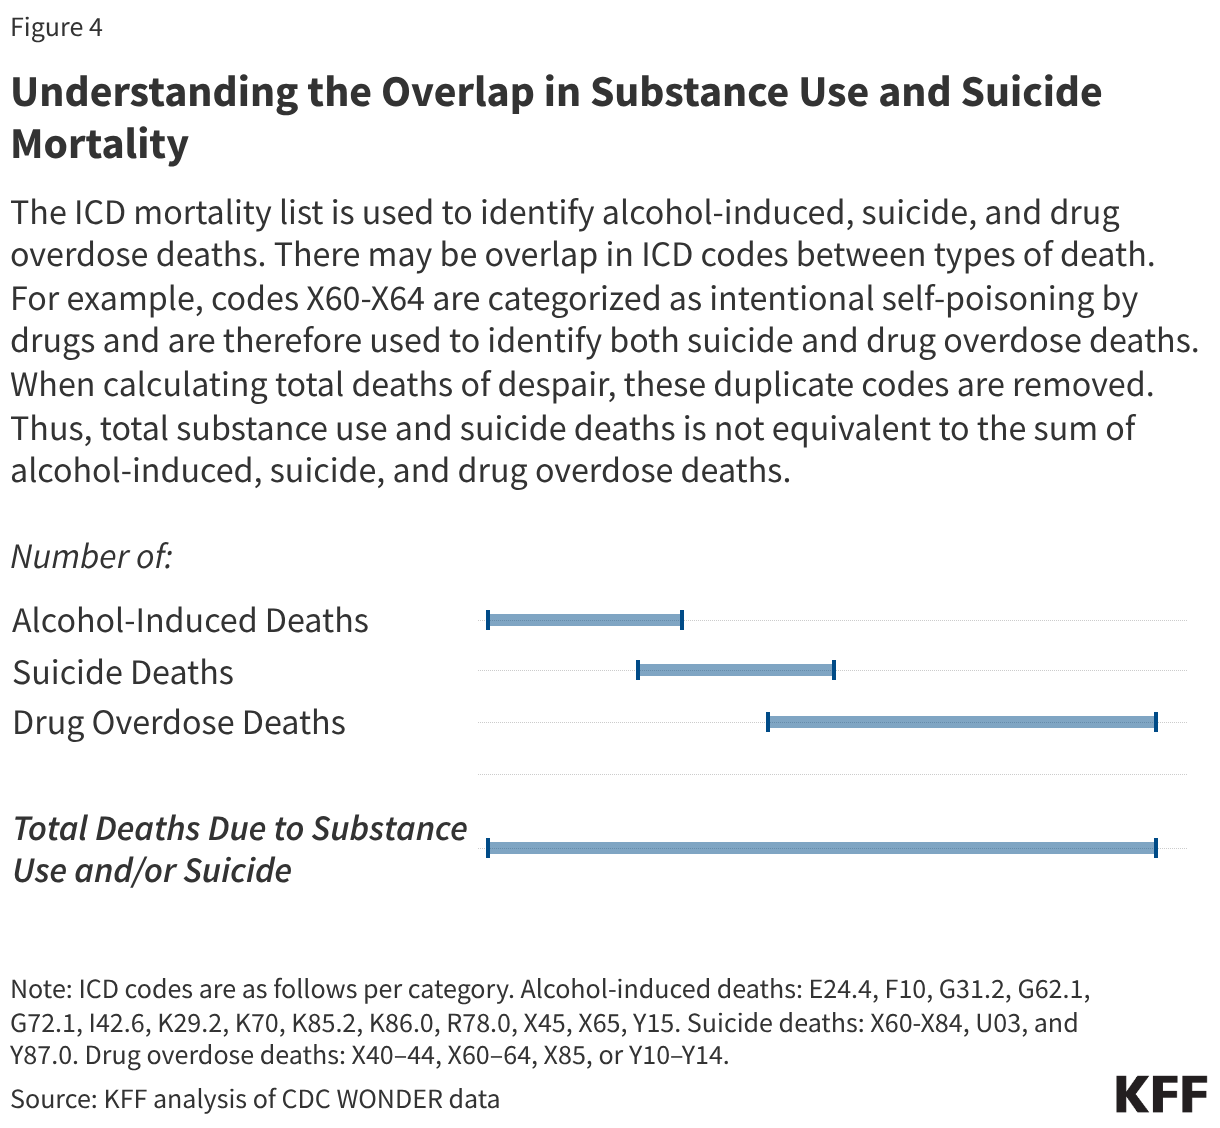
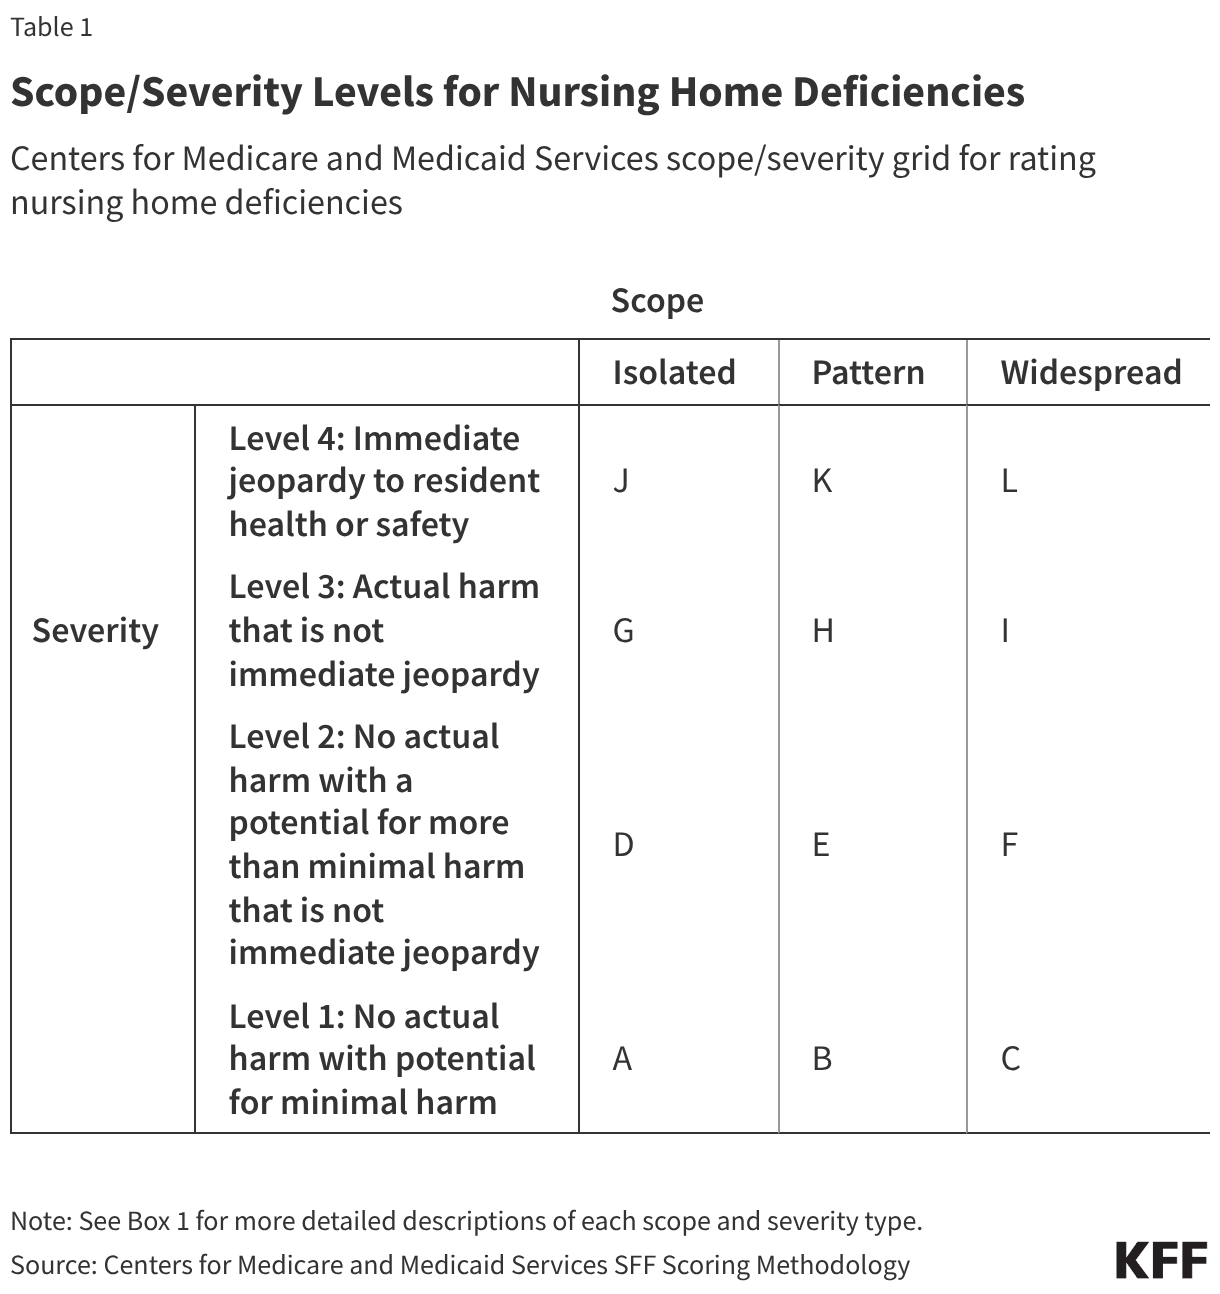
CMS evaluates deficiencies based on their scope and severity (Table 1 and Box 2). Deficiency scope can be isolated to a single incident, part of a pattern of incidents, or widespread. Deficiency severity has four possible values, ranging from no actual harm with potential for minimal harm to immediate jeopardy to residents’ health and safety. Survey agencies assign deficiencies a Scope/Severity score ranging from letters A through L, with each letter corresponding to a unique combination of scope and severity (Table 1). A-rated deficiencies are considered the least serious, and L-rated deficiencies are the most serious. The scope and severity levels allow federal and state policymakers, residents, and family members to identify serious problems with the quality of care in nursing homes. Box 1 provides more details on specific scope and severity definitions.
Box 1: Scope/Severity Levels for Nursing Home Deficiencies
There are three scope levels:
Isolated. Scope is isolated when one or a very limited number of residents or employees is/are affected and/or a very limited area or number of locations within the facility are affected.
Pattern. Scope is a pattern when more than a very limited number of residents or employees are affected, and/or the situation has occurred in more than a limited number of locations but the locations are not dispersed throughout the facility.
Widespread. Scope is widespread when the problems causing the deficiency are pervasive throughout the facility and/or represent a systemic failure that affected, or has the potential to affect, a large portion or all of the residents or employees.
There are four severity levels:
Level 1 - No actual harm with potential for minimal harm. A deficiency that has the potential for causing no more than a minor negative impact on the resident.
Level 2 - No actual harm with a potential for more than minimal harm that is not immediate jeopardy. Noncompliance that results in no more than minimal discomfort to the resident and/or has the potential to compromise the resident’s ability to maintain or reach their highest practicable well-being.
Level 3 - Actual harm that is not immediate jeopardy. Noncompliance that results in a negative outcome that has compromised the resident’s ability to maintain or reach their practicable well-being.
Level 4 - Immediate jeopardy to resident health or safety. A situation in which immediate corrective action is necessary because the facility’s noncompliance with one or more requirements of participation has caused, or is likely to cause, serious injury, harm, impairment, or death to a resident receiving care in a facility.
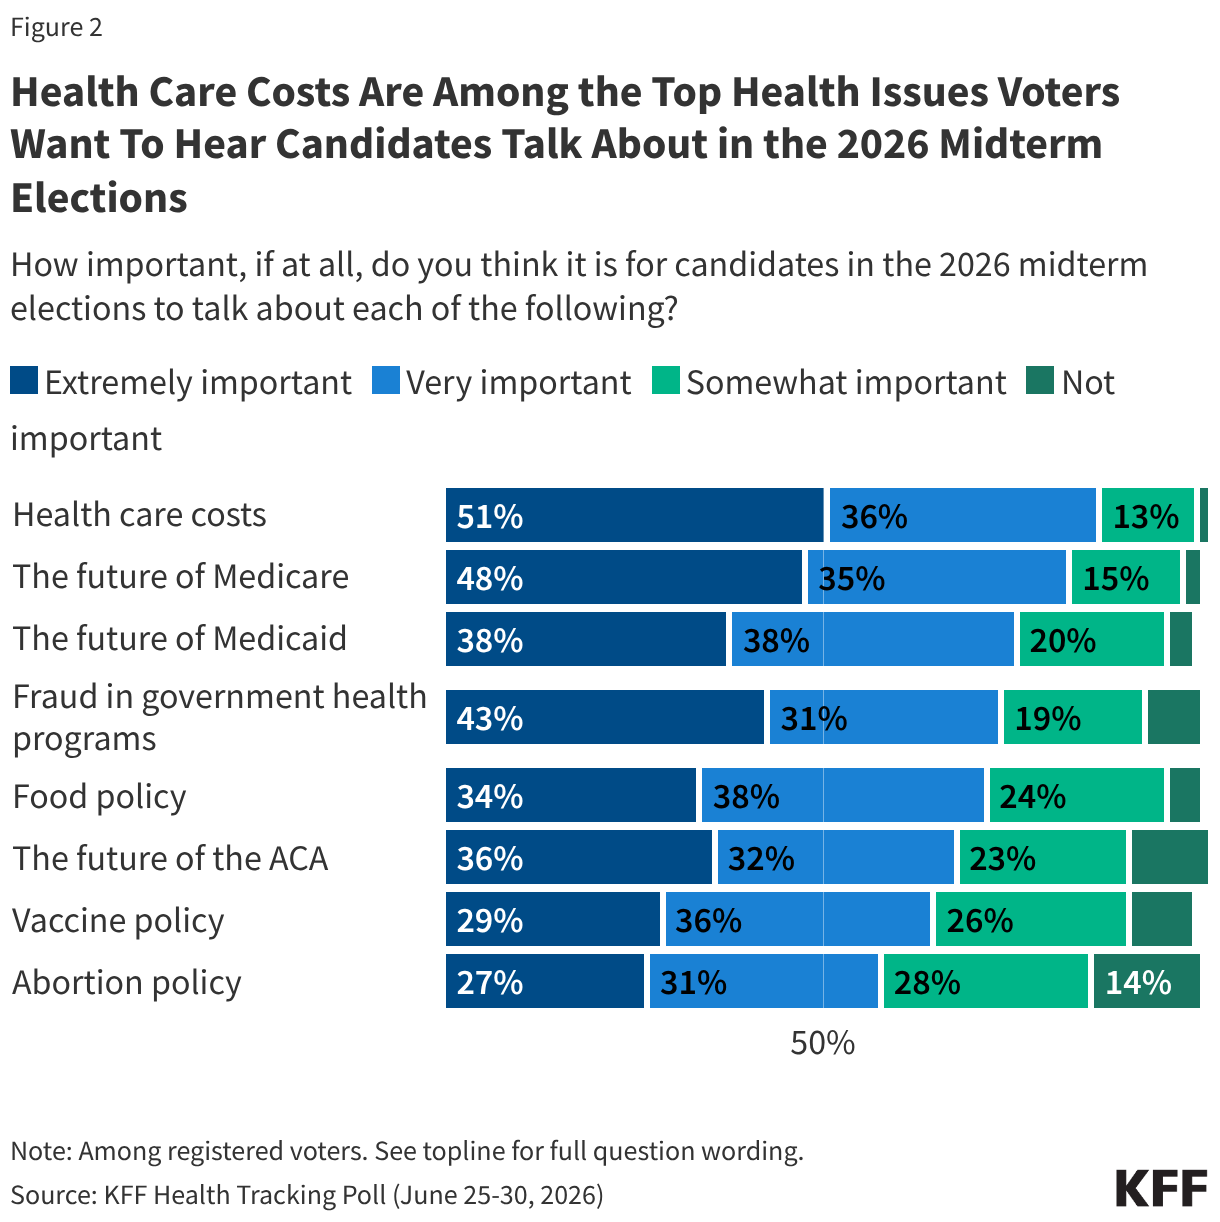
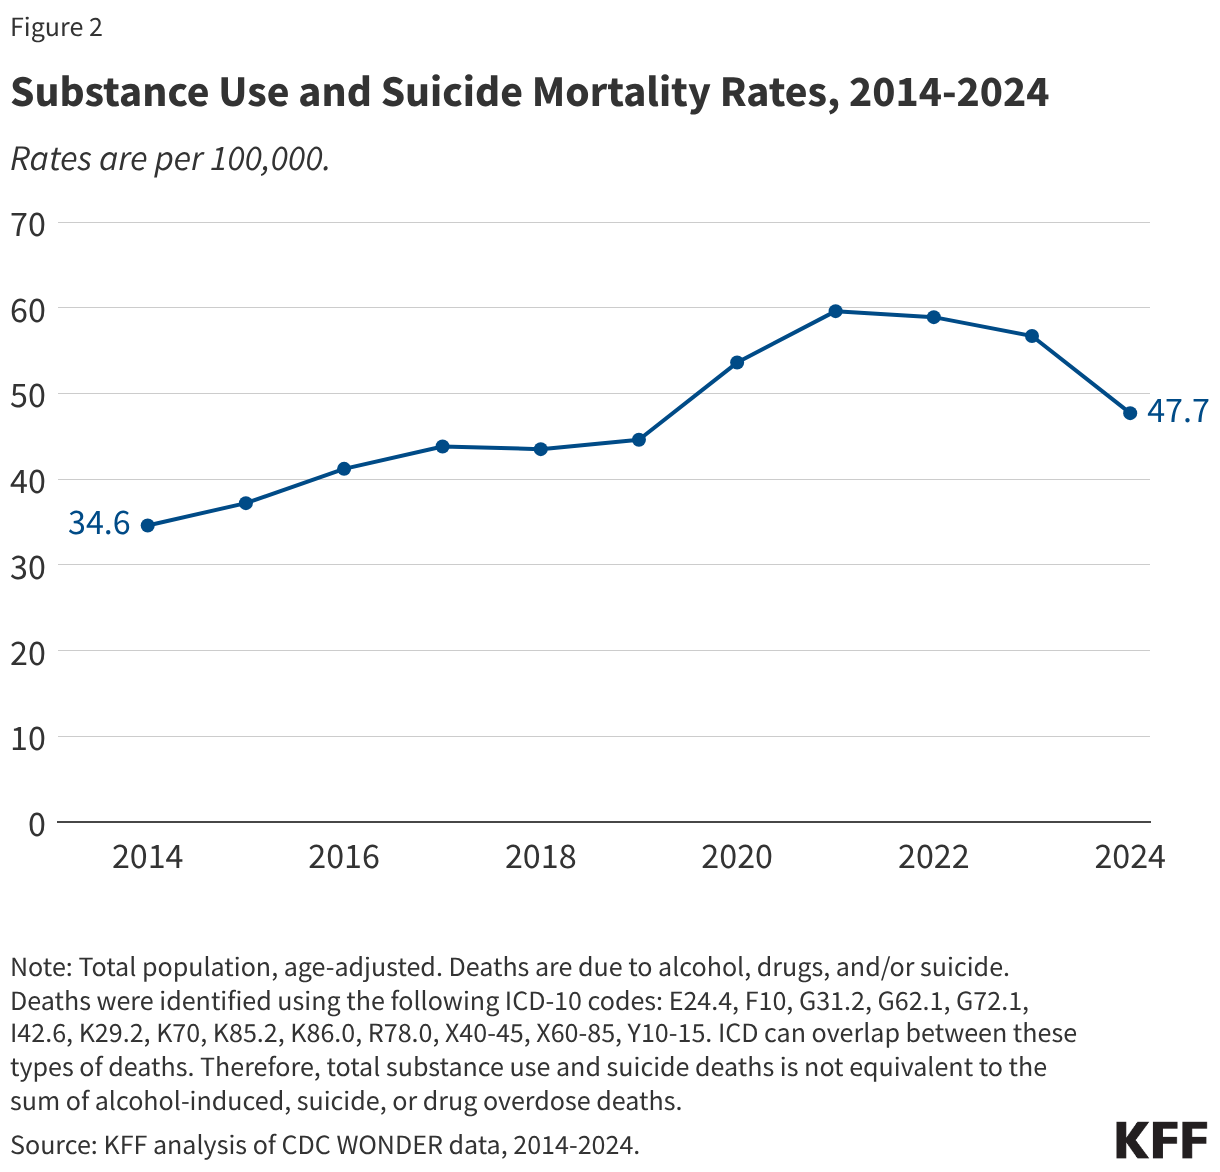
About five percent of deficiencies rise to level 3 or level 4 severity, which is actual harm or immediate jeopardy to resident health or safety (Figure 2). These are deficiencies that have caused, or are likely to cause, serious injury, harm, impairment, or death to a resident. These are considered the most serious deficiencies, though they make up a small share of overall deficiencies. In the last survey cycle, about 6,700 deficiencies were cited with one of these codes, and the vast majority (5,900 deficiencies) of these most concerning deficiencies have an isolated scope (values G and J in Table 1). In 2026, about 28% of nursing homes in total reported at least one of these deficiencies.
Examples of deficiencies that rose to actual harm or immediate jeopardy include the following:
“Facility failed to ensure a resident’s bedside rail was raised up while the resident was in bed. This failure resulted in the resident falling out of bed and sustaining a fracture through the right femur.”
“Facility failed to ensure care and services were provided in accordance with professional standards of practice for a resident who was experiencing a change in condition. This failure resulted in a resident’s unnecessarily prolonged physical distress and anxiety lasting until the resident made arrangements to be taken to the hospital, where they were diagnosed with pneumonia and influenza.”
Deficiencies with Code G (Level 3 severity, Isolated)
“Facility failed to ensure a cognitively impaired resident was fed with nectar thick liquid, liquid thickened with an agent for a nectar like consistency, to prevent aspiration (accidental breathing in of fluid or food into the lungs).”
“Facility failed to provide a credentialed certified respiratory staff, as required by state law, to perform respiratory assessment, treatment, and monitoring for residents requiring respiratory care.”
“Facility failed to ensure residents maintained acceptable parameters of nutritional status, obtain admission weights, monitor weights, accurately assess residents for weight loss, and implement and monitor nutritional interventions.”
Deficiencies with Code J (Level 4 severity, isolated)
Over nine in ten (93%) nursing home deficiencies cited in the last survey cycle were categorized with a level 2 severity level, which means they did not cause actual harm to residents but had the potential to do so (Figure 2). Nearly seven in ten (69%) deficiencies with a level 2 severity were isolated in scope (data not shown). There are a wide range of deficiencies that fall under this category.
Examples of these deficiencies include the following:
“Facility failed to attend to and answer calls bells in a timely manner for dependent residents.”
“Facility failed to ensure medication was delivered from the pharmacy in a timely manner for one of 24 sampled residents.”
“Facility failed to ensure resident to resident altercations were thoroughly investigated and reviewed for abuse investigations. This failure placed the residents at risk for repeated incidents, unidentified abuse, and inappropriate corrective actions.”
Deficiencies with Code D (Level 2 severity, Isolated)
“Facility staff failed to ensure residents were free from accidents by failing to properly educate staff on how to operate a Hoyer lift, and by failing to maintain supervision of residents from the locked dementia unit.”
“Facility failed to ensure residents received current food menus and/or alternative menus that meet their needs, including fresh fruits and vegetables for 5 of 6 residents reviewed for dining services.”
Deficiencies with Code E (Level 2 severity, Pattern)
“Facility failed to ensure medications were stored appropriately and failed to discard expired medications.”
“Facility failed to store food in accordance with professional standards for food safety when expired food items were not discarded.”
Deficiencies with Code F (Level 2 severity, Widespread)
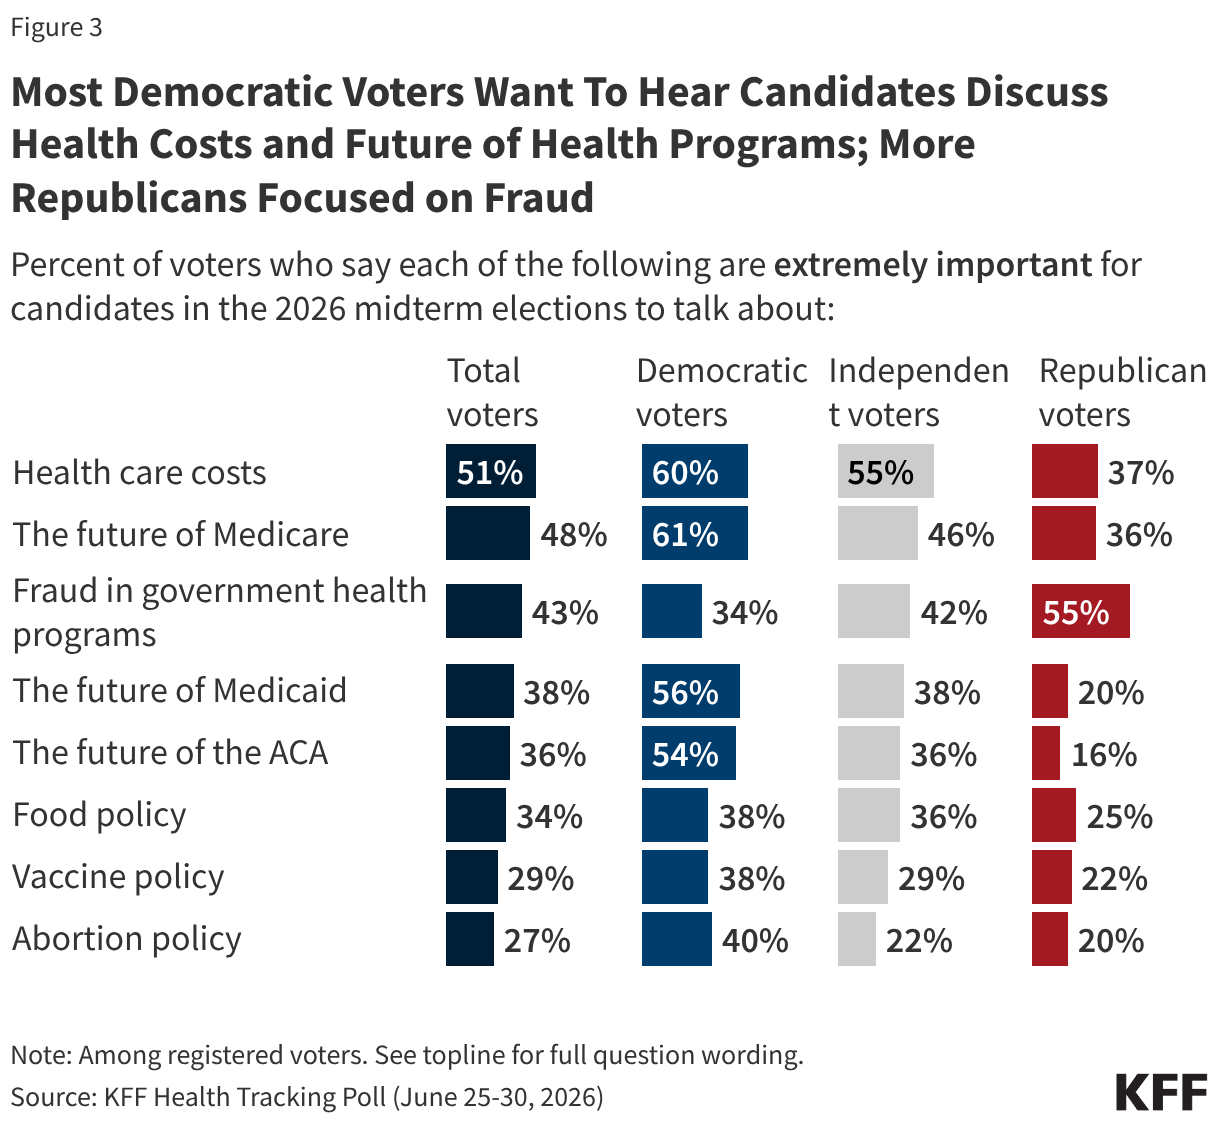
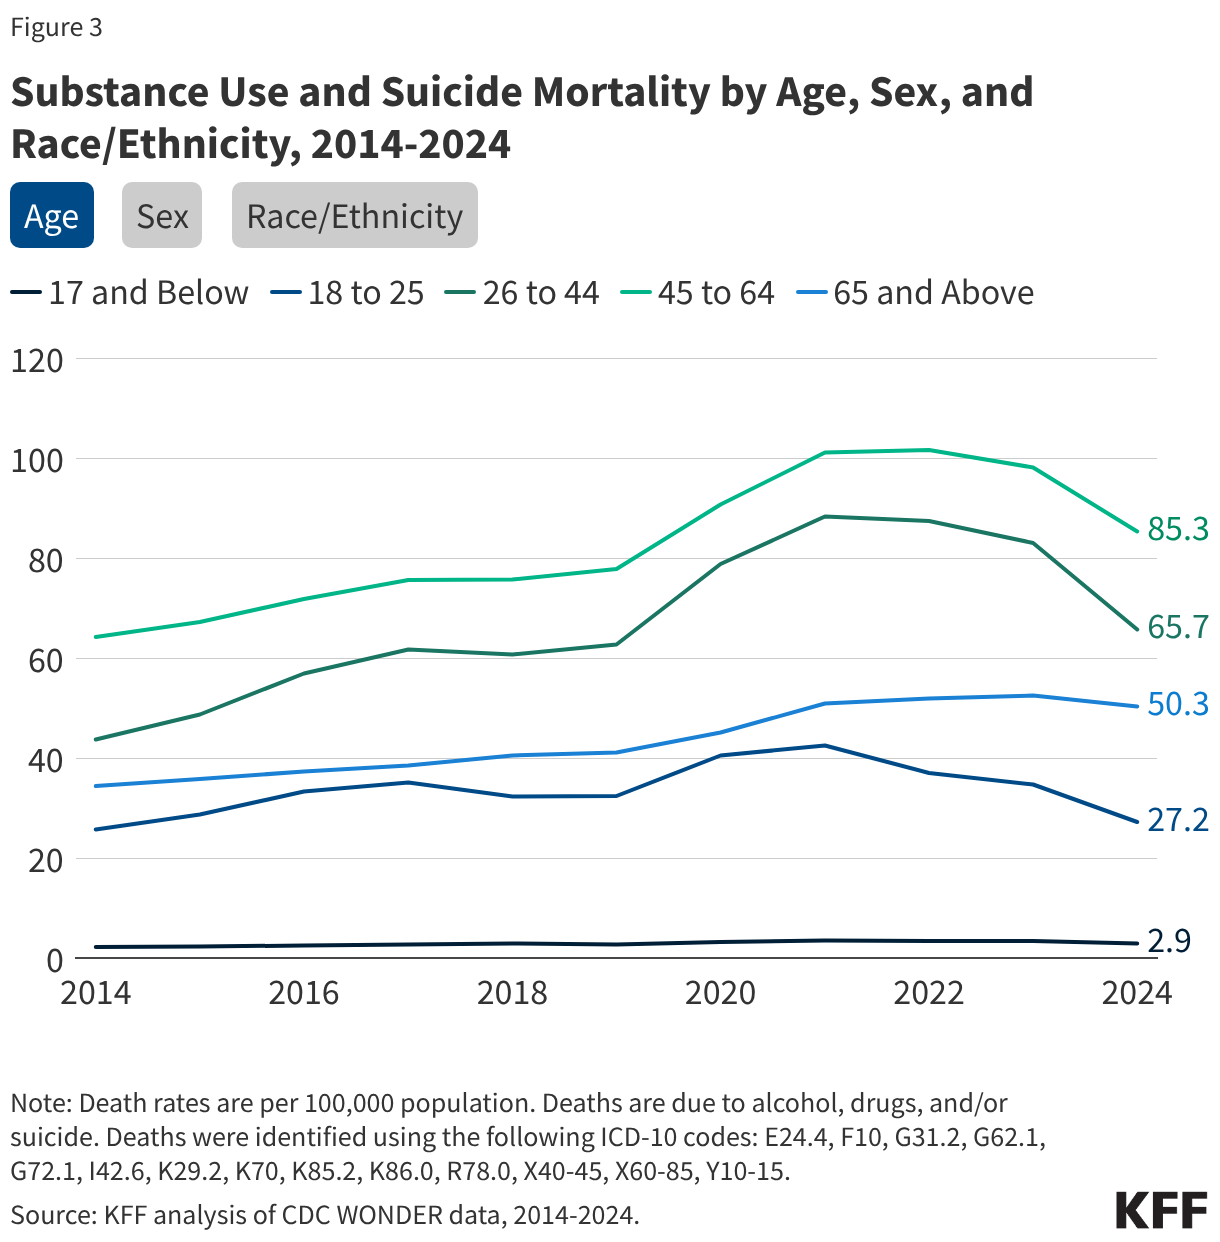
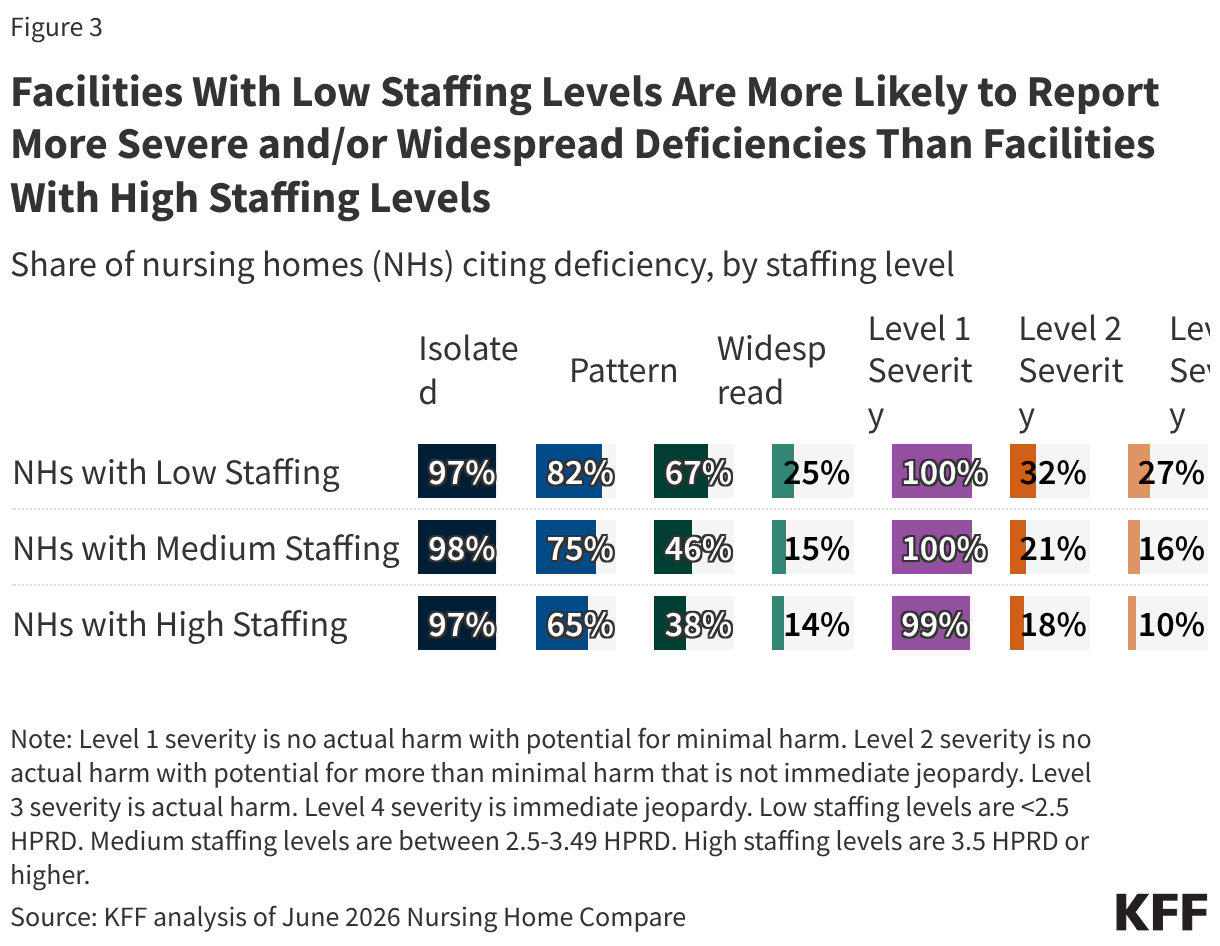
Facilities with low staffing levels are more likely to report more severe and/or widespread deficiencies than facilities with high staffing levels (Figure 3). A higher share of nursing homes with low staffing levels report more severe deficiencies (level 3 or 4) when compared to nursing homes with high staffing levels (32% vs. 18% for level 3 severity; 27% vs 10% for level 4 severity). Nursing homes with low staffing levels are also more likely to report deficiencies that are more widespread or a pattern than nursing homes with high staffing levels (67% vs 38% for widespread; 82% vs. 65% for pattern). For common deficiencies reported by nearly all nursing homes, there is no variation in frequency by staffing level.
Methods
Nursing Home Compare: Nursing Home Compare is a publicly available dataset that provides a snapshot of information on quality of care and key characteristics for approximately 14,600 Medicare and/or Medicaid-certified nursing homes. The data in this analysis was downloaded in June 2026.
Deficiency Data in Nursing Home Compare: This analysis used the health deficiency dataset from June 2026. These data include information on the nursing home that received the deficiency, the associated inspection date, tag number and description, scope and severity, the current status of the citation, and the date that the deficiency was corrected (if applicable). Data are presented as one deficiency per row and nursing facilities can have multiple rows. The original dataset included a list of 418,000 deficiencies. KFF filtered this list by those deficiencies that were identified in a nursing home’s most recent survey, which filtered the dataset to approximately 137,000 deficiencies. Survey dates for these deficiencies ranged from September 2019 to June 2026, though the vast majority (97%) of deficiencies were identified in surveys conducted between January 2024 and May 2026.
Deficiency Examples: KFF reviewed 70 survey reports out of a potential 15,000 survey reports to identify the examples of deficiencies presented in this report. These 70 reports come from a random sample of set of states (Maryland, NJ, Pennsylvania, California, Tennessee, Washington) and a random set of nursing facilities within each state.
Terminology: This analysis, as well as other recent KFF analyses, uses the term “nursing home,” to align with name of the dataset underlying the analysis. Nursing homes include both Medicare skilled nursing facilities and Medicaid nursing facilities.
This work was supported in part by The John A. Hartford Foundation. KFF maintains full editorial control over all of its policy analysis, polling, and journalism activities.