Medicaid covers one-fifth of adults with substance use disorders (SUDs), including many with substantial treatment needs. Inpatient and residential care services are part of the American Society of Addiction Medicine (ASAM) continuum of SUD services. However, long-standing federal law has generally prohibited Medicaid payments for inpatient or residential care services that are provided in Institutions for Mental Disease (IMDs) for adults ages 21 to 64. IMDs include certain psychiatric and substance use treatment facilities with more than 16 beds that are primarily engaged in providing diagnosis, treatment or care for people with mental health or substance use disorders.
Section 1115 demonstration waiver authority for SUD, referred to here as “SUD IMD waivers,” was introduced in 2015 and updated in 2017 to allow states to receive federal Medicaid funds for short-term stays in IMDs to help improve identification of SUD and access to care across the treatment continuum, reduce overdose deaths and avoidable acute care use, build provider capacity, and strengthen care coordination and transitions across levels of care; however, there have also been concerns that expanding Medicaid payment for SUD services provided in IMDs could shift resources toward residential and inpatient care, rather than strengthening community-based SUD services.
As SUD IMD waiver evaluations and renewals are becoming available, states face a shifting Medicaid and policy and waiver landscape. The 2025 Reconciliation Law included historic restrictions in Medicaid financing and coverage that could make it hard to maintain incremental expansions in mental health and SUD benefits. At the same time, other federal efforts, including a recent opinion from the Department of Justice, may affect how care is delivered across settings for some people with SUD, including some experiencing homelessness, following decades of policy aimed at expanding access to community-based care for people with mental health conditions or SUD, when appropriate. This brief examines findings from the first available summative evaluations (due 18 months after the end of the demonstration) for SUD IMD waivers and what they show about progress toward meeting goals and milestones.
Key Takeaways:
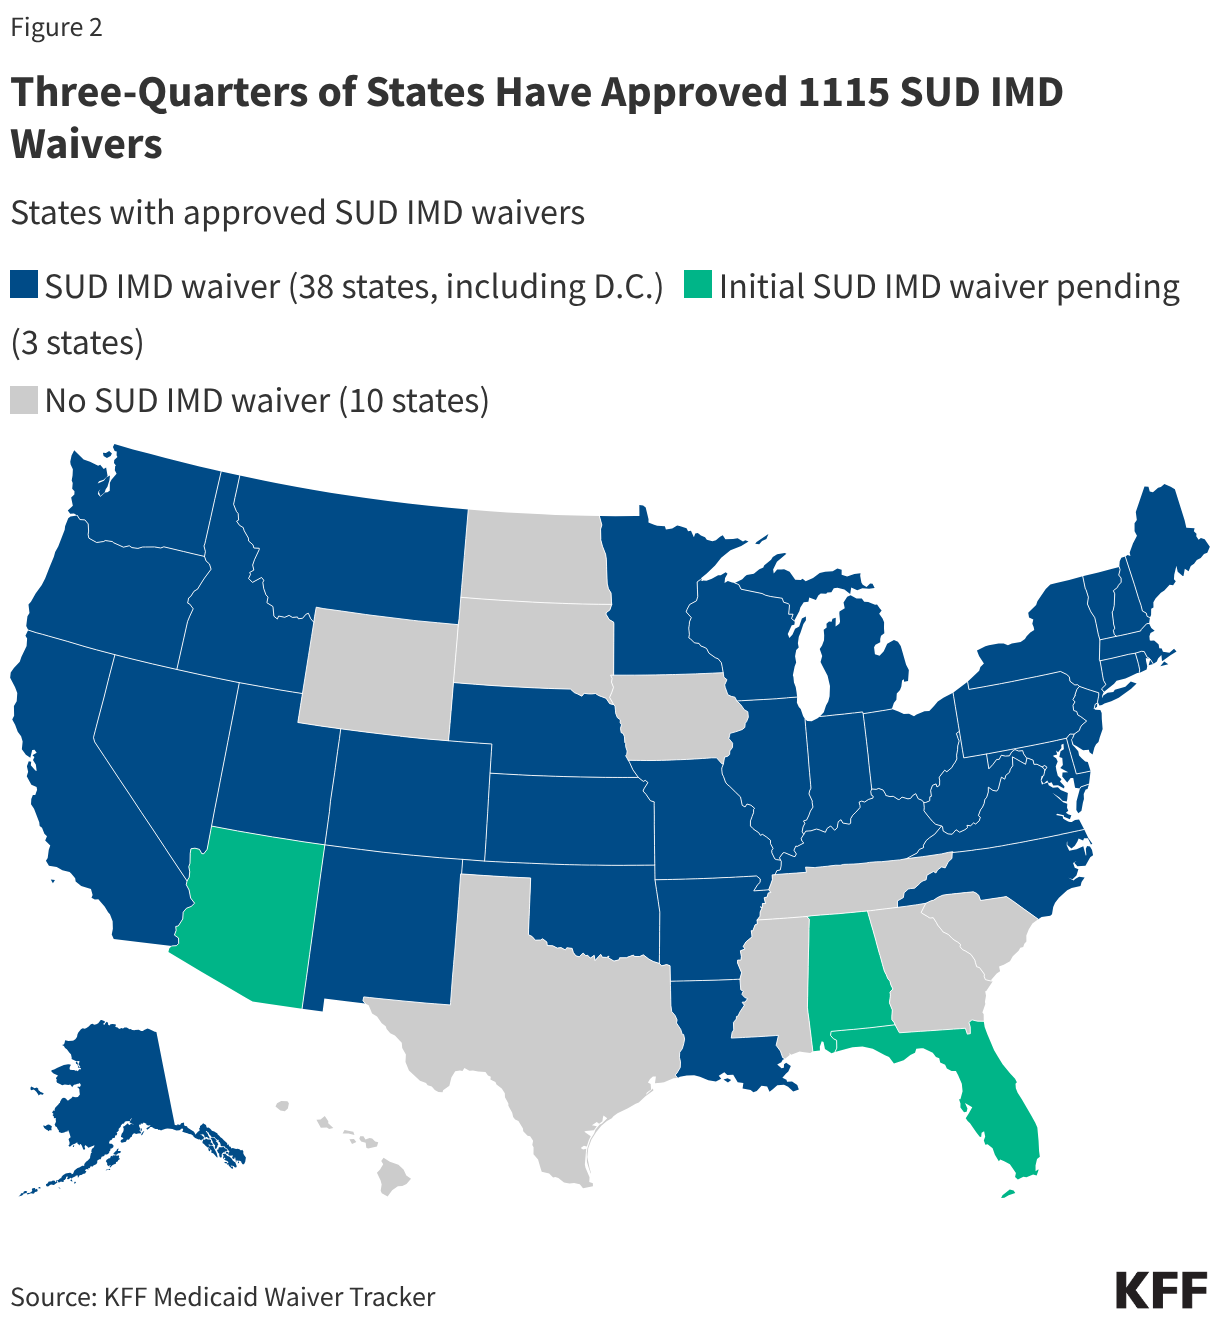
- SUD IMD waivers, a common Medicaid pathway for covering short-term residential and inpatient SUD treatment in IMDs, have been adopted by 38 states (including D.C.). Federal SUD IMD authority began in 2015 (updated in 2017)to allow states to use Medicaid funds for short-term residential and inpatient SUD treatment in facilities that were previously excluded from federal reimbursement. As of April 2026, 38 states, including D.C. had approved SUD IMD waivers, three more had applications pending, and at least 20 had received Centers for Medicare and Medicaid Services (CMS) approval for five-year extensions. Most initial waivers were approved between 2016 and 2020, with most demonstrations running five years.
- As of April 2026, six states (CA, IN, NH, WA, UT, and MA) had completed summative evaluations, which are due 18 months after the state’s SUD IMD waiver demonstration period ends. To assess progress, states are required to develop evaluation designs with specific research questions, hypotheses, and methods. Although states follow federal guidance, evaluation plans emphasized different priorities and relied on different measures, data sources, and methods. Most used Medicaid claims data, stakeholder interviews, and survey data.
- Early evaluation findings point to improved SUD treatment access across multiple measures although the pandemic and other intervening issues make isolating waiver findings challenging. Summative evaluations generally suggest increases in SUD residential and inpatient care, along with growth in community-based care or capacity and increased access to medications for opioid use disorder. Most states reporting SUD-related emergency department use found decreases, and some reported improved follow-up after ED visits or discharge from residential or inpatient care, though follow-up rates often remained relatively low. However, evaluation periods often overlapped with major disruptions in SUD treatment need, service delivery, and Medicaid policy, including the COVID-19 pandemic, the fentanyl-driven rise in overdose deaths, and concurrent state Medicaid changes, making it difficult to isolate waiver effects. In addition, evaluations varied in their measures, detail, and focus, limiting the ability to compare across states or draw consistent conclusions about quality and outcomes.
- Evaluations pointed to challenges, including workforce or infrastructure shortages, administrative barriers, and housing instability, that may have affected waiver outcomes. These included workforce shortages, fragmented and uneven treatment systems, administrative barriers, and housing instability, with each of these areas reported across multiple evaluations. Fragmentation and gaps in treatment infrastructure made care transitions harder, while housing instability often made it difficult for patients to sustain recovery after discharge.
What is an IMD and the IMD payment exclusion?
IMDs are specialized behavioral health facilities that provide residential or inpatient treatment (Figure 1). In Medicaid, an Institution for Mental Diseases, or IMD, is an administrative category for a hospital, nursing facility, or other institution with more than 16 beds that is “primarily engaged in providing diagnosis, treatment, or care of persons with mental diseases, including medical attention, nursing care, and related services” (42 U.S.C. § 1396d(i)). IMD status is based on facility type, the population type served, and its size. The IMD status is determined by the state. Although IMDs tend to overlap with higher levels of care, the clinical intensity of SUD treatment is generally described using frameworks such as the American Society of Addiction Medicine (ASAM) criteria, which do not determine whether a facility is an IMD. Other SUD care settings include outpatient treatment services, specialty outpatient services, and emergency and crisis services, which are not subject to the IMD payment exclusion (Figure 1). State Medicaid programs cover a range of services and states have expanded these services in recent years.
Figure 1
While all states are required to cover inpatient hospital services, federal Medicaid law generally excludes IMD services for adults 21 to 64, a policy known as the “IMD payment exclusion.” Since Medicaid’s inception, federal law has generally prohibited states from using Medicaid funds for services provided to nonelderly adults in IMDs (§1905(a)(30)(B) of the Social Security Act [SSA]). The IMD payment exclusion was intended to leave states with the primary responsibility for financing inpatient or residential behavioral health services. While all states that choose to participate in the Medicaid program must cover inpatient hospital services, those services specifically exclude care provided in IMDs for adults ages 21 to 64. The payment exclusion applies to services provided within an IMD as well as to services provided outside an IMD while a nonelderly adult is still a patient of an IMD. In recent years, the federal government has provided new mechanisms for states to receive federal matching funds for IMD services for adults 21 to 64 in certain situations. There are now four options for states to cover these services. See Box 1 for exceptions to the IMD payment exclusion.
Box 1. Four exceptions allow states to cover SUD services at IMDs:
Section 1115 IMD waivers: States may receive federal Medicaid matching funds for short-term IMD stays when that coverage is part of a broader continuum of mental health or substance use care. Section 1115 IMD waiver demonstrations typically last five years and require states to meet specified goals, milestones, and evaluation requirements (see Box 2). This authority began for SUD in 2015 and was updated in 2017 to include more specific demonstration components, such as residential treatment provider qualifications and capacity, opioid prescribing guidelines, access to naloxone, prescription drug monitoring programs, and care coordination between residential and community settings. The revised guidance continues to allow states to use Section 1115 waivers to pay for IMD substance use treatment services and affirms many components of the earlier guidance. For example, it notes that “states should indicate how inpatient and residential care will supplement and coordinate with community-based care in a robust continuum of care in the state” and directs states to “demonstrate how they are implementing evidence-based treatment guidelines.” As of April 2026, 38 states, including D.C. have approved SUD IMD waivers.
Medicaid managed care “in lieu of” authority: States may allow managed care plans to cover IMD services “in lieu of” (ILOS) another covered service or setting when medically appropriate and cost-effective. Federal matching is limited to 15 days per enrollee per month, and the authority applies only to people enrolled in Medicaid managed care. In the FY2022 and FY2023 KFF budget survey, 34 of 39 responding managed care states reported using this authority, most commonly for IMD services.
The SUPPORT Act state plan option: States may receive federal Medicaid matching funds for up to 30 days per year of SUD treatment in IMDs through a state plan option created by the SUPPORT Act of 2018. To use this option, states must meet specified requirements, including coverage of certain outpatient and inpatient SUD services. As of 2023, two states, South Dakota and Tennessee, had adopted the option. It was made permanent in the 2024 Consolidated Appropriations Act.
Disproportionate Share Hospital (DSH) Payments: States use DSH payments to help offset uncompensated care costs in hospitals that serve a disproportionate share of low-income patients, including IMDs. States may direct DSH funds (often lump-sum payments) to IMDs toward uncompensated care in those settings. According to the Congressional Research Service, in FY2023, 34 states made DSH payments to IMDs, and two directed all DSH payments to IMDs.
How many states have SUD IMD waivers, and how are they evaluated?
As of April 2026, 38 states had approved SUD IMD waivers. Three more states had initial SUD IMD waiver applications pending with CMS (Figure 2). At least 20 states had also received CMS approval for five-year extensions of SUD IMD waivers, and additional states have submitted five-year extension requests (data not shown).
SUD IMD waivers are intended to expand access to the full SUD treatment continuum, including residential and inpatient services provided in IMDs, and to improve outcomes. CMS established six goals and six milestones for these waivers, covering areas such as treatment access, placement standards, provider capacity, and care coordination (See Box 2). States are required to track progress through independent evaluations, including an interim evaluation report, due one year before the demonstration ends and a summative evaluation report due 18 months after it concludes.
Box 2. CMS Goals and Milestones for SUD IMD Waivers
Goals:
- Increased rates of identification, initiation and engagement in treatment for OUD and other SUDs
- Increased adherence to and retention in treatment for OUD and other SUDs
- Reductions in overdose deaths, particularly those due to opioids
- Reduced utilization of emergency departments and inpatient hospital settings for OUD and other SUD treatment where the utilization is preventable or medically inappropriate through improved access to other continuum of care services
- Fewer readmissions to the same or higher level of care where readmission is preventable or medically inappropriate for OUD and other SUD
- Improved access to care for physical health conditions among beneficiaries with OUD or other SUDs
Milestones:
- Access to critical levels of care for OUD and other SUDs
- Widespread use of evidence-based, SUD-specific patient placement criteria
- Use of nationally recognized, evidence-based, SUD program standards to set residential treatment provider qualifications
- Sufficient provider capacity at each level of care, including MAT
- Implementation of comprehensive treatment and prevention strategies to address opioid abuse and OUD
- Improved care coordination and transitions between levels of care.
Note: OUD is opioid use disorder. MAT refers to medication-assisted treatment, the term CMS used. Later in this brief, MOUD refers to medications for opioid use disorder.
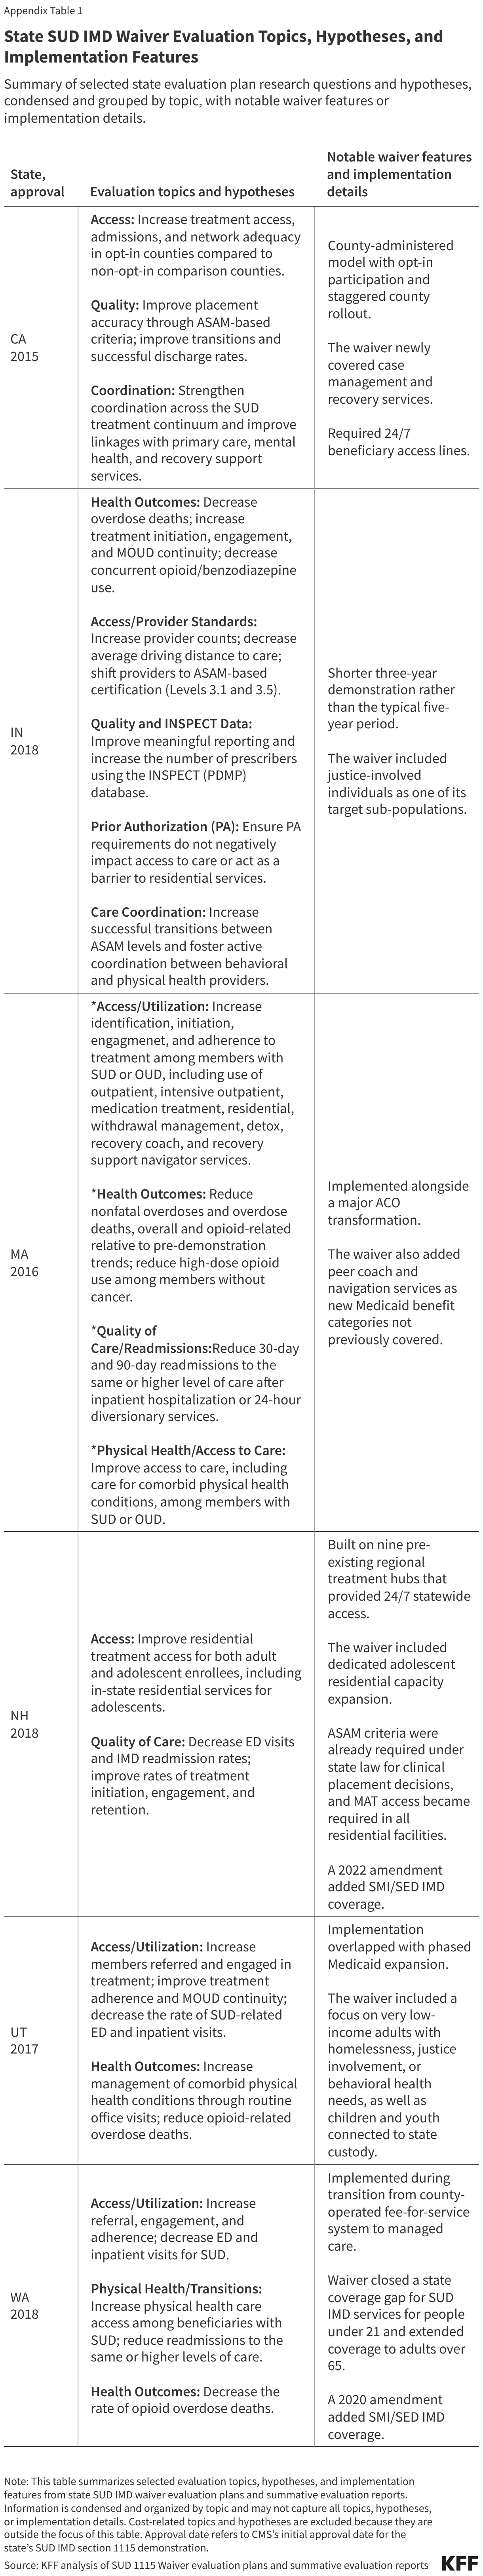
To assess progress, states must develop evaluation designs with specific research questions, hypotheses, and methods. Although all states follow federal guidance in evaluation designs, state evaluation plans can emphasize somewhat different priorities. For example, New Hampshire included a specific focus on adolescent access to residential care networks, and California’s plan factored in its unique county-level behavioral health delivery model. States also organized their evaluation topics differently. Some grouped measures under broad areas such as “access” and “quality,” while others grouped measures more closely to the CMS-enumerated goals and milestones (Box 2) or led with more state-specific questions and priorities. Appendix Table 1 summarizes state-level evaluation topics, hypotheses, and implementation features.
As of April 2026, six states have summative evaluations of SUD IMD waivers: California, Indiana, New Hampshire, Utah, Washington, and Massachusetts. Evaluations rely primarily on Medicaid administrative claims data, stakeholder interviews, and survey data to assess impact. Evaluation methods vary across states, with some relying on descriptive pre-post analyses and others using more rigorous methods designed to control other factors that may contribute to observed changes over time.
What are the key findings from the SUD IMD waiver summative evaluations?
The six summative evaluations are the most comprehensive assessments available for the SUD 1115 waiver demonstrations, but overlapping factors such as COVID-19, the opioid epidemic, and various state policy changes mean the findings are best read as directional signals within an emerging evidence base rather than isolated estimates of waiver impact. This analysis focuses on a limited set of CMS goals and milestones (CMS goals 1, 3, 4, and 5 and milestones 1, 4, and 6) because they were most consistently reported, most directly tied to SUD/OUD treatment access, utilization, care transitions, and overdose outcomes. The analysis excludes goals and milestones that primarily reflect implementation standards or were not reported consistently enough to support synthesis. Appendix Table 1 summarizes states’ evaluation topics as well as notable waiver features and implementation details.
Cross-state comparisons are limited by differences in evaluation design, measures, baseline SUD treatment capacity, waiver implementation, and broader state context. Though states use a variety of data and analytic methods, this summary does not weigh or assess research methods and draws from both raw and adjusted findings across evaluations. All states used claims data, and most also included survey and/or qualitative findings, but most lacked a comparison group. Timeliness is another challenge, as summative evaluations are due 18 months after the demonstration ends, and some expected demonstrations are not yet readily available through CMS materials. Most evaluation periods coincided with major disruptions in SUD treatment need, service delivery, and Medicaid policy, including the COVID-19 pandemic, the fentanyl-driven escalation in overdose deaths, and concurrent state Medicaid changes, making it difficult to isolate waiver effects. As a result, findings are not interpreted as causal or directly comparable across states; they are best understood as directional signals that contribute to an emerging evidence base on how SUD IMD 1115 waivers may affect access and outcomes.
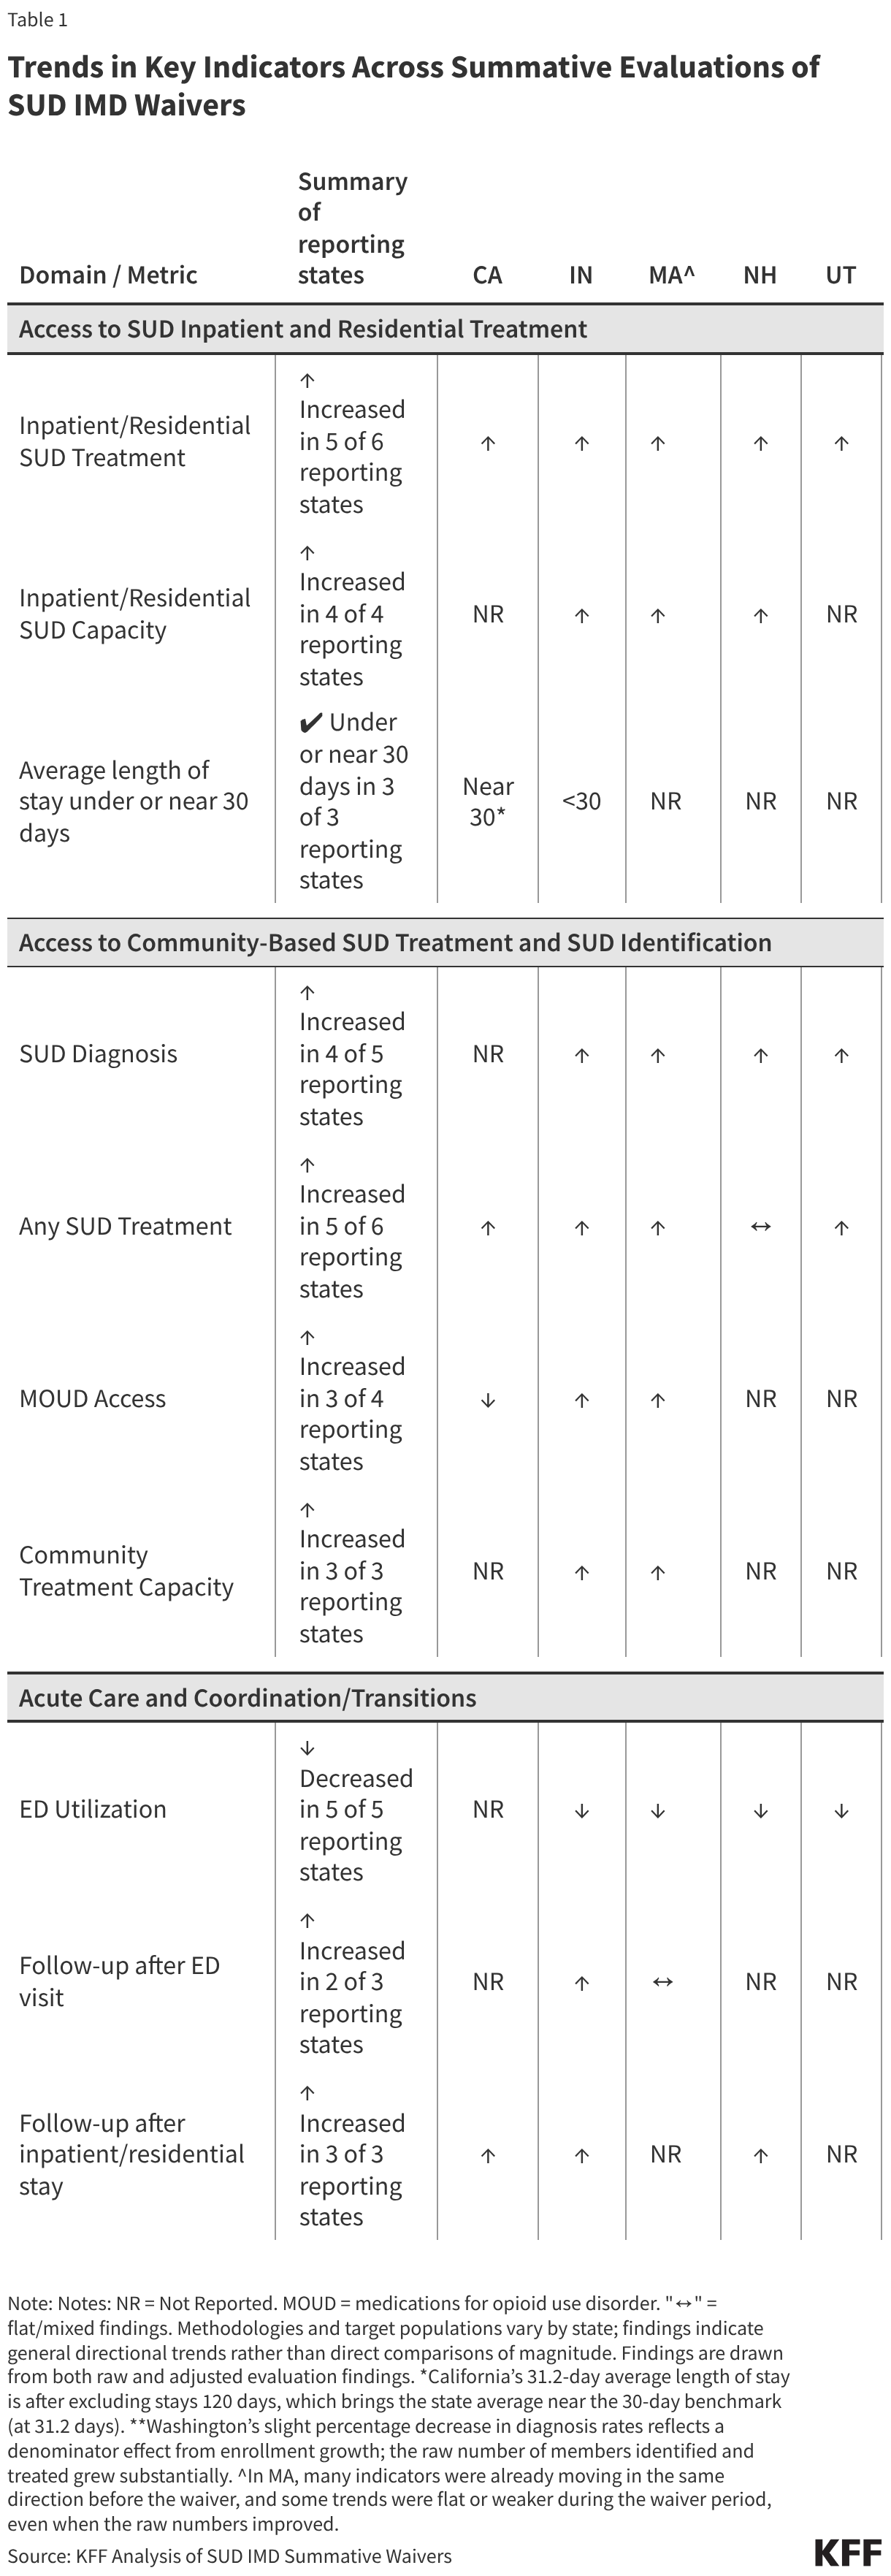
Evaluations generally showed increased use of inpatient and residential SUD treatment, with some evidence of expanded treatment capacity. SUD IMD waivers expanded access to the full treatment continuum, including coverage for inpatient and residential SUD services provided in an IMD. Measures in this section were reported in some form by all states and were commonly used as indicators of access to IMD care. While average length of stay was not typically identified as a central outcome in state evaluation plans, it is included below as an additional utilization measure.
- Inpatient and Residential SUD Treatment: Inpatient or residential treatment utilization increased in five of the six states reporting this measure (CA, IN, MA, NH, and UT). These findings point to greater use of IMD services under the waivers, which was previously limited by the IMD exclusion. Massachusetts reported large increases in newly covered residential rehabilitation services, with average quarterly utilization substantially higher in the second measurement period than the first. California also reported large increases, with the number of unique patients in waiver counties using residential services rising 400% above non-waiver counties. Though SUD treatment rates in Washington IMDs were unchanged, key informants reported that the waiver helped them connect patients to treatment during their “window of willingness,” when motivation may be higher after first presenting for care. They also noted that the waiver may have been particularly helpful for nondisabled, single men, who were often lower on the priority list for treatment.
- Inpatient and Residential SUD Capacity: Inpatient or residential treatment capacity increased in all four states reporting data (IN, MA, NH, and WA). While the evaluations do not show whether states reached sufficient capacity, the findings suggest progress toward expanding capacity for this type of care. In Indiana, the number of residential SUD providers grew from none at the start of the demonstration to 55 by the end. New Hampshire also reported net growth overall, although some facilities closed in the fourth year of the demonstration. Washington reported growth in the number of SUD treatment facilities and Massachusetts reported growth in residential beds.
- Average Length of Stay (ALOS): Early SUD waivers approved under 2015 guidance often included maximum length of stay limits of 30-days for residential and 15-days for inpatient IMD stays. CMS guidance updated in 2017 instead established a statewide average length of stay of 30 days as a performance monitoring target for residential SUD services in IMDs, intended in part to ensure that IMD services did not displace community-based care. Under this approach, longer stays for some individuals could be offset by shorter stays for others. In the three states reporting this measure (CA, IN, and WA), the ALOS was under or near the 30 days performance target. Indiana’s was well below that target at 4.7 days, though qualitative findings from enrollees raised concerns that stays may be too short to support transition and recovery. California’s average was slightly above the 30-day target, at 31.2 days after excluding extreme outliers. These findings suggest that for states reporting ALOS, average lengths of stay were generally close to waiver targets, but they do not show whether the length of stay was clinically appropriate for all patients.
Evaluations generally showed increases in SUD diagnosis and treatment access, as well as some evidence of expanded community-based treatment capacity. In addition to expanding access to IMD-based care, the waivers were also intended to strengthen access across the broader SUD treatment continuum, including outpatient treatment and evidence-based care for OUD. Community-based treatment, capacity, and medication for opioid use disorder (MOUD) measures reported in this section were often included in state evaluations and aligned with CMS goals and milestones. This analysis uses MOUD to refer to medication-based OUD treatment measures, including measures that state evaluations described as medication-assisted treatment (MAT). Though diagnosis was not explicitly identified in most evaluation plans, it is included below because it was reported by most states and may suggest progress toward improved identification of SUD.
- Diagnosis: Four of the five states reporting measures of SUD diagnosis (IN, MA, NH, and UT) showed increases. Utah reported the largest growth, with a 67% increase in SUD-only diagnoses, though this increase coincided with the state’s ACA Medicaid expansion. Indiana and New Hampshire also reported increases, though more modest at 23% and 11%, respectively. Massachusetts reported a modest increase in the number of members with SUD diagnoses, though the number with an OUD diagnosis declined, which may be due to data challenges. Diagnosis measures varied across states, with some states, including New Hampshire and Washington, requiring both a diagnosis and service use. Increases in SUD diagnoses may reflect increases in treatment use, since a diagnosis is typically recorded when a treatment claim is submitted. Some of the increases may also reflect the period during the pandemic when Medicaid disenrollments were paused and people retained coverage and access to treatment services.
- Any Treatment: Five of six states (CA, IN, MA, UT, and WA) showed increases in treatment use or initiation. These findings generally point to improved treatment access, but the measures differed across evaluations. Indiana reported a 52% increase in enrollees receiving any treatment, while Utah reported a 160% increase in the number receiving treatment. Utah’s unmet needs for SUD treatment decreased, relative to a synthetic control group. In addition to increases in any SUD treatment, Washington also reported increases in treatment initiation, rising by 8.7 percentage points relative to baseline. Massachusetts reported higher outpatient SUD utilization among members with SUD and OUD that remained above baseline, though use declined somewhat overtime and the OUD growth was weaker than the pre-waiver trend. New Hampshire’s evaluation measured whether treatment was initiated and sustained after a new SUD diagnosis, and findings were more mixed. Treatment initiation, defined as initiating treatment within 14 days of diagnosis, declined in later demonstration years, while treatment engagement (two or more SUD visits within 34 days of initiation visit) increased substantially, ending 30% above baseline in year five.
- Access to Medications for Opioid Use Disorder (MOUD): MOUD is a core part of OUD treatment and is recommended for most people with OUD. Of the three FDA-approved MOUD medications, buprenorphine and naltrexone can be prescribed, while methadone is available only through federally certified Opioid Treatment Programs (OTPs). Three of four states reporting this measure (IN, MA, and WA) showed increases in MOUD treatment. In Massachusetts, the share of members with OUD using medication treatment increased from an average of 32% each quarter during the baseline period to 43% by the final quarter of the evaluation period, though this growth was already underway before the waiver. The number of MOUD users in Indiana increased from about 6,000 before the demonstration started to over 15,000 during it, a 156% increase, though this acceleration was not different from the growth trend already underway before the waiver took effect. California reported a net decline, as decreases in methadone use during the pandemic were not fully offset by increases in buprenorphine use, likely because methadone treatment depended on frequent in-person visits. Though New Hampshire did not include a quantitative MOUD measure, most respondents to its SUD residential provider survey reported that medications were accessible to Medicaid members when needed. Some state metrics include medications used to treat alcohol alongside opioid use disorder medications.
- Community-Based Treatment Capacity: All three states reporting community-based or outpatient treatment capacity measures (IN, MA, and WA) described growth in outpatient treatment infrastructure, although they used different measures. Indiana reported growth in SUD outpatient and MOUD-related providers identified through claims data. Using national survey data, Indiana found that the share of all SUD facilities accepting Medicaid increased from 60% to 78%. Massachusetts also reported growth in MOUD provider capacity compared to baseline, though the growth rate was similar to the baseline period. Washington reported large increases in outpatient SUD providers, from 515 to over 9,500, which coincided with shifts from county-based to managed care delivery. California did not report quantitative measures, but county administrators attributed quality of care improvements to a stronger continuum of care and expanded provider networks, which they said made it easier to match patients to appropriate levels of care. Workforce shortages and uneven geographic access remained common constraints.
Evaluations also point to declines in SUD-related ED use, and some improvement in SUD follow-up after acute care. The measures presented in this section were commonly included in state evaluations, though states framed these measures differently, sometimes included as access measures and others as measures of quality. These measures also align with waiver goals to reduce preventable ED use and preventable readmissions through improved access to other services, along with the CMS milestone focused on care coordination and transitions between levels of care.
- ED Utilization: All five states reporting this measure (IN, MA, NH, UT, and WA) showed declines in SUD-related ED utilization over the demonstration period. These findings suggest that ED utilization decreased in waiver states, which may be related to greater availability of other SUD services and could also reflect overall drops in ED utilization during COVID years. Washington also reported declines in ED visit rates per 1,000 members. Indiana was the only state to assess "potentially preventable" ED visits and found that, although overall SUD-related ED use declined, the share categorized as potentially preventable remained stable.
- Care Transitions After ED Use: Follow-up after ED visits for SUD improved in two of three reporting states (IN and WA). Indiana and Washington showed increases in follow-up care after ED visits for SUD, though rates remained relatively low, at 40% in Washington within 30 days of an ED visit and 10% in Indiana within 7 days. Improved care transitions after an ED visit may support continued treatment engagement. In Indiana, the percentage of enrollees with a follow-up within 7 days increased from 7% to 10%. Washington reported a five-percentage point increase in follow-up care within both 7 and 30 days after an ED visit for SUD. California did not report comparable follow-up measures, though county administrators described stronger ED-to-treatment linkages where EDs used navigators. In Massachusetts, there was little overall change in follow-up after ED visits.
- Care Transitions After Residential or Inpatient Treatment: All three states reporting post-discharge measures (CA, IN, and NH) showed improved transitions or follow-up after residential or inpatient care. Increases in transitions to lower levels of care after discharge may support ongoing treatment. California reported an increase in transitions from residential/inpatient to outpatient settings, from about 7% to 10%. Indiana reported greater use of community-based services and MOUD after discharge, with MOUD increasing from 29% to 44% post-discharge in 2020 — and other community-based services increasing from 82% to 93% post-discharge. New Hampshire reported higher follow-up treatment rates at multiple post-discharge intervals
Evaluations do not support clear cross-state conclusions about overdose outcomes. States used different overdose measures, populations, and time periods, and some did not report overdose outcomes at all, which may reflect differences in evaluation plans. For example, California reported fentanyl-related overdose deaths, Indiana and Massachusetts reported Medicaid-specific overdoses, and Washington reported overall overdose deaths that were not limited to Medicaid, while New Hampshire and Utah did not report overdose findings in their summative evaluations. Among states reporting overdose deaths, deaths generally increased. Massachusetts reported nonfatal opioid overdoses and found that nonfatal opioid overdoses declined somewhat, while fatal overdose death rates remained flat among Medicaid enrollees were mostly flat overall but began to decline by the end of the demonstration period. It is difficult to determine how much of any observed overdose change was due to the SUD IMD waiver versus broader conditions during the evaluation period, including the COVID-19 pandemic and the rapid fentanyl-driven rise in overdose deaths.
What challenges were noted in waiver evaluations?
Evaluations pointed to challenges and barriers that may have affected waiver outcomes. These were drawn primarily from key informant interviews, stakeholder surveys, and focus groups, as well as evaluator observations and provider survey data. Not all challenges were reported from every evaluation, and the depth of qualitative reporting varied across states.
Workforce shortages limited access across the treatment continuum. Across several evaluations, states cited shortages of SUD providers as a key constraint on treatment capacity, particularly for certain specialty services and geographies. California reported gaps in youth treatment services. Key informants in Washington pointed to shortages of licensed behavioral health professionals and cited low reimbursement and complex licensing and credentialing processes as contributing barriers. Utah stakeholders described similar challenges and noted that these barriers may make Medicaid participation more difficult for smaller providers with limited administrative support. Indiana also cited structural limits, noting that state caps on the number of opioid treatment programs constrained access to methadone.
Fragmented systems and uneven treatment infrastructure made care transitions harder. Across multiple evaluations, stakeholders described fragmentation when benefits are split across health plans or systems and when certain types of treatment are in short supply, making it harder to connect people to outpatient treatment after crisis or inpatient care. In California, stakeholders described mental health and SUD treatment as separate systems with different financing and rules that can slow referrals across systems, likely complicating coordination of care across mental health and substance use treatment. Utah stakeholders described similar barriers when physical and behavioral health benefits are split across separate plans. One plan described this fragmentation as creating a “black hole of care coordination,” where enrollees can lose connection to care as responsibility shifts across plans. Washington cited limited discharge information and regional gaps in outpatient capacity as drivers of uncertain handoffs, and Indiana similarly reported difficulty finding appropriate follow-up care close to home after discharge.
Administrative barriers discouraged provider participation and could delay care. Across evaluations, three issues often surfaced: unclear billing and documentation rules, burdensome provider enrollment and credentialing, and delays tied to prior authorization. In California, administrators estimated that about half of case management services initially went unbilled because requirements were unclear, leading the county to absorb costs rather than navigate the unclear billing processes. Across multiple states, burdensome provider enrollment and credentialing processes were cited as deterrents to provider participation. Indiana and Washington further noted that prior authorization (PA) could delay care, especially when requirements were complex or when interpretations varied across managed care plans. For example, even after Indiana introduced a universal PA form, providers reported continued variation across plans in medical necessity interpretations, documentation requirements, and review processes, increasing burden for providers contracted with multiple plans.
Housing instability made it harder to sustain recovery after discharge. Multiple evaluations described homelessness or unstable housing as common among people in SUD treatment. Providers and other stakeholders noted that patients discharged to unstable environments often regressed quickly. Utah clinicians described feeling "helpless” to prevent negative outcomes without stable housing and reported “downward spirals” that could lead to re-hospitalization or overdose. Evaluations in California, Indiana, and Utah also noted that many people leaving residential care lacked appropriate step-down options, such as recovery residences or transitional housing.