Limiting Private Insurance Reimbursement to Medicare Rates Would Reduce Health Spending by About $350 Billion in 2021

Published: Mar 1, 2021

Executive Summary

The cost of health care is becoming less affordable for both privately insured individuals and employers who offer health insurance coverage. Long-standing concerns about high and rising health care costs in the United States have been recently exacerbated by the COVID-19 pandemic, which has increased financial pressure on many employers and individuals and led to record unemployment, furloughs and reduced wages.1  A large body of research has documented that private insurers pay higher prices than Medicare and that this gap is growing. Health care spending in the United States is nearly double the average amount spent by other high-income countries on a per-person basis without clear evidence that the overall quality of care is proportionately higher in the United States. This disparity is driven largely by higher health care prices across the United States. Reducing the prices private insurers pay for health care services could help alleviate the financial burden of health care for employers and individuals with private insurance. However, doing so would reduce revenue for hospitals and other health care providers, with uncertain effects on patient care.

In this analysis, we use data from MarketScan and FAIR Health2  to estimate the total annual reduction in health care spending by employers and privately insured individuals that would result from having private insurers reimburse hospitals and other health care providers at Medicare rates. A variety of policy levers could be used to move the health system in this direction, including Medicare for all, a public option, or regulatory controls over private prices. Our estimate illustrates the extreme of what could be accomplished in terms of reductions in spending; smaller reductions would be achieved if private sector health care prices were reduced to some multiple of current Medicare rates or if lower rates were phased in gradually. We discuss but do not model the potential effects of price reductions on the supply of services, utilization of health care services, or quality of health care. We also do not estimate the effects on tax obligations for individuals or employers, nor quantify the impact of this change on the federal budget or the Medicare program. For additional information about our approach, see the methods appendix and limitations section of this report.

With ongoing interest in proposals to address the burden of health care costs for individuals and employers—including options that align private insurance rates more closely with Medicare rates—our analysis illustrates the potentially substantial decrease in health care spending that would come from lowering private insurance rates to align more closely with Medicare levels.

Our analysis finds:

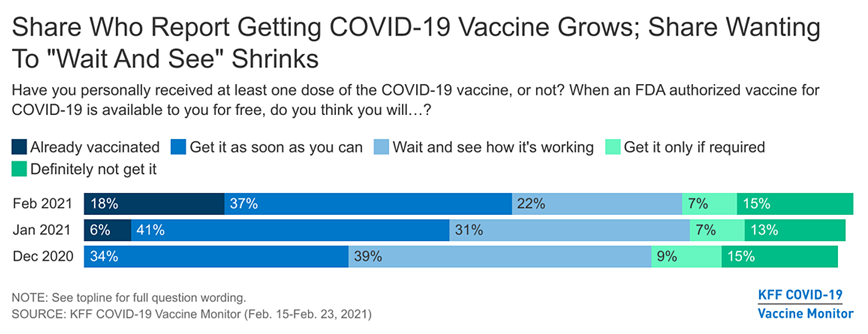
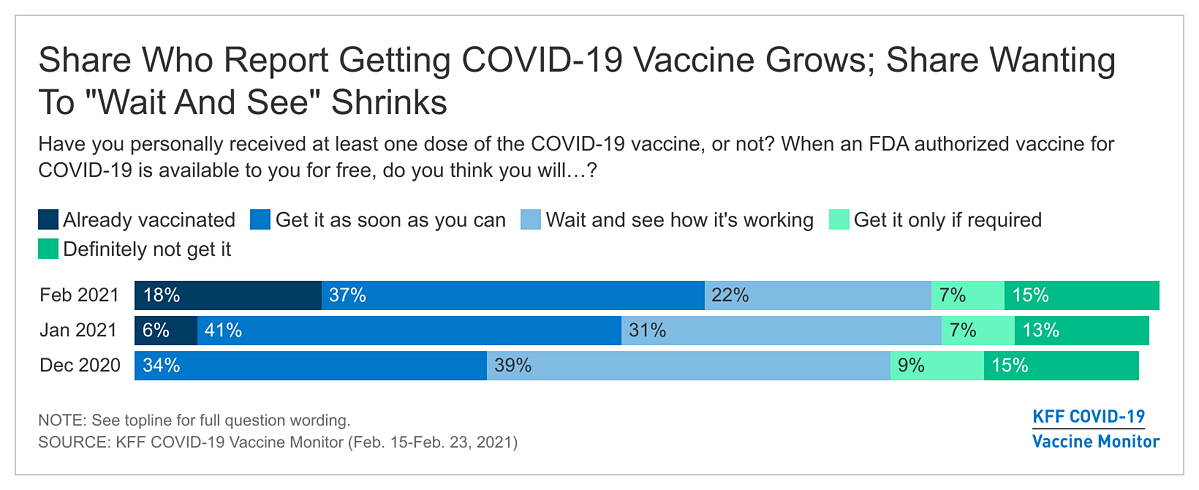
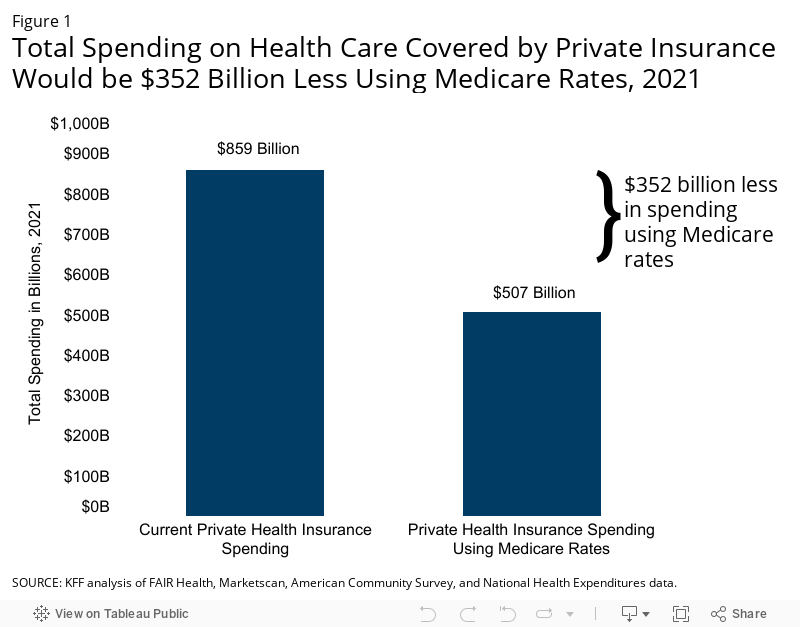
  • Total health care spending for the privately insured population would be an estimated $352 billion lower in 2021 if employers and other insurers reimbursed health care providers at Medicare rates. This represents a 41% decrease from the $859 billion that is projected to be spent in 2021.
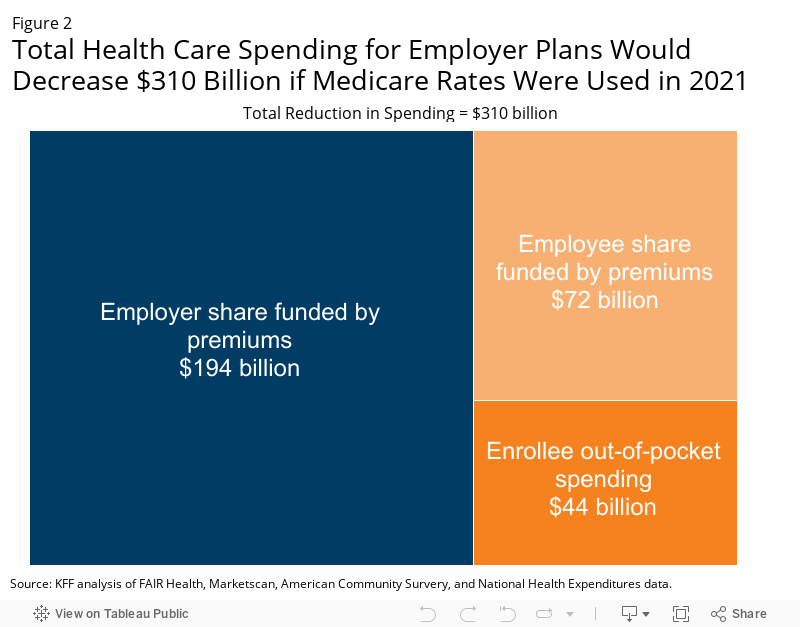
  • Aggregate employer contributions toward employee premiums would decrease by about $194 billion, assuming employers’ share of premiums stays constant after private rates drop to Medicare levels.
  • Employees and their dependents would spend at least $116 billion less for health care, through a combination of lower premiums and out-of-pocket spending. The reduction in federal and individual spending on health care for an estimated 19 million people in the non-group market would total $42 billion.
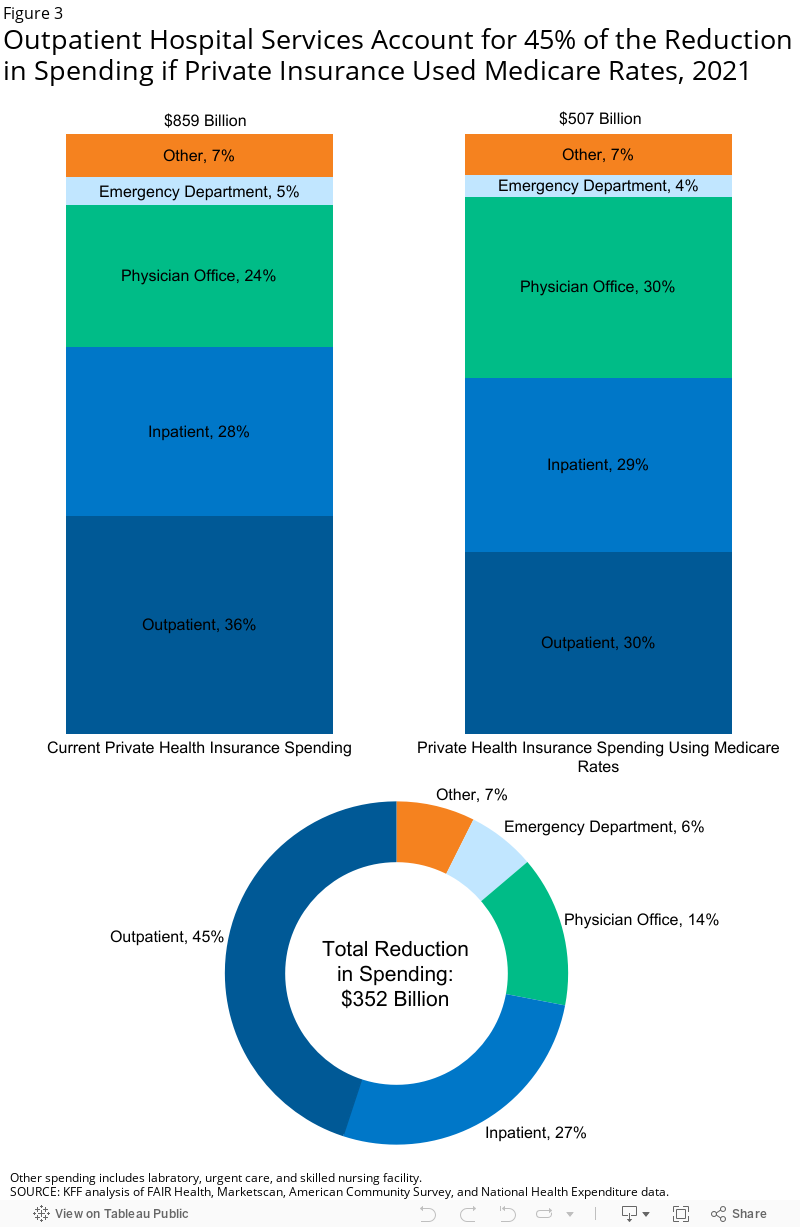
  • Nearly half of the total reduction in spending (45%) would be for outpatient hospital services, due in part to high private rates relative to Medicare rates for outpatient care, compared to most other services. Inpatient services account for 27% of the decrease in spending, and physician office visits account for 14% of the decrease.
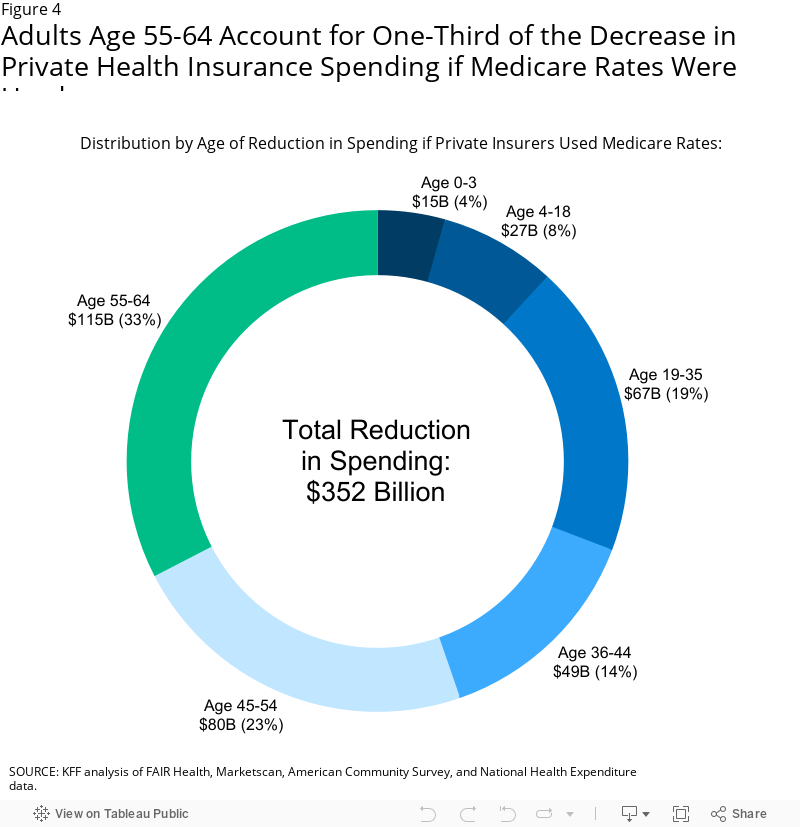
  • Health care spending for privately insured adults ages 55 to 64 would be an estimated $115 billion lower in 2021 if private insurers used Medicare rates—this is one third of the estimated total reduction in spending. The proportion of the decrease in spending attributable to adults 55 to 64 is roughly equivalent to their share of current spending.

A detailed description of our data and methodology is discussed in the appendix of this brief. Our estimates of spending reductions are sensitive to assumptions, such as the current ratio of private-to-Medicare rates by service and market area. In addition, the estimates are sensitive to policy choices, such as whether private insurance payments should be adjusted to Medicare levels, or a higher ratio. We discuss the potential impact of these assumptions on our results in the limitations section.

Issue Brief

Introduction

The United States spends nearly twice as much as much per person on health care as comparable countries, and much of this is driven by higher prices paid by private health insurers.3  The high and rising cost of private health care has led to premiums and deductibles for employer-sponsored coverage growing faster than wages and general inflation. A large body of research has documented that private insurance pays higher prices than Medicare pays for comparable services, and that gap is growing. Between 2010 and 2018, Medicare per capita spending grew considerably more slowly than private insurance spending, increasing at an average annual rate of just 1.7% over this time period, while average annual private health insurance spending per capita grew at 3.8%.

Private Insurance Rates: Private insurance accounts for 31% of total health care spending in the United States4  and is subsidized by the federal government through the exclusion of health insurance premiums from taxable income and through ACA marketplace subsidies. High prices paid for health care services covered by private insurance lead to higher premiums and out-of-pocket costs for workers and their families with private insurance, and for employers who contribute to the cost of that coverage. Nationwide, 173 million people under age 65 had private health insurance in 2018, either from an employer plan (154 million) or the non-group market (19 million). Health expenses for employers are rising more rapidly than other prices and are consuming a growing share of total compensation. This dampens wages and may negatively impact the recovery of the job market.5 

Prices paid by private insurance are largely dictated by market conditions—with providers commanding higher prices when they have more leverage in negotiations with private insurers. Provider consolidation has increased the number of markets where providers have the upper hand in these negotiations.6  While there have been some anti-trust enforcement actions in health care, health care mergers have continued and the share of health care markets with highly concentrated providers has increased.7  Increasing consolidation and rising prices for health care raise questions about whether private insurers, third party administrators and employers who offer insurance are able to control increases in health care prices.

Medicare Rates: Medicare typically reimburses hospitals and other health care providers at lower rates than private insurance. Providers generally must agree to accept the established payment rates in order to participate in Medicare, and (with the exception of a few more specialized providers, such as psychiatrists) virtually all providers are either unable or unwilling to forgo participation in Medicare. Over the years, Congress has made changes to Medicare payment systems to manage program spending and encourage providers to operate more efficiently. This has also helped to slow the growth in premiums and other costs for beneficiaries. The Medicare Payment Advisory Commission (MedPAC), an independent congressional agency, makes recommendations to Congress on Medicare payment policy, and monitors access, quality and other beneficiary issues.

MedPAC has found that “the vast majority of [Medicare] beneficiaries report being satisfied with their care, describe using an appropriate usual source of care, and report no trouble accessing timely care.”8  Compared to adults 50 to 64 with private insurance, Medicare beneficiaries age 65 and older were more likely to report being very or somewhat satisfied with the overall quality of their care (87% vs 80%).9  Despite lower payment rates for physicians from Medicare than private insurance, Medicare beneficiaries are less likely than people with private insurance to report problems finding a new doctor.10  Medicare beneficiaries also report forgoing medical care at similar or lower rates than older adults (50-64) with private insurance. However, it is not clear if or how lowering private insurance reimbursement to Medicare rates would impact access and quality for people with Medicare or private insurance.

Policy Context. Over the years, federal and state lawmakers have proposed using Medicare rates to rein in health care prices. While some of this has been in the context of discussions of switching to a Medicare for all system or a public option, Medicare rates have been used in other contexts as well. Most recently, the Department of Health and Human Services specified that Medicare rates would be used to reimburse providers for care for uninsured COVID-19 patients and to set reimbursement for out-of-network COVID-19 vaccine administration.11  Washington State settled on a multiple of Medicare rates,160%, as part of a negotiated compromise in establishing a public option.12  In the state of Maryland, instead of using Medicare to set private insurance rates, the state created a Health Services Cost Review Commission that sets hospital rates for all hospital patients (regardless of insurance) according to an all-payer rate setting system. Maryland’s system also allowed the state to take steps to increase payments from all payers to hospitals to help stabilize their financial health during the COVID-19 pandemic.13  With or without a public option, legislation at the federal or state level could limit the prices health care providers charge private insurers while retaining other aspects of the private health insurance system, as in an all-payer rates setting system.

Any proposals to limit private insurance reimbursement would undoubtedly be met with fierce opposition from health care providers, since it would decrease their revenue. This phenomenon was illustrated in the recent debate over surprise medical bills when providers successfully prevented the final legislation from using Medicare rates (or a percentage of Medicare rates) as a benchmark for out-of-network reimbursement. Opponents of proposals such as Medicare for all or a public option that adopt Medicare rates argue that a broader use of Medicare rates would cause hospitals to lose money, which could lead to cost cutting that adversely affects the quality of patient care, and potentially spark the closure of some hospitals.14  The Congressional Budget Office (CBO) also has said that, in general, lowering provider reimbursement as part of a single-payer system would decrease the supply of health care.15  At the same time, analysis by MedPAC suggests that efficient providers can either cover their expenses with Medicare rates or could do so with relatively minor (2%) increases in Medicare rates for hospitals.16 

In this brief, we estimate how much less individuals and employers would spend on health care if private insurance reimbursed health care providers at Medicare rates, assuming full implementation in 2021. Our analysis essentially reprices private insurance expenditures at Medicare rates; we do not make assumptions about changes in behavior or health care access or quality that could result from reduced reimbursement from private insurance. Our estimates illustrate the extreme of what could be accomplished in terms of reductions in spending. It is intended to provide a way of thinking about the effects of prices on health care spending, rather than a forecast or prediction, illustrative of the potential magnitude of savings possible from bringing private health care prices in line with Medicare. We do not estimate the impact of such a change on wages or tax obligations, nor do we model the impact on the federal budget or the Medicare program. However, we do broadly consider these issues in the limitations section of our brief. A more detailed description of the data we used and the assumptions we made are in the limitations section of this report and in the methods appendix.

Findings

Our analysis looks at the expected reduction in private health insurance spending that would occur if private insurers used Medicare rates. We estimate the aggregate reduction in spending, the aggregate reduction for employers and individuals with employer-sponsored insurance, the aggregate reduction in spending on services for those in the non-group market, the aggregate reduction by type of service and by age, and the estimated reduction in per-person spending by age group.

Total reduction in spending from using Medicare rates for people with private insurance

Health care spending would decline by more than $350 billion in 2021 if private insurance reimbursed health care providers using Medicare rates. Total spending for the approximately 173 million people under age 65 with private health insurance in our analysis is projected to reach $859 billion in 2021. At Medicare rates, total spending instead would be $507 billion (Figure 1). That $352 billion difference represents a 41% decrease in spending on care for people with private health insurance.

.Estimated reduction in spending for health care covered by employer-sponsored and private non-group health insurance

Of the 173 million people in our analysis with private insurance, 154 million have employer-sponsored coverage and spending on their care totals $757 billion (table 1 and appendix table 1). The remaining 19 million with private coverage are covered in the non-group market. Total spending for that group is about $102 billion in 2021. Full results are in the appendix.

Table 1: Current Spending and Reduction in Spending for Employer-Sponsoredand Private Non-Group Insurance, 2021 ($ Billion)
Number of BeneficiariesCurrent SpendingSpending at Medicare RatesReduction in Spending if Medicare Rates Were Used
Employer-sponsored insurance154 million$757 billion$447 billion$310 billion
Employer share funder by premiums $474 billion$280 billion$194 billion
Employee share funded by premiums $175 billion$103 billion$72 billion
Out-of-pocket costs $107 billion$63 billion$44 billion
Private non-group insurance19 million$102 billion$60 billion$42 billion
Total173 million$859 billion$507 billion$352 billion
NOTE: Results do not include changes in administration costs or loading fees.SOURCE: KFF analysis of FAIR Health, MarketScan, American Community Survey, and National Health Expenditures data.

Total health spending for people with employer-sponsored insurance would decrease by an estimated $310 billion if private insurers used Medicare rates, assuming no change in plan design. Our analysis suggests that more than $100 billion of that reduction would be in the form of lower premiums and out-of-pocket costs paid by employees (Figure 2). In total, spending on health care for people with employer-sponsored coverage would decrease from $757 billion to an estimated $447 billion. Assuming that difference is allocated proportionately to current spending, employees would contribute an estimated $72 billion less to premiums for services paid on their behalf by insurers and spend $44 billion less on out-of-pocket costs for care covered by their insurance—for a total reduction in spending of $116 billion. Spending on services funded by employer contributions would decrease from $474 to $280 billion, a decline of $194 billion in 2021.

As discussed in greater detail in the limitations section, these estimates do not account for changes in taxable income. On the one hand, wages could decrease in the health care sector due to declines in revenue. On the other hand, wages could increase in other parts of the economy if employers pass through health savings to workers. The degree to which the health care savings are passed though would likely vary across jobs and labor markets.17  Because employer-sponsored health benefits are not taxable as income while wages are, these shifts could also affect taxes paid by employers and employees and revenues for the federal government and states.

.Spending for individuals who purchase their own insurance in the non-group market, including the ACA marketplace, would decrease by an estimated $42 billion if insurers reimbursed providers at Medicare rates—some of this reduction would come from a drop in federal spending on subsidies for people with marketplace coverage. Currently, a total of $102 billion is directly spent on health care services for the 19 million individuals with non-group insurance, including amounts paid by the federal government on behalf of the 8.5 million people who receive premium subsidies for marketplace coverage. Total spending in the non-group market would decrease to $60 billion if payments to hospitals, physicians and other providers were set at Medicare rates. Part of this reduction in spending would directly accrue to the federal government, and part to individuals, some of whom do not currently receive federal subsidies for their coverage.

Individuals who receive premium subsidies for marketplace coverage may not see their premiums decrease because premiums for benchmark plans are set as a percent of the enrollee’s income. However, enrollees with out-of-pocket expenses below the out-of-pocket maximum, as most enrollees have, would likely benefit from a lower deductible and other out-of-pocket costs. On average, the combined (medical and pharmacy) deductibles for silver and bronze plans are currently about $4,800 and $6,900, respectively.18  Combined deductibles are substantially lower—averaging about $180—for individuals from 100 to 150% of the federal poverty line who qualify for the largest reductions in cost sharing. A decrease in spending for health care services covered by non-group plans would lead to lower deductibles and copayments since each plan covers a set percentage of total costs. Costs for services that individuals pay for before they meet their deductible would also go down because the prices of the services they are buying would be lower.

Individuals who purchase their own health insurance outside of the marketplaces or who do not qualify for federal subsidies would see their premiums and out-of-pocket costs decline if Medicare rates were used. For these individuals, the federal government will not directly benefit from the lower rates because individuals themselves are paying the full premium cost. However, in some cases these individuals (including those who are self-employed) may currently deduct their health expenses from their taxes and in those cases federal tax revenue could increase if health insurance costs for those with private, non-group insurance declined.19 

Reduction in spending by type of service

Almost half (45%) of the total reduction in spending, by service, would come from outpatient hospital services, if private insurance adopted Medicare rates. In total, outpatient, inpatient and emergency department care account for 69% of current spending on care covered by private insurance but would account for 78% of the reduction in spending if Medicare rates were used. Outpatient care accounts for 36% of current spending covered by private insurance, but 45% of the reduction in spending (Figure 3). Using FAIR Health’s Medicare to imputed allowed amount data and MarketScan data, we estimated that outpatient negotiated rates with private insurers are 203% of Medicare reimbursement (appendix table 2). This is a higher percentage than for most other types of services. Recently, an analysis from RAND included similar estimates of the potential reduction in spending from a switch to Medicare rates for hospital inpatient and outpatient care.20 

.Our analysis used data from 2018, which is before Medicare made changes to payments for some hospital off-campus outpatient departments that lowered their reimbursement to be closer to reimbursement for physician office visits.21  By 2020, regulatory changes lowered reimbursement by 60% for the most common hospital outpatient code, hospital outpatient clinic visit.22  Since our analysis does not account for this regulatory change that occurred after 2018, our analysis likely overestimates Medicare hospital outpatient rates and thus underestimates the reduction in outpatient spending that would occur.

Reduction in spending by age

About one-third of the total reduction in spending would come from people age 55 to 64—which would amount to $115 billion less in health care spending in 2021 (Figure 4). The proportion of the decrease in spending attributable to each age group is roughly equivalent to their share of spending (see appendix table 3). Spending on individuals age 60 to 64 would be $59 billion lower if Medicare rates were used (data not shown).

.President Biden has proposed giving individuals age 60 to 64 the option of enrolling in Medicare. We did not analyze that policy but our analysis does suggest that re-pricing private health care spending for this population using Medicare rates could result in a substantial reduction in health spending overall (assuming no change in covered benefits and that all people with private insurance in that age range switch to Medicare). While the details of President Biden’s policy have not been specified, lower payment rates would likely lead to lower overall health spending for adults ages 60 to 64, but higher federal spending if costs are shifted from employers and individuals to the federal government. A full analysis of the impact of this policy is outside the scope of our paper. Such an analysis would require accounting for multiple factors, including: health insurance coverage decisions by individuals and employers; changes in the labor market and health insurance risk pools; differences between Medicare and private insurance benefit designs; and available premium and cost-sharing subsidies compared to private coverage.

Reduction in health spending, per-person

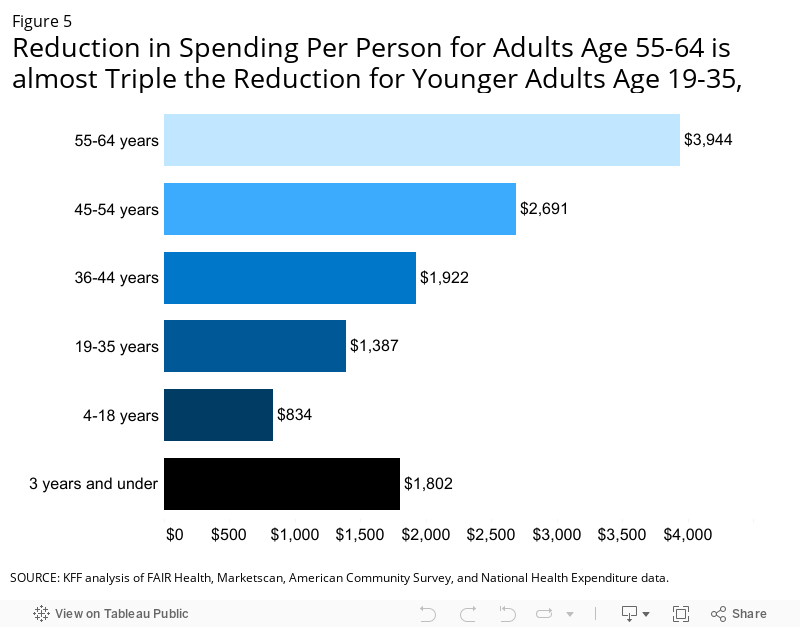
On average, per-person health care spending for those with private insurance would be an estimated $2,096 less for adults ages 19 to 64 and $1,033 less per child if Medicare rates were used. The potential reduction in per-person spending attributable to switching to Medicare rates increases steadily with age after age 3, approximately tripling from $1,387 for adults ages 19 to 35 to $3,944 among adults 55 to 64 (Figure 5). On average, per-person health care spending for adults age 19 to 64 with private insurance would be $2,096 less and per-person health care spending for children age 0 to 18 would be $1,033 less if Medicare rates were used (see appendix table 4).

.Limitations

While our analysis provides a way of thinking about the effects of prices on health care spending, this analysis is not intended to be a forecast or prediction. The direct and indirect effects would depend on the specifics of how a reduction in private sector health care prices is achieved. Our analysis is instead meant to be illustrative of the potential magnitude of savings possible from bringing private health care prices in line with Medicare.

We did not estimate the impact a reduction in aggregate health care spending would have on the labor market, employee compensation, and employers’ decisions to offer coverage. We also did not estimate how lowering health care prices would impact the market for health care services. Any changes to the prices paid for services may have other effects on health care in the United States. For example, lower reimbursement rates could decrease the number of practicing physicians or cause hospitals to contract or close. Lower reimbursement could also decrease investments in new technology. Lowering prices could also increase demand for care (particularly for those with high deductible plans). The potential combination of reduced supply and increased demand could impact access to care, health care quality and net health care spending.

While we calculated per-person declines in health care spending, we do not attempt to model the tax implications of this change, which would affect how savings are distributed between employers, employees, and the federal government and states. Increasing taxable wages would mean that individuals would not see a dollar-for-dollar increase in their after-tax income. There could also be payroll tax implications for employers if compensation shifts from tax-exempt health benefits to taxable wages. We also do not attempt to estimate the impact that shifting to Medicare rates would have on federal or state budgets. If the change led to an increase in taxable income, that would generate higher federal and state revenues. Lower payment rates would also mean lower federal spending on premium and cost sharing subsidies for marketplace coverage, and reduced health care spending for federal employees. At the same time, the reduction in private insurance reimbursement rates would likely result in lower income for some people who are employed in the health care sector, which would negatively impact tax revenues.

Further, we did not estimate the implications for Medicare and the Medicare Hospital Insurance Trust Fund. An increase in taxable wages would increase payroll tax revenue. However, if these changes led to pressure to increase Medicare payment rates, higher rates could increase outlays from the Medicare Trust Fund.

Factors that impact the size of our estimates

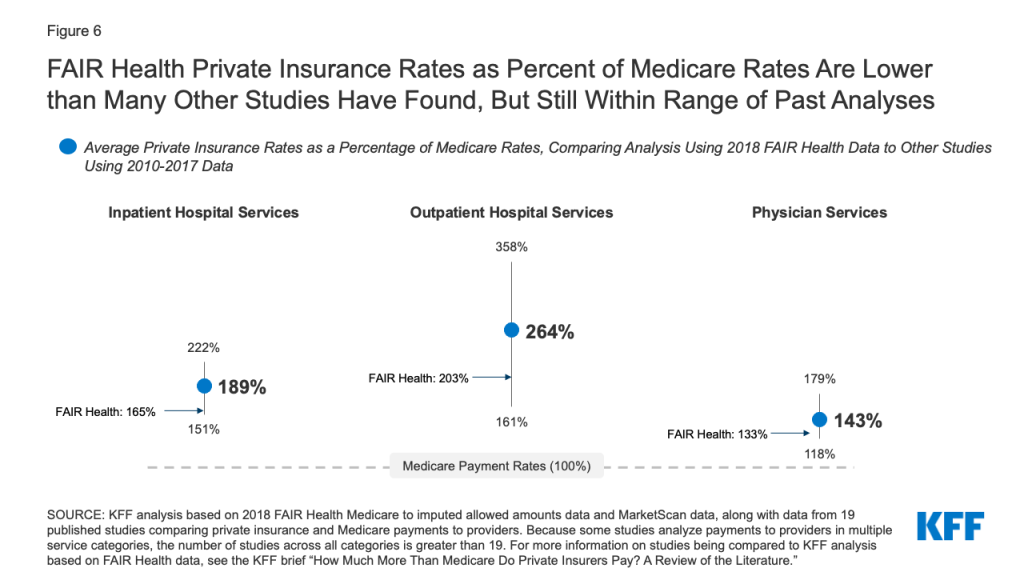
There are several factors that suggest we may have underestimated how much lower private health care spending would be if Medicare rates were used. Most significantly, we believe that the private reimbursement to Medicare ratios used in our analysis are conservative. Overall, the private insurance rates as a percentage of Medicare rates that were calculated using FAIR Health data were 165% for inpatient, 203% for outpatient and 133% for physician services (Figure 6). While these are within the range of the results of the studies in recent KFF review of the literature on private insurance payment rates compared to Medicare rates, they are each below the average among the studies. We discuss the possible reasons for this in the methods appendix.

Figure 6: FAIR Health Private Insurance Rates as Percent of Medicare Rates Are Lower than Many Other Studies Have Found, But Still Within Range of Past Analyses

Aside from the ratios we used to re-price health care reimbursed by private insurance, several other factors lowered our estimates of the impact of this change. As discussed earlier in this paper, we do not capture recent changes to Medicare hospital outpatient reimbursment that have reduced Medicare payments in certain instances. Our estimates also do not include savings from lower administrative costs. Assuming a constant medical loss ratio of 85%, lowering health care spending would lead to an additional $62 billion less in administrative costs (see appendix table 2). Additionally, if lower reimbursement led to a decline in the supply of care, it could negatively impact access and also further lower spending.

Conversely, several factors could lead our estimates to overstate the potential reduction in spending on health care for individuals and employers. First, if Congress increased Medicare rates after they were used to determine private insurance reimbursement, that would lead to a smaller reduction in spending than we estimate. An increase in Medicare payments to hospitals and other providers would also lead to higher Medicare spending, premiums and cost-sharing, and accelerate the depletion of the Medicare Hospital Insurance Trust Fund. Additionally, our estimates did not account for how higher taxes would potentially offset some of the reduction in health spending for individuals and employers. We would expect that much of the reduction in spending on health care would eventually become taxable income—therefore individuals and employers would not reap the full benefits of this change, with some financial benefit accruing to the government instead. Additionally, if this policy change were phased in or instead used a multiple of Medicare rates (for example, 150% of Medicare rates), the estimated reduction in spending would be lower.

Our analysis also assumed that provider payment rates are the same in the non-group and large employer markets. However, due to narrower networks, non-group insurance may have lower provider payment rates than employer-sponsored coverage. Additionally, due to higher cost sharing, people with non-group coverage may have lower total health care spending than they would have if they had employer-sponsored coverage. Thus, our analysis may overestimate spending in the non-group market and also overestimate the potential to reduce spending by switching to Medicare rates.

Another more technical factor that affects the size of our estimates is that the private-to-Medicare reimbursement ratios used from FAIR Health do not factor in adjustments to Medicare reimbursements for indirect payments to hospitals such as disproportionate share hospital (DSH) payments, uncompensated care payments, indirect medical education payments (IME) payments. If the FAIR Health data included these Medicare payments, then the ratios of private-to-Medicare inpatient spending would be lower than the ratios used in our analysis because the Medicare reimbursement rates themselves would be higher. This would then lead to a somewhat lower estimated reduction in spending if Medicare rates were used for the privately insured. Using a MedPAC estimate that about 15% of Medicare inpatient payments are made in the form of DSH, uncompensated care and IME payments, we estimate that if those three types of payments had been factored into our analysis, it would increase private insurance inpatient reimbursement at Medicare rates by approximately $26 billion in 2021.23  However, these indirect payments serve a broader purpose in the health care system than direct payment for health care services, so it is not clear how they would be treated in a policy that sought to curtail private prices.

Discussion

As our analysis shows, policies that limit private insurance reimbursement to Medicare rates would dramatically cut health care spending, leading to lower costs for employers and individuals with health coverage from employer-sponsored or non-group insurance, including marketplace coverage. This analysis illustrates the potential for a substantial reduction in total health spending from policies like Medicare for all, a public option, lowering the age of Medicare eligibility, or all-payer rate-setting—all other things equal. At the same time, the decrease in spending would translate into a drop in revenue for hospitals, and to a lesser extent physicians and other providers.

Health care expenditures are projected to account for 18% the United States gross domestic product (GDP) in 2021. Shifting private insurance to Medicare rates would decrease this by about 1.5 percentage points, making the share of GDP spent on health care 16.5% of GDP.24  This would still be a far higher amount than comparable countries spend on health care, which ranges between 9% and 12% of GDP.

There has historically been strong resistance by hospitals and other health care providers to proposals that jeopardize their revenue, and there is every reason to suspect ongoing opposition to such policies in the future. Yet, it is not clear what the broader impact on the health care system would be. MedPAC has previously found that high reimbursement from private insurers currently reduces incentives for hospitals to operate efficiently.25  When providers operate efficiently, according to MedPAC, Medicare rates are largely sufficient or could be sufficient with relatively minor adjustments, such as a 2% increase in hospital reimbursement.26 

If the reduction in hospital revenue caused some hospitals to close or limit future investments, it could negatively impact access to care and health care quality. Additionally, lower reimbursement could also negatively impact access to physicians and other health care providers. It would certainly affect physician income. However, other comparable countries spend far less than the United States does on health care per capita, and yet the United States still lags behind those countries when it comes to many measures of health outcomes, quality of care, and access to services. In all likelihood, policymakers would want to closely track the effects of this policy, and if necessary, adjust payments which would affect reductions in spending, not unlike what they have done over the years in monitoring the implementation of payment policy changes under Medicare.

At the same time, the current high prices paid for health care puts a strain on the U.S. economy—raising the cost of hiring workers with health benefits and leaving consumers with less money to spend on other goods and services. Current trends suggest that this strain is likely to worsen without policy interventions. The gap between private insurance and Medicare per enrollee spending is continuing to grow—largely due to rising health care prices.27  If health care prices and insurance premiums were to decrease, economists suggest that the resulting employer savings would lead to higher wages and increase full-time employment.28  At a time when wages for most workers have barely kept up with inflation29  and are growing slower than health costs, a reduction in health spending could lead to a meaningful improvement in economic wellbeing and could potentially increase tax revenue.

Any reduction in health care spending for people with private insurance would be very sensitive to the specifics of how the policy was developed and how Medicare rates were used. Under a Medicare for all system, payment rates might not end up being current Medicare rates, but rather some average of Medicare, Medicaid, and private rates. Likewise, it is also possible that a public option health plan would not set private insurance rates exactly at Medicare rates but instead use a multiple of Medicare rates, for example 160% of Medicare rates, as Washington State has done. Under an all-payer rate-setting system, Medicare rates or a multiple of Medicare rates could be a ceiling for reimbursement—with insurers free to negotiate discounts below that ceiling. Setting a ceiling would allow for the possibility of even greater overall savings than using the same percentage of Medicare to set all rates, because some payers might be able to negotiate lower reimbursement rates.

This approach could be phased in gradually, which would limit the magnitude of the spending reduction, while allowing policymakers to monitor and respond, if necessary, to any adverse effects on health care providers and patient care. If such a change were considered while the United States is still recovering from the COVID-19 pandemic, policy makers may pay particular attention to the impact of changes to payments rates for the health care providers that are most vulnerable due to the pandemic. While health utilization plummeted early in the pandemic, overall spending has since rebounded. As of the third quarter of 2020, year-to-date health services spending was down by just 2.4% (relative to year-to-date spending as of third quarter in 2019). Additionally, in response to concerns about the loss of revenue due to the pandemic, the federal government has allocated about $150 billion in federal grants to hospitals and other health care providers of the $178 billion authorized as of February 12, 2020, along with loans and other financial assistance. However, it is not yet clear whether the pandemic will have a longer-term fiscal impact on certain hospitals and other providers.

During the pandemic, Medicare rates are being used to reimburse providers for treating the uninsured and to set reasonable rates for out-of-network COVID-19 vaccine administration.30  Broadening the use of Medicare rates to set reimbursement for private insurance would be a dramatic shift but one that could lead to substantial reduction in health care spending. With the United States economy still reeling from the impact of COVID-19, lowering private insurance reimbursement by using Medicare rates (or a multiple of Medicare rates) has the potential to put more money in the pockets of consumers and businesses. It would also help address the high and rising cost of health care for people with private insurance. Any policy debate of this magnitude would highlight the significant tradeoffs, weighing the potential reduction in health spending against strong opposition from industry stakeholders, and concerns about the potential impact on quality and access.

This work was supported in part by Arnold Ventures. We value our funders. KFF maintains full editorial control over all of its policy analysis, polling, and journalism activities.

Appendices: Methods

To calculate the amount that would be spent on health care for people with private insurance at Medicare rates, we used ratios of 2018 Medicare reimbursement to private insurance allowed amounts calculated by FAIR Health. FAIR Health used their private health care claims dataset. FAIR Health received approximately 2 billion medical and dental claims for the 2018 year. FAIR Health calculated Medicare reimbursement rates by applying the rules of the inpatient prospective payment system (IPPS), outpatient prospective payment system (OPPS), Medicare Physician Fee Schedule (MPFS), Medicare home health prospective payment system (PPS), Medicare Inpatient Psychiatric Facility PPS, Medicare Inpatient Rehabilitation Facility PPS, Medicare Skilled Nursing Facility (SNF) PPS, Medicare Ambulance Fee Schedule, Anesthesia Reimbursement Fee Schedule, Medicare Durable Medical Equipment, Prosthetics/Orthotics & Supplies Fee Schedule (DMEPOS), Medicare ASP Drug Pricing Files and the Clinical Laboratory fee schedule (CLAB) made available from CMS to services on claims submitted for those with private insurance. As discussed in the limitations section, FAIR Health did not include adjustments to Medicare reimbursements for indirect payments such as DSH, uncompensated care and IME. The FAIR Health ratios of Medicare reimbursement to commercial allowed amounts were calculated by metropolitan statistical area, service category, and by age group. The service categories that were used are: inpatient, outpatient, physician office, skilled nursing facility, laboratory, emergency department and urgent care center. Both facility and physician fees are included. The age groups that were used in our analysis are: 0 to 3, 4 to 18, 19 to 35, 36 to 44, 45 to 54 and 55 to 64.

As discussed in the limitations section of the report, the private-to-Medicare ratios that were used in our analysis are lower than those found in many other studies. Private insurance payment rates in those earlier studies varied based on the characteristics of the markets examined by each study and the author’s methods. Higher private payment rates were often seen in studies looking at more consolidated health care markets where providers have stronger negotiating leverage over insurers. Other factors influencing the results of the studies KFF examined were the representativeness of hospitals, physicians, and insurers used in the analysis and the data collection period, as well as differences in the services included across studies. Additionally, the FAIR Health ratios compare spending rather than prices. If people with private insurance use services more often that have relatively higher Medicare rates, then the ratio of private to Medicare spending for a set of services will be lower than the ratio of individual prices. Since our analysis focuses on spending, using ratios that compare spending rather than prices should give us a more accurate result.

The ratios from FAIR Health were then applied to 2018 spending data from IBM Health Analytics MarketScan Commercial Claims and Encounters Database (IBM Corporation). We indexed 2018 spending to the current year (2021) by applying the projected growth in spending and enrollment for those with private health insurance from the National Health Expenditures data to our estimates of 2018 spending. MarketScan is a convenience sample of health care claims provided primarily by large employers and health plans. Our analysis used claims for almost 18 million people representing about 22% of the 82 million people in the large group market in 2018. The advantage of using claims information to analyze spending is that we can look beyond plan provisions and focus on actual payment liabilities incurred by enrollees. MarketScan includes information on cost-sharing, as well as enrollees that do not have any health spending.

These data reflect out-of-pocket spending incurred under the benefit plan, but do not include balance-billing payments made to health care providers for out-of-network services or out-of-pocket payments for non-covered services. Costs for retail prescription drugs were excluded from our analysis. Our approach would not have been appropriate for prescription drug spending because there is not one Medicare price for retail prescription drugs, since those drugs are covered through the Medicare Part D program, which relies on private Part D plans that negotiate with drug manufacturers.

We reweighted the MarketScan data to represent the distribution of the entire population with private insurance. Weights were applied to match counts in the 2018 American Community Survey (ACS) for non-elderly enrollees with either employer or non-group coverage by sex, age and state. Weights were trimmed at eight times the interquartile range. In total, our analytic sample reflects a universe count of 173 million people. The ACS asks respondents about their health insurance coverage at the time of the survey. Respondents may report having more than one type of coverage; however, individuals are sorted into only one category of insurance coverage. Hospital costs were trimmed to exclude the lowest 1.5% and highest 0.5% of hospital costs within DRG. We also excluded MarketScan observations with negative spending. Due to data constraints, our analysis assumes the distribution of spending for people with private non-group insurance matches the distribution of spending for people with large group employer insurance.

To calculate what spending by private insurance would have been if Medicare rates were used instead of private insurance allowed amounts, we applied the FAIR Health ratios to total spending calculated using MarketScan within age and service category. For example, the ratio for spending on outpatient services for ages 0-3 was applied to total outpatient spending using MarketScan data for people with private insurance who are ages 0-3. We then summed spending across all age and spending categories. This approach assumes the distribution of services in MarketScan is similar to those in the FAIR Health data set on which the commercial to Medicare ratios were estimated.

We break out estimates of the reduction of spending for those that directly purchase health insurance, out-of-pocket spending for enrollees in employer plans, and the reduction in payments to providers made on behalf of enrollees in employer insurance (financed by employee and employer premium contributions). To estimate the reduction in spending attributed to services for those that directly purchase health insurance, we calculated the share of the population with private insurance in each age-sex category that was enrolled in a direct purchase plan. We multiplied the estimates of spending under current commercial rates, Medicare rates, and the reduction in savings by these shares and summed across all age and sex categories. We did not breakout out-of-pocket spending and payer spending for the direct purchase market. For those with employer insurance, we calculated out-of-pocket spending by applying the out-of-pocket share of total spending observed in the MarketScan data for each age group to the estimated spending under Medicare rates and aggregated across all groups. To estimate the share of payer spending financed by employer and employee premiums, respectively, we used MEPS data to calculate the average share of premiums covered by employer contributions (73%) and employees (27%).31 

We made several simplifying assumptions to allocate the distribution of the decrease in spending among enrollee premiums and out-of-pocket spending, and employer contributions. Notably, our analysis did not account for changes in benefit design, including enrollee cost-sharing, supply of health care, or enrollment patterns if payment rates for all private insurers were set at Medicare rates. Instead, we assumed that the actuarial value of the average employer plan would stay the same if Medicare rates were used, and we used that percentage to allocate the reduction in spending across out-of-pocket costs and premiums. We also assumed that employers would keep their share of premiums constant and that the use of health care would stay the same if prices dropped.

Appendices: Tables

Appendix Table 1: Employer and Employee Share of Current Spending, Spending Under Medicare Rates, and Potential Reduction, in $ billions 2021
Current Spending ($B)Spending Under Medicare Rates ($B)Potential Reduction in Spending ($B)
Employer-sponsored insurance
Total Spending on health services for enrollees in group health plans$757$447$310
Employer share of spending$474$280$194
Employee share of spending funded by premiums$175$103$72
Employee out-of-pocket spending$107$63$44
Private non-group
Total health care spending for private non-group$102$60$42
NOTES: All spending numbers are for people under 65 years old. 2021 spending is calculated by multiplying 2018 estimate by projected growth in private health insurance spending in the National Health Expenditures data.SOURCE: KFF analysis of FAIR Health, MarketScan, American Community Survey, and National Health Expenditures data.
Appendix Table 2: Current Spending for the Privately Insured, Medicare to Allowed Amount Ratio, Spending at Medicare Rates and Potential Reduction in Spending, in $ billions for 2021
Current Total Spending ($B)Private Insurance Allowed Amount to Medicare RatioSpending Under Medicare Rates ($B)Potential Reduction in Spending ($B)
Health care services$859170%$507$352
Service category
Emergency Department$41221%$19$23
Inpatient$242165%$147$95
Laboratory$13177%$8$6
Other$42181%$23$19
Outpatient$312203%$154$158
Physician Office$202133%$152$50
SNFs$2108%$1$0
Urgent Care$4146%$3$1
Administrative Costs$152$89$62
NOTES: All spending numbers are for people under 65 years old with private health insurance coverage. 2021 spending is calculated by multiplying 2018 estimate by projected growth in private health insurance spending in the National Health Expenditures data. Administrative costs assume constant loss ratio of 85%.SOURCE: KFF analysis of FAIR Health, MarketScan, American Community Survey, and National Health Expenditures data.
Appendix Table 3: Current Spending for the Privately Insured, Medicare to Allowed Amount Ratio, Spending at Medicare Rates and Potential Reduction in Spending, in $ Billions for 2021
Current Total Spending ($B)Private Insurance Allowed Amount to Medicare RatioTotal Spending Under Medicare Rates ($B)Potential Reduction in Spending ($B) Current OOP Spending ($B)OOP Spending at Medicare Rates ($B)Potential Reduction in OOP Spending ($B)% in group plans% in non-group plans
Age group: 0-3
Female$20150%$14$7$2$1$192%8%
Male$25152%$17$9$3$2$192%8%
Total$46151%$30$15$5$3$292%8%
Age group: 4-18
Female$35158%$22$13$7$4$290%10%
Male$37158%$24$14$7$4$290%10%
Total$72158%$46$27$13$9$590%10%
Age group: 19-35
Female$108170%$63$44$19$12$788%12%
Male$54172%$31$23$10$6$488%12%
Total$161170%$95$67$29$17$1188%12%
Age group: 36-44
Female$75171%$44$31$12$7$591%9%
Male$43172%$25$18$7$4$391%9%
Total$118171%$69$49$19$12$791%9%
Age group: 45-54
Female$108173%$63$45$15$9$689%11%
Male$81174%$47$34$11$6$490%10%
Total$189173%$110$80$25$15$1089%11%
Age group: 55-64
Female$140172%$81$59$16$10$684%16%
Male$132173%$76$56$14$8$586%14%
Total$272173%$158$115$30$18$1285%15%
NOTES: Analysis assumes spending is distributed across enrollees in group and non-group plans consistent with their enrollment in such plans. 2021 spending is calculated by multiplying 2018 estimate by projected growth in private health insurance spending in the National health Expenditures data.SOURCE: KFF analysis of FAIR Health, MarketScan, American Community Survey, and National Health Expenditures data.
Appendix Table 4: Current Spending Per Person with Private Health Insurance, Spending Per Person at Medicare Rates and Potential Reduction in Spending Per Person, 2021
Current Spending Per Person ($B)Spending Per Person Under Medicare Rates ($B)Potential Reduction in Spending Per Person ($B)
Overall (0-64) $4,973 $2,933 $2,040
Child (0-18) $2,932 $1,899 $1,033
Adult (19-64) $5,012 $2,916 $2,096
Older Adult (60-64) $10,353 $5,990 $4,363
Age group: 0-3
Female $4,907 $3,272 $1,635
Male $5,788 $3,830 $1,958
Total $5,360 $3,558 $1,802
Age group: 4-18
Female $2,275 $1,443 $833
Male $2,288 $1,452 $836
Total $2,281 $1,447 $834
Age group: 19-35
Female $4,520 $2,667 $1,852
Male $2,215 $1,283 $932
Total $3,356 $1,970 $1,387
Age group: 36-44
Female $5,825 $3,400 $2,426
Male $3,370 $1,963 $1,407
Total $4,612 $2,690 $1,922
Age group: 45-54
Female $7,113 $4,118 $2,995
Male $5,608 $3,234 $2,373
Total $6,378 $3,687 $2,691
Age group: 55-64
Female $9,282 $5,381 $3,901
Male $9,437 $5,448 $3,989
Total $9,356 $5,413 $3,944
NOTES: 2021 spending is calculated by multiplying 2018 estimate by projected growth in per-capita private health insurance spending in the National Health Expenditures data.SOURCE: KFF analysis of FAIR Health, MarketScan, American Community Survey, and National Health Expenditures data.

Endnotes

  1. Rakesh Kochhar “Unemployment rose higher in three months of COVID-19 than it did in two years of the Great Recession,” Pew Research, June 11, 2020; U.S. Bureau of Labor Statistics, “Labor Force Statistics from the Current Population Survey,” February 5, 2021; Kim Parker, Rachel Minkin, and Jesse Bennett, “Economic Fallout From COVID-19 Continues To Hit Lower-Income Americans the Hardest,” Pew Research, September 24, 2020. ↩︎
  2. Research for this brief is based partly upon health care claims data compiled and maintained by FAIR Health, Inc. KFF is solely responsible for the research and conclusions reflected in this brief. FAIR Health, Inc. is not responsible for any of the opinions expressed in this brief. ↩︎
  3. Zach Cooper, “High Prices Drive High Health Care Spending In The US, But So Too Do Other Factors: A Response To Anderson And Colleagues,” Health Affairs, January 14, 2019. ↩︎
  4. Centers for Medicare and Medicaid Services. 2019. National Health Expenditures 2018 Highlights. Washington, D.C.: Centers for Medicare and Medicaid Services. https://www.cms.gov/files/document/highlights.pdf   ↩︎
  5. Benjamin Sommers, “Who Really Pays for Health Insurance?” Int J Health Care Finance Econ 5, 89–118 (2005). https://doi.org/10.1007/s10754-005-6603-5; Daniel Arnold and Christopher Whaley, “Who Pays for Health Care Costs?” Santa Monica, CA: RAND Corporation, 2020. Available at: https://www.rand.org/pubs/working_papers/WRA621-2.html; Katherine Baicker and Amitabh Chandra, “The Labor Market Effects of Rising Health Insurance Premiums,” Journal of Labor Economics 2006 24:3, 609-634. ↩︎
  6. David M. Cutler and Fiona Scott Morton. “Hospitals, Market Share, and Consolidation.” JAMA vol. 310 no. 18 (November 13, 2013); Brent D. Fulton. “Health Care Market Concentration Trends In The United States: Evidence And Policy Responses.” Health Affairs 36, no. 9 (September 1, 2017): 1530–38. https://doi.org/10.1377/hlthaff.2017.0556. ↩︎
  7. Brent D. Fulton. “Health Care Market Concentration Trends In The United States: Evidence And Policy Responses.” Health Affairs 36, no. 9 (September 1, 2017): 1530–38. https://doi.org/10.1377/hlthaff.2017.0556. ↩︎
  8. MedPAC, March 2020 Report to the Congress: Medicare Payment Policy, March 13, 2020. ↩︎
  9. MedPAC, March 2020 Report to the Congress: Medicare Payment Policy, March 13, 2020. See table 4-2. ↩︎
  10. MedPAC, March 2020 Report to the Congress: Medicare Payment Policy, March 13, 2020. ↩︎
  11. HHS, “HHS Launches COVID-19 Uninsured Program Portal,” HHS press release, April 27, 2020; 85 FR 71142. ↩︎
  12. Washington State Health Care Authority, “Cascade Care FAQ,” Washington State Health Care Authority, January 2020. Available at https://www.hca.wa.gov/assets/program/cascade-care-one-pager.pdf ↩︎
  13. Chris L. Peterson and Dale N. Schumacher, “How Maryland’s Total Cost Of Care Model Has Helped Hospitals Manage The COVID-19 Stress Test,” Health Affairs, October 7, 2020. ↩︎
  14. Lane Koeing, et al, “The Impact of Medicare-X Choice on Coverage, Healthcare Use and Hospitals,” KNG Health Consulting, March 12, 2019. Available at: https://www.aha.org/system/files/2019-03/the-impact-of-medicare-X-choice-final-report-2019.pdf; Jeff Goldsmith, Jeff Leibach, and Kurt Eicher, “Medicare Expansion: A Preliminary Analysis of Hospital Financial Impacts,” Navigant. Available at: https://americashealthcarefuture.org/wp-content/uploads/2020/03/Navigant_Medicare-Expansion-Hospitals.pdf ↩︎
  15. Congressional Budget Office, “How CBO Analyzes the Costs of Proposals for Single-Payer Health Care Systems That Are Based on Medicare’s Fee-for-Service Program,” Working Paper 2020-08, December 2020. ↩︎
  16. MedPAC, March 2020 Report to the Congress: Medicare Payment Policy, March 13, 2020. Available at: http://www.medpac.gov/docs/default-source/reports/mar20_medpac_ch4_sec.pdf?sfvrsn=0 ↩︎
  17. Darren Lubotsk and Craig A.Olson, “Premium copayments and the trade-off between wages and employer-provided health insurance,” Journal of Health Economics, Vol. 44, December 2015, Pages 63-79; Jeffrey Clemens and David M. Cutler, “Who pays for public employee health costs?” Journal of Health Economics, December 2014;38:65-76; Paige Qin and Michael Chernew, “Compensating wage differentials and the impact of health insurance in the public sector on wages and hours” Journal of Health Economics, December 2014;38:77-87; Jonathan T. Kolstad and Amanda E. Kowalski, “Mandate-based health reform and the labor market: Evidence from the Massachusetts reform,” Journal of Health Economics, May 2016;47:81-106; Craig A. Olson “Do Workers Accept Lower Wages in Exchange for Health Benefits?” Journal of Labor Economics, April 2002;20: S91-S114; The Incidental Economist, “Premium-wage tradeoff literature review: The public sector,” Dec. 10, 2015, available at: https://theincidentaleconomist.com/wordpress/premium-wage-tradeoff-literature-review-the-public-sector/; The Incidental Economist, “The economic theory of premium-wage tradeoffs,” April 12, 2016, Available at: https://theincidentaleconomist.com/wordpress/the-economic-theory-of-premium-wage-tradeoffs/; The Incidental Economist, “The premium-wage tradeoff in the private sector,” April 13, 2016, Available at: https://theincidentaleconomist.com/wordpress/the-premium-wage-tradeoff-in-the-private-sector/. ↩︎
  18. KFF, “Cost-Sharing for Plans Offered in the Federal Marketplace, 2014-2021,” Jan. 15, 2021, Available at: https://modern.kff.org/slideshow/cost-sharing-for-plans-offered-in-the-federal-marketplace/. ↩︎
  19. Individuals can deduct health care costs (including premiums) above 7.5% from their federal taxes. See Internal Revenue Service, “Topic No. 502 Medical and Dental Expenses,” Jan. 20, 2021, Available at: https://www.irs.gov/taxtopics/tc502.; Individuals who are self-employed may be able to deduct their entire health insurance premium. See Internal Revenue Service, “Publication 535 (2019), Business Expenses,” March 5, 2020, Available at: https://www.irs.gov/publications/p535#en_US_2019_publink1000208843 ↩︎
  20. Liu, Jodi L., Zachary M. Levinson, Nabeel Shariq Qureshi, and Christopher M. Whaley, Impact of Policy Options for Reducing Hospital Prices Paid by Private Health Plans. Santa Monica, CA: RAND Corporation, 2021. https://www.rand.org/pubs/research_reports/RRA805-1.html. ↩︎
  21. This change impacted the outpatient departments that had been grandfathered from changes under the Bipartisan Budget Act of 2015 that switched Medicare reimbursement for new, off-campus hospital outpatient departments to rates based on the physician fee schedule, which had the impact of lowering reimbursement for those new facilities. ↩︎
  22. Federal Register Vol. 84, No. 218. ↩︎
  23. Mark Miller, “Hospital Policy Issues,” MedPAC, July 22, 2015. Testimony before House Ways and Means Committee. Available at: http://www.medpac.gov/docs/default-source/congressional-testimony/testimony-hospital-policy-issues-ways-and-means-.pdf?sfvrsn=0 ↩︎
  24. Calculated using Table 01 National Health Expenditures and Selected Economic Indicators, Levels and Annual Percent Change: Calendar Years 2012-2028, available at: https://www.cms.gov/Research-Statistics-Data-and-Systems/Statistics-Trends-and-Reports/NationalHealthExpendData/NationalHealthAccountsProjected ↩︎
  25. MedPAC, March 2020 Report to the Congress: Medicare Payment Policy, March 13, 2020 (see page 61). ↩︎
  26. MedPAC, March 2020 Report to the Congress: Medicare Payment Policy, March 13, 2020. ↩︎
  27. Health Care Costs Institute, “2018 Health Care Cost and Utilization Report,” February 2020. ↩︎
  28. Katherine Baicker and Amitabh Chandra, “The Labor Market Effects of Rising Health Insurance Premiums,” Journal of Labor Economics 2006 24:3, 609-634. ↩︎
  29. Drew Desilver, “For most U.S. workers, real wages have barely budged in decades,” Pew Research, August 7, 2018. ↩︎
  30. HHS, “HHS Launches COVID-19 Uninsured Program Portal,” HHS press release, April 27, 2020; 85 FR 71142. ↩︎
  31. Agency for Healthcare Research and Quality, Center for Financing, Access and Cost Trends, “2019 Medical Expenditure Panel Survey – Insurance Component,” Available at:  https://meps.ahrq.gov/data_stats/summ_tables/insr/national/series_4/2019/ic19_iva_b.pdf. To determine the average contributions by employers and employees we summed the amounts contributed by employers and employees for single and non-single coverage for those in the private, state, and local government sector. On average employers contributed 73% of total costs and employees contributed 27%. This is slightly higher than the 72% the federal government contributes toward the most commonly chosen plans in the federal employee health benefits program. ↩︎
News Release

Most Americans Now Say They’ve Gotten At Least One Dose of a COVID-19 Vaccine or Want to Get Vaccinated As Soon As Possible, with Enthusiasm Rising Across Racial, Ethnic and Partisan Groups

Published: Feb 26, 2021

Black and Hispanic Adults and Those Under Age 30 Remain Most Likely to Want to “Wait and See;” Roughly One in Four Among “Wait and See” Say They Would Be More Likely to Get Vaccinated if Only One Shot Were Required

While Enthusiasm Rises, a Persistent Minority Say They Definitely Will Not Get Vaccinated; Republicans, Rural Residents, and Essential Workers Outside Health Care Are Most Reluctant Groups


More than half of Americans (55%) now say they want to get vaccinated as soon as possible (37%) or have already received at least one dose (18%), up 8 percentage points over the past month as more people have gotten at least an initial vaccine dose, the latest KFF COVID-19 Vaccine Monitor reports.

An additional 1 in 5 (22%) are open to getting a vaccine but want to “wait until it has been available for a while to see how it is working for others,” down from 31% a month ago as more people have gotten vaccinated.

“We’re seeing more Americans who want to get vaccinated, but Black, Hispanic and rural Americans will be left behind unless special efforts are made to increase vaccine confidence in those communities,” KFF President and CEO Drew Altman said.

The latest report shows that all demographic groups are seeing an increase in the share who have already been or want to get vaccinated as soon as possible, though eagerness varies substantially.

People ages 65 and over (44% vaccinated, 33% as soon as they can) and Democrats (23% vaccinated, 52% as soon as they can) are the most eager. Black adults and young adults under age 30 are most likely to say they want to “wait and see” before getting vaccinated, with a third of each group describing themselves that way, along with a quarter (26%) of Hispanic adults.

While the two COVID-19 vaccines currently being used involve two doses, a third may soon be available that would require just one dose. About a quarter (26%) of those who want to “wait and see” say they would be more likely to get vaccinated if it required only a single shot.

About 1 in 5 (22%) are more reluctant about getting vaccinated, including 7% who say they would do so “only if required” for work, school or other activities, and 15% who say they definitely will not get vaccinated. The most reluctant groups include Republicans, essential workers who work outside health care, and people living in rural areas.

The overall size of this reluctant group is little changed since December, suggesting they are less influenced by news and others’ experiences than those in the “wait and see” camp. 

Side Effects Remain People’s Biggest Concern, Though Some Worry about Financial Costs

Side effects remain people’s biggest concern – most (56%) of those who have not been vaccinated, including 80% of those in the “wait and see” group, are concerned they might experience serious side effects from the vaccine.

About a third of those who have not been vaccinated also say they are concerned about potentially having to pay out of pocket for the vaccine (35%), missing work because of side effects (34%), or getting COVID-19 from the vaccine (33%).

Each of these concerns is more prevalent among the “wait and see” group, including at least half of Black and Hispanic adults in this group who say they are concerned about getting COVID from the vaccine (61% and 67%, respectively), missing work due to side effects (58% and 66%), or having to pay out of pocket (50% and 61%).

In addition, about half (52%) of Black adults and 58% of Hispanic adults in the “wait and see” group are concerned they won’t be able to get the vaccine from a place they trust.

Among people who have not yet been vaccinated, those with a household member (69%) or a close friend or family member (49%) who has already gotten vaccinated are more likely to say they want the vaccine as soon as possible than those who only know an acquaintance (33%) or don’t know anyone who has gotten the vaccine (36%).

Many Black and Hispanic Adults Lack Confidence Vaccines Were Adequately Tested In Their Groups

The Vaccine Monitor also gauges how Black and Hispanic adults view the vaccines’ development and whether they were tested adequately for safety and effectiveness among people like them.

Half of Black adults say they are not confident that the COVID-19 vaccines were adequately tested among Black people, and one-third of Hispanic adults lack confidence in the testing among Hispanic people.

Confidence about the testing process is related to people’s eagerness to get vaccinated. Compared to their less confident peers, Black and Hispanic adults who are confident that the vaccine has been adequately tested among their own racial or ethnic group are about twice as likely to say they’ve already been vaccinated or want the vaccine as soon as possible.

Designed and analyzed by public opinion researchers at KFF, the KFF Vaccine Monitor survey was conducted from Feb.15-23 among a nationally representative random digit dial telephone sample of 1,874 adults, including oversamples of adults who are Black (507) or Hispanic (506). Interviews were conducted in English and Spanish by landline (339) and cell phone (1,535). The margin of sampling error is plus or minus 3 percentage points for the full sample. For results based on subgroups, the margin of sampling error may be higher.

The KFF COVID-19 Vaccine Monitor is an ongoing research project tracking the public’s attitudes and experiences with COVID-19 vaccinations. Using a combination of surveys and qualitative research, this project tracks the dynamic nature of public opinion as vaccine development and distribution unfold, including vaccine confidence and acceptance, information needs, trusted messengers and messages, as well as the public’s experiences with vaccination.

State Variation in Medicaid LTSS Policy Choices and Implications for Upcoming Policy Debates

Authors: Molly O'Malley Watts, MaryBeth Musumeci, and Priya Chidambaram
Published: Feb 26, 2021

Executive Summary

Medicaid is a key source of coverage for seniors and people with disabilities, including those who need long-term services and supports (LTSS) to meet daily needs. Waivers are the primary way that states expand financial eligibility and offer home and community-based services (HCBS) benefit packages to seniors and people with disabilities. Unlike Medicaid state plan authorities, which require states to cover (and provide federal matching funds for) everyone who meets the associated eligibility criteria, waivers allow states to limit the number of people served. States’ ability to cap HCBS waiver enrollment can result in waiting lists when the number of people seeking services exceeds the number of waiver slots available.

Waiting lists are one proxy for unmet need for HCBS, but waiting lists alone are an incomplete measure. Most eligibility pathways based on old age or disability, and nearly all HCBS benefits, are optional, creating a great deal of variation among states. This brief draws on several KFF state-level surveys to examine multiple measures, beyond waiting lists, to evaluate state choices about optional Medicaid eligibility pathways, spending, and services for seniors and people with disabilities.

Our review of a range of measures finds substantial state variation in adoption of policies to expand Medicaid for seniors and people with disabilities. While there has been some criticism that the ACA Medicaid expansion might crowd out other benefits, states’ ACA expansion status does not appear to be a strong predictor of policy choices related to seniors and people with disabilities. In some cases, a state’s choice to adopt the ACA expansion is associated with state take-up of options to expand eligibility and services for seniors and people with disabilities, while in many cases, state variation in policies for seniors and people with disabilities appears to be entirely unrelated to ACA expansion status.

Understanding current state-level variation in Medicaid eligibility, spending, and services for seniors and people with disabilities is important to inform upcoming policy debates. The Biden Administration supports expanding Medicaid HCBS through legislative changes to eliminate waiver waiting lists. COVID relief legislation being discussed in Congress would provide a time-limited 7.35 percentage point increase in federal Medicaid matching funds for state spending on HCBS, to fund a variety of activities to expand access to HCBS and support direct care providers during the COVID-19 public health emergency. Policymakers also may consider legislation to end Medicaid’s historical institutional bias by making HCBS a mandatory benefit, a policy that has garnered more interest in the recent months, given COVID-19’s disproportionate impact on people in institutional settings.

Issue Brief

Introduction

Medicaid is a key source of coverage for seniors and people with disabilities, including those who need long-term services and supports (LTSS) to meet daily self-care and independent living needs. Many of the Medicaid eligibility pathways that are based on old age or disability, and nearly all home and community-based services (HCBS), are offered at state option, resulting in variation among states. Waivers continue to be the primary way that states expand financial eligibility and offer HCBS benefit packages to seniors and people with disabilities.

Unlike Medicaid state plan authorities, which require states to cover (and provide federal matching funds for) everyone who meets the associated eligibility criteria, waivers allow states to limit the number of people served. States’ ability to cap HCBS waiver enrollment can result in waiting lists when the number of people seeking services exceeds the number of waiver slots available. More than three-quarters of states (41) reported a HCBS waiver waiting list in 2018 (the most current year for which data are available).1 

Waiting lists are one proxy for unmet need for HCBS, but waiting lists alone are an incomplete measure of state capacity and unmet need. Waiting lists reflect the populations a state chooses to serve and how the state defines those populations, as well as the resources it commits. In addition, states’ waiting list management approaches differ with regard to prioritization and eligibility screening processes, making comparisons across states difficult. While some Affordable Care Act (ACA) opponents cite waiver waiting lists to argue that expansion diverts funds from seniors and people with disabilities in need of HCBS, research shows that the ACA Medicaid expansion has led to gains in coverage for people with disabilities and chronic illnesses. The ACA expansion is a pathway to Medicaid eligibility for people with disabilities, many of whom previously were ineligible for coverage (Box 1). In addition, HCBS waiver waiting lists predate the ACA Medicaid expansion, which became effective in most states in 2014. Waiver enrollment caps have existed since HCBS waiver authority was added to federal Medicaid law in the early 1980s, and states have reported waiver waiting lists in each year of the KFF 50-state Medicaid HCBS waiver program survey, dating back to 2002. Among the nearly 820,000 people on an HCBS waiver waiting list nationally, two-thirds reside in a non-expansion state.2 

This brief takes a closer look at multiple measures beyond waiver waiting lists to evaluate state choices about optional Medicaid eligibility pathways, spending, and services for seniors and people with disabilities as of 2018.3  The analysis draws on several KFF resources, including 50-state surveys of Medicaid financial eligibility pathways for seniors and people with disabilities, HCBS waiver programs, and state plan benefits offered, as well as state Medicaid LTSS expenditures reported by Mathematica.4  We find substantial state variation in adoption of policies to expand Medicaid for seniors and people with disabilities, with states’ ACA expansion status not a strong predictor of policy choices related to seniors and people with disabilities. The Appendix contains detailed data tables. Understanding current state-level variation in Medicaid eligibility, spending, and services for seniors and people with disabilities will be important to inform upcoming policy debates about proposals, including those supported by President Biden during the campaign, to expand HCBS and eliminate Medicaid’s historical institutional bias.

Box 1:  ACA Expansion as an Eligibility Pathway for People with Disabilities5 

The ACA Medicaid expansion includes – and provides a new coverage pathway for –people with disabilities and chronic conditions, some of whom previously were ineligible and may have been uninsured. Prior to the ACA, income limits for parents were very low, and there was no Medicaid eligibility pathway for childless adults. Many expansion adults have disabilities and/or chronic health conditions that may not rise to the stringent level required to establish eligibility for federal Supplemental Security Income (SSI) benefits. They also may have income and/or assets above the SSI limits: the maximum SSI benefit is about 74% of the federal poverty level (FPL, $794/month in 2021), and assets are limited to $2000. By contrast, the income limit for the expansion group is 138% FPL ($1,481/month for an individual), and there is no asset test. Other expansion group enrollees may qualify for Social Security Disability Insurance (SSDI) benefits but, without the ACA expansion pathway, could be uninsured during the required 24-month waiting period before they obtain Medicare eligibility. The benefit package for Medicaid expansion adults can include access to HCBS, such as home health or personal care state plan services. To the extent that these services meet the needs of expansion adults with disabilities or chronic conditions, these enrollees may choose not to pursue HCBS waiver coverage – and not join a waiver waiting list – because state plan coverage is available to them.

Key Areas of State Variation in Medicaid LTSS Policies

This brief takes a closer look at over 50 measures across three key areas (optional Medicaid eligibility pathways, spending, and services for seniors and people with disabilities) to assess state variation in LTSS policy choices beyond waiver waiting lists6  (Figure 1). The analysis identifies measures that demonstrate general state-level variation and measures that vary notably by states’ ACA expansion status. If a measure is presented by the binary “adopted” or “not adopted,” we consider this measure to vary notably by expansion status if it meets the following two criteria: 1) at least 15 states adopt that measure, and 2) there is at least a ten percentage point difference in the share of states that adopt that measure, by expansion status. Measures that are presented as medians or averages are considered to vary notably by expansion status if they meet the following two criteria: 1) there are at least 15 states included in calculation of the median or average, and 2) there is any degree of difference between the expansion and non-expansion averages/medians. Measures that do not vary by expansion status are considered to exhibit more general state variation.

Figure 1: Areas of State Variation in Medicaid LTSS for Seniors and People with Disabilities

Eligibility and Enrollment

We examined 14 key measures related to eligibility and enrollment policies for seniors and people with disabilities, including optional eligibility pathways, financial and functional eligibility criteria, post-eligibility treatment of income, and renewals. Specific measures are listed in Table 1. While nearly all states offer at least one optional state plan eligibility pathway based on old age or disability, state choices about which pathways adopted vary. Nearly all states choose to cover children with significant disabilities and working people with disabilities, and three-quarters cover medically needy seniors and/or people with disabilities. Less than half of states cover seniors and people with disabilities up to the federal poverty level, and very few states elect the Section 1915 (i) optional eligibility pathway (Appendix Table 1). Within these optional pathways, a minority of states opt to expand or eliminate asset limits (Appendix Tables 2-5). Nearly all states expand LTSS financial eligibility for both institutions and HCBS beyond state plan limits (Appendix Tables 6-9), and most states apply the same or less stringent financial and functional eligibility criteria to pathways for institutional LTSS and HCBS (Appendix Table 10). Post-eligibility treatment of income policies and spousal impoverishment standards vary across states (Appendix Table 11). Most states have adopted the ACA options to streamline renewals for pathways based on old age or disability (Appendix Table 12).

Table 1:  Eligibility and Enrollment Policy Options for Seniors and People with Disabilities
Policy AreaSpecific measures
Eligibility pathways
  • Adoption of optional state plan eligibility pathways
  • Adoption of HCBS waiver eligibility pathways
Financial eligibility criteria
  • Maximum income limit for optional state plan eligibility pathways
  • Maximum asset limit for optional state plan eligibility pathways
  • Maximum income limit for institutional LTSS eligibility
  • Maximum asset limit for institutional LTSS eligibility
  • Maximum income limit for HCBS waiver eligibility
  • Maximum asset limit for HCBS waiver eligibility
  • Financial eligibility criteria for HCBS are more or less stringent than institutions
Functional eligibility criteriaFunctional eligibility criteria for HCBS are more or less stringent than institutions
Post-eligibility treatment of income
  • Personal needs allowance for institutional long-term care
  • Personal needs allowance for HCBS
  • Spousal impoverishment standards (community spouse needs allowance and asset limit)
Eligibility renewal
  • Adoption of ACA streamlined renewal processes for pathways based on old age or disability

Some state policy choices related to Medicaid eligibility and enrollment for seniors and people with disabilities vary by states’ ACA expansion status, most notably with regard to optional coverage pathways. Expansion states are more likely than non-expansion states to offer coverage through certain state plan pathways, including the medically needy pathway and the buy-in for working people with disabilities (Appendix Tables 1-3, 5). Expansion states also are more likely than non-expansion states to not apply an asset limit to the buy-in for working people with disabilities (Appendix Tables 2, 5). While non-expansion states are more likely to expand financial eligibility for institutional LTSS beyond state plan pathway limits, expansion states are more likely to expand financial eligibility for several HCBS waiver populations (Appendix Tables 6-9). Expansion states typically adopt a higher median monthly personal needs allowance, expanding financial eligibility for HCBS waiver enrollees (Appendix Table 11). Additionally, non-expansion states are more likely than expansion states to adopt the ACA options to streamline Medicaid eligibility renewals for pathways based on old age or disability, including offering pre-populated forms and a reconsideration period (Appendix Table 12).7 

Spending and Other Policies to Reduce Institutional Bias

We examined 17 key measures related to Medicaid LTSS spending and other policies to reduce institutional bias, including the share of LTSS spending devoted to HCBS, participation in federal HCBS grant programs, utilization controls, and waiting lists. Specific measures are listed in Table 2. Nationally, 56% of total Medicaid LTSS dollars are spent on HCBS as opposed to institutional care, with substantial variation among states, ranging from 30% to 83% (Appendix Table 13).8  Most states participate in the Money Follows the Person program, while over one-third were both eligible for and participated in the Balancing Incentive Program (Appendix Table 14).9  Two-thirds of states apply cost caps to HCBS waiver services, while very few do so for state plan home health or personal care services (Appendix Table 15). Half of states apply hour caps to home health state plan services, while less than half do so for personal care state plan services and HCBS waiver services (Appendix Table 15). Few states apply geographic limits to their HCBS waivers (Appendix Table 15). The majority of states screen people on a HCBS waiver waiting list for eligibility prior to waiting list enrollment and prioritize individuals with certain characteristics to receive waiver services when slots become available (Appendix Table 16-17). There is substantial variation among states in the average waiting period for waiver services by target population (Appendix Table 16-17).

Table 2:  LTSS Spending and Other Policies to Reduce Institutional Bias
Policy AreaSpecific measures
LTSS spending
  • Share of overall LTSS spending devoted to HCBS
  • Share of total LTSS spending on services for people with I/DD devoted to HCBS
  • Share of total LTSS spending on services for seniors and people with physical disabilities devoted to HCBS
  • Share of total LTSS spending on behavioral health services devoted to HCBS
Federal grant programs
  • Participation in Money Follows the Person
  • Number of Money Follows the Person transitions
  • Participation in Balancing Incentive Program
Utilization controls
  • Cost caps on home health state plan services
  • Hour caps on home health state plan services
  • Cost caps on personal care state plan services
  • Hour caps on personal care state plan services
  • Cost caps on HCBS waiver services
  • Hour caps on HCBS waiver services
  • Geographic limits on HCBS waiver services
Wavier waiting lists
  • Waiting list enrollment (overall and by target population)
  • Average waiting time (overall and by target population
  • Waiting list enrollment policies (pre-screen for eligibility, waiting list priority, receipt of state plan services while waiting) – (overall and by target population)

Certain state policy choices to increase HCBS spending and reduce institutional bias vary by states’ ACA expansion status. Nearly half of all expansion states spend above the national average  (56%) of their total LTSS dollars on HCBS (vs. institutional care) compared to under one-third of non-expansion states10  (Appendix Table 13). Additionally, among the states that were eligible for the ACA’s Balancing Incentive Program (BIP), expansion states were more than twice as likely to participate as non-expansion states11  (Appendix Table 14). The overall average waiting period for waiver services was longer among individuals living in expansion states compared to non-expansion states (Appendix Tables 16-17).

Covered Services

We examined 22 key measures related to Medicaid covered services for seniors and people with disabilities, including optional state plan benefits, HCBS waiver services, and self-direction policies. Specific measures are listed in Table 3. There is a great deal of variation in terms of state adoption of optional state plan HCBS, ranging from nearly all states adopting the rehabilitative services option to eight states adopting Community First Choice (CFC) attendant services (Appendix Table 18). In addition to the rehabilitative services option, half or more of states offer targeted case management, personal care, PACE, and private duty nursing state plan benefits (Appendix Table 18). Just under half of states offer ACA health homes, while fewer states offer case management or Section 1915 (i) state plan HCBS (Appendix Table 18). States’ HCBS waiver benefit packages vary widely by target population (Appendix Tables 19-24). Nearly all states offer options to self-direct state plan and/or HCBS waiver services12  (Appendix Table 25). When evaluating state variation in policies related to optional covered services, there is no clear relationship to states’ ACA expansion status.

Table 3:  State Policy Choices About Optional Covered Services
Policy AreaSpecific measures
Optional state plan HCBS
  • Home health
  • Personal care
  • Community First Choice attendant services and supports
  • Section 1915 (i) HCBS
  • Rehabilitative services
  • Case management
  • Targeted case management
  • PACE
  • Private duty nursing
  • ACA health homes
HCBS waiver services
  • Case management
  • Home-based services
  • Day services
  • Nursing, therapy, other health services
  • Round-the-clock services
  • Supported employment
  • Other mental health/behavioral health services
  • Equipment, technology, modifications
Self-direction policies
  • Self-direction allowed for home health state plan services
  • Self-direction allowed for personal care state plan services
  • Self-direction allowed for HCBS waivers
  • HCBS waiver self-direction policies (select/dismiss worker, set worker schedule, set worker pay, allocate service budget)

Looking Ahead

Our review of a range of measures, beyond waiver waiting lists, finds substantial state variation in adoption of policies to expand Medicaid for seniors and people with disabilities, with states’ ACA expansion status not a strong predictor of policy choices related to seniors and people with disabilities. In some cases, a state’s choice to adopt the ACA expansion is associated with state take-up of options to expand eligibility for seniors and people with disabilities, while in many cases, state variation in policies for seniors and people with disabilities appears to be unrelated to ACA expansion status.

Understanding current state-level variation in Medicaid eligibility, spending, and services for seniors and people with disabilities is important to inform upcoming policy debates. President Biden during the campaign supported expanding Medicaid HCBS through legislative changes to eliminate waiver waiting lists. COVID relief legislation being discussed in Congress would provide a time-limited 7.35 percentage point increase in federal Medicaid matching funds for state spending on HCBS, to fund a variety of activities to expand access to HCBS and support direct care providers during the COVID-19 public health emergency. Policymakers also may consider legislation to end Medicaid’s historical institutional bias by making HCBS a mandatory benefit, a policy that has garnered more interest in the recent months, given COVID-19’s disproportionate impact on people in institutional settings.

Though Medicaid is serving as a safety net during the public health emergency and economic downturn, state budget shortfalls could make it challenging for states to maintain optional LTSS without additional federal fiscal support. The Families First Coronavirus Response Act provided states with a temporary 6.2 percentage point increase in federal Medicaid matching funds to support their COVID-19 response, provided that states provide continuous coverage for current enrollees and meet other maintenance of effort (MOE) requirements. Notably, a few states – all of which have adopted the ACA Medicaid expansion — reported plans to expand optional eligibility pathways based on old age or disability in FY 2021.13  Still, as the pandemic and economic downturn continue, states may be forced to look to cutting provider payments or eliminating optional benefits, without further fiscal relief. The Biden Administration has indicated that the PHE is expected to extend through 2021, which would ensure that states can continue to receive the FMAP bump and prevent states from scaling back optional eligibility pathways. The MOE prevents states from adopting eligibility standards more restrictive than those in effect on January 1, 2020, while states are receiving enhanced federal matching funds, although changes to optional benefits, cost-sharing (including for LTSS), and provider payments are permitted.

The Biden Administration can take a variety of administrative actions to support state Medicaid programs and ensure continued coverage for enrollees during the public health emergency. States are using various Medicaid emergency authorities to expand eligibility for seniors and people with disabilities, including those who need LTSS, during the pandemic, and the Biden Administration’s indication that the PHE declaration is likely to continue through 2021, ensures that these authorities remain available to states. Over half of states have expanded eligibility criteria for seniors and people with disabilities, while a few states have increased the total number of HCBS waiver enrollees served. Nearly all states have streamlined enrollment processes, and over one-third of states have eased premium and/or cost-sharing requirements for seniors and people with disabilities. After the public health emergency ends, the Biden Administration could encourage and work with states to incorporate policy changes to support coverage adopted during the pandemic into their regular Medicaid programs. CMS guidance issued in December 2020 specifically encourages states to identify any temporary authorities that increased HCBS access and make those changes permanent.

MaryBeth Musumeci and Priya Chidambaram are with KFF.Molly O’Malley Watts is with Watts Health Policy Consulting.

Endnotes

  1. KFF, Key State Policy Choices About Medicaid Home and Community-Based Services (Feb. 2020), https://modern.kff.org/medicaid/issue-brief/key-state-policy-choices-about-medicaid-home-and-community-based-services/. ↩︎
  2. Id. ↩︎
  3. To align with available data sources, this report uses states’ ACA expansion status as of 2018 (33 expansion states and 18 non-expansion states). Medicaid expansion coverage became effective January 1, 2014 in all states that have adopted the expansion except for the following: Michigan (4/1/2014), New Hampshire (8/15/2014), Pennsylvania (1/1/2015), Indiana (2/1/2015), Alaska (9/1/2015), Montana (1/1/2016), Louisiana (7/1/2016), Virginia (1/1/2019), Maine (1/10/2019 with coverage retroactive to 7/2/2018), Idaho (1/1/2020), Utah (1/1/2020), Nebraska (10/1/2020), Oklahoma (planned for 7/1/2021), and Missouri (planned for 7/1/2021). For purposes of this analysis, Idaho, Utah, Nebraska, Oklahoma, and Missouri are considered non-expansion states because they implemented expansion after 2018. ↩︎
  4. Mathematica, Medicaid Long-Term Services and Supports Annual Expenditures Report: Federal Fiscal Years 2017 and 2018 (Jan. 2021), https://www.medicaid.gov/medicaid/long-term-services-supports/downloads/ltssexpenditures-2017-2018.pdf. ↩︎
  5. KFF, People with Disabilities Are At Risk of Losing Medicaid Coverage Without the ACA Expansion (Nov. 2020), https://modern.kff.org/medicaid/issue-brief/people-with-disabilities-are-at-risk-of-losing-medicaid-coverage-without-the-aca-expansion/. ↩︎
  6. To align with available data sources, this report uses states’ ACA expansion status as of 2018 (33 expansion states and 18 non-expansion states). Medicaid expansion coverage became effective January 1, 2014 in all states that have adopted the expansion except for the following: Michigan (4/1/2014), New Hampshire (8/15/2014), Pennsylvania (1/1/2015), Indiana (2/1/2015), Alaska (9/1/2015), Montana (1/1/2016), Louisiana (7/1/2016), Virginia (1/1/2019), Maine (1/10/2019 with coverage retroactive to 7/2/2018), Idaho (1/1/2020), Utah (1/1/2020), Nebraska (10/1/2020), Oklahoma (planned for 7/1/2021), and Missouri (planned for 7/1/2021). For purposes of this analysis, Idaho, Utah, Nebraska, Oklahoma, and Missouri are considered non-expansion states because they implemented expansion after 2018. ↩︎
  7. Aside from the Medicaid expansion, the ACA introduced other reforms that simplify and modernize Medicaid eligibility and enrollment processes. All states must adopt these reforms for poverty-related coverage pathways, and states can choose whether to apply them to age and disability-related pathways. 42 C.F.R. § 435.916; KFF, Medicaid Financial Eligibility for Seniors and People with Disabilities: Findings From a 50-State Survey (June 2019), https://modern.kff.org/report-section/medicaid-financial-eligibility-for-seniors-and-people-with-disabilities-findings-from-a-50-state-survey-issue-brief/. ↩︎
  8. The overall shift in spending from institutional services to HCBS reflects decades long rebalancing efforts by states and the federal government to meet beneficiary preferences for community living and community integration obligations under the Americans with Disabilities Act and the Supreme Court’s Olmstead decision and provide services in the most cost effective setting. ↩︎
  9. The MFP program operates in 29 Medicaid expansion states and 15 non-expansion states, and as of December 2019, 101,540 individuals have transitioned from an institution into the community since MFP began. Mathematica, Money Follows the Person: State Transitions as of December 31, 2019 (Sept. 2020), https://www.medicaid.gov/medicaid/long-term-services-supports/downloads/mfp-2019-transitions-brief.pdf. ↩︎
  10. Notably, spending data for five states (CA, IL, NC, NY and VA) are excluded, as a large share of services are provided by managed care organizations for which data are unavailable. Mathematica, Medicaid Long-Term Services and Supports Annual Expenditures Report: Federal Fiscal Years 2017 and 2018 (Jan. 2021), https://www.medicaid.gov/medicaid/long-term-services-supports/downloads/ltssexpenditures-2017-2018.pdf. ↩︎
  11. The BIP offered states temporary enhanced federal matching funds for Medicaid HCBS in exchange for making certain structural changes to their LTSS delivery systems. Participation in BIP was limited to states that, as of 2009, were devoting less than half of their total Medicaid LTSS spending to HCBS; 14 expansion states and four non-expansion participated. This total excludes three states (IN, LA, and NE) who initially participated in BIP but terminated their programs before completion. KFF, Medicaid Balancing Incentive Program: A Survey of Participating States (June 2015), https://modern.kff.org/medicaid/report/medicaid-balancing-incentive-program-a-survey-of-participating-states/. ↩︎
  12. Self-direction typically allows individuals to select and dismiss their direct care workers and determine workers schedules. Most states also allow individuals to set worker payment rates and/or allocate their service budgets. ↩︎
  13. California is expanding financial eligibility for the optional aged, blind, disabled population from 100% to 138% FPL and adding a new income disregard in the amount of the Medicare Part B premium. New Hampshire plans to expand its Medicaid buy-in program for working people with disabilities to include seniors up to 250% FPL. Louisiana is expanding HCBS waiver coverage for children with significant disabilities without regard to household income and assets. KFF, State Medicaid Programs Respond to Meet COVID-19 Challenges: Results from a 50-State Medicaid Budget Survey For State Fiscal Years 2000 and 2001 (Oct. 2020), https://modern.kff.org/medicaid/report/state-medicaid-programs-respond-to-meet-covid-19-challenges/. ↩︎
News Release

Most Americans Now Say They’ve Gotten At Least One Dose of a COVID-19 Vaccine or Want to Get Vaccinated As Soon As Possible, with Enthusiasm Rising Across Racial, Ethnic and Partisan Groups

Published: Feb 26, 2021

While Enthusiasm Rises, a Persistent Minority Say They Definitely Will Not Get Vaccinated; Republicans, Rural Residents, and Essential Workers Outside Health Care Are Most Reluctant Groups

More than half of Americans (55%) now say they want to get vaccinated as soon as possible (37%) or have already received at least one dose (18%), up 8 percentage points over the past month as more people have gotten at least an initial vaccine dose, the latest KFF COVID-19 Vaccine Monitor reports.

An additional 1 in 5 (22%) are open to getting a vaccine but want to “wait until it has been available for a while to see how it is working for others,” down from 31% a month ago as more people have gotten vaccinated.

“We’re seeing more Americans who want to get vaccinated, but Black, Hispanic and rural Americans will be left behind unless special efforts are made to increase vaccine confidence in those communities,” KFF President and CEO Drew Altman said.

The latest report shows that all demographic groups are seeing an increase in the share who have already been or want to get vaccinated as soon as possible, though eagerness varies substantially.

People ages 65 and over (44% vaccinated, 33% as soon as they can) and Democrats (23% vaccinated, 52% as soon as they can) are the most eager. Black adults and young adults under age 30 are most likely to say they want to “wait and see” before getting vaccinated, with a third of each group describing themselves that way, along with a quarter (26%) of Hispanic adults.

While the two COVID-19 vaccines currently being used involve two doses, a third may soon be available that would require just one dose. About a quarter (26%) of those who want to “wait and see” say they would be more likely to get vaccinated if it required only a single shot.

About 1 in 5 (22%) are more reluctant about getting vaccinated, including 7% who say they would do so “only if required” for work, school or other activities, and 15% who say they definitely will not get vaccinated. The most reluctant groups include Republicans, essential workers who work outside health care, and people living in rural areas.

The overall size of this reluctant group is little changed since December, suggesting they are less influenced by news and others’ experiences than those in the “wait and see” camp.

Side Effects Remain People’s Biggest Concern, Though Some Worry about Financial Costs

Side effects remain people’s biggest concern – most (56%) of those who have not been vaccinated, including 80% of those in the “wait and see” group, are concerned they might experience serious side effects from the vaccine.

About a third of those who have not been vaccinated also say they are concerned about potentially having to pay out of pocket for the vaccine (35%), missing work because of side effects (34%), or getting COVID-19 from the vaccine (33%).

Each of these concerns is more prevalent among the “wait and see” group, including at least half of Black and Hispanic adults in this group who say they are concerned about getting COVID from the vaccine (61% and 67%, respectively), missing work due to side effects (58% and 66%), or having to pay out of pocket (50% and 61%).

In addition, about half (52%) of Black adults and 58% of Hispanic adults in the “wait and see” group are concerned they won’t be able to get the vaccine from a place they trust.Among people who have not yet been vaccinated, those with a household member (69%) or a close friend or family member (49%) who has already gotten vaccinated are more likely to say they want the vaccine as soon as possible than those who only know an acquaintance (33%) or don’t know anyone who has gotten the vaccine (36%).

Many Black and Hispanic Adults Lack Confidence Vaccines Were Adequately Tested In Their Groups

The Vaccine Monitor also gauges how Black and Hispanic adults view the vaccines’ development and whether they were tested adequately for safety and effectiveness among people like them.

Half of Black adults say they are not confident that the COVID-19 vaccines were adequately tested among Black people, and one-third of Hispanic adults lack confidence in the testing among Hispanic people.

Confidence about the testing process is related to people’s eagerness to get vaccinated. Compared to their less confident peers, Black and Hispanic adults who are confident that the vaccine has been adequately tested among their own racial or ethnic group are about twice as likely to say they’ve already been vaccinated or want the vaccine as soon as possible.

Designed and analyzed by public opinion researchers at KFF, the KFF Vaccine Monitor survey was conducted from Feb.15-23 among a nationally representative random digit dial telephone sample of 1,874 adults, including oversamples of adults who are Black (507) or Hispanic (506). Interviews were conducted in English and Spanish by landline (339) and cell phone (1,535). The margin of sampling error is plus or minus 3 percentage points for the full sample. For results based on subgroups, the margin of sampling error may be higher.

The KFF COVID-19 Vaccine Monitor is an ongoing research project tracking the public’s attitudes and experiences with COVID-19 vaccinations. Using a combination of surveys and qualitative research, this project tracks the dynamic nature of public opinion as vaccine development and distribution unfold, including vaccine confidence and acceptance, information needs, trusted messengers and messages, as well as the public’s experiences with vaccination.

News Release

States Have Made Progress in Vaccinating Older Adults Against COVID-19 in Recent Weeks, But No State Has Vaccinated At Least Half of its Older Population

Published: Feb 26, 2021

Twenty-two states and the District of Columbia have vaccinated at least one-third of their residents who are 65 and older against COVID-19, an updated KFF analysis finds, but no state has crossed the threshold of vaccinating 50 percent or more of its older population.

The share of adults 65 and older who have received at least one dose of a vaccine ranges from 49 percent in North Carolina to 27 percent in Pennsylvania. (The relatively low rate in Pennsylvania is partly explained by data not included from Philadelphia county.) The analysis examines COVID-19 vaccination rates among older adults in the 33 states and DC that reported such data at the person-level as of February 23, 2021.

Moreover, between February 4 and February 23, vaccination rates among older adults have increased across each state that reported consistently at both points in time, with increases ranging from 10 to 22 percentage points.

Nationally, about 41 percent of adults 65 and older have received at least one dose of a COVID-19 vaccine, according to the federal Centers for Disease Control and Prevention and KFF estimates. That’s a considerably higher rate than the 14 percent of the overall U.S. population that has received at least one dose of a vaccine.

While 33 states and DC report vaccinations by age at the person level, just two states — South Carolina and Washington — report the data by both age and race/ethnicity, the new analysis finds. In these states, the data shows that larger shares of older White adults have been vaccinated than older Black and Hispanic adults.

Older adults are more vulnerable to serious illness and death from the novel coronavirus. Since January 12, the federal government has recommended that states expand vaccine eligibility to anyone 65 and older. As of February 22, 41 states and the District of Columbia had done so.

For more data and analyses regarding COVID-19 and vaccination efforts, including KFF’s Vaccine Monitor project, visit kff.org.

Poll Finding

KFF COVID-19 Vaccine Monitor: February 2021

Published: Feb 26, 2021

Findings

The KFF COVID-19 Vaccine Monitor is an ongoing research project tracking the public’s attitudes and experiences with COVID-19 vaccinations. Using a combination of surveys and qualitative research, this project tracks the dynamic nature of public opinion as vaccine development and distribution unfold, including vaccine confidence and acceptance, information needs, trusted messengers and messages, as well as the public’s experiences with vaccination.

Key Findings

  • As COVID-19 vaccination distribution efforts continue across the United States, the latest KFF COVID-19 Vaccine Monitor reports that a majority (55%) of U.S. adults now say they have received at least one dose of the vaccine (18%) or that they will get it as soon as they can (37%), up from 47% in January and 34% in December. The share that wants to “wait and see” how the vaccine is working for others before getting vaccinated themselves decreased from 31% in January to 22% in February, while a persistent one in five say they will get the vaccine “only if required for work, school, or other activities” (7%) or will “definitely not” get vaccinated (15%).
  • While the share that is most enthusiastic to get vaccinated increased across racial and ethnic groups, Black and Hispanic adults continue to be more likely than White adults to say they will “wait and see” before getting vaccinated. Nearly four in ten Republicans and three in ten rural residents say they will either “definitely not” get vaccinated or will do so “only if required,” as do one-third (32%) of those who have been deemed essential workers in fields other than health care.
  • With the potential arrival of a one-dose COVID-19 vaccine to the U.S. market, most of those who have not yet been vaccinated say the number of doses doesn’t make a difference in their own intentions, but about a quarter (26%) of those in the “wait and see” group say they’d be more likely to get a vaccine if only one dose was required.
  • Having a close relationship with someone who’s been vaccinated is correlated with individuals’ own intentions to get the COVID-19 vaccine. Among those who have not yet been vaccinated, seven in ten of those with a household member who’s been vaccinated and about half of those who say a close friend or family member has been vaccinated say they want the vaccine “as soon as possible,” compared to about a third of those who don’t have a close relationship to someone who’s gotten the vaccine. Black and Hispanic adults, those with lower incomes, and those without a college degree are less likely than their counterparts to say someone close to them has gotten the vaccine, reflecting other KFF analysis showing similar disparities.
  • The perceived side effects of the vaccine continue to be a top concern for the public, with eight in ten in the “wait and see” group saying they are concerned they might experience serious side effects if they get vaccinated. Large shares of those who want to “wait and see” – including majorities of Black and Hispanic adults – also say they are concerned that they might get COVID-19 from the vaccine, they might have to miss work if the side effects make them feel sick, they may have to pay an out-of-pocket cost to get vaccinated (despite the fact that the vaccine is available for free to everyone), or they won’t be able to get the vaccine from a place they trust.
  • Half of Black adults and about one-third Hispanic adults (35%) say they are not confident that the COVID-19 vaccines have been adequately tested for safety and effectiveness among members of their own racial or ethnic group, and those who aren’t confident in this type of testing are much less likely to say they’ve already been vaccinated or want the vaccine as soon as they can get it.

COVID-19 Vaccine Uptake and Intentions

More than half of U.S. adults (55%) now say they have already received at least one dose of the COVID-19 vaccine (18%) or they want it as soon as possible (37%). This is an increase from 47% in mid-January and up from 34% in early December before vaccine distribution began. About one in five adults (22%) say they will “wait and see” how the vaccine is working for others before getting vaccinated themselves, a share that is down from 31% in January and 39% in December. The remaining public say they will get the vaccine “only if required for work, school, or other activities” (7%) or that they will “definitely not” get vaccinated (15%), shares that have not changed much over the past two months.

Across racial and ethnic groups, there was a steady increase from December to February in the share of adults who say they’ve already been vaccinated for COVID-19 or want the vaccine as soon as possible, and a corresponding decrease in the share who say they will “wait and see” before getting vaccinated. Despite this movement, differences in vaccine enthusiasm between members of different racial and ethnic groups persist. For example, six in ten White adults (61%) say they have already gotten the vaccine or want it as soon as possible compared to about half (52%) of Hispanic adults and four in ten Black adults (41%).

The Monitor also reports changes in vaccine enthusiasm across partisans, with large gaps in enthusiasm remaining between groups. Between December and February, there was a large increase in the share of Democrats who report being vaccinated or wanting to do so as soon as possible (from 47% to 75%) and a more modest increase among Republicans (from 28% to 41%). A substantial share of Republicans remain more resistant to getting vaccinated, with 28% saying they will “definitely not” get the shot.

Similarly, there has been an increase in COVID-19 vaccine enthusiasm across residents of urban, suburban, and rural areas since December, and now at least half of each group say they have already gotten the vaccine or want it as soon as possible (55% of urban, 56% suburban, and 53% of rural residents). Still, a larger share of rural (24%) compared to urban (13%) and suburban (14%) adults say they will “definitely not” get the vaccine.

Which Groups Are Most Enthusiastic/Cautious/Resistant?

While there has been an overall shift towards greater enthusiasm for getting a COVID-19 vaccination, the demographic groups that are the most enthusiastic, most cautious, and most resistant remain similar to those reported in January. About three-quarters of adults ages 65 and over (77%) and a similar share of Democrats (75%) say they have either already gotten at least one dose of the vaccine or will do so as soon as they can. About two-thirds of college graduates (67%) and those who work in health care delivery settings (65%) also fall into this most enthusiastic group.

About one in five adults overall (22%) say they want to “wait and see” how the vaccine is working for other people before getting vaccinated themselves, including about a third of Black adults (34%) and those between the ages of 18-29 (33%), and about a quarter of Hispanic adults (26%), those without college degrees (25%), and essential workers in non-health fields (25%).

Four in ten Republicans (38%) say they will get a COVID-19 vaccine “only if required” or will “definitely not” get vaccinated, as do about three in ten (28%) of adults living in rural areas. Notably, about one-third of those who say they’ve been deemed “essential workers” and are required to work outside their homes during the pandemic (excluding those who work in health care settings) say they will get the vaccine “only if required” (9%) or will “definitely not” get it (24%).

Demographic Differences In Vaccine Intentions

Looking at patterns of vaccine intentions across demographic groups, it’s notable that lower levels of enthusiasm among Black adults compared to White adults persist even after controlling for education levels. For example, among White adults without a college degree, 54% say they’ve already gotten the vaccine or will get it as soon as they can, compared to 38% of Black adults without a college degree. Similarly, among those who have graduated from college, vaccine uptake and enthusiasm is higher among White adults (72%) compared to their Black counterparts (48%).

Adults ages 65 and over are one of the target groups for early vaccination, and one of the groups most likely to say they’ve already been vaccinated or want the vaccine as soon as possible. Looking at vaccine intentions by a combination of race and age, large majorities of both Black and White adults ages 65 and over fall into the most enthusiastic categories. However, while nearly half of older White adults (46%) say they they’ve already gotten the vaccine, about one-third of Black older adults say the same (35%). Half (46%) of Black adults 65 and older say they will get it as soon as they can.

Among younger age groups, Black adults are nearly twice as likely as White adults to say they will “wait and see” before getting vaccinated (35% vs. 18% among those ages 50-64 and 41% vs. 23% among those ages 18-49).

Two-Dose Versus Single-Dose Vaccine

With the potential arrival of a single-dose vaccine to the U.S. market, the Vaccine Monitor probed people’s willingness to get a vaccine that required only one dose as opposed to the currently available two-dose vaccines. A large majority (83%) of those who have not yet been vaccinated say that the number of doses doesn’t make a difference in their own intentions to get vaccinated. However, about a quarter of (26%) of those who want to “wait and see” before getting vaccinated say they’d be more likely to get a vaccine if only one dose was required (including 20% of Black adults, 28% of Hispanic adults, and 29% of White adults in the “wait and see” group).

Personal Experiences With COVID-19 Vaccination

Having a close relationship with someone who’s been vaccinated is correlated with individuals’ own intentions to get the COVID-19 vaccine. Among those who have not yet gotten the vaccine but live in a household with someone who has been vaccinated, about seven in ten (69%) say they will get the vaccine as soon as they can. Similarly, about half (49%) of those who say a close friend or family member outside of their household has been vaccinated are in the “as soon as possible” group. Among those who have only a casual connection or no connection to someone who’s been vaccinated, about one-third say they want the vaccine as soon as they can get it, while larger shares (compared to those with a close personal connection to someone who’s been vaccinated) say they want to “wait and see” before getting vaccinated.

Given this association between having a close relationship to someone who has gotten the vaccine and an individual’s personal level of vaccine enthusiasm, it’s notable that Black and Hispanic adults, those with lower incomes, and those without college degrees are less likely than their counterparts to report having these connections. For example, three-quarters of White adults have a close personal connection to someone who has gotten the vaccine (including themselves) compared to 57% of Black and Hispanic adults. Similarly, 83% of those with incomes of $90,000 or more report a close personal connection to someone who has been vaccinated compared to 59% of those with incomes under $40,000, as do 86% of college graduates compared to 64% of adults without college degrees.

Personal Concerns About COVID-19 Vaccination

The February COVID-19 Vaccine Monitor probed a variety of personal concerns people might have when it comes to receiving a vaccine. As reported previously, side effects remain a prominent concern; over half (56%) of those who have not yet been vaccinated, including 80% of those in the “wait and see” group, say they are “very concerned” or “somewhat concerned” that they might experience serious side effects from the vaccine. Other concerns cited by about a third of the unvaccinated and about half of those in the “wait and see” group” are that they might have to pay out of pocket for the vaccine (despite the fact that the vaccine is available at no cost), they might have to miss work if the vaccine’s side effects make them feel sick, or that they might get COVID-19 from the vaccine.

While the possibility of experiencing serious side effects from the vaccine is a top concern across racial and ethnic groups, larger shares of Black and Hispanic adults compared to White adults in the “wait and see” category express concern that they might get COVID-19 from the vaccine, might miss work due to side effects, or have to pay out of pocket to get vaccinated (despite the fact that the vaccine is free for everyone). Among those who want to “wait and see,” about six in ten Hispanic adults (58%) and about half of Black adults (52%) are concerned that they won’t be able to get the vaccine from a place they trust, compared with about one-third of White adults (32%). In addition, about four in ten Hispanic adults in this group are concerned that they might need to take time off work to get vaccinated (43%) or they will have difficulty traveling to a vaccination site (39%).

Confidence In Vaccine Development And Testing Among Black And Hispanic Adults

Concerns about COVID-19 vaccination among Black and Hispanic adults may be linked to perceptions of whether people of color were represented in clinical trials and other vaccine research. In fact, half of Black adults say they are “not too confident” or “not at all confident” that the COVID-19 vaccines were adequately tested for safety and effectiveness specifically among Black people, and about a third of Hispanic adults (35%) say the same thing about testing among Hispanic people.

Confidence in adequate testing among one’s own racial or ethnic group is related to vaccine intentions and enthusiasm among Black and Hispanic adults. Those who are at least somewhat confident that the vaccines have been adequately tested for safety and effectiveness among their own racial or ethnic group are about twice as likely to say they’ve already been vaccinated or want the vaccine as soon as they can get it compared to those who are not confident (58% vs. 24% among Black adults, 63% vs. 30% among Hispanic adults).

Methodology

This KFF COVID-19 Vaccine Monitor was designed and analyzed by public opinion researchers at the Kaiser Family Foundation (KFF). The survey was conducted February 15-23, 2021, among a nationally representative random digit dial telephone sample of 1,874 adults ages 18 and older (including interviews from 506 Hispanic adults and 507 non-Hispanic Black adults), living in the United States, including Alaska and Hawaii (note: persons without a telephone could not be included in the random selection process). Phone numbers used for this study were randomly generated from cell phone and landline sampling frames, with an overlapping frame design, and disproportionate stratification aimed at reaching Hispanic and non-Hispanic Black respondents. Stratification was based on incidence of the race/ethnicity subgroups within each frame. Specifically, the cell phone frame was stratified as: (1) High Hispanic: Cell phone numbers associated with rate centers from counties where at least 35% of the population is Hispanic; (2) High Black: Cell phone numbers associated with remaining rate centers from counties where at least 35% of the population is non-Hispanic Black; (3) Else: numbers from all remaining rate centers. The landline frame was stratified as: (1) High Black: landline exchanges associated with Census block groups where at least 35% of the population is Black; (2) Else: all remaining landline exchanges. The sample also included 190 respondents reached by calling back respondents that had previously completed an interview on the KFF Health Tracking poll at least nine months ago. Another 387 interviews were completed with respondents who had previously completed an interview on the SSRS Omnibus poll (and other RDD polls) and identified as Hispanic (n = 180; including 50 in Spanish) or non-Hispanic Black (n=207). Computer-assisted telephone interviews conducted by landline (339) and cell phone (1,535, including 1,143 who had no landline telephone) were carried out in English and Spanish by SSRS of Glen Mills, PA. To efficiently obtain a sample of lower-income and non-White respondents, the sample also included an oversample of prepaid (pay-as-you-go) telephone numbers (25% of the cell phone sample consisted of prepaid numbers) Both the random digit dial landline and cell phone samples were provided by Marketing Systems Group (MSG). For the landline sample, respondents were selected by asking for the youngest adult male or female currently at home based on a random rotation. If no one of that gender was available, interviewers asked to speak with the youngest adult of the opposite gender. For the cell phone sample, interviews were conducted with the adult who answered the phone. KFF paid for all costs associated with the survey.

The combined landline and cell phone sample was weighted to balance the sample demographics to match estimates for the national population using data from the Census Bureau’s 2019 U.S. American Community Survey (ACS), on sex, age, education, race, Hispanic origin, and region, within race-groups, along with data from the 2010 Census on population density. The sample was also weighted to match current patterns of telephone use using data from the January- June 2020 National Health Interview Survey. The weight takes into account the fact that respondents with both a landline and cell phone have a higher probability of selection in the combined sample and also adjusts for the household size for the landline sample, and design modifications, namely, the oversampling of prepaid cell phones and likelihood of non-response for the re-contacted sample. All statistical tests of significance account for the effect of weighting.

The margin of sampling error including the design effect for the full sample is plus or minus 3 percentage points. Numbers of respondents and margins of sampling error for key subgroups are shown in the table below. For results based on other subgroups, the margin of sampling error may be higher. Sample sizes and margins of sampling error for other subgroups are available by request. Note that sampling error is only one of many potential sources of error in this or any other public opinion poll. Kaiser Family Foundation public opinion and survey research is a charter member of the Transparency Initiative of the American Association for Public Opinion Research.

This work was supported in part by a grant from the Chan Zuckerberg Initiative DAF, an advised fund of Silicon Valley Community Foundation. We value our funders. KFF maintains full editorial control over all of its policy analysis, polling, and journalism activities.

GroupN (unweighted)M.O.S.E.
Total1,874± 3 percentage points
COVID-19 Vaccination Status
Have gotten at least one dose of the COVID-19 vaccine390± 7 percentage points
Have not gotten the COVID-19 vaccine1,481± 4 percentage points
Race/Ethnicity
White, non-Hispanic733± 4 percentage points
Black, non-Hispanic507± 6 percentage points
Hispanic506± 5 percentage points
Party Identification
Democratic764± 5 percentage points
Republican328± 7 percentage points
Independent555± 6 percentage points

Vaccinating Older Adults in the US Against COVID-19: A Work in Progress

Published: Feb 25, 2021

Data Note

Since the beginning of the coronavirus pandemic, older adults have been at greater risk of serious illness, hospitalization, and death due to COVID-19. In December 2020, the FDA issued Emergency Use Authorizations for two COVID-19 vaccines. At the time, the CDC Advisory Committee on Immunization Practices (ACIP) issued recommendations to give the highest priority to health care workers, and residents and staff in long-term care facilities. In mid-January 2021, the Trump Administration advised states to expand vaccine eligibility to people ages 65 and older – a population totaling more than 54 million, in addition to residents of long-term care facilities – in order to reach a broader population of high-risk individuals. This recommendation was reinforced by the Biden Administration. In response, many states changed their vaccination plans and started vaccinating adults 75 and older (consistent with ACIP recommendations), before expanding to include adults 65 and older. As of February 22, 2021, most states (41) and the District of Columbia have expanded eligibility for COVID-19 vaccines to include people 65 and older (Appendix Table 1).

Although demand for COVID-19 vaccines continues to outstrip supply, the pace of COVID-19 vaccinations nationwide is increasing, with average daily vaccinations rising from 1.1 million per day in mid-January to 1.7 million per day as of February 17, 2021. According to the CDC, more than 45 million people, or about 14% of the US population, have received at least one dose of a COVID-19 vaccine. Among adults 65 and older, the vaccination rate is considerably higher at about 41%, according to the CDC and our estimates based on 2019 Census data and long-term care facility data. In fact, people 65 and older, including residents of long-term care facilities who are primarily in this age group, account for more than half (54%) of all people who have received at least one COVID-19 vaccine dose to date.

This analysis examines COVID-19 vaccination rates among older adults in the 33 states and DC that reported these data at the person-level as of February 23, 2021 (Figure 1). It also looks at the change in vaccination rates between February 4 and February 23 among a subset of these states (18 and DC) that reported consistently at both points in time. The analysis includes states reporting vaccination data by age where the data reflect the number or share of people who have received at least one dose of the vaccine; we exclude states that report the number or share of doses administered (California, Delaware, Illinois, Iowa, Nevada, New Jersey, and Virginia; see methods). Of the 33 states and DC in our analysis, 28 states plus DC have expanded vaccinations to adults 65 and older; five states have not expanded eligibility to people ages 65 and older (Kentucky, Maine, New Mexico, Oregon, and Vermont). Most of these states (21 and DC) report vaccinations among adults 65 and older, while 12 report for adults 60 and older. We report results separately for these two groups.

About Two-Thirds of All States Are Currently Reporting the Number of Older Adults Vaccinated

Findings

Of the 33 states and DC in our analysis, 22 states and the District of Columbia have vaccinated at least one-third of older adults, but no state has reported crossing the 50% threshold (Figure 2). Among the 21 states and DC reporting data for people 65 and older, 4 states report vaccinating a larger share of their 65 and older population than the national average, which is 41% (North Carolina, Florida, Arizona, South Carolina). The share of adults 65 and older who have received at least one dose of the vaccine ranges from 49% in North Carolina to 27% in Pennsylvania. The relatively low rate in Pennsylvania may be partly explained by data not included from Philadelphia county.

Two states – Florida and Texas – included people ages 65 and older in the initial prioritization group (that is, before the federal government advised including them) and report vaccination rates by age. (A third state, Georgia, also vaccinated older adults from the outset but does not report vaccination rates among older adults.) As of February 23, Florida has a higher vaccination rate among older adults than Texas (45% vs. 38%). The lower rate in Texas may be due in part to delays resulting from the recent winter storm that wreaked havoc on the state.

The Majority of Older Adults Have Not Yet Received At Least One Dose of the Vaccine Across States

Among the 12 states that report COVID-19 vaccinations for people ages 60 and older, two states (Alaska and Indiana) report vaccinating more than 41% of people 60 and older. The share of adults 60 and older who have received at least one dose ranges from 49% in Alaska to 21% in Oregon.

Between February 4 and February 23, vaccination rates among older adults have increased across states that reported consistently at both points in time, with increases ranging from 10 to 22 percentage points (Figure 3). The share of adults ages 65 and older who have received at least one dose of the vaccine has increased by 20 percentage points or more in Nebraska (15% to 37%), Minnesota (18% to 39%), and Wisconsin (21% to 41%). Over this time period, Mississippi had the smallest increase among states reporting vaccinations for people 65 and older, at 10 percentage points (29% to 39%). We were able to track trends for 18 states and DC but were unable to track trends for all states that report vaccination rates (for additional information, see methods).

The Share of Older Adults Who Have Received At Least One COVID-19 Vaccine Dose Has Increased Across States

Among the states reporting vaccination rates among people 60 and older, South Dakota had the largest increase in the share of older adults vaccinated (16% to 36%), while Oregon had the smallest increase (11% to 21%).

Older adults account for a majority of people who have received vaccines in more than half of the states in our analysis, based on the total number of people in the state who have received at least one dose (Figure 4). Among the 21 states and DC reporting vaccinations among people 65 and older, this population accounts for half or more of all people receiving at least one dose in DC and 11 states (Florida, North Carolina, South Carolina, Alabama, Mississippi, West Virginia, Connecticut, Arizona, Ohio, Michigan, Washington). The share of all people who have received a first dose who are 65 and older ranges from 76% in Florida – which likely reflects Florida’s decision to prioritize the 65 and older population before the revised federal guidance was announced – to 33% in Pennsylvania. The relatively low rate in Pennsylvania may be partly explained by data not included from Philadelphia county.

In the 12 states reporting vaccinations by age for adults 60 and older, this age cohort accounts for half or more of all people who have received one or more doses in 8 states (Indiana, Louisiana, Maine, Tennessee, South Dakota, Colorado, Maryland, Utah) ranging from 72% in Indiana to 40% in Oregon.

Older Adults Comprise the Majority of Individuals Who Have Received At Least One Dose of the Vaccine in More than Half of States

Very few states report vaccination rates among older adults by race/ethnicity or gender. Among the 33 states and DC that report vaccinations by age at the person level, just two (South Carolina and Washington) report both age and race/ethnicity. Based on data from South Carolina and Washington State, older White adults have been vaccinated at higher rates than older Black adults. In South Carolina, 37% of White adults ages 65 and older have received at least one dose of a COVID-19 vaccine, as compared to 28% of Black adults ages 65 and older. In Washington State, 23% of all White adults 65 and older have received at least one dose of the vaccine, but only 16% of Black older adults and 19% of Hispanic older adults have been vaccinated.

The dearth of vaccination data for older adults by race/ethnicity in most states makes it more difficult to determine how best to direct resources to people who are disproportionately affected by the pandemic or are currently experiencing vaccine access issues. Only three states (Arizona, South Carolina, and Texas) report vaccination rates among the 65 and older population by gender.

Discussion

As of February 23, 2021, the majority of states have expanded eligibility for COVID-19 vaccines to include people ages 65 and older, and according to CDC and our estimates, about 41% of older adults have had at least one dose. Our analysis of state-level data shows a fair amount of variation across states that are reporting vaccination data by age. At the high end, 4 states report that more than four in 10 adults ages 65 and older have received a COVID vaccine dose, above the national average. Among states that have reported vaccination rates among older adults consistently over the past few weeks, it is clear that progress is being made in vaccinating older adults, with some states making more headway than others, as supply remains a concern.

The variation in vaccination rates among older adults across states may be due to a number of factors, including timing (when they first expanded eligibility to people 65 and older), the supply of vaccines received relative to their older population, the ability of states to increase the number of vaccinations per day, and sign-up procedures that vary across states, and within states across counties. These variations contribute to a host of problems older adults have encountered getting vaccinated, including not knowing how to schedule appointments or where to get vaccinated, waiting in long lines, or arriving for an appointment to find vaccines no longer available. Underlying inequities in resources, such as access to technology and transportation, may further increase barriers to vaccination for seniors of color.

In general, our analysis shows that states have made progress in vaccinating older adults in recent weeks amidst ongoing concerns about an insufficient supply of vaccine, but there is still a way to go before a large majority of this population has been vaccinated.

Methods

This analysis uses publicly available data from state websites pertaining to vaccine administration retrieved on February 23, 2021. Population estimates by age for each state come from the 2019 US Census Bureau.

There are some data limitations. States report vaccinations differently. States vary in whether they report the number of people who have received at least one vaccine dose, people who have received one dose and people who have received two doses, or total vaccinations administered. Where possible, we report data for the total number of people who have received at least one vaccine dose. However, some states only report total doses administered for age data, meaning people who have received two doses may be included in the data twice, and therefore are excluded from this analysis. It is not possible to calculate the overall share of older adults in the US who have received at least one dose of the COVID-19 vaccine based on state-level data in California, Delaware, Illinois, Iowa, Nevada, New Jersey, and Virginia. Further, North Dakota only reports percentages and not data on underlying counts of people vaccinated, and are also excluded from this analysis. As of 2/23/21, Pennsylvania's vaccine dashboard data does not include data from Philadelphia county due to differences in reporting criteria.

States also vary in the age increments they report, with some reporting data for those 65 and older with others reporting 60 and older. Tennessee reports data for adults 61 and older. Hawaii reports age data for adults 75 and older and are not included in this analysis.

We were not able to track the share of older adults who have received at least one dose of the vaccine from February 4 to February 23 in all states, either because the methodology used to report vaccination rates changed over time (Colorado, Indiana, West Virginia), the age cohort reported changed over time (Massachusetts, Ohio, Rhode Island, Vermont) or because they did not report vaccination rates among older adults as of February 4 (Alabama, Arizona, Connecticut, Kentucky, New Mexico, South Carolina, Utah, Washington).

State-level data may or may not include doses delivered and administered from the Retail Pharmacy Program, the Federally Qualified Health Centers Program, and Federal Emergency Management Agency (FEMA) community vaccination sites. States also vary in whether their age data include long-term care facility residents. Currently, only six states (Alabama, Kentucky, Massachusetts, Maine, Mississippi, Nebraska) explicitly state that their age data include data from the Pharmacy Partnership for Long-Term Care and other long-term care facilities. Michigan specifies that data on long-term care vaccinations are not fully captured in their age data. North Carolina also specifies that data on doses administered as part of the Partnership are not reflected in their age data. The remainder of the states either do not specify whether their age data include data from long-term care facilities, or in others, it was unclear based on the description. According to CDC data, nearly 2 million residents of long-term care facilities received at least one dose of the vaccine nationwide, most of whom are presumably older than age 65. If states do not take into account long-term care residents who have been vaccinated, the shares reported here may somewhat understate the total share of older adults that have received at least one dose in those states. Finally, it is possible that the estimates of vaccination rates based on state websites may be low if there is a lag in reporting by states.

Appendix

41 States and DC Have Expanded Vaccine Eligibility to Adults 65 and Older; 13 of These States Do Not Report the Number of Adults Who Have Received At Least One Dose of the Vaccine

OBGYNs and the Provision of Sexual and Reproductive Health Care: Key Findings from a National Survey

Authors: Gabriela Weigel, Brittni Frederiksen, Usha Ranji, and Alina Salganicoff
Published: Feb 25, 2021

Overview

An updated version of this report was released on June 21,  2023 and can be found here.

Introduction

Access to sexual and reproductive health (SRH) care in the U.S. is influenced by a variety of factors, including patients’ coverage, social determinants of health, as well as federal, state, local, and institutional level policies. We have also seen that health care providers play a large role in the care patients receive. To better understand how the provision of SRH care varies across the U.S., and how delivery of care has been influenced by changes in reproductive health policy, KFF conducted a nationally representative survey of OBGYNs across the United States. While we acknowledge that many types of clinicians are critical sources of SRH care — from midwives, to advance practice clinicians to primary care physicians— obstetrician-gynecologists (OBGYNs) comprise the largest subset of providers in this field.

This survey asked OBGYNs about a wide range of issues, including their provision of contraception, abortion, and STI care, the role of Medicaid in the delivery of SRH, screening practices for psychosocial needs, and the impact of federal and state policies on health care quality and access.

Key Findings

Contraception:

  • Nearly all OBGYNs offered their patients some forms of contraceptive care, but just 18% of OBGYNs offered their patients all methods of non-permanent contraception that must be either prescribed or provided by a clinician. These methods include the pill, patch, ring, diaphragm or cervical cap, intrauterine devices (IUDs), contraceptive implants (Nexplanon), contraceptive injections (Depo-Provera) and emergency contraception (Copper IUD and Ulipristal Acetate/Ella). Those that offered all methods tended to be younger and work in large practices, with more than 10 clinicians.
  • While the vast majority of OBGYNs provided both types of long-acting reversible contraception (LARCs) — IUDs (96%) and implants (84%) — only four in ten of those who provided these methods offered same-day placement. This means that at the majority of OBGYN practices, patients must make more than one visit to obtain a LARC.
  • Less than half of OBGYNs reported that they provided prescription forms of emergency contraception, which can prevent pregnancy after unprotected sex or in the event that a condom breaks. 45% provided the copper IUD and 42% provided Ella (the prescription “morning after pill”). Nearly four in ten reported that they do not provide either of these forms of emergency contraception.

Abortion:

  • Most OBGYNs (75%) reported their practices did not provide abortions for pregnancy termination, but over one in five (23%) worked in practices that do. Abortion provision was more common among OBGYNs in urban and suburban locations compared to rural, and in the Northeast and West compared to the Midwest and South.
  • The majority of OBGYNs who do not offer abortions refer their patients to other providers for this service, but just over one in ten (13%) neither provide nor refer for abortions. Among those who do not provide abortions, the most commonly cited reasons for not doing so included their practice having a policy against it (49%), saying that services are readily available elsewhere (45%) and personal opposition to the practice (31%). A higher share of OBGYNs in the Midwest and South cited legal regulations as a reason for not providing abortions, compared to those in the Northeast and West.

Other Sexual and Reproductive Health Services:

  • The vast majority of OBGYNs provide onsite testing for gonorrhea and chlamydia (99%), syphilis (90%) and HIV (87%) at their practices. About half of OBGYNs said they always or often prescribe expedited partner therapy (EPT) for sex partners of patients with gonorrhea or chlamydia. Fewer than one in five (18%) prescribe pre-exposure prophylaxis (PrEP) for the prevention of HIV.
  • About a quarter of OBGYNs (28%) work at practices that provide gender affirming care, including hormone therapy or gender affirming surgery. While the vast majority of OBGYNs reported they felt somewhat or very prepared to meet the SRH needs of lesbian, gay, bisexual and queer patients (88%), just over half felt the same for transgender patients (56%).
  • Screening for psychosocial needs varied tremendously, with far more OBGYNs reporting they screen all patients for intimate partner violence (70%) and depression (71%) than transportation (17%) and housing (19%) needs. In the event of a positive screen, few OBGYNs said they had access to resources onsite to address these needs.

Medicaid:

  • Nearly four out of five (78%) OBGYNs reported their practice accepts Medicaid. Many noted challenges associated with providing care for Medicaid patients, including difficulty finding specialists to accept referrals (73%), and being reimbursed at a lower rate than under private insurance (90%).
  • A sizeable minority said they had encountered at least one Medicaid restriction regarding contraceptive care, including needing to obtain prior authorization (45%), being limited to an initial contraceptive supply of 30 days (33%), requiring “step-therapy” (15%) or being denied immediate replacement of expelled or removed LARCs (15%).

Policy Perspectives:

  • Many OBGYNs are aware of the impact of out-of-pocket costs on their patients. About half of OBGYNs (53%) said the issue of affordability comes up always or often when they recommend tests or treatments to patients, and a similar share of OBGYNs (53%) said they were always or often aware of the magnitude of their patients’ out-of-pocket costs. Nearly all (92%) reported that the cost of reproductive health care poses a burden for low-income patients in their practices.
  • Over six in ten OBGYNs reported an increase in the share of their patients who were using any contraceptive method (63%) as well as their desired contraceptive method (69%) since implementation of the ACA’s contraceptive coverage requirement in 2012.
  • Over one in four (28%) reported that recent state-level abortion regulations including gestational age limits and regulations of providers have had a negative impact on their ability to provide quality reproductive health care; the majority (68%), however, reported that new abortion regulations have had no impact on care. Only 3% said that they improved care.
  • When asked about career satisfaction, 70% of OBGYNs reported they would choose the same medical specialty, while a minority said they would choose a different specialty (19%) or not be a physician at all (10%).

Conclusions and Implications

Our findings suggest that patients may experience gaps in the availability of comprehensive SRH care provision depending on where they seek care and the providers they see. The vast majority of OBGYNs provided most forms of hormonal contraception, STI testing, cervical cancer screening, basic infertility diagnostics and prenatal care, but only a minority provided emergency contraception, abortion care, PrEP for HIV prevention, gender affirming care and resources to address psychosocial needs. This may reflect differences in training, personal preferences, and resource availability among OBGYNs.

Regional variation in SRH provision were was observed, particularly regarding the availability of same-day LARC insertions, abortion provision, and preparedness to meet the needs of LGBTQ patients. This could suggest that differences in state-level policies around SRH care, including the decision to expand Medicaid or not, may be influencing practice.

Variations in service provision were also observed by physician age. Younger physicians more often reported providing all methods of contraception, same-day LARCs, PrEP for HIV prevention, prenatal care and gender affirming care compared to the oldest group of OBGYNs.

Across several measures, a more comprehensive array of SRH services was available from OBGYNs who practiced in health centers/clinics rather than private office-based practices. While the reason for this difference is unknown based on this survey, it could perhaps reflect adherence to guidelines set out by the Health Resources & Services Administration’s Bureau of Primary Health Care Health Center Program and the Office of Population Affairs’ (OPA) Quality Family Planning Guidelines. It is notable that the vast majority of OBGYNs reported they accept Medicaid patients in their practice, and OBGYNs who served a large share of Medicaid patients had similar practice patterns compared to those who do not serve many Medicaid patients.

Most OBGYNs reported following reproductive health policy debates closely but had mixed perspectives on how health policy changes influenced their practices. For example, most OBGYNs perceived increases in the share of their patients using contraception since implementation of the ACA contraceptive coverage mandate, but a minority perceived any impact of recent abortion regulations on their ability to provide quality reproductive health care. This could be attributed to the sizable variation across the country in the adoption of abortion restrictions compared to the impact of the ACA’s contraceptive requirement that affected most women with private coverage regardless of their state of residence.

Overall, we observed heterogeneity in which SRH services OBGYNs provide, varying by both physician and practice characteristics. Gaps in SRH provision that have been highlighted from this survey warrant attention at the provider, institutional and policy level, in order to continue to strive for improved patient outcomes and experiences.

Methods Summary

Methods Summary

The 2020 KFF National Physician Survey on Reproductive Health obtained responses from a nationally representative sample of OBGYNs practicing in the United States who provide SRH care to patients in office-based settings. The survey was designed and analyzed by researchers at KFF, and an independent research company, SSRS, carried out the fieldwork and collaborated on questionnaire design, pretesting, sample design, and weighting. Survey responses were collected via paper and online questionnaires from March 18 to September 1, 2020 from 1,210 OBGYNs.

The initial sample release in March 2020 corresponded with the emergence of the COVID-19 pandemic. As such, after the initial sample release, a supplement of questions were added regarding the impact of the COVID-19 pandemic on providers and their practices. Among the 1,210 OBGYNs who completed the main survey, 855 OBGYNs completed the supplemental questions related to COVID-19. The full results from the COVID-19 supplemental questionnaire can be found on the KFF website here.

In this report, we present findings on issues within SRH care provision by OBGYNs, including the range of services provided (contraception, abortion, STI care), as well as the impact of payors, particularly Medicaid, on the services they offer, and how changes in reproductive health policy have impacted their practices.

The samples were weighted to match known demographics. Taking into account the design effect, the margin of sampling error for the total sample is +/- 4 percentage points at the 95% confidence level. All comparisons noted in this brief are statistically significant (p <0.05). Please see the attached topline for the full methodology report.

Sample Overview

We surveyed a nationally representative sample of 1,210 U.S. OBGYNs currently in clinical practice. Eligible physicians were board-certified OBGYNs, spent at least 60% of their time providing direct patient care, and provided sexual and reproductive health care to at least 10% of their patients in an office-based setting. We compared survey responses by key physician and practice characteristics. Gender, age and race were determined by physician self-report. For practice type, those who indicated they work in a private practice or a health maintenance organization (HMO) were classified as “private office-based,” while those who indicated they work in a community health center (e.g., FQHC, rural health center), a reproductive health care or family planning clinic (e.g., Planned Parenthood) or a government operated clinic (e.g., VA, state/county health department) were classified as “health center/clinic.” Practice size was determined by the number of full-time equivalent (FTE) physicians or advance practice clinicians (small ≤ 3, medium 4-10, large >10). Urbanicity and region were determined by the ZIP code of the practice, using U.S. Census definitions. Practicing in a Medicaid Expansion state was determined by zip code and the KFF list of states that had implemented Medicaid expansion by March 2020. OBGYNs were asked to estimate the share of patients with different insurance coverage types, including Medicaid, Medicare, private insurance, and uninsured patients.

Characteristics of Survey Respondents

Table 1 shows the demographics of the survey respondents. The majority of OBGYNs surveyed worked in private office-based practices (77% in solo, group or hospital owned private practice, 6% in HMOs and 3% in other private practices). A minority practiced in what was defined as a health center/clinic (7% in a community clinic or health center, 1% in a reproductive health care clinic, 1% in a government operated clinic, and 3% in another type of publicly-funded clinic). Half of OBGYNs worked in medium size practices with 4-10 clinicians, and the majority practiced in urban locations. OBGYNs were split fairly evenly by region, and the majority practiced in a state with Medicaid Expansion.

Table 1: Demographics of Survey Respondents
Overall OBGYNsN= 1,210
CharacteristicUnweighted Distribution (%)Weighted Distribution (%)
GenderFemale51%64%
Male49%36%
Age<4522%36%
45-5428%25%
55-6433%22%
65+15%16%
Race and EthnicityWhite71%70%
Black8%10%
Asian12%12%
Other10%9%
Practice typeHealth Center/Clinic14%12%
Private Office-Based85%86%
Practice sizeLarge (>10 FTE)19%20%
Medium (4-10 FTE)46%50%
Small (≤ 3 FTE)33%28%
UrbanicityUrban55%59%
Suburban21%23%
Rural21%13%
RegionNortheast17%21%
West24%23%
Midwest23%20%
South37%35%
Medicaid Expansion StateYes66%68%
No34%32%
Share of Medicaid Patients≥ 25%47%45%
<25%51%53%
A small percentage of respondents left demographic questions blank or their responses were unspecified, including unweighted n= 3 (0.2%) for gender, 18 (1%) for age, 14 (1%) for practice type, 26 (2%) for practice size, 35 (3%) for urbanicity, and 16 (1%) for share of Medicaid patients.NOTES: Gender, age, race and share of Medicaid patients defined by self-report. Practice type was also based on self-report: private office-based = private practice/HMO, health center/clinic = community health center/reproductive health care clinic/government operated clinic. Practice size defined by number of full-time equivalent physicians and advance practice clinicians that physicians reported in their practice (small ≤3 FTE, medium 4-10, large >10). Urbanicity, region and Medicaid Expansion state derived from zip-code.SOURCE: KFF 2020 Physician Survey on Reproductive Health. Fielding from March 18 to September 1, 2020. N = 1210

Report: Clinical Care

An updated version of this report was released on June 21,  2023 and can be found here.

Contraception

Provision of Contraception

The vast majority of OBGYNs prescribe/provide oral contraceptive pills (OCPs) (98%), intrauterine devices (IUDs) (96%), vaginal rings (96%), contraceptive injections (Depo-provera) (95%), and the patch (91%). Slightly fewer provide contraceptive implants (Nexplanon) (84%); of note, providers must complete a 2-hour live training from the manufacturer in order to provide Nexplanon, which may serve as a hurdle to some in delivering this method of contraception. Notably fewer OBGYNs provide diaphragms or cervical caps (65%) than other methods of non-emergency contraceptives (Figure 1).

Figure 1: Few OBGYNs Provide All Methods of Prescription Contraception, Including Emergency Contraception

The majority of OBGYNs (78%) provided all hormonal methods of contraception, including the contraceptive pill, patch, ring, injection, IUD and implant (Figure 1). Fewer (54%) provided all hormonal methods, plus diaphragms or cervical caps as a barrier method. About half (51%) provided all hormonal methods, plus at least one form of prescription emergency contraception, either the copper IUD or ulipristal acetate/Ella. Just 18% of OBGYNs reported prescribing all nine of the contraceptive methods asked about, including all hormonal methods (pill, patch, ring, injection, IUD and implant), a barrier method (diaphragm or cervical cap) and both methods of prescription emergency contraception (copper IUD and ulipristal acetate/Ella).

A higher share of OBGYNs who are female compared to male, younger compared to older, and work in large practices compared to small reported providing all methods of contraception (Table 2).

Table 2: Characteristics of OBGYNs who Provide All Methods of Contraception
CharacteristicShare of OBGYNs who Provide all Methods of Contraception
Overall18%
GenderFemale21*
Male12
Age<4528*
45-5419*
55-6413*
65+5
Practice SizeLarge24*
Medium19
Small 13
*Indicates a statistically significant difference (p<0.05) from reference group in boldNOTES: “All methods contraception” defined as providing/prescribing hormonal contraceptive pills, patch, ring, diaphragm or cervical caps, IUDs, implants, injectables and emergency contraception (Copper IUD and Ulipristal Acetate/Ella). Gender and age defined by physician self-report. Practice size defined by number of full-time equivalent physicians and advance practice clinicians (small ≤3 FTE, medium 4-10, large >10).SOURCE: KFF 2020 Physician Survey on Reproductive Health. Fielding from March 18 to September 1, 2020. N = 1210

Provision of other SRH services seemed to cluster among OBGYNs who provided all contraceptive methods. For example, OBGYNs who provided all methods of contraception were more likely to provide abortions, gender affirming care, pre-exposure prophylaxis (PrEP) for HIV and expedited partner therapy (EPT) for gonorrhea and chlamydia compared to OBGYNs who do not provide all methods of contraception (Figure 2).

Figure 2: OBGYNs Who Provide All Contraceptive Methods Also More Likely To Provide Other Reproductive Health Services

Provision of Emergency Contraception

Among the three commonly used methods of emergency contraception (EC), the copper IUD and ulipristal acetate (Ella) must be prescribed, and levonorgestrel (Plan B) can be purchased over the counter. For the two methods that must be prescribed/provided by a clinician, fewer than half of OBGYNs provided copper IUDs (45%) and Ella (42%) as forms of emergency contraception (Figure 1); 38% provided neither, 26% provided both methods, 17% provided the copper IUD only and 15% provided Ella only (Figure 3).

Figure 3: Over One Third of OBGYNs Do Not Offer Their Patients Ella or Copper IUDs as Emergency Contraception

A higher share of female OBGYNs provided copper IUDs and Ella compared to male OBGYNs, as did younger OBGYNs (age <55) compared to older OBGYNs (age 65+). Geographically, a higher percentage of OBGYNS in the Northeast and West offered copper IUDs and Ella for emergency contraception compared to the South, as did OBGYNs in states that have expanded Medicaid compared to those that have not. A larger share of abortion providers offered the copper IUD as EC and Ella compared to non-abortion providers (Table 3).

Table 3: Emergency Contraception (EC) Provision
CharacteristicProvides following forms of EC:
Copper IUDUlipristal Acetate (Ella)
Overall45%42%
GenderFemale51*46*
Male 3336
Age<4565*51*
45-5445*43*
55-642937
65+2230
RegionNortheast47*47*
West58*55*
Midwest47*40
South3432
Practice in Medicaid Expansion StateYes52*47*
No3032
Provide AbortionsYes59*61*
No4237
*Indicates statistically significant difference (p<0.05) from reference group in boldNOTES: Gender, age and provides abortions defined by self-report. Region and Medicaid Expansion derived from zip code.SOURCE: KFF 2020 Physician Survey on Reproductive Health. Fielding from March 18 to September 1, 2020. N = 1210

Considerations for LARCs and injectables

The majority of OBGYNs (84%) reported they provide both types of LARCs (IUDs and implants) and 11% provided just one type. However, among those who provide IUDs and implants respectively, only about two in five provided same-day placement for IUDs (40%) and implants (39%). This means that at the majority of OBGYN practices, patients must make more than one trip to the clinic to obtain a LARC.

Provision of same-day LARCs was more common among OBGYNs who are younger, work in health centers/clinics, in large practices, and outside the South (Table 4). Additionally, a larger share of OBGYNs who provided all methods of contraception offered same-day IUD (64% vs. 33%) and implant (62% vs. 32%) insertions compared to those who did not offer all contraceptive methods. A higher percentage of abortion providers provided same-day IUD (56% vs. 36%) and implant (54% vs. 35%) insertions compared to non-abortion providers, which may be important for some patients as part of post-abortion care.

Table 4: Provision of same-day LARCs, by demographics
CharacteristicProvides same-day placement of:
IUDsImplants
Overall40%39%
Age<4544*45*
45-5446*41
55-643635
65+2728
Practice typeHealth center/clinic62*61*
Private office-based3736
Practice sizeLarge61*60*
Medium39*36
Small2829
RegionNortheast43*41
West49*49*
Midwest43*45*
South3029
*Indicates statistically significant difference (p<0.05) from reference group in boldNOTES: Age defined by self-report. Private office-based = private practice or HMO, Health center/clinic = community health center/reproductive health care clinic/government operated clinic. Practice size: 1-3 FTE clinicians small, 4-10 medium, >10 large. Region derived from zip code.SOURCE: KFF 2020 Physician Survey on Reproductive Health. Fielding from March 18 to September 1, 2020. N = 1210

Insurance restrictions and requirements around prior authorization for contraception likely play a role in whether or not providers offer same-day LARCs. We asked OBGYNs whether the Medicaid plan they bill most often required them to obtain prior authorization for specific contraceptives; a higher share of those who had not been required to obtain prior authorization for contraceptives provided same day placement of IUDs (52% vs. 31%) and implants (52% vs. 32%) compared to OBGYNs that reported prior authorization had been required.

Beyond insurance hurdles, practices may not offer same-day LARC insertion if they do not have the contraceptive methods stocked onsite. Among those that provide IUDs, four in five (79%) stock IUDs onsite; nearly three in four implant providers (73%) stock implants onsite; and about half (51%) of OBGYNs who provide injectables stock them on site. Stocking these contraceptive methods onsite was more common among OBGYNs in health centers/clinics than private office-based practices, in large and medium size practices rather than small, and among OBGYNs who provide all methods of contraception compared to those who do not (Table 5).

Additionally, a larger share of OBGYNs who reported prior authorization was not required for specific contraceptives stocked IUDs (90% vs. 75%) and implants (87% vs. 65%) compared to OBGYNs who reported prior authorization was required for specific contraceptives. This suggests that requirements around prior authorization could play a role limiting the availability of same-day LARC insertion.

Table 5: Stocking Contraceptive Methods Onsite Varies by Practice Characteristics
CharacteristicAmong OBGYNs who provide these methods of contraception, share who stock:
IUDsImplantsInjectables
Overall79%73%51%
Practice typeHealth center/clinic92*93*84*
Private office-based776946
Practice sizeLarge94*89*72*
Medium83*73*50*
Small 625838
Provides All Methods of ContraceptionYes94*91*74*
No746745
*Statistically significant difference from reference group in boldNOTES: Practice type: Private office-based = private practice or HMO, Health center/clinic = community health center/reproductive health care clinic/government operated clinic. Practice size: 1-3 FTE clinicians small, 4-10 medium, >10 large. Medicaid Expansion derived from zip code. All contraception = pill, patch, ring, IUD, implant, injection, diaphragm, Copper IUD and Ella for ECSOURCE: KFF 2020 Physician Survey on Reproductive Health. Fielding from March 18 to September 1, 2020. N = 1210.

Fertility Awareness-Based Methods

Under the Trump Administration, there was increased federal support for and attention to fertility awareness-based methods (FABM) of contraception – that is tracking ovulation. This includes instruction on monitoring basal body temperature, cervical mucus, hormone production, cervical position, and calendar tracking. For patients seeking contraceptive services, most OBGYNs reported that a minority of patients request information on FABM. More than three fourths (78%) of OBGYNs said less than a quarter of patients requested this information (Figure 4).

Figure 4: Most OBGYNs Say a Minority of Patients Inquire About Fertility Awareness-Based Methods of Contraception

Abortion

Abortion provision by U.S. OBGYNs

One in five OBGYNs said their practice provides medication abortions (20%) and aspiration abortions (19%), but the majority of OBGYNs did not provide abortions for pregnancy termination in their practices. Nearly two-thirds referred patients to outside providers for these services, and a minority neither provided nor referred for these services (Figure 5). These data are fairly consistent with prior estimates of abortion provision in the U.S. (Stulberg et al. 2012, Grossman et al. 2019).

Figure 5: Most OBGYNs Work at Practices That Refer for Abortion Services

While 75% of OBGYNs surveyed did not provide abortions within their practices, 23% provided at least one type of abortion; 16% offered both medication and aspiration abortions in their practices, 4% provided medication abortions only and 3% provided aspiration abortions only (Figure 6). Among abortion providers, seven in ten (71%) provided both medication and aspiration abortions, suggesting that most OBGYNs who choose to provide abortions offer more than one method of pregnancy termination. Having this option is important to many people seeking abortion care, who may prefer one method over another.

Figure 6: Most OBGYNs Do Not Provide Abortions. Those Who Do Typically Provide Both Medication and Aspiration Methods

Characteristics of OBGYNs who provide abortions

The provision of abortion services varied by region and urbanicity. A larger percentage of OBGYNs in urban and suburban locations than those in rural locations provided medication and aspiration abortions, while a larger share of OBGYNs in the Northeast and West reported providing both types of abortions compared to OBGYNs in the Midwest and South (Figure 7). Similar trends by urbanicity and region were found by Stulberg et al. in their 2008 survey of U.S. OBGYNs.

Figure 7: OBGYNs in Rural Areas and in the Midwest and South Less Likely to Provide Abortion Services

Additionally, a higher share of the youngest group of OBGYNs, age <45, provided medication abortions within their practices compared to older physicians, age 65+. More OBGYNs at large practices offered aspiration abortions than those at medium and small practices. No differences were seen by practice size for medication abortions (Table 6).

Table 6: Abortion Provision Varies by Physician and Practice Characteristics
 Share of OBGYNs who provide:
Medication abortionsAspiration abortions
Overall20%19%
Age<4525*22
45-542220
55-641415
65+1314
Practice typeHealth Centers/Clinics2322
Private Office-Based1918
Practice SizeLarge2327*
Medium2118
Small1515
UrbanicityUrban19*20*
Suburban27*21*
Rural76
RegionNortheast33*32*
West27*24*
Midwest78
South1413
*Statistically significant difference (p<0.05) from reference group in boldNOTES: Age defined by self-report. Practice type: private = private practice/HMO, public = community health center/reproductive health care clinic/government operated clinic. Practice size defined by number of full-time equivalent physicians and advance practice clinicians (small ≤3 FTE, medium 4-10, large >10). Urbanicity and region derived from zip-code.SOURCE: KFF 2020 Physician Survey on Reproductive Health. Fielding from March 18 to September 1, 2020. N = 1210

Among abortion providers, similar demographic patterns held true. The majority of abortion providers worked in medium or large size practices compared to small. Six in ten abortion providers worked in urban areas, three in ten in suburban areas and just 4% in rural practices. Approximately one-third of OBGYNs who work in practices providing abortions were in the Northeast (36%), another third in the West (31%), with much fewer in the more conservative Midwest (9%) and Southern (23%) regions (Figure 8). These findings are consistent with prior research by Stulberg et al. that found abortion provision is clustered in urban areas and scarce in the Midwest and South.

Figure 8: Most OBGYN Abortion Providers Work in Medium/Large Practices, Urban Locations and in the Northeast or West

When looking at practice type, the share of OBGYNs who provided medication and aspiration abortions did not differ between health centers/clinics and private office-based practices (Table 6). However, a smaller share of those in health centers/clinics referred for both medication (51% vs. 66%) and aspiration abortions (51% vs. 66%) compared to those in private office-based practice; for health centers/clinics participating in the Title X Family Planning program, fewer referrals may be due to changes to the program regulations which did not permit Title X recipients to refer patients for abortions at the time the survey was fielded.

Compared to OBGYNs who do not provide abortions, a larger percentage of those who offered abortions provided a choice of all methods of contraception including emergency contraception, and provided same-day IUD and implant placement; this is notable given post-abortion contraception is an important component of abortion care for some women. A higher share of abortion providers also provided a wide range of STI services compared to non-abortion providers, including prescription of PrEP for HIV prevention and prescription of expedited partner therapy (EPT). It was also more common for abortion providers to provide gender affirming care compared to OBGYNs who did not provide abortions at their practice (Figure 9).

Figure 9: A Higher Share of OBGYNs Who Offer Abortion Services Also Provide Other Reproductive Health Services

characteristics of OBGYNs who DO NOT provide Abortions

Among OBGYNs who do not provide abortions in their practices, most cited more than one reason for not providing abortions. About half (49%) say their practice has a policy against abortions, 45% say services are readily available elsewhere, 31% personally oppose the practice, 17% say there are too many legal regulations and 15% cite safety concerns for staff as their reasons for not providing abortions (Figure 10).

Figure 10: Among OBGYNs Who Do Not Provide Abortions, Most Cite Multiple Reasons for Not Doing So

Only 10% reported they did not have adequate training to be providing this service, however this number was higher among the youngest group of physicians, age <45, compared to all older groups (age <45: 20%, 45-54: 7%, 55-64: 3%, 65+: 3%). This may reflect changes to abortion training over time. In 1996, the accrediting organization for OBGYN, the ACGME, instituted a training requirement for OBGYN residency programs to provide training in abortion provision, with opt out options for those with religious or moral objections. In a 2002 study of U.S. OBGYNs, it was found that younger OBGYNs were more likely than older OBGYNs to provide abortion, which was attributed to this change in medical training. However, a study by the National Academies of Sciences, Engineering and Medicine pointed out that not all residency programs follow the ACGME requirement, and that abortion training may have become more limited in recent years due to institutional policies, state laws, and mergers with religiously-affiliated hospitals.

Among those who do not provide abortions, more male OBGYNs personally oppose the practice than female (39 vs. 27%). Additionally, among those who do not provide abortions, 61% of OBGYNs in health centers/clinics say their practice has a policy against performing abortions compared to 47% in private office-based practice; this could reflect federal and state level restrictions on the use of public funds for the provision of or referral for abortion found in the federal Title X program, the Hyde amendment and state laws.

By region, a higher share of OBGYNs in the South reported that the high number of legal regulations associated with abortion (25%) was a reason they didn’t offer abortion compared to OBGYNs in the Northeast (8%) and West (10%). A higher share of OBGYNs in the Midwest (13%) and South (12%) also reported not having enough adequate training to provide abortion compared to OBGYNs in the Northeast (2%) (Figure 11).

Figure 11: Regional Differences in Abortion Regulations and Training May Play a Role in the Decision to Not Provide Abortions

Most OBGYNs who did not provide abortions, however, referred patients for these services (Figure 5). A small share of OBGYNs (13%) neither provided abortions nor referrals for patients to obtain abortions at another practice or clinic. This was more common among OBGYNs who are male compared to female, and work in practices in the South and Midwest compared to the West and Northeast (Figure 12). No differences were identified by age, practice type, practice size or urbanicity.

Figure 12: Higher Share of Male OBGYNs and Those in the Midwest or South Do Not Provide or Refer Their Patients for Abortions

Other Sexual and Reproductive Health Services

Care for Sexually Transmitted infections

The United States Preventive Services Task Force (USPSTF) recommends testing for gonorrhea, chlamydia, HIV and syphilis at differing points in people’s lives. The vast majority of OBGYNs provide onsite testing at their practice for gonorrhea and chlamydia (99%), syphilis (90%) and HIV (87%) (Table 7). About a third have onsite have lab processing as well for these STIs (38%/34%/34% respectively), rather than sending samples to outside labs.

Table 7: Share of OBGYNs Who Provide Onsite STI Testing
Is onsite testing available at your practice for the following STIs?
 YesNo
Gonorrhea and Chlamydia99%<1%
Syphilis90%9%
HIV87%12%
SOURCE: KFF 2020 Physician Survey on Reproductive Health. Fielding from March 18 to September 1, 2020. N = 1210

While testing for gonorrhea and chlamydia was near universal, a small share of OBGYNs did not provide onsite testing for syphilis (9%) or HIV (12%) (typically collected via blood draws), meaning a patient would need to visit a separate facility for testing. This is important to note given the rising rates of congenital syphilis, primary and secondary syphilis among women, and HIV among certain groups of women in recent years. A higher share of OBGYNs in private office-based practices compared to health centers/clinics, and in small practices compared to medium and large did not test offer onsite testing for syphilis and HIV (Figure 13).

Figure 13: OBGYNs in Private Practices and Small Practices Less Likely to Offer Onsite Testing for Syphilis and HIV
Pre-Exposure Prophylaxis (PrEP) Provision

According to the CDC, there remains a substantial gap, particularly among women, between the number of people with indications to be on the HIV prevention medication known as PrEP, and those who have been prescribed this medication. This may be in part due to a limited number of providers who prescribe PrEP. In our sample of OBGYNs, fewer than one in five (18%) prescribe PrEP for the prevention of HIV. This varied some by physician and practice characteristics; PrEP prescription was more common among younger OBGYNs ages compared to older, and among those in large practices compared to medium and small (Figure 14).

Figure 14: Younger OBGYNs and Those in Large Practices More Likely to Prescribe PrEP for HIV Prevention
Expedited Partner Therapy

OBGYNs varied in how often they prescribed expedited partner therapy (EPT) for sex partners of patients being treated for gonorrhea or chlamydia. EPT describes the practice of prescribing STI treatment for a patient’s sex partner(s) without an in-person medical evaluation of their partner(s). About half of OBGYNs said they always (33%) or often (21%) prescribe EPT for gonorrhea and chlamydia, while some said they do so sometimes (15%). Nearly third said that they rarely (15%) or never (15%) prescribe EPT (Figure 15).

Figure 15: Frequency of Prescribing Expedited Partner Therapy for Gonorrhea and Chlamydia Varies among OBGYNs

Additional SRH Services

Beyond contraception, STIs and abortion care, OBGYNs reported providing a range of other sexual and reproductive health services within their practices, while a small percentage refer their patients to other providers for these services (Table 8). Almost all OBGYNs reported they provide pap smears and human papillomavirus (HPV) testing (98%), colposcopies for abnormal pap smears (96%), basic infertility diagnostic services (90%) and prenatal care for low risk pregnancies (88%) within their practices, however some notable differences in service provision emerged. For example, fewer OBGYNs in health centers/clinics provided basic infertility diagnostics (e.g., lab testing, pelvic ultrasound, semen analysis) as compared to those in private office-based practices (78% vs. 92%). Additionally, provision of prenatal care was less common among older doctors (age 65+) compared to younger doctors, and those in small practices compared to medium or large (Table 9).

Table 8: Health Care Services Provided by OBGYNs
ServiceProvided within their practiceReferred to another provider
Pap Smears and HPV Testing 98%1%
Colposcopies96%3%
Basic Infertility Diagnostic Services90%8%
Prenatal Care for Low Risk Pregnancies88%11%
Gender Affirming Care28%55%
NOTES: Responses do not total 100%, as they leave out those who answered that they neither provide nor refer for these services, and those who left the question unspecifiedSOURCE: KFF 2020 Physician Survey on Reproductive Health. Fielding from March 18 to September 1, 2020. N = 1210
Table 9: Provision of Low-Risk Prenatal Care by OBGYNs
 Provides prenatal care for low-risk pregnancies
Overall 88%
Age<4592*
45-5489*
55-6489*
65+ 75
Practice SizeLarge95*
Medium93*
Small 74
*Statistically significant difference (p<0.05) from reference group in boldNOTES: Age defined by self-report. Practice size defined by number of full-time equivalent physicians and advance practice clinicians (small ≤3 FTE, medium 4-10, large >10).SOURCE: KFF 2020 Physician Survey on Reproductive Health. Fielding from March 18 to September 1, 2020. N = 1210

Notably the provision of gender affirming care was less commonly reported than other SRH services. About one in four (28%) OBGYNs reported that gender affirming services were provided at their practice (e.g. hormone therapy or gender affirming surgery) (Table 8). Another 55% refer patients for this care, while approximately one in ten OBGYNS (9%) neither provide nor refer for these services.

A higher share of OBGYNs in younger age groups compared to older worked at a practice offering gender affirming care, as did those who worked at large and medium practices compared to small. Regionally, provision of gender affirming care was more common among OBGYN practices in the West than in the Northeast, Midwest, and South (Figure 16).

Figure 16: Provision of Gender Affirming Care Varies by Physician Age, Practice Size and Region
Preparedness to Address SRH Needs of LGBTQ Patients

Providers varied in how prepared they felt to meet the sexual and reproductive health care needs of sexual and gender minority patients. Nearly nine in ten (88%) OBGYNs said they were very or somewhat prepared to meet the SRH needs of lesbian, gay, bisexual and queer patients, while the same was true for only 56% of OBGYNs when it came to transgender patients (Figure 17).

Figure 17: Preparedness to Address the SRH needs of LGBTQ patients Varies Among OBGYNs

Perceived preparedness was higher among certain groups of OBGYNs. OBGYNs more often reported feeling very or somewhat prepared to meet the SRH needs of LGBTQ patients if they were female compared to male, and if they offered gender affirming care at their practices compared to not. Regionally, more OBGYNs in the West felt prepared to meet the SRH needs of transgender patients compared to those in the Midwest or South (Table 10).

Table 10: Perceived preparedness to meet SRH needs of LGBTQ patients, by physician characteristics
CharacteristicsShare of OBGYNs reported feeling very or somewhat prepared to meet the sexual and reproductive health needs of:
Gay, lesbian, bisexual and queer patientsTransgender patients
Overall88%56%
GenderFemale90*61*
Male8448
RegionNortheast8756
West8966*
Midwest8754
South8951
Practice provides gender affirming careYes93*81*
No8747
*Indicates statistically significant difference from reference group in bold (p<0.05)NOTES: Gender and provision of gender affirming care defined by self-report. Region derived from zip code, using U.S. census breaks.SOURCE: KFF 2020 Physician Survey on Reproductive Health. Fielding from March 18 to September 1, 2020. N = 1210
Psychosocial Needs

In recent years, emphasis has been placed on incorporating screening for the social determinants of health and mental health needs into routine clinical care. We asked OBGYNs about their screening and intervention practices for four psychosocial needs—intimate partner violence (IPV), depression, housing and transportation. Nearly all OBGYNs screened patients for IPV and depression. A very small share of OBGYNs reported they do not screen any of their patients for IPV (4%) or depression (2%). This is perhaps not surprising given there are formal recommendations from USPSTF and ACOG to screen for both IPV and depression.

For social needs without formal screening recommendations however, screening was more variable. Almost half of OBGYNs said that they do not screen any of their patients for unmet housing needs (47%) or transportation barriers (45%) (Figure 18).

Figure 18: More OBGYNs Screen Patients for IPV and Depression Than Housing and Transportation Needs

In the event a patient discloses or screens positive for one of these needs, most OBGYNs referred patients to outside resources for IPV (75%), depression (66%), housing (55%) and transportation (53%). Few had resources or a social worker onsite to address these needs (Figure 19). More than one in four OBGYNs (27%) said they neither have internal resources nor refer to external resources if a patient screens positive for unmet housing or transportation needs.

Figure 19: Most OBGYNs Refer to Outside Resources to Address Psychosocial Needs in the Event of a Positive Screen

Report: Medicaid

Medicaid is a significant source of coverage for many people of reproductive age, covering 17% of non-elderly adult women in 2019 and financing in the U.S. and the majority of publicly-funded family planning services. Given the prominence of Medicaid as a payor for reproductive age women and services, it’s not surprising that many practices accept Medicaid. Nearly four out of five (78%) OBGYNs reported their practice accepts Medicaid, and 72% said that their practice is accepting new Medicaid patients. More OBGYNs in health centers/clinics accepted Medicaid patients compared to those in private office-based practices (90% vs. 77%). Additionally, a higher share of OBGYNs who practiced in rural areas compared to suburban or urban, and in the Midwest than the Northeast, South, and West accepted Medicaid (Figure 20). On average, OBGYNs who accept Medicaid estimated about half of their Medicaid patients (54%) were enrolled in managed care arrangements.

Figure 20: Acceptance of Medicaid Varies by Practice Type, Urbanicity, and Region

OBGYNs who practiced in health centers/clinics reported that, on average, 46% of their practices’ patients were on Medicaid, nearly double the rate of those who practice in private office-based settings (24%). On average, OBGYNs in health centers/clinics also saw a larger share of uninsured patients than private office-based practices (17% vs. 5%), as well as patients on other forms of public insurance like TRICARE and CHAMPUS (18% vs. 5%). OBGYNs in rural practices also reported, on average, higher shares of patients on Medicaid than those in urban and suburban practices (Figure 21).

Figure 21: OBGYNs in Health Centers/Clinics and Rural Practices Report on Average Higher Shares of Medicaid Patients

Some 40% of OBGYNs practicing in health centers/clinics reported that Medicaid patients accounted for over half of the patients seen in their practice, compared to 14% of those in private office-based practices (Figure 22).

Figure 22: OBGYNs in Health Centers/Clinics Say Medicaid Patients Comprise a Larger Share of Their Patients Than Those in Private Practice

Medicaid Coverage Limitations

While most OBGYNs see patients with Medicaid, many reported payor challenges that came along with providing care for these patients. The vast majority of OBGYNs whose practice accepts Medicaid also reported that Medicaid pays much less (49%) or somewhat less (41%) than most private insurance plans (Figure 23). It was more common for OBGYNs in private office-based practice to say Medicaid pays less compared to those in health centers/clinics (91% vs. 82%), but providers in both settings reported lower payment rates compared to private plans.

Additionally, among OBGYNs who said their practice accepts Medicaid, nearly three in four said it was much harder (28%) or somewhat harder (45%) to find specialists who accept referrals for Medicaid compared with most private insurance plans (Figure 23). This challenge was reported by more than eight in ten OBGYNs in the South (83%), compared to lower shares in the Northeast (60%), West (72%), and Midwest (68%). OBGYNs in states that have not expanded Medicaid were also more commonly found to report this challenge compared to those in Medicaid Expansion states (84% vs. 68%), as were those in urban areas compared to rural areas (77% vs. 63%).

Figure 23: OBGYNs Say Medicaid Pays Less Than Private Insurance and It Is Harder to Find Specialists for Referrals

Most OBGYNs said they also faced Medicaid limitations specific to providing contraceptive care. Many had been required to obtain prior authorization for specific contraceptives (45%). About a third had been limited to prescribing a 30-day initial supply for some contraceptive methods (33%). Fewer had experienced their patients having to use certain contraceptive methods before stepping up to more costly ones, known as “step therapy” (18%), or replacement barriers for LARCs that had been removed or expelled (15%) (Figure 24). A sizable share of OBGYNs were not sure if these limitations had affected their practices or not.

Figure 24: Most OBGYNs Have Faced Contraceptive Coverage Limitations From Medicaid Plans

The majority of OBGYNs who accept Medicaid (60%) said they had encountered at least one of the Medicaid limitations asked about with respect to Medicaid coverage of contraceptives; 28% reported one of the four limitations, 16% reported two limitations, 12% reported three limitations but very few reported all four limitations (4%).

Report: Policy Considerations

Cost of Care

OBGYNs reported that affordability comes up commonly when talking to patients. Nine in ten OBGYNs said the issue of affordability always (11%), often (42%) or sometimes (38%) comes up when they recommend tests or treatment to their patients. Few said affordability came up rarely (7%) or never (1%).

Despite the topic of affordability arising frequently in patient-provider interactions, OBGYNs were not always aware of the out-of-pocket (OOP) costs patients were facing. When making diagnostic and treatment recommendations for patients, 14% said they were always aware of the magnitude of patients’ out of pocket costs. The rest said they were often (39%), sometimes (31%), rarely (13%) or never (2%) aware of these costs (Figure 25).

Figure 25: OBGYNs Vary in How Often They Consider and Discuss Affordability of Care

The issue of affordability and awareness of OOP costs varied by certain practice characteristics. OBGYNs in small practices compared to medium or large were more commonly found to report the issue of affordability always arising when recommending care to patients (small 18%, medium 9%, large 7%), and to report always be aware of the magnitude of OOP costs (small 23%, medium 11%, large 10%). There was no difference in how often the issue of affordability arises or awareness of OOP costs by practice type or share of Medicaid patients (25%+ vs. <25%).

Nearly all OBGYNs acknowledged the cost burden that can be associated with seeking reproductive health care. Almost all OBGYNs said the cost of reproductive health services poses a major (55%) or minor (37%) financial burden for low-income patients in their practices, while only 7% believed it poses no financial burden (Figure 26). A higher share of OBGYNs in states without Medicaid expansion reported these services pose a major financial burden for low-income patients compared to OBGYNs in states with Medicaid expansion (63% vs. 52%).

Figure 26: Most OBGYNs Say the Cost of Reproductive Health Services Poses a Financial Burden to Their Low-Income Patients

Impact of the ACA on Contraceptive Use

The passage of the Affordable Care Act (ACA) had several implications for women’s health care, and SRH care more broadly. Beginning in 2012, the law required nearly all private insurance plans to cover prescription contraceptive services and supplies without cost sharing to women. Since this regulation was implemented, over six in ten OBGYNs (63%) reported a significantly or somewhat increased share of their patients using any contraceptive method, while fewer reported no impact (34%) or a decreased share of patients using contraception (2%). In a similar vein, nearly seven in ten (69%) OBGYNs said the share of their patients who are able to select their desired contraceptive has increased significantly or somewhat since 2012 (Figure 27). Overall, these findings are consistent with other research documenting increases in contraceptive use, like IUD and implant use, since the contraceptive coverage requirement was implemented.

Figure 27: The Majority of OBGYNs Report Increasing Shares of Patients Using Contraception After ACA Implementation

A higher share of OBGYNS in private office-based practices reported increased contraceptive use as compared to those working in health centers/clinics (any contraceptive use 66% vs. 47%, desired contraceptive 72% vs. 51% respectively). This could reflect the fact that those in private practice saw on average more patients with private insurance than those in health centers/clinics (60% vs. 28%); those in health centers/clinic on average saw a higher share of Medicaid patients who are already covered for contraceptive services, but many of their formerly uninsured patients could now be covered as result of the ACA’s Medicaid expansion and have better access to contraceptive services and supplies.

Impact of Reproductive Health Policy Debates on Practice

Over the last year, several reproductive health policy debates have made their way into the news and judicial system. This includes changes to the Title X Family Planning program, debates over federal- and state-level abortion regulations and rulings on contraceptive coverage for religious employers. [For context, 27% of OBGYNs surveyed identified as Republicans, 40% as Democrats, 25% as Independents, and 6% as something else.]

Two thirds OBGYNs reported following developments or news regarding federal and state policy debates on reproductive health very closely (22%) or fairly closely (46%). The other third of OBGYNs reported they have followed these debates not too closely (27%) or not at all (4%) (Figure 28). It was more common for OBGYNs who provide abortions compared to non-abortion providers to report following reproductive health policy news very closely (36% vs. 18%), as it was for providers at practices that offer gender affirming services compared to those who do not (29% vs. 19%). This is perhaps not surprising given that access to abortion and care for transgender individuals have been the targets of a number of policy changes over the past year.

Figure 28: Majority of OBGYNs Follow Health Policy Debates. Most Perceive No Impact of Abortion Regulations on Ability to Provide Care

Several states across the country have passed an increasing number of laws regulating abortion in recent years, including gestational age limits and regulations on abortion providers and facilities. Most OBGYNs (68%) reported these new regulations did not impact their ability to provide quality reproductive health care to their patients, although about a quarter reported a negative impact (28%). Very few (3%) believed these regulations had a positive impact on their ability to provide quality reproductive health care (Figure 28). A higher share of the youngest group of OBGYNs perceived a negative impact of these regulations on provision of care compared to all other age groups (age <45: 40%, age 45-54: 23%, age 55-64: 19%, age 65+: 21%), as did OBGYNs in the Midwest (35%) and South (35%) compared to the Northeast (17%) and West (21%). Of note, abortion providers were just as likely to report a negative impact of these regulations as non-abortion providers (32% vs. 27%).

Career Satisfaction

It is well documented that many physicians suffer from burnout and career dissatisfaction. When asked if they could do things again based on their experience as a physician, 70% of OBGYNs reported they would choose the same specialty. A minority said they would choose a different specialty (19%), and few said they would not be a physician at all (10%) (Figure 29). There were no differences seen by physician age, race, practice type, urbanicity or practice size, however a higher share of men said they would choose a different specialty if they could do things again compared to women (24% vs. 16%). A higher share of abortion providers said they would choose the same specialty again compared to non-abortion providers (79% vs. 68%). A larger share of OBGYNs in the West said they would choose the same specialty compared to OBGYNs in the Northeast (76% vs. 63%) (Table 11).

Figure 29: Most OBGYNs Would Choose the Same Specialty if Given the Chance To Do Things Again
Table 11: Career Satisfaction of OBGYNs
CharacteristicsBased on your experience as a physician, if you had the chance to do things again would you:
Choose the same specialtyChoose a different specialtyNot be a physician at all
Overall70%19%10%
GenderFemale7216*11
Male68248
Age<45691713
45-5468248
55-6473188
65+70209
Race and ethnicityAsian682011
Black662014
Other701711
White711910
Practice typeHealth Center/Clinic66249
Private Office-Based701910
Practice sizeLarge (>10 FTE)731710
Medium (4-10 FTE)72198
Small (≤3 FTE)642213
UrbanicityUrban73188
Suburban642412
Rural711414
RegionSouth711711
West76*167
Midwest691811
Northeast632510
Practice provides abortionsYes79*165*
No682011
*Indicates statistically significant difference from reference group in bold (p<0.05)NOTES: Region derived from zip code, using U.S. census breaksSOURCE: KFF 2020 Physician Survey on Reproductive Health. Fielding from March 18 to September 1, 2020. N = 1210
News Release

Survey: OBGYNs Report That the Affordable Care Act Has Increased Use of Contraceptives Among Patients, but the Cost of Reproductive Health Care Still a Burden for Their Low-Income Patients

Published: Feb 25, 2021

As the nation awaits the Supreme Court ruling on the future of the Affordable Care Act (ACA), a 2020 KFF survey of obstetrician-gynecologists (OBGYNs) finds that since implementation of the ACA’s contraceptive coverage requirement, nearly two-thirds of OBGYNs (63%) reported an increase in contraceptive uptake from their patients and 69% reported an increase in their patients use of their desired contraceptive method. However, nearly all OBGYNs (92%) reported the cost of reproductive health care services still presents a challenge for low-income patients.

The survey highlights issues of patient affordability and access to care. About half of OBGYNs found the issue of affordability comes up always or often when discussing treatment or test options with patients. While 78% of OBGYN practices accept Medicaid, physicians report challenges with specialists accepting Medicaid referrals and being reimbursed at a lower rate by the program compared to private insurance.

The survey found that a majority of OBGYNs provided some form of contraceptive care, but just 18% offered all non-permanent contraceptive methods to their patients. Notably, less than half of OBGYNs provide their patients with prescription forms of emergency contraception (copper IUD and Ella).

A limited number of OBGYNs (23%) provide abortions, but they were more commonly offered by OBGYNs in urban areas, the Northeast, and the West. The most frequently reported reasons for not providing abortion included their practice had policies against it (49%), that abortion services were available elsewhere (45%), and personal opposition (31%).

When asked about career satisfaction, 70% of OBGYNs reported they would choose the same medical specialty, while a minority reported they would choose a different specialty (19%) or not be a physician at all (10%).

For additional findings read the full report, OBGYNs and the Provision of Sexual and Reproductive Health Care: Key Findings from a National Survey.

Methodology

The 2020 KFF National Physician Survey on Reproductive Health surveyed 1,210 OBGYNs from March 18 to September 1, 2020. The survey received responses from a nationally representative sample of OBGYNs practicing in the U.S. who provide sexual and reproductive health care to patients. Following the beginning of the COVID-19 pandemic, additional questions were added regarding the impact of COVID-19. You can find the results here: How OBGYNs Adapted Provision of Sexual and Reproductive Health Care During the COVID-19 Pandemic.

37 States Explicitly Outline What Conditions are Considered “High-Risk” for Vaccine Prioritization

Authors: Jennifer Kates, Lindsey Dawson, Jennifer Tolbert, Daniel McDermott, Hanna Dingel, and Chelsea Rice
Published: Feb 24, 2021

Individuals with certain medical conditions are at increased risk of severe illness if they become infected with SARS-CoV-2, the virus that causes COVID-19, and as such are recommended by the Centers for Disease Control and Prevention (CDC) for vaccination in the first phases of vaccine roll-out. Most states have not yet opened up vaccine eligibility to those with high-risk medical conditions, although they represent some of the next in line.

A recent KFF analysis assessed how states are defining “high-risk medical conditions,” including whether they follow CDC’s recommendations or deviate in some way. This point in time analysis reflects information available as of February 16, 2021. Overall, there is wide variation across the country, including in the conditions listed by states, whether these are limited or allow for additional conditions to be considered, and how clearly the information is presented.

Among the 50 states and DC, 37 have provided explicit information on what conditions they consider “high risk” (Figure 1):

  • 14 include all twelve of the conditions on CDC’s list.
  • Almost all include the following conditions: cancer (35), chronic kidney disease (34), COPD (37), heart conditions (35), immunocompromised due to solid organ transplant (36), sickle cell disease (35), and Type 2 diabetes (34).
  • There is less consistent inclusion of other conditions: severe obesity (32 states), obesity (29), Down Syndrome (32), pregnancy (27), and smoking (16).

Given the challenges and confusion with vaccine roll-out thus far, this variation and lack of clarity could have significant bearing on the ability of those with high-risk medical conditions, some of whom may be among the most vulnerable, to access the vaccine in early phases.

Source

The Next Phase of Vaccine Distribution: High-Risk Medical Conditions