KFF designs, conducts and analyzes original public opinion and survey research on Americans’ attitudes, knowledge, and experiences with the health care system to help amplify the public’s voice in major national debates.
Many Relied on Another Person’s Help to Try to Get a Vaccine Appointment
As many states and local authorities ramp up their COVID-19 vaccination efforts, the latest KFF COVID-19 Vaccine Monitor report provides the first in-depth look at Americans’ experiences trying to gather relevant information and sign up to get vaccinated.
The report shows that many older Americans have been able to navigate the system successfully to get vaccinated, though a significant minority are frustrated and have been unable to sign up for a shot.
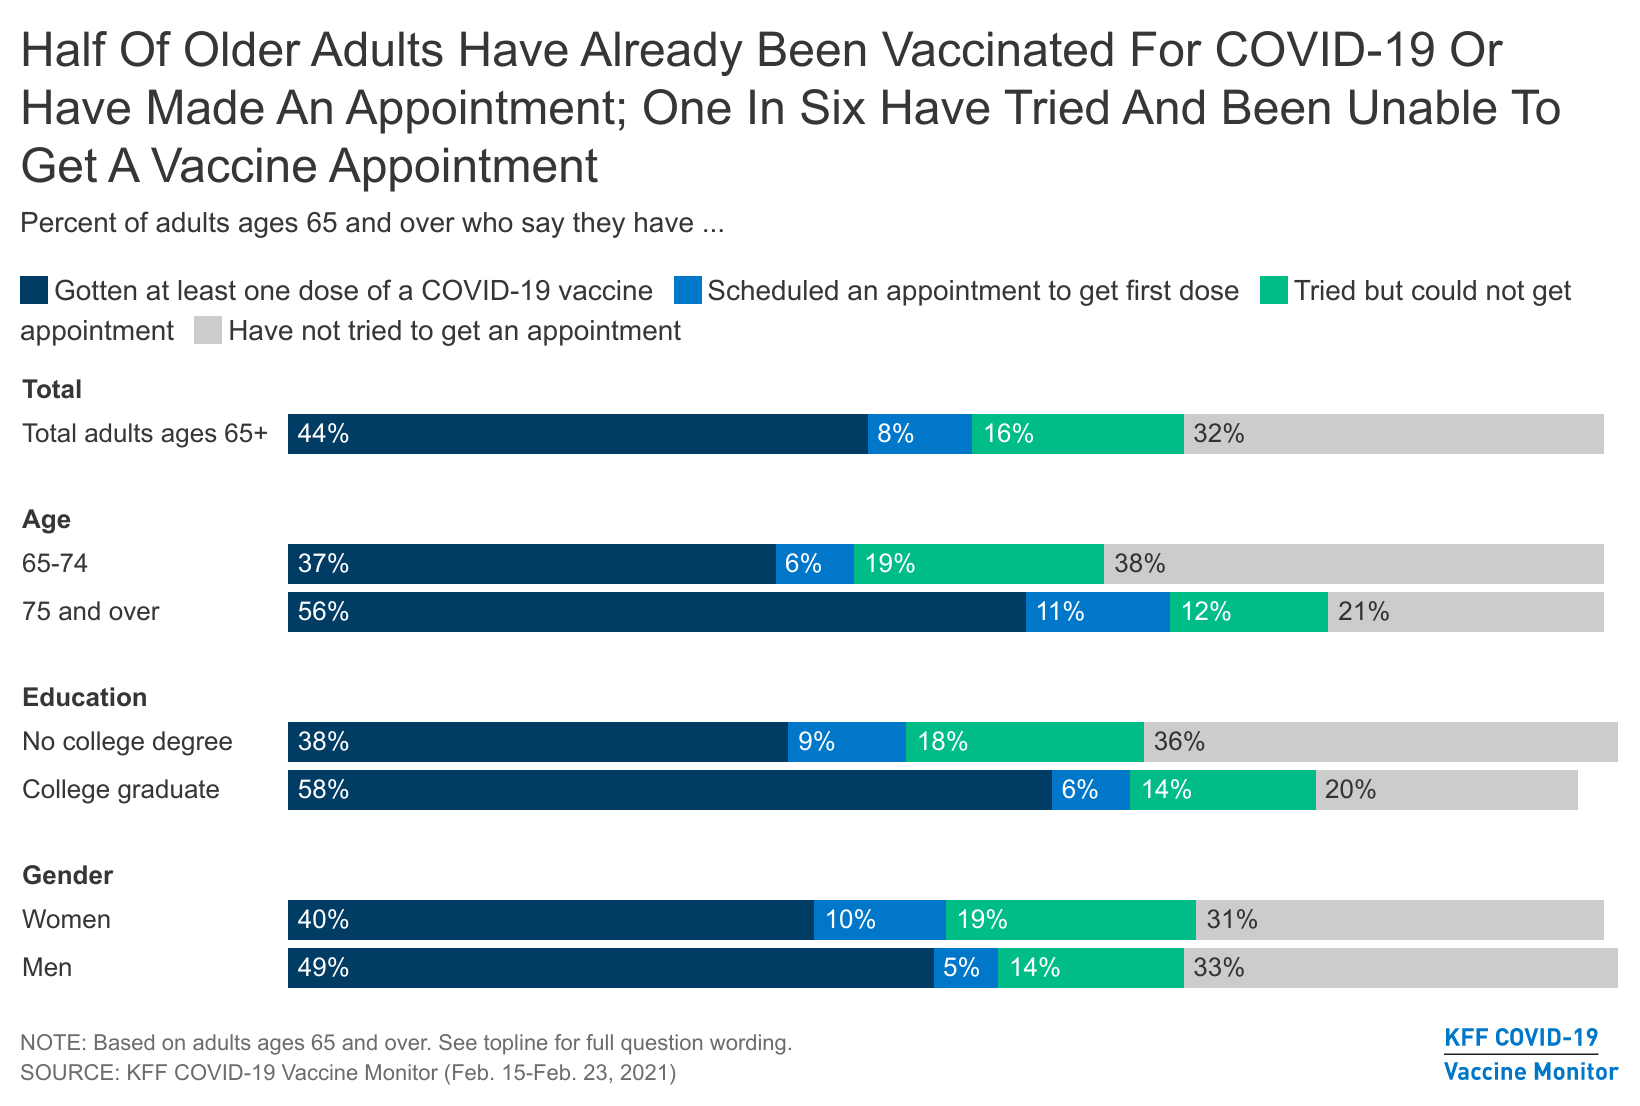
Among those at least 65 years old – a group eligible to get vaccinated in nearly all states – about half have either already received at least one dose of a COVID-19 vaccine (44%) or have an appointment to get vaccinated (8%). An additional 16% say they tried to make an appointment but could not.
Most of the older adults who got vaccinated or attempted to get an appointment say the process was easy to navigate, but 43% say it was difficult. This could be due to difficulties navigating the sign-up system or to the demand for vaccine exceeding supply in their area.
Older adults with college degrees, who may be better able to navigate the sign-up systems, are more likely than those who have not graduated from college to say they have received or scheduled their first dose (65% compared to 46%).
Available through the Monitor’s online dashboard, the new report also examines other aspects of people’s experiences trying to get a COVID-19 vaccine and accessing relevant information. Key takeaways include:
Among adults of any age who have gotten vaccinated, 39% say someone else helped them get the appointment. On the flip side, a third (33%) of all adults say they helped someone else find information about when and where to get vaccinated, and nearly a quarter (23%) say they helped someone make a vaccine appointment.
Although anecdotes abound about children and grandchildren helping older relatives get appointments, those at least 65 years old are more likely than younger adults to report assisting someone else (43% helped someone else find information and 32% helped someone get a vaccine appointment).
Among those who have not yet gotten the vaccine, nearly two thirds (63%) say they don’t have enough information about when they’ll be able to get the vaccine, and nearly half (45%) say they don’t have enough information about where to go. In addition, more than half (54%) say they don’t know enough about potential side effects.
Three-quarters of adults who are open to getting vaccinated say they would be very likely to get it at their doctor’s office, if available. Most also say they’d be very likely to get it at a local pharmacy (61%) or a hospital (55%), and about half say so about a community health clinic (49%) or their workplace (48%). When asked to pick their most preferred place, 38% chose their doctor’s office, followed by a local pharmacy (15%), hospital (9%), or their workplace (8%).
Designed and analyzed by public opinion researchers at KFF, the KFF Vaccine Monitor survey was conducted from February 15-23 among a nationally representative random digit dial telephone sample of 1,874 adults, including oversamples of adults who are Black (507) or Hispanic (506). Interviews were conducted in English and Spanish by landline (339) and cell phone (1,535). The margin of sampling error is plus or minus 3 percentage points for the full sample. For results based on subgroups, the margin of sampling error may be higher.
The KFF COVID-19 Vaccine Monitor is an ongoing research project tracking the public’s attitudes and experiences with COVID-19 vaccinations. Using a combination of surveys and qualitative research, this project tracks the dynamic nature of public opinion as vaccine development and distribution unfold, including vaccine confidence and acceptance, information needs, trusted messengers and messages, as well as the public’s experiences with vaccination.
The KFF COVID-19 Vaccine Monitor is an ongoing research project tracking the public’s attitudes and experiences with COVID-19 vaccinations. Using a combination of surveys and qualitative research, this project tracks the dynamic nature of public opinion as vaccine development and distribution unfold, including vaccine confidence and acceptance, information needs, trusted messengers and messages, as well as the public’s experiences with vaccination.
Key Findings
A little over two months into the U.S. efforts to distribute and administer the COVID-19 vaccine, and as many states and localities ramp up efforts and work out the kinks in their systems, the latest KFF COVID-19 Vaccine Monitor shows that while the scheduling process has been smooth for most of those who got vaccinated, some older adults have had difficulty getting a vaccination appointment and many others have had trouble finding information about where or when they will be able to get the vaccine.
Among adults ages 65 and over, who are now eligible to be vaccinated in nearly every U.S. state, about half say they have already received at least one dose of the vaccine (44%) or have scheduled an appointment to do so (8%). However, one in six older adults (16%) say they have tried but been unable to make an appointment to get vaccinated. Among older adults who got vaccinated or attempted to get an appointment, about half say the process was easy and about four in ten say it was difficult.
Among those who have gotten at least one dose of the COVID-19 vaccine, four in ten across age groups say someone else helped them get the appointment. About half of those who helped others try to get an appointment say it was difficult to get an appointment, while a similar share say it was easy.
Among those who have not been vaccinated, just over four in ten (44%) say they have tried to look for information about when or where to get the COVID-19 vaccine. About six in ten (57%) of this group say the information was easy to find and four in ten (42%) say it was difficult. Overall, nearly two-thirds (63%) of those who haven’t been vaccinated say they don’t have enough information about when they’ll be able to get vaccinated and nearly half (45%) say they don’t have enough information about where they can go to get the vaccine.
Asked where they would most like to go to get the COVID-19 vaccine, the largest share across demographic groups says they want to get it at their own doctor’s office (75% say they’d be very likely to get it there if it was available, and 38% pick their doctor’s office as the place they would most prefer to go among a range of options). Fifteen percent choose a pharmacy as the place they’d most like to get vaccinated, followed by a hospital (9%) or their workplace (8%). Others say they’d choose locations such as a community health clinic, a local school, a church or other religious site, or a large vaccination site run by the government, suggesting that having multiple distribution avenues will help in reaching different segments of the U.S. population with a trusted place to go to get vaccinated.
While there is variation across states and even counties in terms of who is currently eligible to receive the COVID-19 vaccine, most states have opened up vaccinations to those ages 65 and over. New analysis from the KFF COVID-19 Vaccine Monitor shows that about half of adults in this age range say they have either gotten their first vaccine dose (44%) or have scheduled an appointment to do so (8%). Another one in six (16%) say they tried to make an appointment to get vaccinated but were unable to get one.
Some states started vaccinating adults ages 75 and over before opening up vaccinations to other age groups, and this is reflected in a higher share of this group saying they have received or scheduled their first vaccine dose (67% of those ages 75 and over compared to 43% of those ages 65-74). In addition, older adults with college degrees, who may be better able to navigate the systems for signing up for vaccine appointments, are more likely than those who have not graduated from college to say they have received or scheduled their first dose (65% compared to 46%). About half of both men and women ages 65 and over say they have received or scheduled their first dose of the vaccine.
.Among older adults who either got the COVID-19 vaccine or tried to get an appointment, about half (52%) say it was easy to get an appointment while about four in ten (43%) say it was difficult. Combined with the fact that one in six older adults attempted to get a vaccination appointment but were unable, this suggests that while the process is working well for many of those among the first priority age group for vaccination, others are encountering difficulties and frustration when attempting to sign up.
.Ease Of Finding Information About When And Where To Get Vaccinated
Among adults of all ages who have not yet been vaccinated, just over four in ten (44%) say they have tried to look for information about when or where to get the COVID-19 vaccine. Among all those who were either vaccinated or tried to look for information, just over a third (36%) say that information was difficult to find while most (63%) say it was easy. Those who have gotten at least one dose of the vaccine are somewhat less likely to report difficulty finding information compared to those who looked for information but have not yet been vaccinated (24% vs. 42%).
Among those who are most eager to get the COVID-19 vaccine (those who say they will get it as soon as it’s available to them), about six in ten (63%) say they have looked for information about where or when they can get the vaccine, and nearly half that group (28% overall) say the information was difficult to find.
.Who Got Help? Who Is Helping?
Among those who have gotten at least the first dose of a COVID-19 vaccine, four in ten (39%) say that someone else helped them find or schedule a vaccine appointment while six in ten (59%) completed the process on their own. The share who report getting help signing up is similar among both older and younger adults who have gotten the vaccine (40% of those ages 18-64 and 39% of those ages 65 and over). Those without a college degree (50%) and those with household incomes under $40,000 (55%) are somewhat more likely than their counterparts with higher levels of income and education to report getting help with finding or scheduling a vaccine appointment.
.One third of adults overall say they have helped someone else find information about when and where to get vaccinated and close to a quarter (23%) report helping someone else get a vaccine appointment. While those with lower levels of income and education are more likely to report getting help finding vaccine appointments, the opposite is true when it comes to doing the helping. Nearly half of college graduates (47%) and those with incomes of $90,000 or more (45%) say they have helped someone else find information and about three in ten in these groups say they’ve helped someone get a vaccine appointment (32% and 30%, respectively). Although anecdotes abound about adult children and grandchildren helping older relatives get appointments, those ages 65 and over are in fact more likely than younger adults to report assisting someone else (43% say they’ve helped someone else find information and 32% have helped someone get a vaccine appointment).
.Those helping others report similar levels of difficulty finding information and getting appointments as those who completed these tasks on their own. Among those who helped someone else look for information about when and where to get vaccinated, six in ten (62%) say it was easy and four in ten (38%) say the information was difficult to find. Among those who helped someone else try to get a COVID-19 vaccination appointment, half (49%) say the process was difficult and a similar share (46%) say it was easy.
.Information And Outreach
At this point, a much larger share of the public reports seeing messages in the media urging people to get the COVID-19 vaccine than says they have asked a health care professional for information or received information via targeted outreach. Among those who haven’t been vaccinated, seven in ten (71%) say they’ve seen messages online or in the media, one-quarter have asked a health care provider for information, and about one in five (18%) have been contacted by a health organization or agency with information about how to get the vaccine.
While large shares across demographic groups report seeing messages online and in the media, older adults, women, and those with college degrees are both more likely to say they have asked a health care provider for more information and more likely to say they have been contacted by a health care provider, insurance company, or public health agency with information about how to get vaccinated for COVID-19.
Despite high visibility of outreach campaigns online and in the media, large shares of the public continue to say that they don’t have enough information about the potential side effects of the COVID-19 vaccine, or about when or where they will be able to get vaccinated. Among those who have not yet gotten the vaccine, awareness about where to get vaccinated increased somewhat over the past month; 55% now say they have enough information about this, up from 43% in January. Yet this leaves 45% saying they don’t have enough information about where to get vaccinated. In addition, 63% of those who haven’t been vaccinated say they don’t have enough information about when they’ll be able to get the vaccine and over half (54%) say they don’t know enough about the potential side effects of the vaccine, both essentially unchanged from last month.
.Among those who have not yet been vaccinated, adults with lower incomes are more likely than those with higher incomes to say they don’t have enough information about where they can get vaccinated as well as the potential side effects of the COVID-19 vaccine. In addition, Hispanic adults are more likely than White adults to say they don’t have enough information about where or when they can get the vaccine, and both Black and Hispanic adults are more likely than White adults to say they don’t have enough information about the potential side effects of the vaccine.
.Where People Want To Get Vaccinated
With COVID-19 vaccines increasingly becoming available at different locations across the U.S., we examined which locations people say they’d be willing to visit to get a COVID-19 vaccine, as well as the locations they would most prefer as vaccination sites. Individual doctor’s offices were at the top of both lists, but a range of locations were acceptable and preferred by different individuals.
Three-quarters of adults who are open to getting vaccinated (defined as those who say they will get the vaccine as soon as they can, after waiting to see how it works for others, or if required) say they would be very likely to get the COVID-19 vaccine at their doctor’s office, if it is available there. A majority also say they’d be very likely to get it at a local pharmacy (61%) or a hospital (55%) and around half say the same of a community health clinic (49%) or their workplace (48%). When asked to pick their most preferred place, 38% chose their own doctor’s office, followed by a local pharmacy (15%), a hospital (9%), or their workplace (8%). Fewer people say they’d most prefer to get the vaccine at a large vaccination site run by the government (5%), a community health clinic (4%), a local school (4%), a grocery store (4%), or a local church or religious center (3%).
.As previously reported, majorities of Black and Hispanic adults who are still deciding whether to get vaccinated are concerned that they won’t be able to get the vaccine from a place they trust. Given this, it’s important to understand preferred vaccination locations among Black and Hispanic adults.
Across racial and ethnic groups, the largest share says they would be “very likely” to get vaccinated at their own doctor’s office, though many are open to getting vaccinated at a range of other places as well. Black adults are somewhat less likely than White adults to say they’d be very likely to get vaccinated at work (39%), at a large vaccination site run by the government (31%), or at a local school (32%). However, the top choice three choices across Black, Hispanic, and White adults alike are their own doctor’s office, a local pharmacy, and a hospital.
.Concerns About Vaccine Effectiveness Against New Strains Of The Virus
Over half (53%) of adults are worried that the vaccines currently available against COVID-19 might not be effective against new strains of coronavirus, while another 47% aren’t worried. Adults who say they definitely won’t get the vaccine are the least likely to be worried, with 55% saying they are not worried at all.
The people who want the vaccine as soon as possible and those who are going to wait and see are the most concerned about the new strains, with seven in ten of those who plan to wait and see very or somewhat worried that it might not be effective, and 58% of those who want the vaccine as soon as possible who say the same.
Black and Hispanic adults are among the most concerned that the current vaccines might not be effective against new strains, with two-thirds of Hispanic adults (67%) and around three in five Black adults (61%) saying they are very or somewhat worried.
Methodology
This KFF COVID-19 Vaccine Monitor was designed and analyzed by public opinion researchers at the Kaiser Family Foundation (KFF). The survey was conducted February 15-23, 2021, among a nationally representative random digit dial telephone sample of 1,874 adults ages 18 and older (including interviews from 506 Hispanic adults and 507 non-Hispanic Black adults), living in the United States, including Alaska and Hawaii (note: persons without a telephone could not be included in the random selection process). Phone numbers used for this study were randomly generated from cell phone and landline sampling frames, with an overlapping frame design, and disproportionate stratification aimed at reaching Hispanic and non-Hispanic Black respondents. Stratification was based on incidence of the race/ethnicity subgroups within each frame. Specifically, the cell phone frame was stratified as: (1) High Hispanic: Cell phone numbers associated with rate centers from counties where at least 35% of the population is Hispanic; (2) High Black: Cell phone numbers associated with remaining rate centers from counties where at least 35% of the population is non-Hispanic Black; (3) Else: numbers from all remaining rate centers. The landline frame was stratified as: (1) High Black: landline exchanges associated with Census block groups where at least 35% of the population is Black; (2) Else: all remaining landline exchanges. The sample also included 190 respondents reached by calling back respondents that had previously completed an interview on the KFF Health Tracking poll at least nine months ago. Another 387 interviews were completed with respondents who had previously completed an interview on the SSRS Omnibus poll (and other RDD polls) and identified as Hispanic (n = 180; including 50 in Spanish) or non-Hispanic Black (n=207). Computer-assisted telephone interviews conducted by landline (339) and cell phone (1,535, including 1,143 who had no landline telephone) were carried out in English and Spanish by SSRS of Glen Mills, PA. To efficiently obtain a sample of lower-income and non-White respondents, the sample also included an oversample of prepaid (pay-as-you-go) telephone numbers (25% of the cell phone sample consisted of prepaid numbers) Both the random digit dial landline and cell phone samples were provided by Marketing Systems Group (MSG). For the landline sample, respondents were selected by asking for the youngest adult male or female currently at home based on a random rotation. If no one of that gender was available, interviewers asked to speak with the youngest adult of the opposite gender. For the cell phone sample, interviews were conducted with the adult who answered the phone. KFF paid for all costs associated with the survey.
The combined landline and cell phone sample was weighted to balance the sample demographics to match estimates for the national population using data from the Census Bureau’s 2019 U.S. American Community Survey (ACS), on sex, age, education, race, Hispanic origin, and region, within race-groups, along with data from the 2010 Census on population density. The sample was also weighted to match current patterns of telephone use using data from the January- June 2020 National Health Interview Survey. The weight takes into account the fact that respondents with both a landline and cell phone have a higher probability of selection in the combined sample and also adjusts for the household size for the landline sample, and design modifications, namely, the oversampling of prepaid cell phones and likelihood of non-response for the re-contacted sample. All statistical tests of significance account for the effect of weighting.
The margin of sampling error including the design effect for the full sample is plus or minus 3 percentage points. Numbers of respondents and margins of sampling error for key subgroups are shown in the table below. For results based on other subgroups, the margin of sampling error may be higher. Sample sizes and margins of sampling error for other subgroups are available by request. Note that sampling error is only one of many potential sources of error in this or any other public opinion poll. Kaiser Family Foundation public opinion and survey research is a charter member of the Transparency Initiative of the American Association for Public Opinion Research.
This work was supported in part by a grant from the Chan Zuckerberg Initiative DAF, an advised fund of Silicon Valley Community Foundation. We value our funders. KFF maintains full editorial control over all of its policy analysis, polling, and journalism activities.
Group
N (unweighted)
M.O.S.E.
Total
1,874
± 3 percentage points
COVID-19 Vaccination Status
Have gotten at least one dose of the COVID-19 vaccine
During the coronavirus pandemic, Medicaid has played a key role in providing coverage to millions of people who have lost their jobs or their health coverage. In addition, provisions included in the Families First Coronavirus Response Act (FFCRA) and the Coronavirus Aid, Relief and Economic Security (CARES) Act require states to maintain eligibility standards and provide continuous enrollment in Medicaid until the end of the public health emergency (PHE) in order to qualify for enhanced federal Medicaid funding. This report provides data on state Medicaid and CHIP eligibility levels and presents a snapshot of key aspects of state enrollment and renewal procedures in place during the COVID-19 PHE based on information from the 19th annual survey of Medicaid and CHIP program officials in the 50 states and DC. The report includes policies for children, pregnant women, parents and other non-elderly adults whose eligibility is based on Modified Adjusted Gross Income (MAGI) financial rules. Key findings from the survey include the following.
In 2021, Medicaid and CHIP eligibility is largely unchanged from 2020 as a result of maintenance of eligibility (MOE) requirements. State eligibility levels across all groups remained steady throughout 2020 due to the FFCRA’s increased FMAP and MOE provisions. Children and pregnant women continue to be covered at higher income levels while the coverage gap for low-income adults persists in the 14 states that have not implemented the expansion. In October 2020, Nebraska became the 37th state, including the District of Columbia, to implement the Medicaid expansion following its adoption through a ballot initiative in 2018. Voters in Missouri and Oklahoma approved similar initiatives in 2020 and will implement the expansion later in 2021.
Even with the MOE, most states are renewing coverage when possible and taking other steps to prepare for the end of the PHE. Most states are renewing coverage when they are able to confirm ongoing eligibility through electronic data sources. Two-thirds of states processing renewals also indicate they are sending renewal forms or requests for information when they are unable to renew coverage automatically through other data sources. Although states may not now terminate coverage for lack of response or ineligibility, sending renewal requests enables states to extend coverage for those who respond with proof that they remain eligible. In addition, just over a third of states have established a new 12-month renewal period when processing a change in circumstances that results in a new eligibility pathway. As states prepare for the end of the PHE, more than one-third are continuing or plan to take proactive steps to update enrollee mailing addresses. These actions will help to reduce backlogs and minimize coverage disruptions at the end of the PHE. Only 17 states reported an increase in new applications since the beginning of the COVID-19 PHE. This could be because of smaller than expected declines in employer-sponsored insurance, drops in applications at the beginning of the pandemic due to office closures, and the elimination of reapplications (where an individual loses coverage, often due to procedural reasons, then reapplies a short time later) due to the MOE requirements.
Administrative actions and Congressional proposals will have implications for Medicaid coverage and enrollment as well as for state efforts to plan for resuming normal operations after the PHE. In a letter to Governors, the Biden administration noted that the PHE is likely to extend for the entirety of 2021 and promised a 60-day notice before the PHE is terminated or is allowed to expire. In December 2020, CMS released guidance outlining how states are expected to unwind emergency authorities and resume normal eligibility and enrollment processing after the end of the PHE. Although the extension of the PHE gives states more time to prepare for it to end, it is possible CMS will issue additional clarifying guidance, which would affect states’ planning efforts. The administration also recently announced it will revise Medicaid waiver demonstration policy and rescind guidance related to work requirements and may also revise demonstration policy related to capped financing. In addition, the latest COVID relief legislative package includes provisions to provide states the option to extend coverage for pregnant women to 12 months postpartum in both Medicaid and CHIP and to provide financial incentives for non-expansion states to adopt the Medicaid expansion. The eligibility and enrollment policies presented here provide a baseline for assessing changes states may make in response to these federal policy shifts.
Report
Introduction
Since its emergence a year ago, the coronavirus has had implications for the health of the nation and our economy, exposing gaps in the public health infrastructure and further highlighting the importance of health coverage. During this time, enrollment in Medicaid has increased as people sought coverage after losing jobs or income because of the pandemic. Through the Families First Coronavirus Response Act (FFCRA) and the Coronavirus Aid, Relief and Economic Security Act (CARES), states are required to maintain eligibility standards and provide continuous enrollment in Medicaid until the end of the public health emergency (PHE) in order to qualify for a 6.2 percentage point increase in Federal Medical Assistance Percentage (FMAP). The continuous coverage provision, along with new applications, resulted in Medicaid enrollment growth of 6.7% between February and September 2020 (the most recently available data). States were also able to adopt a range of options through temporary changes in their state Medicaid plans (SPAs),through disaster-related waivers, and through other administrative authorities to streamline processes and connect individuals to coverage more quickly, such as expanding use of presumptive eligibility and allowing self-attestation of certain eligibility criteria.
This 19th annual survey of the 50 states and the District of Columbia (DC), provides data on state Medicaid and CHIP eligibility levels and presents a snapshot of key aspects of state enrollment and renewal procedures in place during the COVID-19 public health emergency. In light of the ongoing COVID-19 pandemic, the survey was scaled back in length and scope and focuses on state actions taken or planned in response to the pandemic. The report is based on a survey of state Medicaid and CHIP program officials conducted by the Kaiser Family Foundation (KFF) and the Georgetown University Center for Children and Families during January 2021. The report includes policies for children, pregnant women, parents and other non-elderly adults whose eligibility is based on Modified Adjusted Gross Income (MAGI) financial eligibility rules; it does not include policies for groups eligible through Medicaid pathways for adults over the age of 65 or on the basis of disability.
Medicaid and CHIP Eligibility
As of January 2021, Medicaid and CHIP eligibility is largely unchanged from 2020 due to maintenance of eligibility (MOE) requirements tied to enhanced federal funding. To help support states and promote stability of coverage amidst the COVID-19 pandemic, the FFCRA provides a 6.2 percentage point increase in the federal share (FMAP) of certain Medicaid spending if states meet certain MOE requirements. The MOE provisions prohibit states from tightening eligibility and enrollment standards beyond policies in place as of January 1, 2020 and require states to provide continuous coverage and to cover COVID-19 testing and treatment for Medicaid enrollees. The MOE continuous coverage requirement remains in place until the end of the month when the public health emergency (PHE) expires or is terminated. The MOE does not apply to CHIP programs, but other MOE requirements remain in place for CHIP.1 While states continue to have the flexibility to increase eligibility or implement new enrollment and renewal processes, the impact of the COVID-19 pandemic and the economic recession have limited states’ ability to do so, resulting in few changes in eligibility outside of temporary emergency authorities.
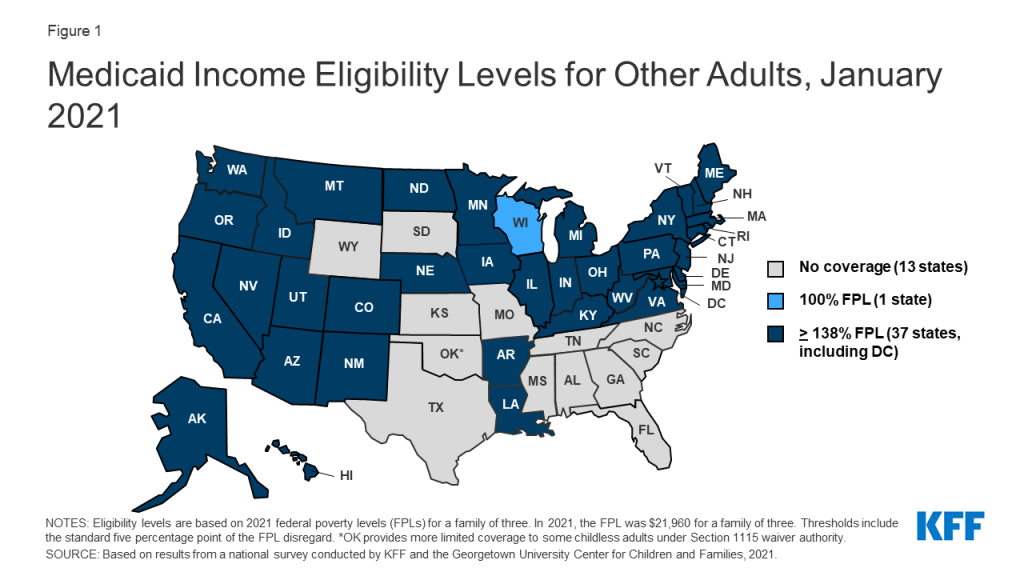
In October 2020, Nebraska implemented the ACA Medicaid expansion, the only major eligibility policy change in 2020. As of January 2021, 37 states extend coverage to adults without dependent children with incomes up to 138% FPL ($30,305 for a family of 3) (Figure 1). Also, in 2020, Missouri and Oklahoma voters approved ballot initiatives to implement Medicaid expansion in their states. When Medicaid expansion was first launched in January 2014, 26 states (including DC), participated. Since then, an additional 13 states have adopted the Medicaid expansion, six via state ballot initiatives. Following implementation in Missouri and Oklahoma, planned for mid-2021, the total number of expansion states will increase to 39.
Figure 1: Medicaid Income Eligibility Levels for Other Adults, January 2021
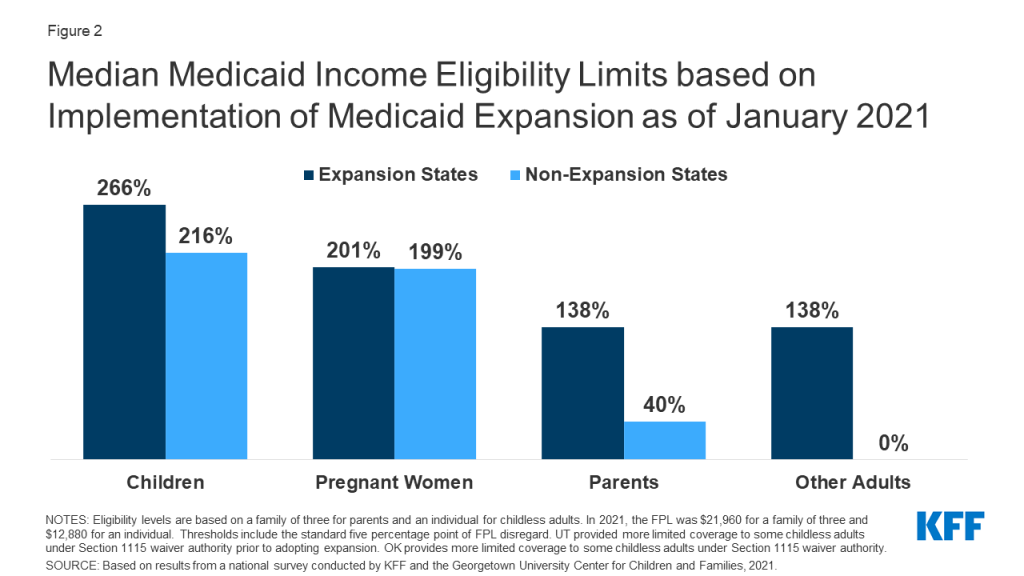
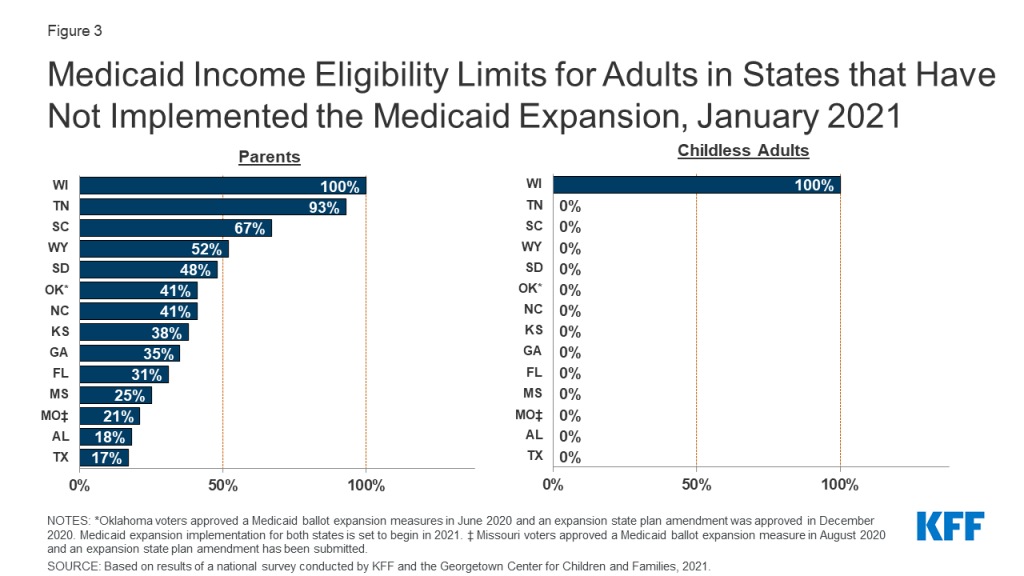
In states that have not implemented the Medicaid expansion, eligibility for parents and other adults remains extremely low (Figures 2 and 3). The median eligibility level for parents and caretakers in the 14 non-expansion states remains at 40% FPL ($8,784 annually for a family of three), ranging from a low of 17% FPL in Texas to 100% FPL in Wisconsin. Ten non-expansion states base eligibility on a fixed dollar threshold that is converted to the equivalent federal poverty level for comparison purposes. Over time, the equivalent eligibility level will decrease when annual updates adjust federal poverty levels upward to account for inflation. Wisconsin remains the only non-expansion state to cover adults without dependent children, extending eligibility up to 100% FPL for these adults through a waiver.
Figure 2: Median Medicaid Income Eligibility Limits based on Implementation of Medicaid Expansion as of January 2021Figure 3: Medicaid Income Eligibility Limits for Adults in States that Have Not Implemented the Medicaid Expansion, January 2021
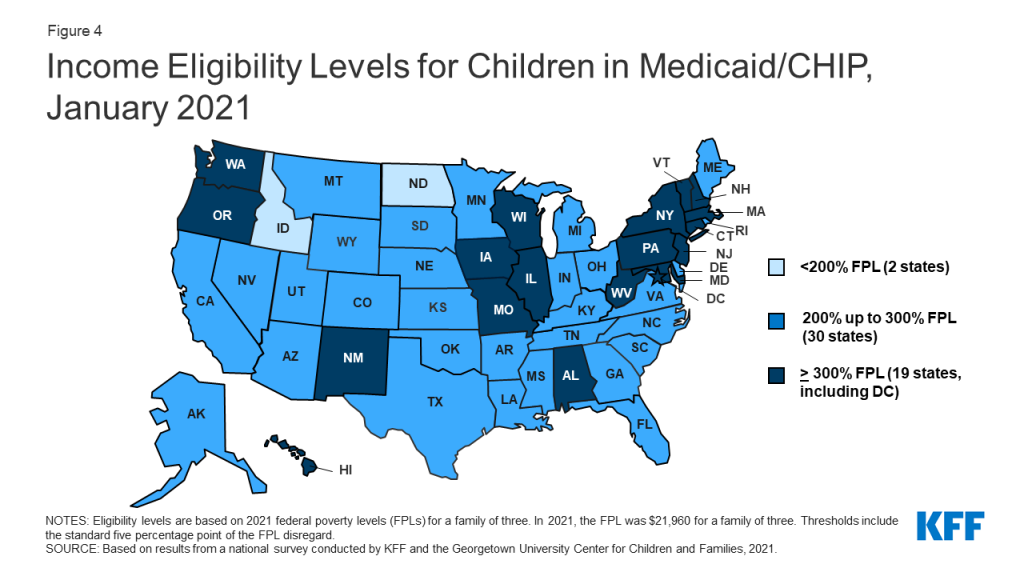
Children’s upper income eligibility in Medicaid and CHIP continues to be the highest of all eligibility groups with 49 states covering children at or above 200% FPL (Figure 4). In 2020, the median eligibility level for children held steady at 255% FPL, ranging from a low of 175% FPL in North Dakota to a high of 405% FPL in New York. More than a third of the states (19) cover children at or above 300% FPL. The only change in eligibility levels for children’s coverage was in Kansas, where CHIP eligibility is linked to a dollar-based income level tied to the 2008 FPL. While the dollar value remains the same, over time, the equivalent eligibility level will decrease when the federal poverty level is adjusted upward to account for inflation.
Figure 4: Income Eligibility Levels for Children in Medicaid/CHIP, January 2021
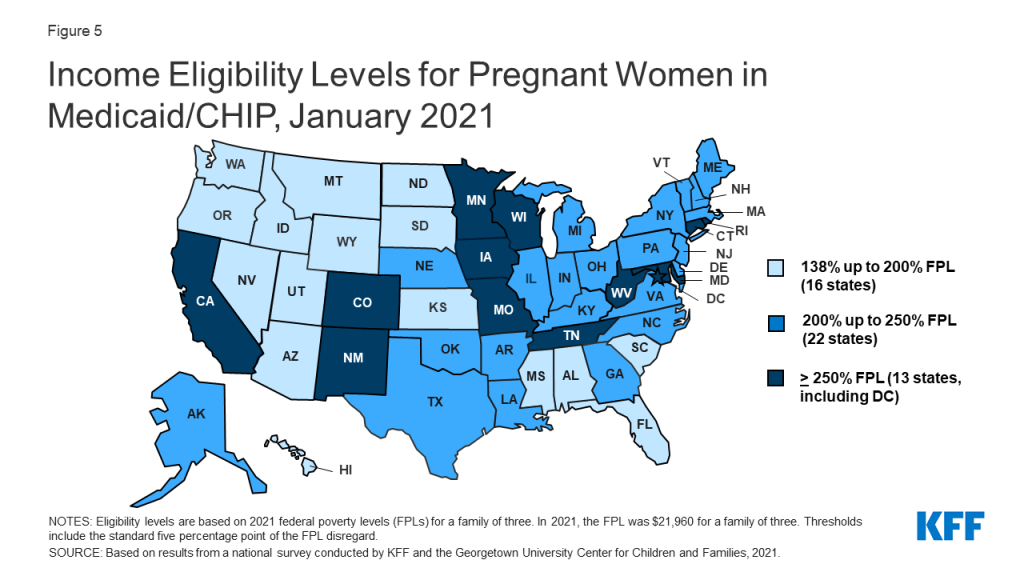
The median eligibility limit for coverage for pregnant women in Medicaid and CHIP is stable at 205% FPL (Figure 5). Across states, eligibility levels for pregnant women in Medicaid and CHIP range from a low of 138% FPL (the federal minimum level) in Idaho and South Dakota to a high of 380% FPL in Iowa. A total of 35 states cover pregnant women at or above 200% FPL. Six states have expanded coverage for pregnant women through CHIP, an option for states that cover pregnant women in Medicaid up to at least 185% FPL.
Figure 5: Income Eligibility Levels for Pregnant Women in Medicaid/CHIP, January 2021
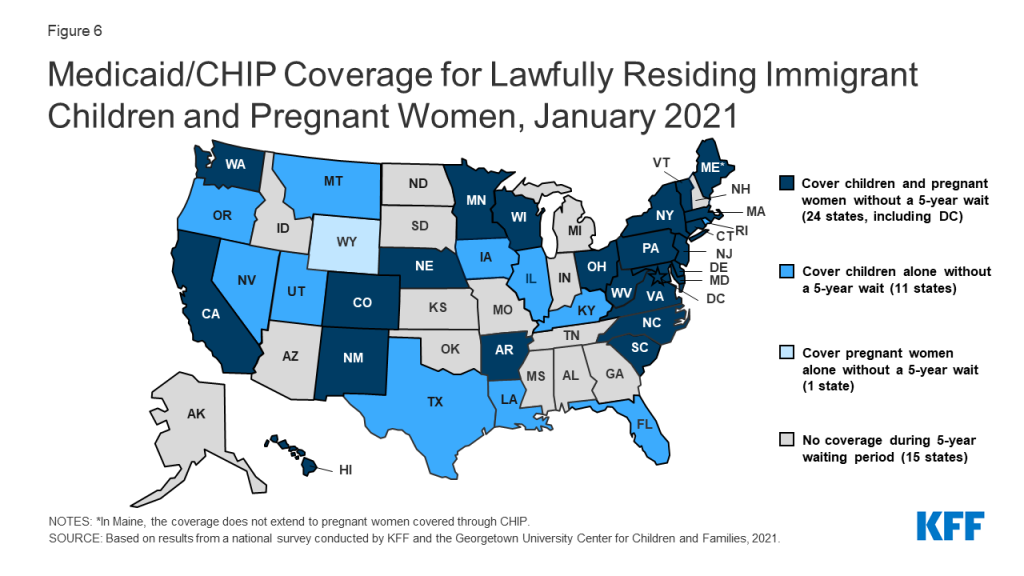
As of January 2021, 41 states have adopted federal options or use state-only funds to extend coverage or limited benefits to some immigrant children, pregnant women, or non-elderly adults. CHIP’s enactment in 1997 included the unborn child option that allows states to provide coverage from conception to birth, thereby extending coverage to pregnant women regardless of immigration status. A total of 17 states have adopted this option. Then, the 2009 CHIP Reauthorization Act (CHIPRA) offered a new option for states to receive federal funding to cover lawfully-residing children and pregnant women in Medicaid and CHIP without the five-year waiting period. Since then, two-thirds of states (35) have implemented the option for children in Medicaid and all of those states with separate CHIP programs (24 states) cover lawfully-residing children in CHIP (Figure 6). Twenty-five states have adopted the CHIPRA option to cover lawfully-residing pregnant women. Additionally, eight states use state-funds to cover children who are ineligible for federal funding due to immigration status, five states provide pre-natal or postpartum services to some immigrant pregnant women, and eight states cover other immigrant adults.
Figure 6: Medicaid/CHIP Coverage for Lawfully Residing Immigrant Children and Pregnant Women, January 2021
The median eligibility level for family planning services is 206% FPL, but eligibility levels range from 138% FPL in Louisiana and Oklahoma to a high of 306% FPL in Wisconsin. In 2020, Texas became the 30th state to provide family planning services using federal funds. Texas offers family planning services through a Section 1115 demonstration waiver, Healthy Texas Women, which includes restrictions on free choice of family planning providers.
Enrollment and Renewal Processes During the PHE
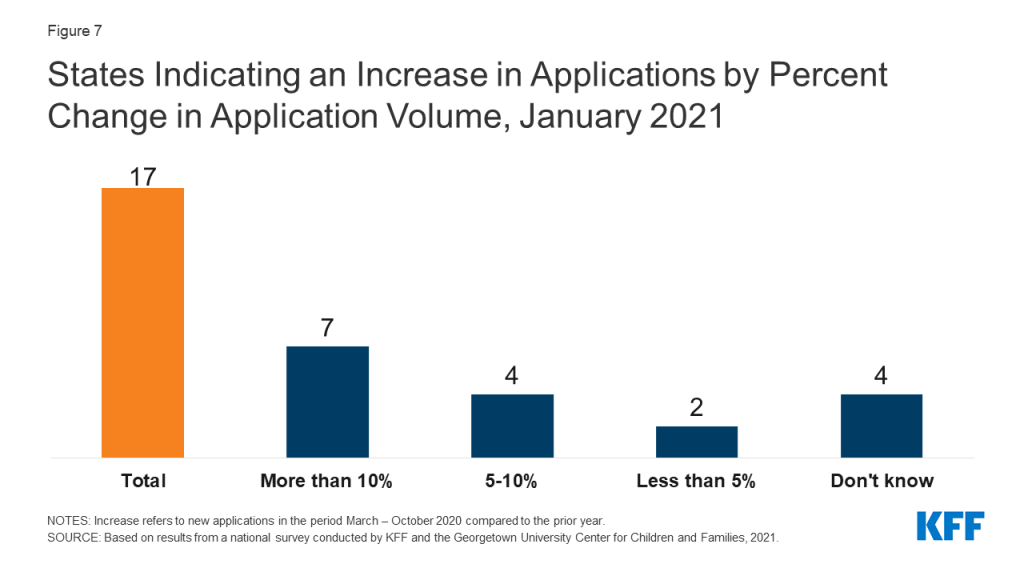
One third of states have experienced an increase in new applications since the beginning of the COVID-19 PHE (Figure 7) and few states reported application backlogs. Seventeen states report that the volume of new applications increased during the COVID-19 PHE compared to the same period in 2019. Seven of these states (Delaware, Hawaii, Illinois, Nebraska, New York, Nevada, and Tennessee) report increases of greater than 10%. Despite overall Medicaid enrollment growth, states may not be experiencing large increases in applications for a variety of reasons, including smaller than expected declines in employer-sponsored insurance, a drop in applications early in the pandemic due to office closures and the elimination of reapplications (where an individual loses coverage, often due to procedural reasons, then reapplies a short time later) due to the MOE requirements. Only five states report current delays in processing new applications beyond the current timeliness standards. Two of the five states with backlogs indicated their current backlogs were lower than in the prior year, while one state indicated that the backlog was the result of decreased administrative capacity due to the pandemic. CMS expects that states will resume timely processing of all applications within four months of the end of the PHE. Since most states are not currently experiencing application backlogs, they can potentially focus resources on processing renewals or changes in circumstances before the end of the PHE.
Figure 7: States Indicating an Increase in Applications by Percent Change in Application Volume, January 2021
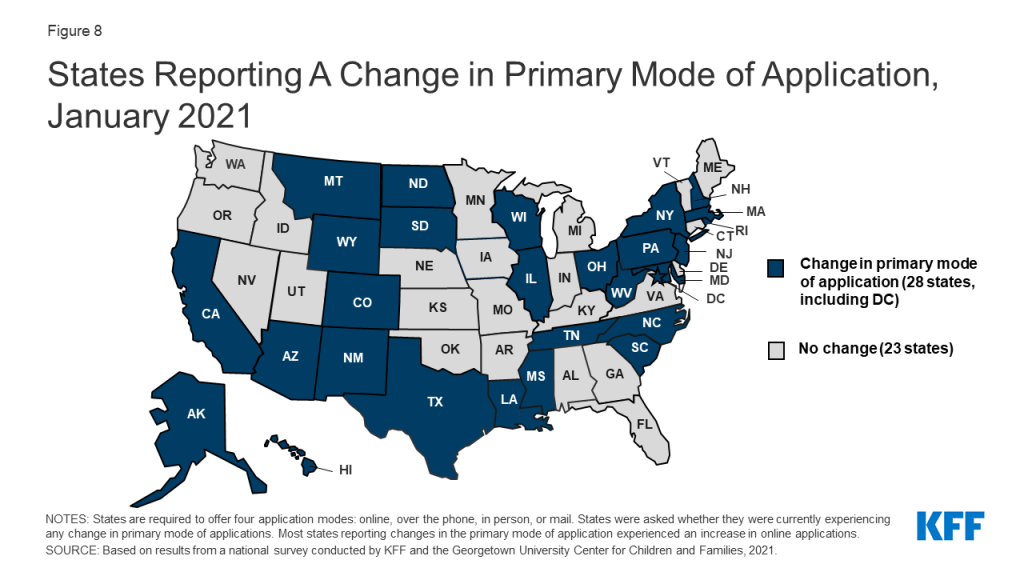
Just over half of states (28) report a shift in how individuals are applying for Medicaid coverage, largely driven by an increase in online applications (Figure 8). The ACA required states to create a single streamlined application for Medicaid, CHIP, and Marketplace coverage and to provide options for individuals to apply for and renew coverage through multiple modes, including online and phone. Most states reporting a change in the primary mode of application experienced an increase in online applications, likely driven by limited access to in-person application assistance at state and local eligibility offices or through community-based assisters due to COVID-19.
Figure 8: States Reporting A Change in Primary Mode of Application, January 2021
CMS has recommended that states take steps to increase the share of online applications in a planning tool it developed to help states prepare for the end of the PHE. Electronic applications can expedite determinations and reduce both administrative costs and errors associated with manual data entry. As reported in the 2020 survey, the share of applications received online varies considerably among states, ranging from less than 10% to more than 90%. Both states that reported high and low shares of online applications in 2020 reported experiencing an increase in online applications. States can use a variety of strategies to increase the volume of online applications, including actively promoting the weblink in all outreach and marketing efforts and developing mobile-based apps and creating portals for assisters to facilitate applications.2
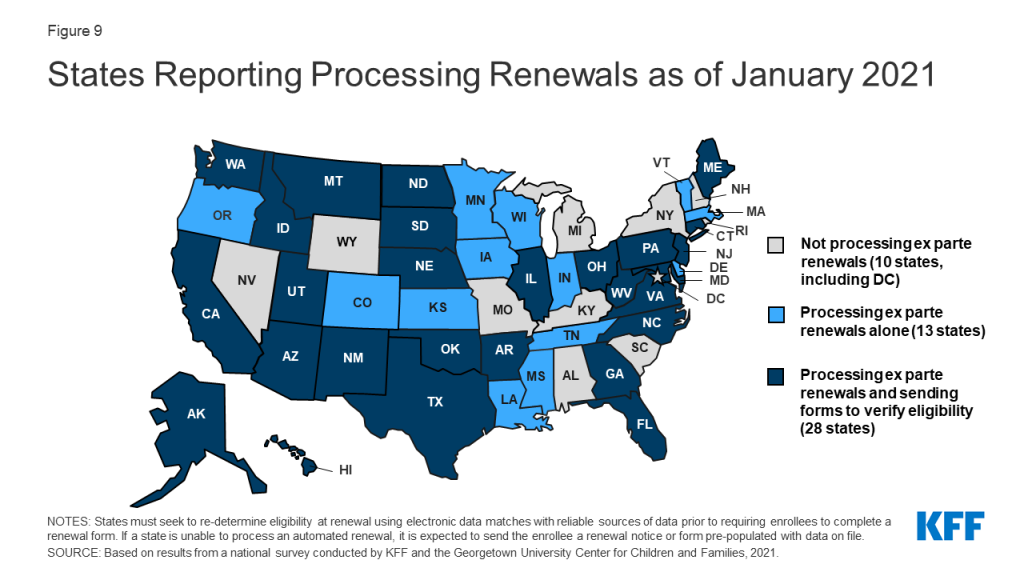
As of January 2021, most states (41) report processing ex parte (automated) renewals to extend coverage for individuals during the PHE (Figure 9) and two-thirds of those states (28 of 41) are sending renewal forms or requests for documentation when they are unable to confirm ongoing eligibility through electronic data sources. Under the ACA, states must seek to complete automated or ex parte renewals by verifying ongoing eligibility through available data sources, such as state wage databases, before sending a renewal form or requesting documentation from an enrollee. While some states suspended renewals as they implemented the MOE continuous coverage requirements and made other COVID-related adjustments to operations, most states are now actively processing renewals. Other states will likely restart the renewal process in response to CMS guidance that outlines actions states should take during the PHE to resume normal operations to the extent possible. When states are able to confirm ongoing eligibility on an ex parte basis, including the 41 states currently processing automated or ex parte renewals, they have the option to extend the renewal date out to 12 months from the original renewal date or 12 months from when the renewal was processed to stagger renewal dates, but this may result in renewal periods for enrollees that are shorter than 12 months. If an enrollee submits documentation to verify ongoing eligibility at renewal, the state must extend coverage for a full 12 months.
Figure 9: States Reporting Processing Renewals as of January 2021
Slightly more than a third of states (19) have established a new 12-month renewal period when processing a change in circumstances that results in a new eligibility pathway. In November 2020, CMS published an interim final rule that provided options for states to transition enrollees determined ineligible for their current coverage to different coverage pathways for which they are eligible if such a transition is in the same tier of coverage (though it may cover fewer benefits or have higher patient cost-sharing). States may then retain the original renewal date or extend a new 12-month eligibility period if they have information needed to confirm ongoing eligibility. Some states report that pregnant women and children aging out of coverage are most likely to be given a new 12-month renewal period, while other states say enrollees in all MAGI-based eligibility groups are given a new 12-month renewal period.
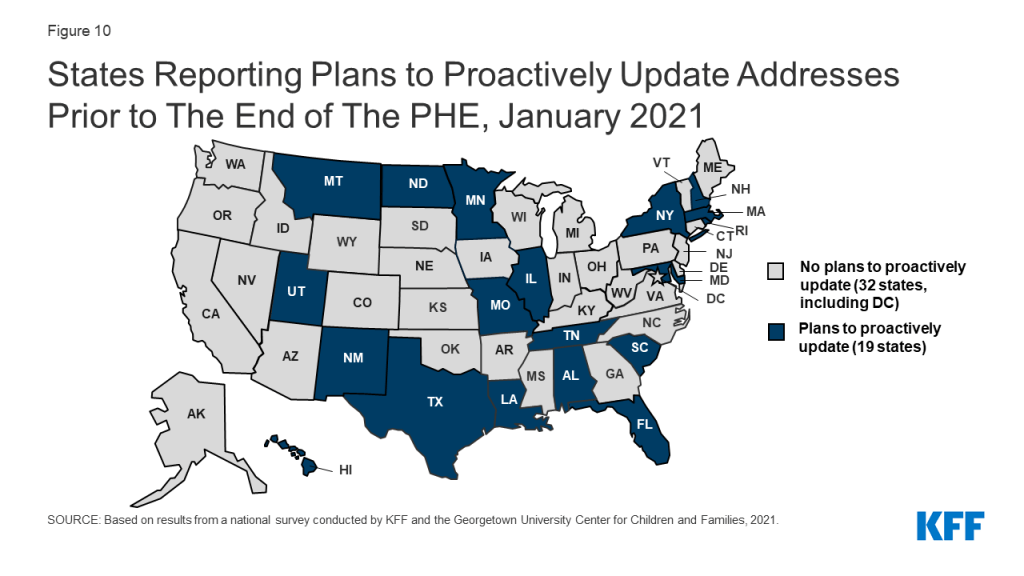
Just over one third of states (19) proactively take steps to update mailing addresses or plan to do so before the end of the PHE (Figure 10). Once the PHE expires and states resume normal operations under current federal rules, states may automatically terminate coverage without the advance ten-day notice when an enrollee cannot be located.3 Prior to the COVID-19 pandemic, a number of states terminated coverage when mail was returned as undeliverable, potentially contributing to enrollment declines. Ongoing issues with the United States Postal Service (USPS) and the impact of the COVID-19 economic crisis on housing may exacerbate difficulties in reaching enrollees by mail. In 2020, states that took proactive steps to keep mailing addresses current reported using the USPS National Change of Address Database or contracting with vendors to facilitate the process. States may also check other public programs for more updated information or engage Medicaid managed care organizations in updating addresses. Additionally, as of 2020, 43 states offered online accounts, which make it easier for enrollees to update addresses among other features. A few states also reported taking additional action, such as attempting to contact enrollees via telephone.
Figure 10: States Reporting Plans to Proactively Update Addresses Prior to The End of The PHE, January 2021
Most states are not planning changes to eligibility or enrollment that are currently disallowed when the PHE ends. While all states will phase out the continuous coverage requirement, five states are planning to make other changes. Two states reported plans to move forward with implementing work requirements and three states plan to charge premiums for some adults. The Biden Administration has announced it intends to rescind work requirements demonstration waivers and may take additional action to revise waiver guidance, impacting states’ ability to implement these policies.
Looking Ahead
State eligibility and enrollment policies in place as of January 2021 provide a baseline for assessing state actions after the PHE ends and in response to new Medicaid policy options that may be adopted at the federal level. Currently, states cannot implement more restrictive eligibility policies than those in place as of January 1, 2020 and must provide continuous coverage to Medicaid enrollees until the PHE ends in order to receive enhanced federal funding. Their policy choices at the end of the PHE and decisions around adopting potential coverage options will have coverage implications for those who are currently enrolled and those who may become eligible.
The Biden Administration’s recent announcement regarding the likely extension of the PHE gives states more time to prepare for the end the PHE. In a letter to Governors, the Biden administration noted that the PHE is likely to extend for the entirety of 2021 and promised a 60-day notice before the PHE is terminated or is allowed to expire. Advance notice before the end of the PHE was one of the top responses when states were asked what additional guidance they need from CMS to plan for resuming normal operations.
States are taking steps now to prepare for the end of the PHE, but some indicate additional guidance would be helpful to reduce backlogs and minimize coverage disruptions. While most states are processing automated renewals when possible, states will still have a backlog of renewals that were not able to be completed. Some states noted the need for additional guidance to avoid unevenly distributed workloads due to large numbers of renewals and other changes occurring in a short period of time. When the PHE ends, CMS guidance issued under the Trump administration allows states to send coverage termination notices to individuals who did not respond to requests for information, did not return renewal forms, or lost eligibility for other reasons within six months of the end of the PHE. This approach may result in coverage losses at the end of the PHE for individuals who remain eligible. CMS guidance also gives states six months to catch up on pending renewals and other changes once the PHE ends; however, several states indicated that 12 months would allow for a smoother resumption of operations. While states can use this guidance to help plan for the end of the PHE, it is possible the Biden administration could revise the guidance, which would affect states’ planning efforts.
As states prepare to return to normal operations at the end of the PHE, there are additional considerations beyond resuming routine eligibility and enrollment procedures. In addition to the MOE requirements, states implemented a variety of temporary strategies to deal with the pandemic including, but not limited to eligibility, enrollment or renewal. These changes were wide ranging, impacting all aspects of Medicaid from improving access to telehealth and easing prior authorization requirements to waiving premiums or cost-sharing and modifying appeals and fair hearing requirements. CMS has developed two planning tools to aid states in preparing for the end of the PHE. The first focuses on eligibility and enrollment pending actions and the second provides assistance in general planning to restore regular Medicaid and CHIP operations. Together, the tools prompt states to consider actions that will aid in a smooth return to normal operations, including how they communicate with beneficiaries and stakeholders and how to extend or permanently implement flexibilities adopted through Section 1135 emergency waivers or disaster-related temporary state plan amendments.
Administration actions and Congressional proposals would reduce some barriers to Medicaid enrollment and support targeted Medicaid coverage expansions. The Biden administration has already reopened the marketplace and will restore funding for outreach, marketing and consumer assistance that will help connect uninsured individuals with Medicaid and CHIP. The administration also recently announced it will revise waiver demonstration policy and rescind guidance related to work requirements and may also revise demonstration policy related to capped financing. In addition, the latest COVID relief legislative package includes provisions to provide states the option to extend coverage for pregnant women to 12 months postpartum in both Medicaid and CHIP and to provide financial incentives for non-expansion states to adopt the Medicaid expansion.
42 CFR §431.213 – Exception from advance notice. The agency may send a notice not later than the date of action if: (d) The beneficiary’s whereabouts are unknown and the post office returns agency mail directed to him indicating no forwarding address (See §431.231 (d) of this subpart for procedure if the beneficiary’s whereabouts become known). ↩︎
THE CONVERSATION: Between Us, About Us, A New Campaign By Black Health Care Workers for Black People about the COVID-19 Vaccines
W. Kamau Bell Joins Black Doctors, Nurses and Researchers to Dispel Misinformation and Provide Accessible Facts in this Video Series to be Featured on YouTube
March 4, 2021 – THE CONVERSATION: Between Us, About Us. is a new campaign to provide Black communities with credible information about the COVID-19 vaccines co-developed by KFF (Kaiser Family Foundation) and the Black Coalition Against COVID. Black doctors, nurses and researchers dispel misinformation and provide accessible facts in 50 FAQ videos that deliver the information Black people are asking for about the COVID-19 vaccines. More videos and voices will be added to this one-of-its-kind living video library as new questions arise and information becomes available.
The series debuts on YouTube today with a launch video featuring W. Kamau Bell in an open, honest conversation with Black health care workers that gets to the heart of Black people’s questions and concerns. YouTube is providing significant support for the campaign, including high visibility promotion across its platform.
Despite having one of the highest COVID-19 mortality rates in the U.S., Black Americans are among those least likely to get the vaccines. “As Black health academicians, researchers, and clinicians, we understand our empathy-based responsibility to provide our community with the resources and guidance on surviving this pandemic,” said Reed Tuckson, MD, Founding Member, Black Coalition Against COVID. “As such, we appreciate this partnership with KFF to produce one of the largest of its kind campaigns to creatively provide trustworthy information that will save Black lives.”
“We’re seeing more Black adults want to get vaccinated when their time comes, but still a sizeable percent say they are waiting to see others vaccinated first. Among this group, many share common concerns that are directly addressed in this campaign,” said Drew Altman, PhD, President & CEO, KFF, which produced the campaign as the first initiative in its Greater Than COVID public information response to the pandemic.
“The Biden Administration has made a commitment to prioritize equity, in policy and practice. As we work toward eliminating the severe and pervasive health and social inequities that have been exacerbated by this pandemic, we know we can’t do it alone. Honest and transparent communication about the vaccine is a critical piece of this work. That’s why, I’m proud to listen to and support THE CONVERSATION. This work truly exemplifies the power partnerships have to uplift the voices of Black health care workers and ensure that those most impacted by this pandemic have the resources they need to respond to it,” said Marcella Nunez-Smith, MD, MHS, Chair, COVID–19 Health Equity Task Force and Associate Dean, Yale University.
“There are two major barriers to Black folks receiving the COVID-19 vaccines. Neither one of them are vaccine hesitancy. The barriers are accessible facts about the COVID-19 vaccines and convenient access to receive a vaccine,” said Rhea Boyd, MD, MPH, a pediatrician and public health advocate, who co-developed the project with KFF and the Black Coalition Against COVID. “This is a comprehensive effort on behalf of Black health care workers across the country, to ensure every Black person in the United States has the credible information they need to make this critical choice. It is time for us to have a conversation, between us and about us.”
“Effective communication is as critical to the outcome of the vaccine program as manufacturing the shots. YouTube is where people are, and it’s where they are looking for information and support to guide them in health decisions. By partnering with KFF and the Black Coalition Against COVID, we are able to bridge the information gap between communities most at-risk and trusted health experts who are representative of those communities and make clinical topics like COVID vaccine development accessible and relatable in a way that only video can. Together, I believe we can reimagine how health information has traditionally been shared and make public health truly public,” explained Garth Graham, MD, Director and Global Head of Healthcare and Public Health at YouTube.
For more about THE CONVERSATION: Between Us, About Us., go to:
The California Health Care Foundation, Commonwealth Fund and Sierra Health Foundation have generously contributed funding to the production and are supporting distribution of the series.Through Greater Than COVID, KFF will also be working with partners to address information needs in other disproportionately affected communities.
* * *
Black Coalition Against COVID is a Washington, D.C.-based community initiative which seeks to provide trustworthy, science-based, information curated on behalf of and for the Black community about COVID-19 and the vaccine development process in an effort to help save Black lives at the national and local levels.
Greater Than COVID is a public information initiative from KFF to help individuals take charge of their health during the evolving COVID-19 public health crisis. Tailored media messages and community tools address information needs about the vaccines.
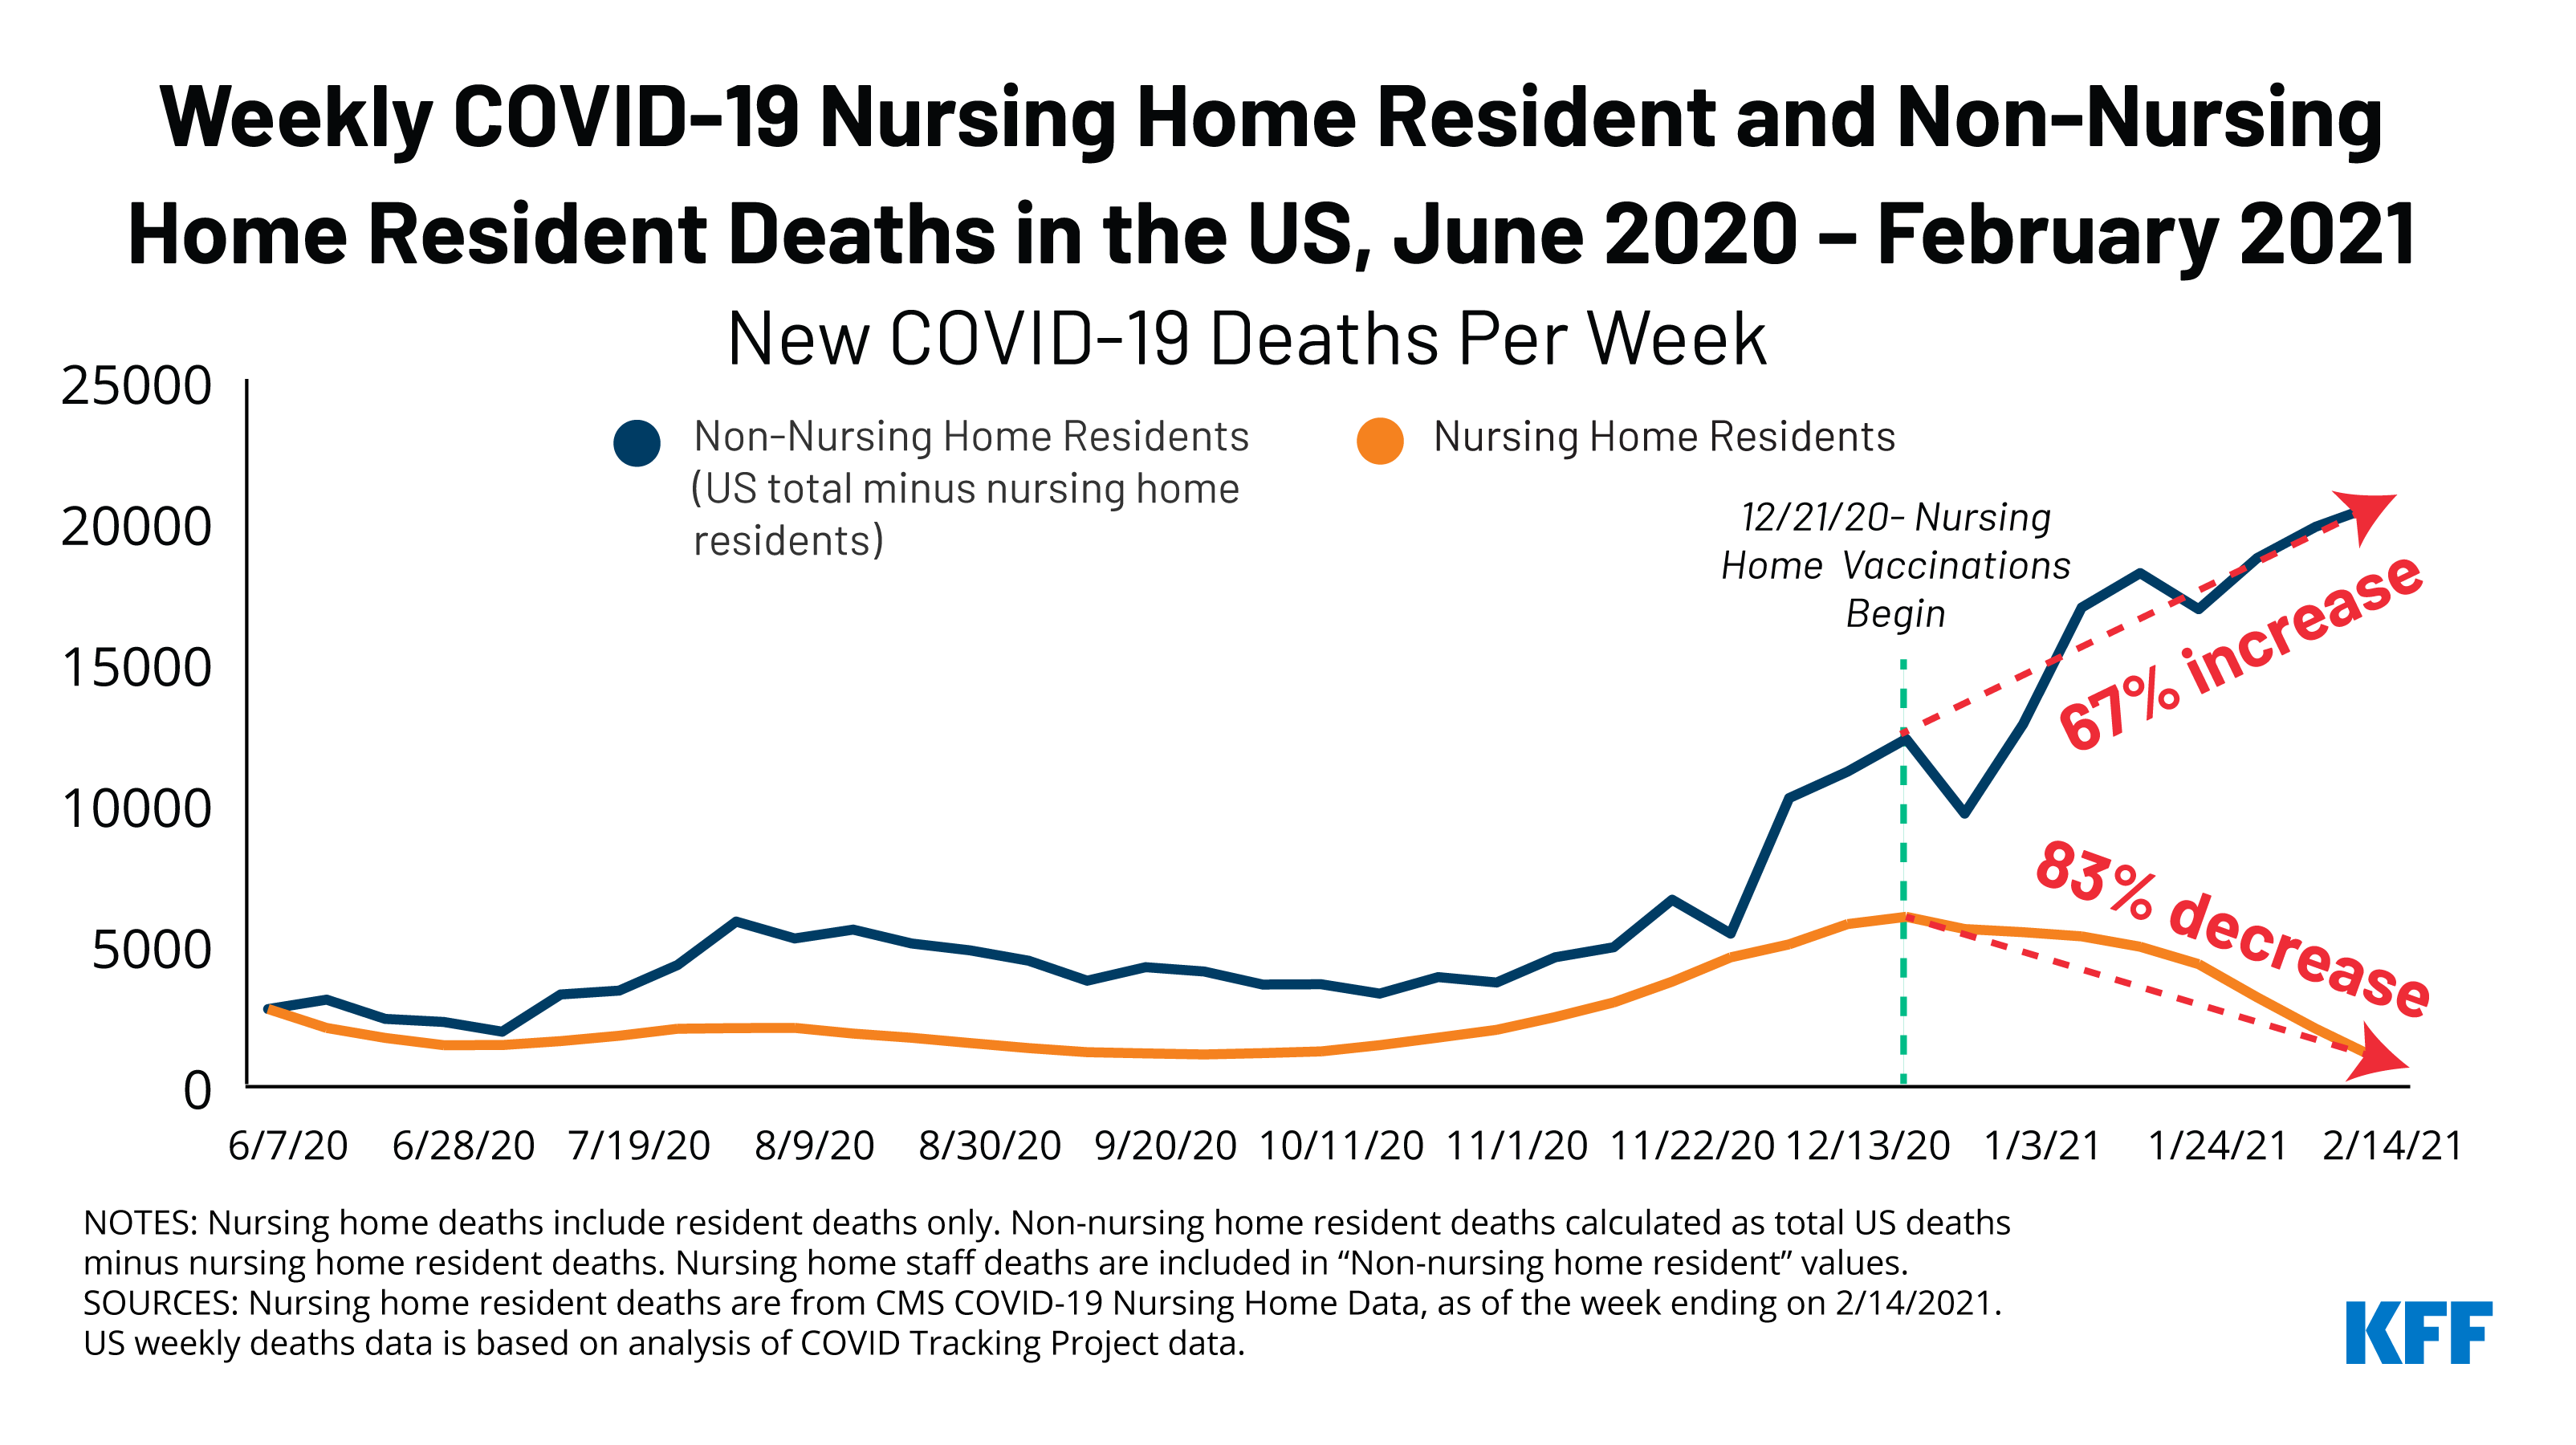
The final months of 2020 were the deadliest months of the pandemic for many residents and staff in long-term care facilities (LTCFs), with over 26,000 COVID-19 deaths in LTCFs reported between Thanksgiving weekend and December 31, 2020. The end of 2020 also saw the approval of the first coronavirus vaccines and the launch of vaccine administrations in LTCFs. As of March 2, 2021, at least 2 million LTCF residents have received one or more dose of the coronavirus vaccine; about 1.3 million LTCF residents have received both doses. Vaccinations have increased outside of LTCFs as well, though at a significantly lower rate.
A new KFF analysis compares trends in new COVID-19 cases and deaths among nursing home residents with trends for all others from June 7, 2020 through February 7, 2021. The findings show a substantial divergence in new cases and deaths per week between nursing home residents and the rest of the US population since December 2020.
As of February 14, 2021 (the most recent data available), weekly new deaths among nursing home residents have decreased by 83% since long-term care vaccination efforts started at the end of December, compared to a 67% increase in new deaths among all others (not nursing home residents) during the same period (Figure 1).
As the analysis explains, while the timing of vaccine initiation in LTCFs and declines in cases and deaths coincide and suggest a link between the two, these trends could also be impacted by other factors.
KFF Tracking Poll: More Than a Third of Americans Say They’ve Struggled to Pay Living Expenses Since December; 6 in 10 Families Hit by COVID Have Lost A Job or Income
As Congress Weighs New $1.9 Trillion COVID-19 Relief Plan, 3 in 4 Across Partisan Lines Say Congress Isn’t Doing Enough to Help People Who Lost Jobs or Income Due to the Pandemic
Majorities Favor Provisions to Expand Marketplace Tax Credits and Encourage States to Expand Medicaid
As Congress considers an additional $1.9 trillion COVID-19 relief plan, more than a third (37%) of Americans say that someone in their household has had trouble paying basic living expenses over the past three months, the latest KFF Health Tracking Poll finds.
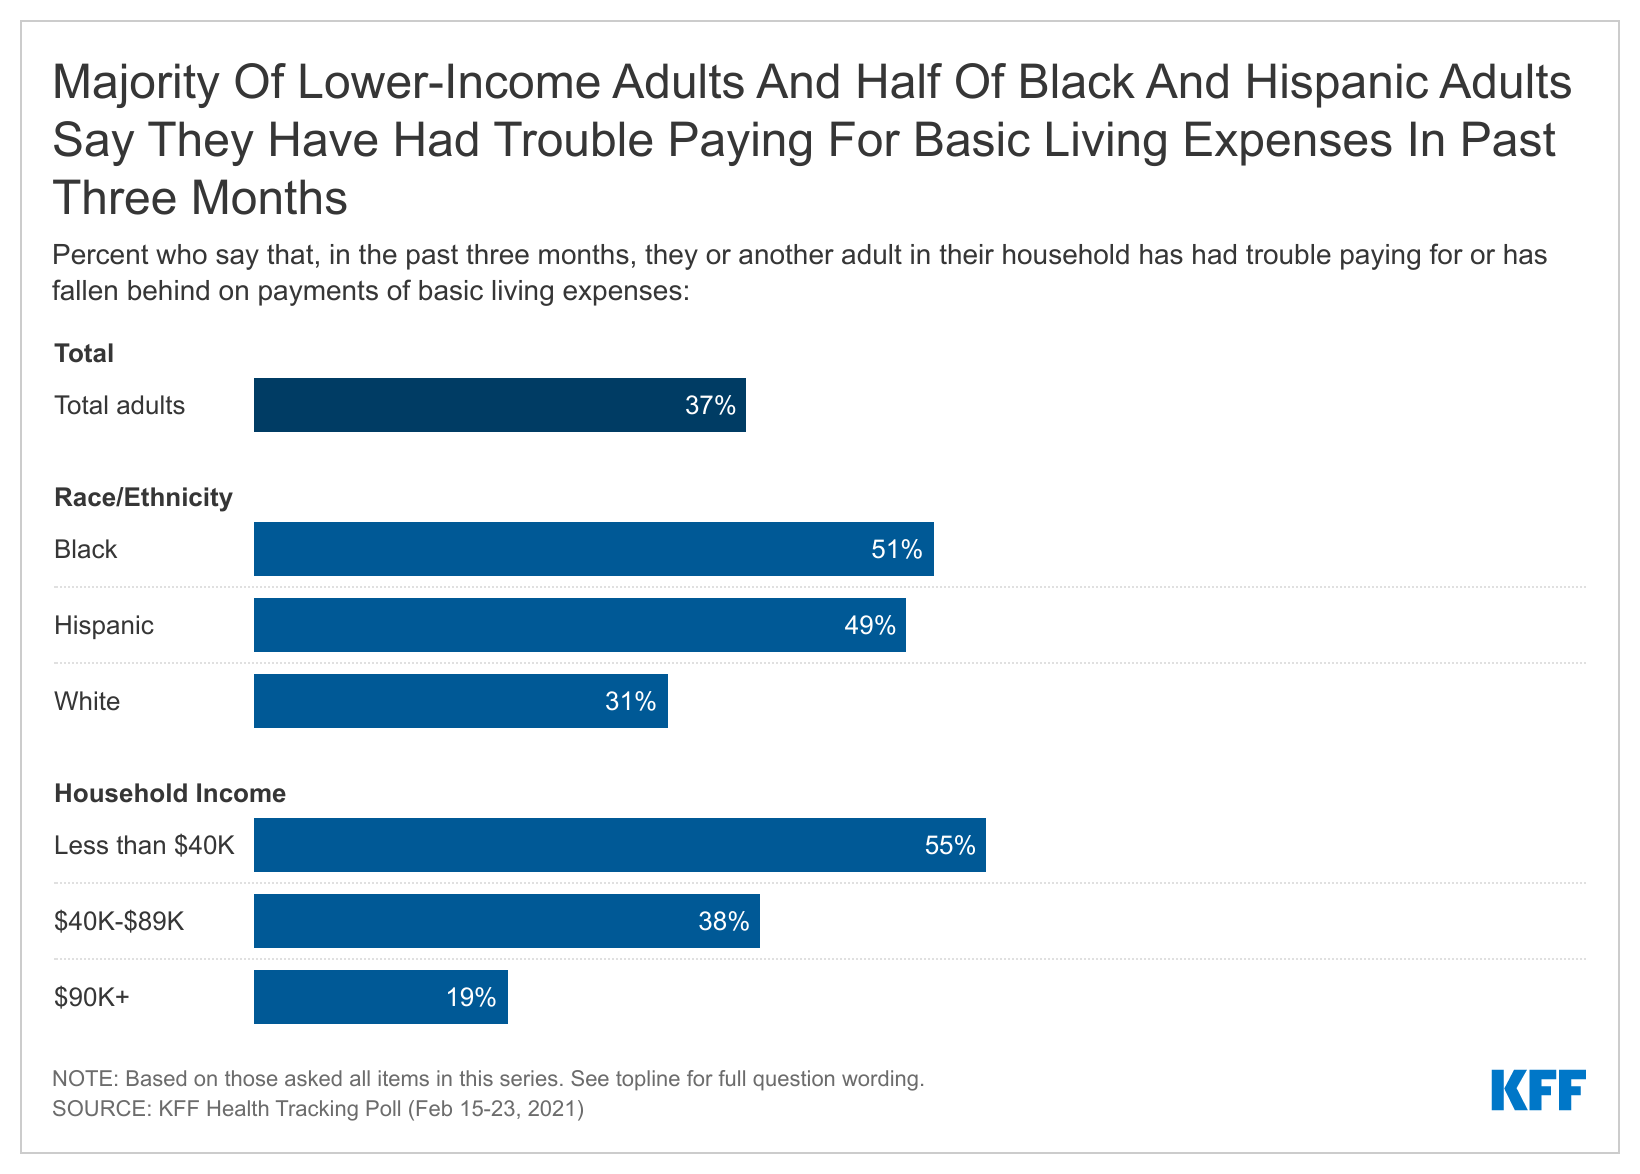
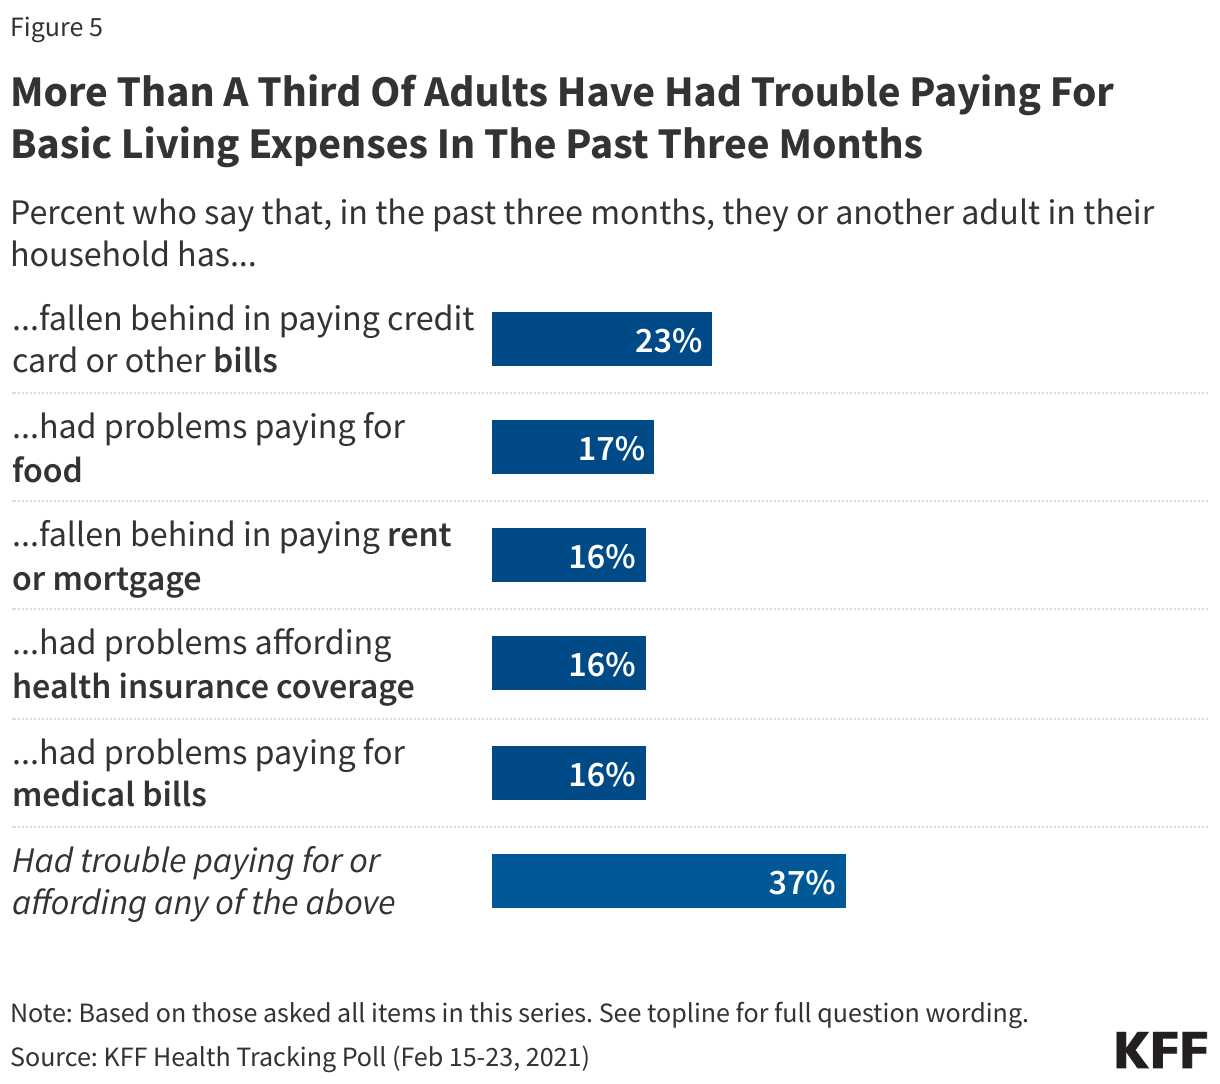
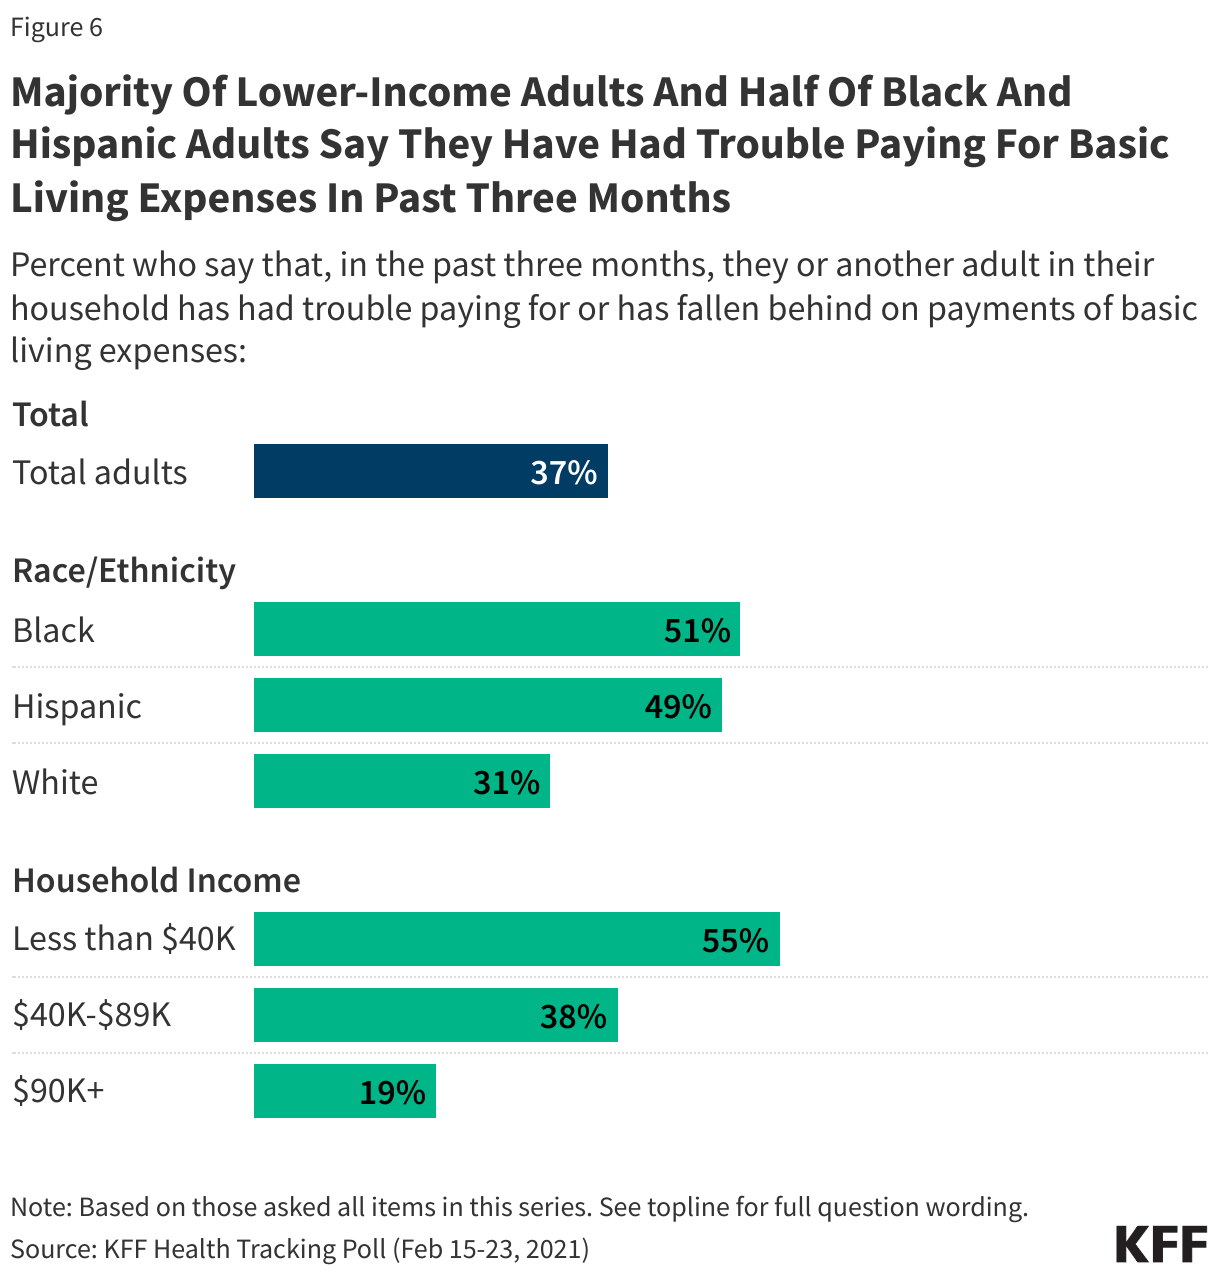
This includes nearly 1 in 4 (23%) who say they have fallen behind on their credit card bills, and 1 in 6 who say they have had trouble paying for food (17%) or who have fallen behind on their rent or mortgage (16%). Similar shares say they have had trouble affording health care including paying medical bills (16%) or affording health insurance coverage (16%). More than half (55%) of households with annual incomes less than $40,000 report recent financial struggles, as do about half of Black (51%) and Hispanic (49%) households.
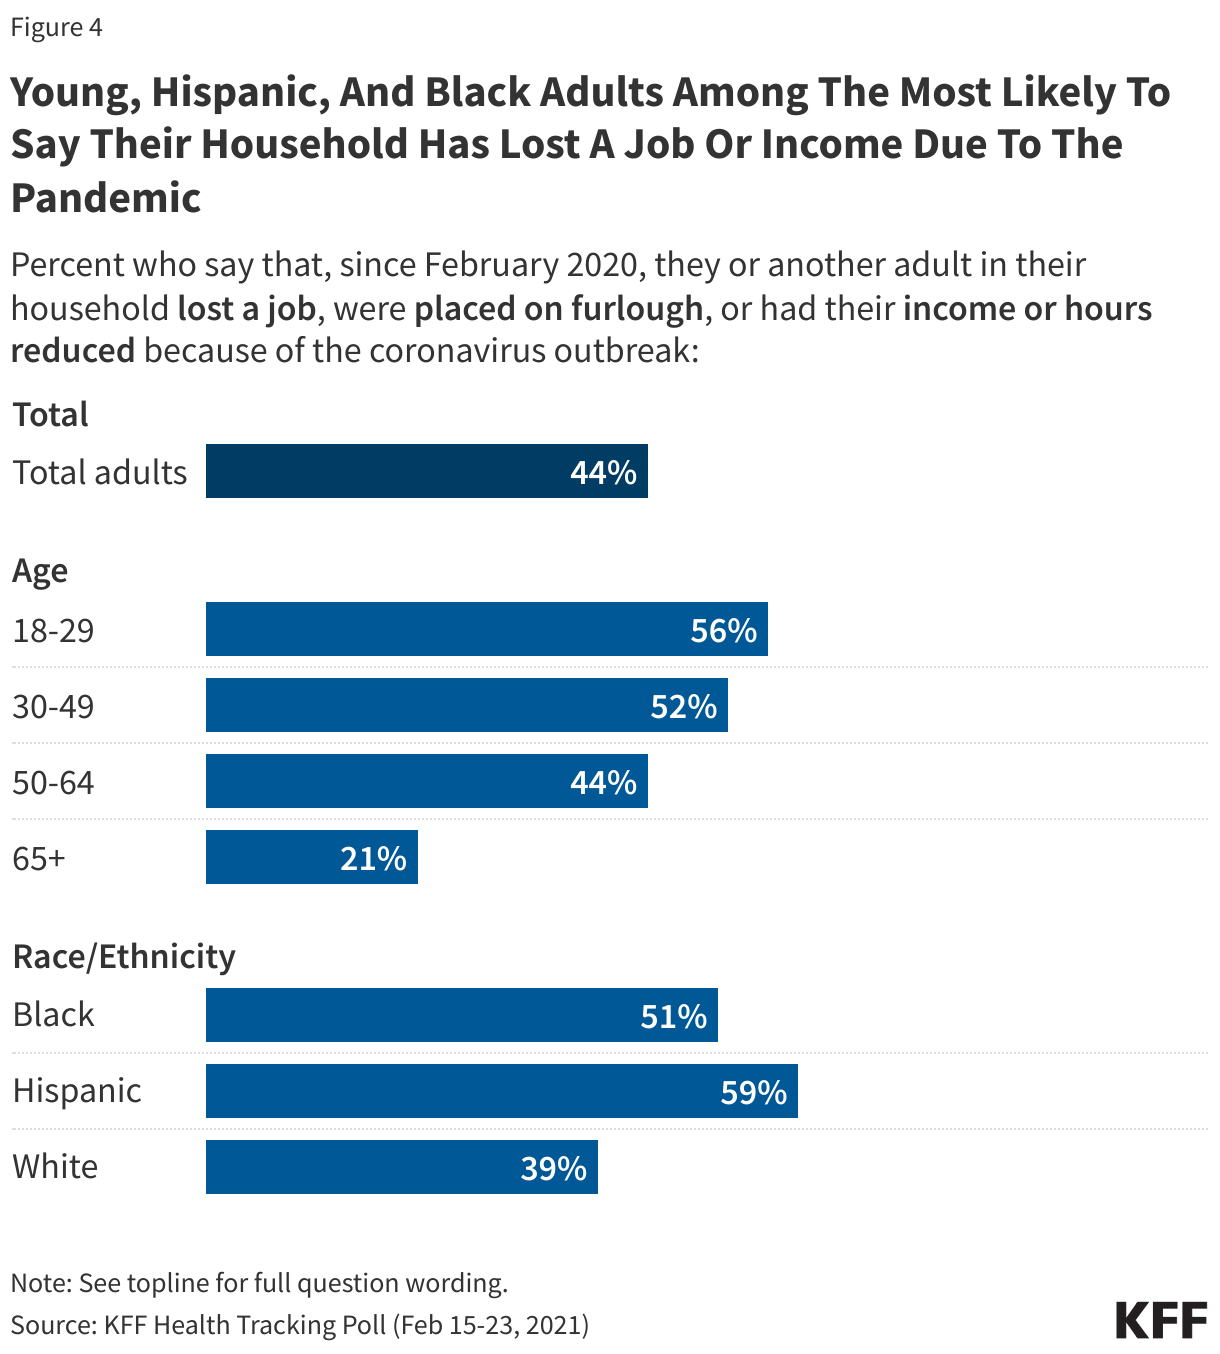
These financial struggles come more than a year into the pandemic and reflect the pandemic’s impact on people’s incomes. Overall, 44% of adults say someone in their household lost a job or income since last February due to the pandemic, including more than half of adults under age 50, and at least half of Black and Hispanic households.
Families directly affected by COVID-19 were especially hard hit, with 61% of households with a COVID-19 diagnosis saying they lost a job or income due to the pandemic, compared to 41% of households in which no one tested positive.
“The COVID pandemic has hit many Americans hard financially, but the impact can be doubly cruel when someone in the family gets COVID and suffers economically at the same time,” KFF CEO Drew Altman said.
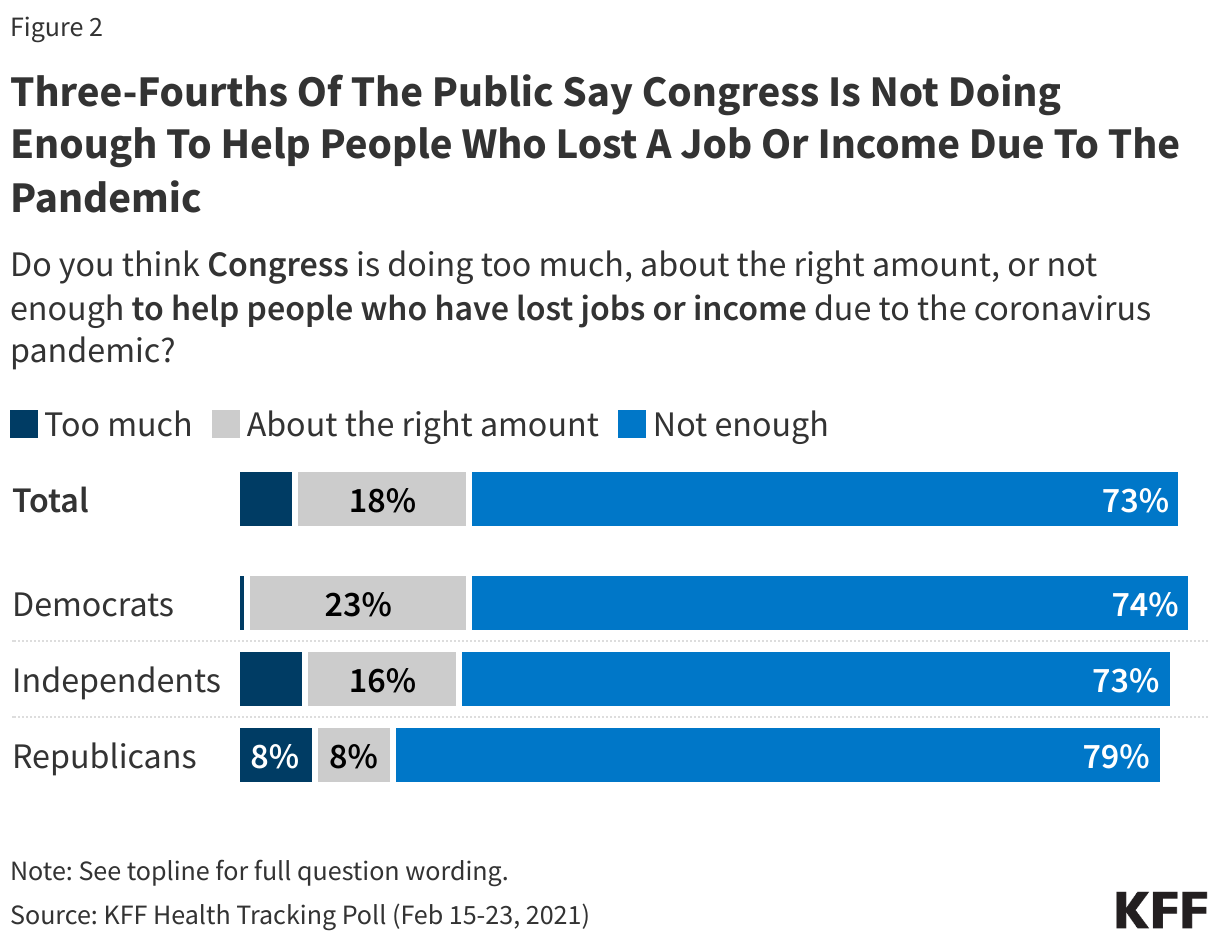
The poll finds broad bipartisan agreement that Congress is not doing enough to help people who lost a job or income due to the pandemic. About three quarters (73%) of the public, including similar shares of Democrats (74%), independents (73%) and Republicans (79%) say Congress isn’t doing enough. Much smaller shares say Congress is doing about the right amount (18%) or doing too much (6%).
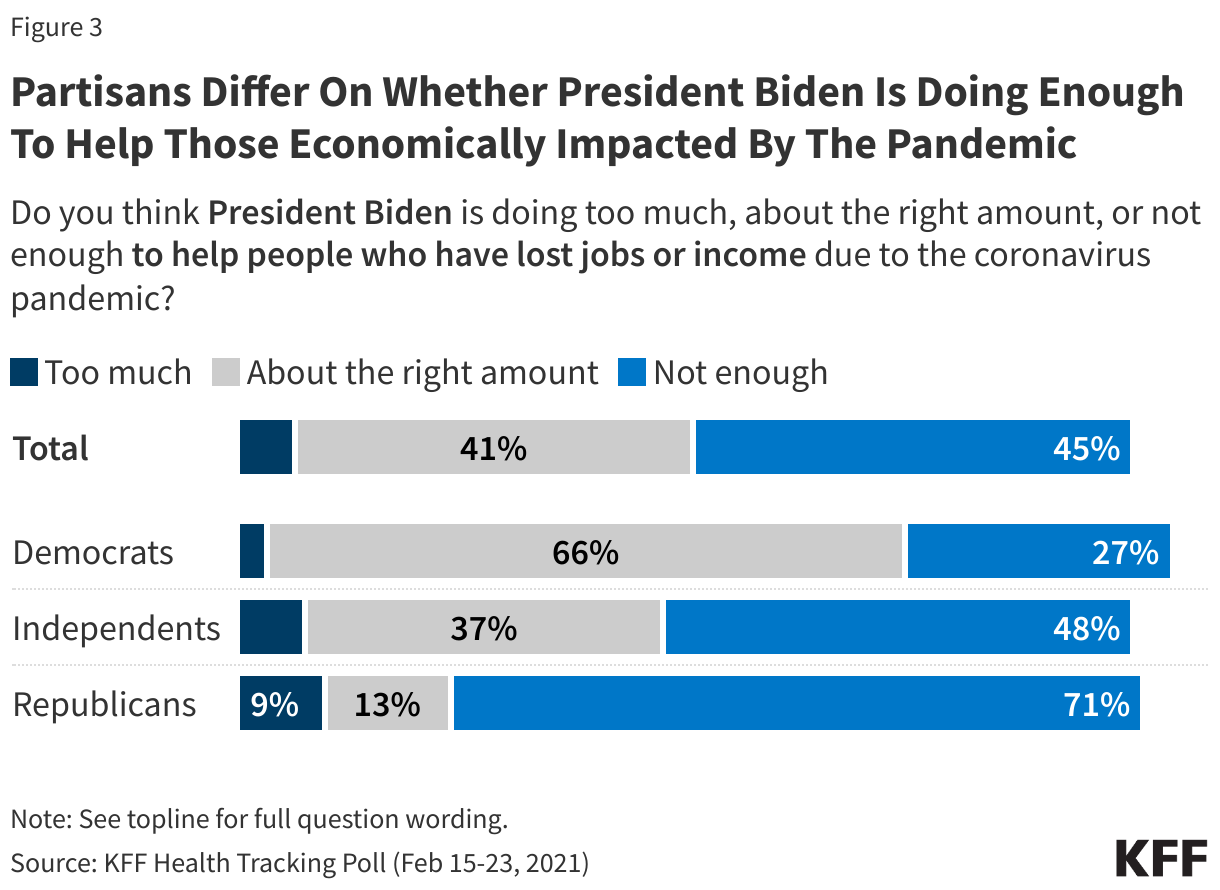
Partisan divisions emerge in their assessment of President Biden’s efforts to help people who lost jobs or income due to the pandemic. Republicans overwhelming say he is not doing enough (71%), while Democrats overwhelming say he is doing the right amount (66%). Independents are more divided, with nearly half (48%) saying not enough and more than a third (37%) saying about the right amount.
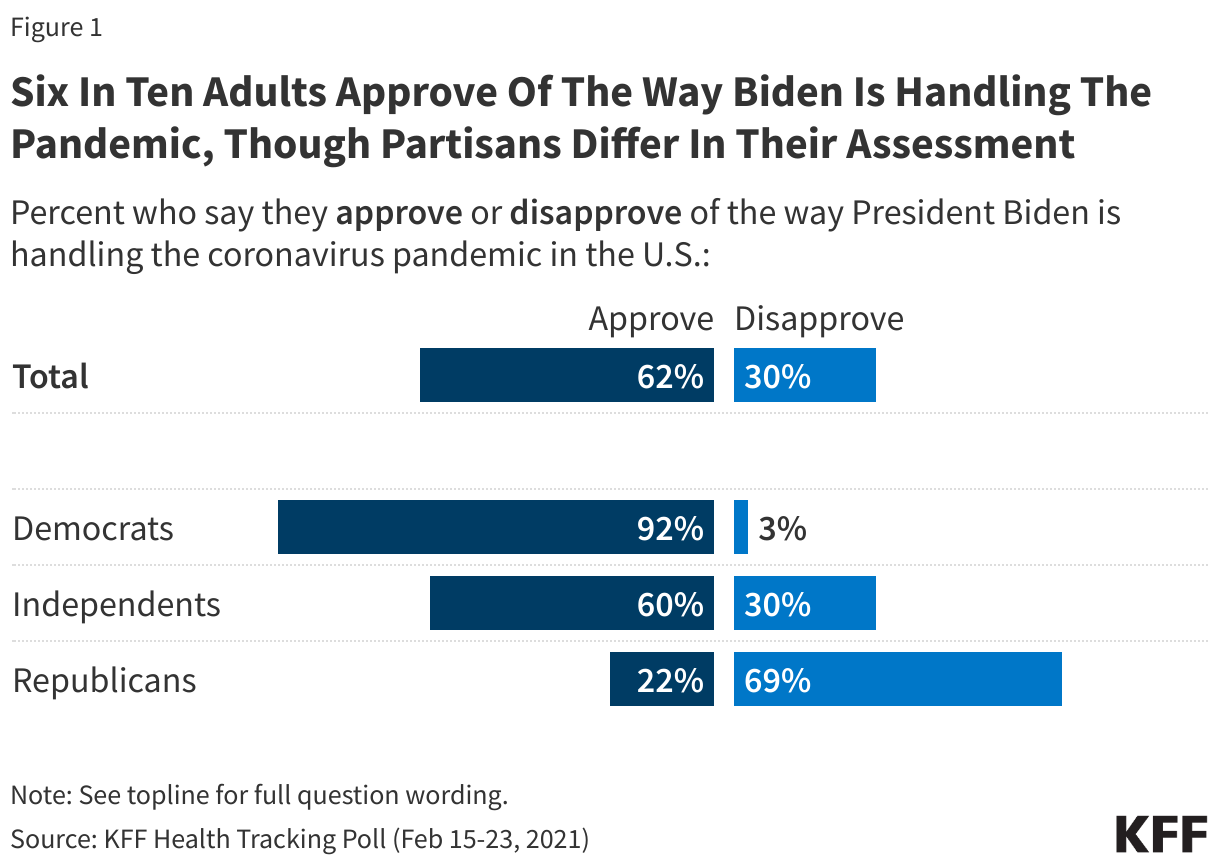
Most (62%) of the public approve of President Biden’s handling of the pandemic, twice the share who disapprove (30%), though with big partisan divisions. Nearly all Democrats (92%) and most independents (60%) approve of President Biden’s pandemic performance, while most Republicans (69%) disapprove.
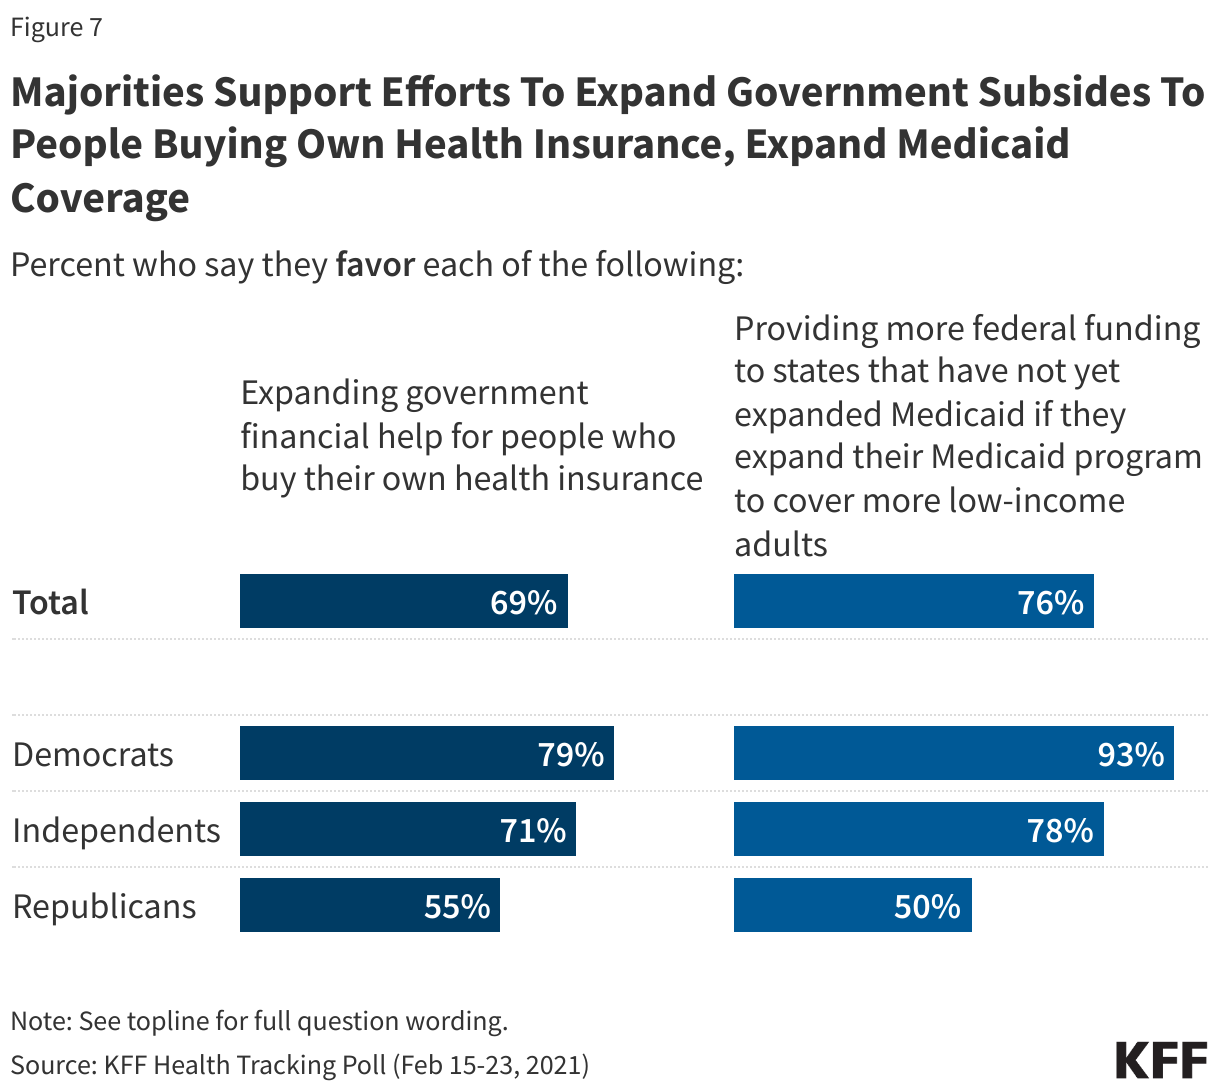
The poll also finds broad support for two provisions in the House COVID-19 bill aimed at making health coverage more affordable by expanding tax credits available to people who buy their own health insurance through the Affordable Care Act’s marketplaces and by providing a financial incentive for states who have not expanded their Medicaid programs to cover more low-income adults to do so.
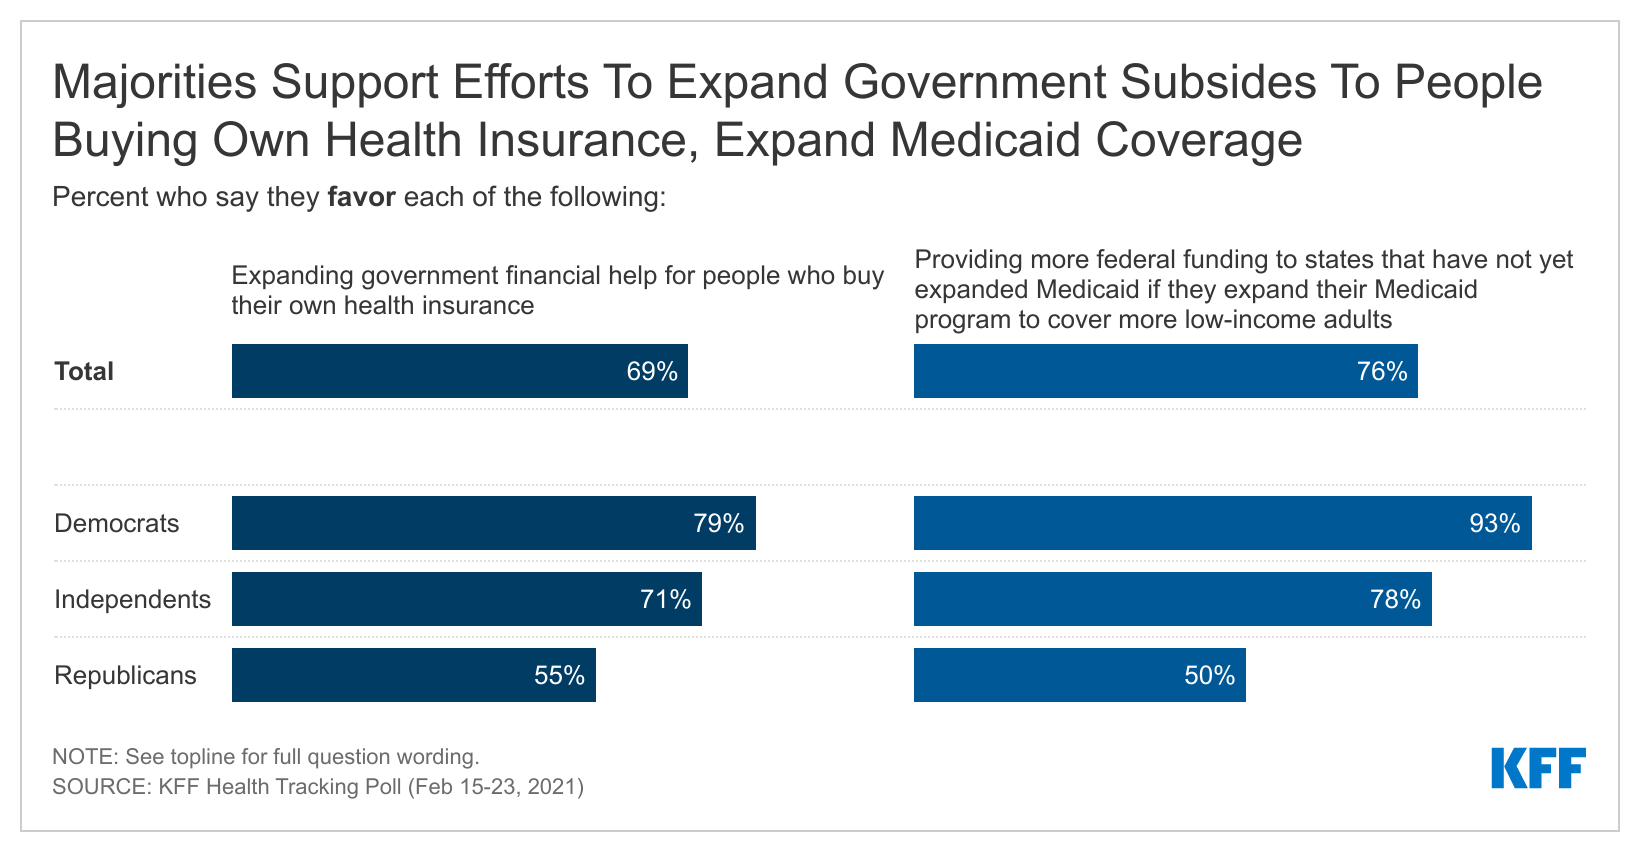
Expanding marketplace subsidies is favored by 69% of the public, including a small majority of Republicans (55%), while providing financial incentives for states to expand Medicaid is favored by three quarters (76%) of the public, including most Democrats (93%), more than three-fourths of independents (78%), and half of Republicans.
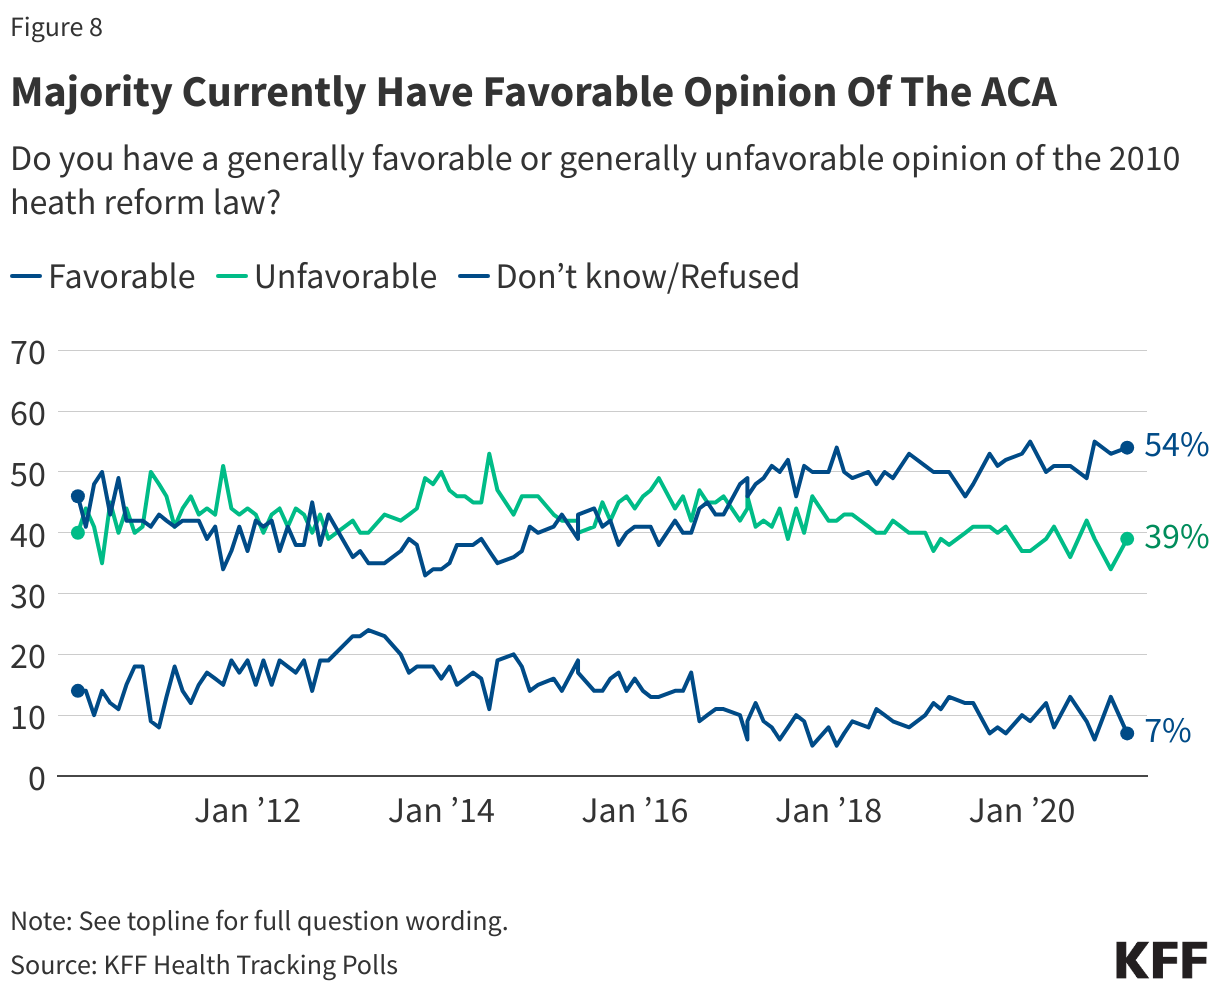
Most people continue to view the Affordable Care Act favorably (54%), while 39% view it unfavorably.
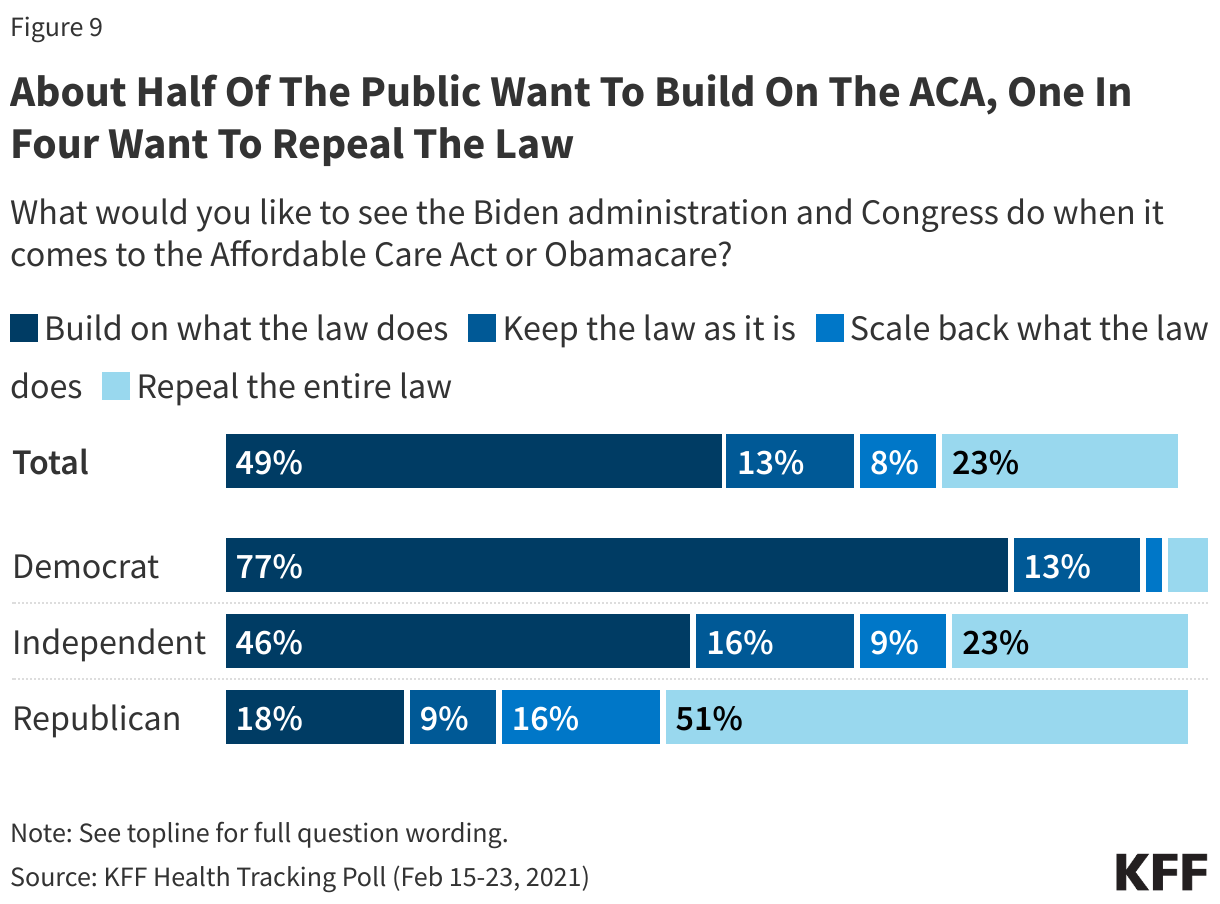
When asked what the Biden administration and Congress should do next about the 2010 law, half (49%) want them to build on what the law does, and another 13% want them to keep the law as is. Fewer want the Biden administration and Congress to scale back the law (8%) or repeal the law altogether (23%).
Partisans differ on these approaches, with three in four Democrats wanting the Biden administration and Congress to build on what the law does (77%), while two-thirds of Republicans want the law to be scaled back (16%) or repealed entirely (51%).
Designed and analyzed by public opinion researchers at KFF, the KFF Health Tracking Poll was conducted from February 15-23 among a nationally representative random digit dial telephone sample of 1,874 adults, including oversamples of adults who are Black (507) or Hispanic (506). Interviews were conducted in English and Spanish by landline (339) and cell phone (1,535). The margin of sampling error is plus or minus 3 percentage points for the full sample. For results based on subgroups, the margin of sampling error may be higher.
After one month in office, a majority of the public (62%) approve of the way President Biden is handling the coronavirus pandemic – including nine in ten Democrats (92%).
The pandemic’s economic effects continue to be felt as 37% of adults say they or another adult in their household have had trouble paying for basic expenses, such as food or housing, in the past three months. A majority of lower-income adults say they have experienced these financial difficulties, as do about half of Black and Hispanic compared to 31% of White adults.
Amidst efforts by the Biden Administration and Democratic Congressional leaders to pass a COVID-19 relief bill by mid-March largely aimed at helping those who have been economically impacted by the pandemic, most of the public (73%) – including more than seven in ten across partisans – say Congress is not doing enough to help people who have lost jobs or income due to the pandemic. President Biden, on the other hand, receives slightly more positive ratings with similar shares saying he is doing the “right amount” (41%) as say he is “not doing enough” (45%). Democrats are more positive in their assessment of President Biden with two-thirds saying he is doing about the right amount, though half of independents and seven in ten Republicans say he is not doing enough.
Most adults, including majorities of Democrats and independents and large shares of Republicans, support provisions included in the COVID-19 relief bill which would expand federal subsidies for people who purchase their own health insurance plans (69%) and which would provide additional federal funding to states that have not yet expanded their Medicaid program if those states expand Medicaid to cover more low-income adults (76%).
The Biden administration recently sent a letter to the Supreme Court, disavowing the Trump administration’s questioning of the constitutionality of the Affordable Care Act and asked the Supreme Court to uphold the law. The latest KFF Heath Tracking poll finds about half of the public (54%) have a favorable view of the ACA while 39% have an unfavorable view of the law. Moreover, half of the public say they want the Biden Administration to build on the ACA while about one in four say they want the law repealed.
Biden Gets High Marks On Handling Of Coronavirus Pandemic
One month into the Biden presidency and amidst the ongoing COVID-19 vaccination rollout, a majority of the public (62%) approve of the way President Biden is handling the coronavirus pandemic in the U.S., while three in ten (30%) disapprove. An overwhelming majority of Democrats (92%) approve of the way President Biden is handling the pandemic, as do six in ten independents. However, among Republicans, nearly seven in ten (69%) disapprove of the way Biden is handling the coronavirus pandemic.
The Biden administration and Democratic congressional leaders are hoping to pass a COVID-19 relief bill by mid-March which would include a number of provisions aimed at helping those who may have been financially affected by the economic impact of the coronavirus pandemic. Most of the public (73%) say Congress is “not doing enough” to help people who have lost jobs or income due to the pandemic. Just 6% of the public say Congress is doing too much to help those who have been financially impacted by the pandemic. There is partisan consensus that Congress is not doing enough to help those who lost a job or income due to the pandemic with majorities of Republicans (79%), Democrats (74%), and independents (74%) saying Congress isn’t doing enough.
Nonetheless, the partisan consensus on the shortcoming of aid to those financially impacted by the pandemic does not extend to the President. Two-thirds of Democrats say President Biden is doing about the right amount to help those who lost a job or income due to the pandemic, while half of independents and seven in ten Republicans say he is not doing enough.
More Than Four In Ten Say Their Household Have Lost A Job Or Income Due To The Pandemic
The economic impact of the coronavirus pandemic continues to be felt by many across the country with more than four in ten adults (44%) saying their household experienced a job or income loss due to the coronavirus outbreak – including a majority of young adults ages 18 to 29 (56%). Across racial and ethnic groups, about six in ten Hispanic adults (59%) and about half of Black adults (51%) say their household lost a job or income, compared to about four in ten White adults (39%) who say the same.
A COVID-19 diagnosis can often have negative economic impact as individuals need to take time off work to quarantine and recover. Indeed, six in ten (61%) of those who say someone in their household tested positive for COVID-19 say their household lost a job or income due to the coronavirus outbreak compared to 41% of those in a household where no one tested positive.
As Congress considers a COVID-19 relief bill which may provide a third round of checks sent directly to the public, 37% of adults say they or another adult in their household has had problems paying or affording household bills, medical bills or some basic expenses in the past three months. This includes about one in four who say they have fallen behind on their credit card or other bills (23%), and about one in six who say they have had trouble paying for food (17%) or have fallen behind on their rent or mortgage (16%). Additionally, a similar share say they have had trouble paying for health insurance coverage (16%) or their medical bills (16%). In July 2020, similar shares said they had fallen behind or had trouble paying these basic living expenses.
Adults with a household income under $40,000 are three times as likely as those with a household income of $90,000 or more to say they have had trouble paying for basic living expenses in the last three months (55% vs. 19%). Larger shares of Black and Hispanic adults report experiencing negative economic impacts with about half saying they have had difficulty paying for basic expenses in the last three months (compared to 31% of White adults).
Congressional Actions To Expand Health Insurance Coverage
A majority of the public, including at least half of Republicans, approve two provisions currently included in the COVID-19 relief bill aimed at expanding health insurance coverage for Americans. About seven in ten adults (69%), including majorities of Democrats (79%), independents (71%) and Republicans (55%) say they support expanding federal subsidies for people who purchase their own health insurance plans. About three in four adults support another provision which would provide additional federal funding to states that have not yet expanded their Medicaid program if those states expand Medicaid to cover more low-income adults. Large majorities of Democrats (93%) and independents (78%) and half of Republicans support this provision. Notably, seven in ten adults (71%) living in states that have not expanded their Medicaid program support the proposal to provide more federal funding to those states if they expand Medicaid to cover more low-income adults.
Most View The ACA Favorably, Half Want To Build On The Law
In November 2020, the Supreme Court heard arguments in the California v. Texas case challenging the constitutionality of the 2010 Affordable Care Act. On February 10, 2021, the Justice Department under the new Biden administration sent a letter to the Supreme Court, in which they changed the position of the federal respondents on the case, disavowing the Trump administration’s questioning of the constitutionality of the law and asked the Supreme Court to uphold the law. The latest KFF Heath Tracking poll finds about half of the public (54%) have a favorable view of the ACA while 39% have an unfavorable view of the law. While a majority of the public view the law favorably, partisans continue to differ in their views with three in four Republicans saying they view law unfavorably while eight in ten Democrats (82%) have a favorable view of the law. Independents are more likely to view the law favorably (54%) than unfavorably (40%).
Building on the ACA has been a focal point of President Biden’s health care agenda and recently, in his confirmation hearing, Health and Human Services secretary nominee Xavier Becerra stated that building on the ACA is his priority. Half of U.S. adults share this view and say they want the Biden administration and Congress to build on what the ACA does (49%). A smaller share want to keep the law as it is (13%) and about three in ten want to either scale back what the law does (8%) or repeal it entirely (23%). Partisans differ on these approaches, with three in four Democrats wanting the Biden administration and Congress to build on what the law does (77%), while two-thirds of Republicans want the law to be scaled back (16%) or repealed entirely (51%).
Methodology
This KFF Health Tracking Poll was designed and analyzed by public opinion researchers at the Kaiser Family Foundation (KFF). The survey was conducted February 15-23, 2021, among a nationally representative random digit dial telephone sample of 1,874 adults ages 18 and older (including interviews from 506 Hispanic adults and 507 non-Hispanic Black adults), living in the United States, including Alaska and Hawaii (note: persons without a telephone could not be included in the random selection process). Phone numbers used for this study were randomly generated from cell phone and landline sampling frames, with an overlapping frame design, and disproportionate stratification aimed at reaching Hispanic and non-Hispanic Black respondents. Stratification was based on incidence of the race/ethnicity subgroups within each frame. Specifically, the cell phone frame was stratified as: (1) High Hispanic: Cell phone numbers associated with rate centers from counties where at least 35% of the population is Hispanic; (2) High Black: Cell phone numbers associated with remaining rate centers from counties where at least 35% of the population is non-Hispanic Black; (3) Else: numbers from all remaining rate centers. The landline frame was stratified as: (1) High Black: landline exchanges associated with Census block groups where at least 35% of the population is Black; (2) Else: all -remaining landline exchanges. The sample also included 190 respondents reached by calling back respondents that had previously completed an interview on the KFF Health Tracking poll at least nine months ago. Another 387 interviews were completed with respondents who had previously completed an interview on the SSRS Omnibus poll (and other RDD polls) and identified as Hispanic (n = 180; including 50 in Spanish) or non-Hispanic Black (n=207). Computer-assisted telephone interviews conducted by landline (339) and cell phone (1,535, including 1,143 who had no landline telephone) were carried out in English and Spanish by SSRS of Glen Mills, PA. To efficiently obtain a sample of lower-income and non-White respondents, the sample also included an oversample of prepaid (pay-as-you-go) telephone numbers (25% of the cell phone sample consisted of prepaid numbers) Both the random digit dial landline and cell phone samples were provided by Marketing Systems Group (MSG). For the landline sample, respondents were selected by asking for the youngest adult male or female currently at home based on a random rotation. If no one of that gender was available, interviewers asked to speak with the youngest adult of the opposite gender. For the cell phone sample, interviews were conducted with the adult who answered the phone. KFF paid for all costs associated with the survey.
The combined landline and cell phone sample was weighted to balance the sample demographics to match estimates for the national population using data from the Census Bureau’s 2019 U.S. American Community Survey (ACS), on sex, age, education, race, Hispanic origin, and region, within race-groups, along with data from the 2010 Census on population density. The sample was also weighted to match current patterns of telephone use using data from the January- June 2020 National Health Interview Survey. The weight takes into account the fact that respondents with both a landline and cell phone have a higher probability of selection in the combined sample and also adjusts for the household size for the landline sample, and design modifications, namely, the oversampling of prepaid cell phones and likelihood of non-response for the re-contacted sample. All statistical tests of significance account for the effect of weighting.
The margin of sampling error including the design effect for the full sample is plus or minus 3 percentage points. Numbers of respondents and margins of sampling error for key subgroups are shown in the table below. For results based on other subgroups, the margin of sampling error may be higher. Sample sizes and margins of sampling error for other subgroups are available by request. Note that sampling error is only one of many potential sources of error in this or any other public opinion poll. Kaiser Family Foundation public opinion and survey research is a charter member of the Transparency Initiative of the American Association for Public Opinion Research.
This work was supported in part by a grant from the Chan Zuckerberg Initiative DAF, an advised fund of Silicon Valley Community Foundation. We value our funders. KFF maintains full editorial control over all of its policy analysis, polling, and journalism activities.
Group
N (unweighted)
M.O.S.E.
Total
1,874
± 3 percentage points
COVID-19 Vaccination Status
Have gotten at least one dose of the COVID-19 vaccine
Many Nonelderly People With Disabilities Face COVID-19 Risks Similar to Those of the Elderly in Nursing Homes, But Do Not Have Equal Footing When it Comes to Vaccine Priority
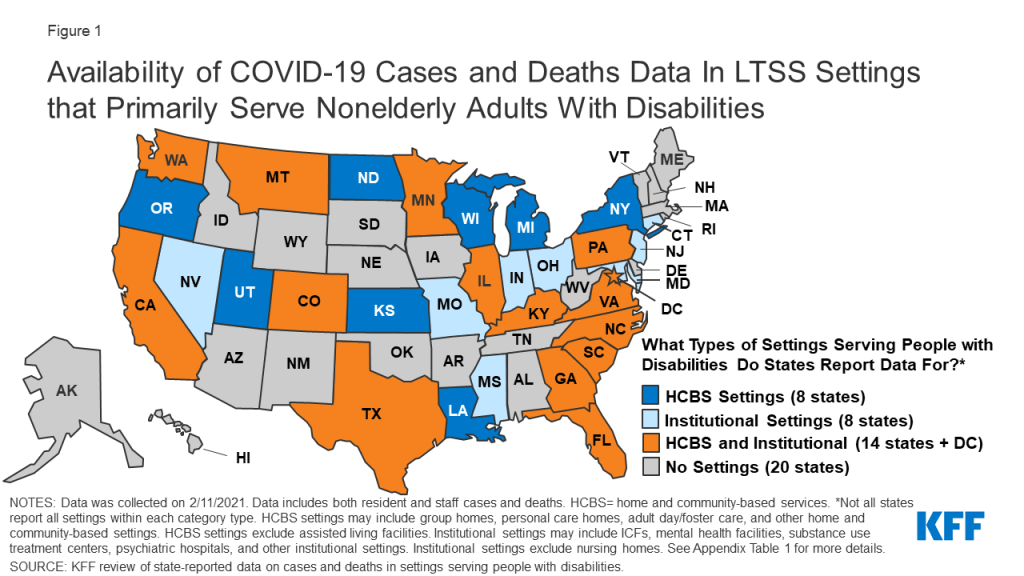
While the toll of COVID-19 on nursing home residents has been well documented, less noticed has been the experience of nonelderly people with disabilities who rely on long-term care services and supports outside of nursing homes. In many ways the two groups face similar health risks from the virus, but nonelderly people with disabilities generally do not have the same high priority status for the vaccine, finds a new KFF analysis.
As of early February there had been 111,000 cases and 6,500 deaths from COVID-19 across 31 states that report data in settings such as group homes, personal care homes, adult day care programs, as well as in institutional settings such as intermediate care facilities and psychiatric institutions, the analysis finds. People served in such settings include adults with autism, Down syndrome, substance use disorder and serious mental illness, as well as traumatic brain injuries. Most of them obtain long-term care services and supports through Medicaid. This analysis excludes settings that primarily serve elderly adults, such as nursing homes and assisted living facilities. The variation in state reporting makes it hard to compare data across states.
The analysis presents state-level data about COVID-19 cases and deaths in settings that primarily serve nonelderly people with disabilities and summarizes available research on this population’s elevated risk of severe illness and death; explains how nonelderly people with disabilities and their long-term care service providers are reflected in state vaccine prioritization plans; and discusses key issues related to vaccine access for these populations.
For more data and analyses related to the COVID-19 pandemic, visit kff.org.
Analysis: Spending on Health Care Would Drop by an Estimated $352 Billion in 2021 if Private Insurance Used Medicare Rates to Reimburse Hospitals and Other Health Care Providers
Findings Illustrate the Potential Magnitude of Savings from Policies to Rein in Health Care Prices
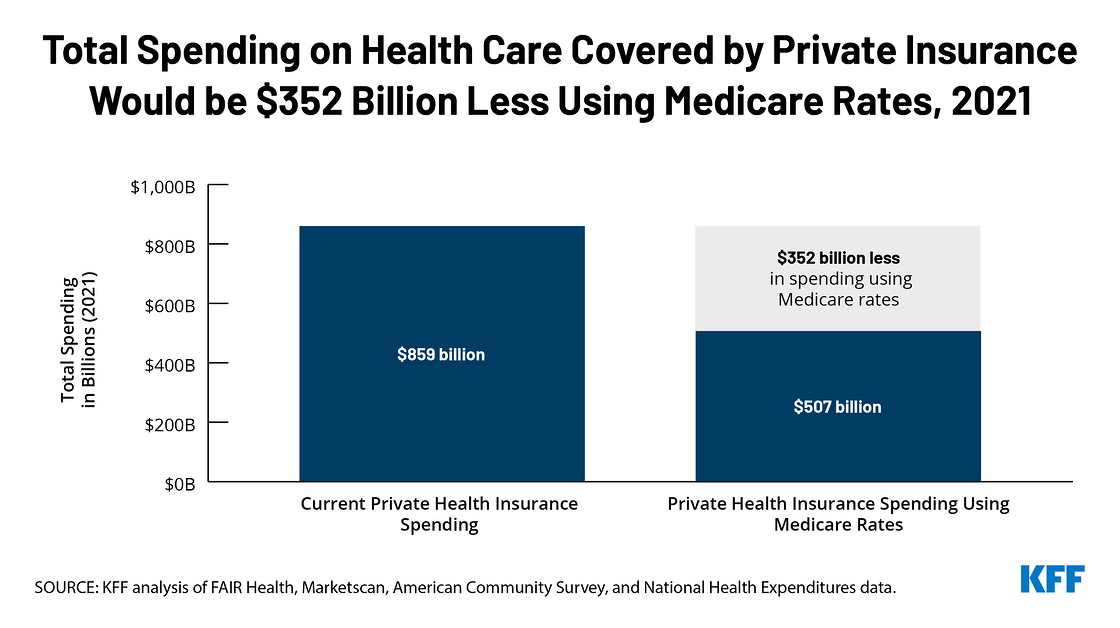
Total health care spending for people with private health insurance would be an estimated $352 billion lower in 2021 if private insurers used Medicare rates to pay hospitals and other health care providers, rather than the substantially higher rates they currently pay, a new KFF analysis finds.
That would represent a 41 percent decrease from the $859 billion in projected health care spending for people with private insurance this year. The resulting savings would be spread among employers ($194 billion) and employees ($116 billion), and the non-group market ($42 billion), assuming proportional savings throughout the private insurance market.
Among other key findings:
Nearly half (45%) of the total reduction in spending would be for outpatient hospital services, where the price gap between private insurance and Medicare is relatively large, 27 percent for inpatient services and 14 percent for physician office visits.
About a third of the reduction would come from lower health care spending for privately insured adults ages 55-64 who tend to use more health care services than younger Americans.
On average, health care spending per person with private insurance would be an estimated $2,096 less for adults ages 19-64 and $1,033 less per child if Medicare rates were used.
Over the years, federal and state lawmakers have proposed using Medicare rates to rein in health care prices. The new KFF analysis does not examine a particular health reform plan and is not intended to be a forecast, prediction or an endorsement of the policy. Instead, it illustrates how lower payment rates could reduce health spending. Those payment changes could be implemented through a variety of proposals such as Medicare for all, a public option, lowering the age of Medicare eligibility, or all-payer rate-setting. Policies that resulted in private insurance payment rates that were a multiple of Medicare would result in proportionally fewer savings.
The KFF authors note that proposals to limit private insurance reimbursement to Medicare rates could lead to substantial reduction in health care spending, but would undoubtedly be met with fierce opposition from health care providers, since the decrease in spending would translate into a significant drop in their revenues. The analysis does not estimate the likely effects of a change in service utilization (supply or demand) on spending. It also does not estimate the indirect effects on government revenues or spending, or decreases in health-related tax subsidies for employers or individuals that that would offset savings.
For the full analysis, as well as other data and analyses related to health spending and health reform proposals, visit kff.org.
The COVID-19 pandemic has taken a heavy toll on people in nursing homes, with those in long-term care facilities accounting for a disproportionate share of all deaths attributable to COVID-19 to date. However, less attention has been paid to nonelderly people with disabilities who use long-term services and supports (LTSS) but live outside of nursing homes. This population includes people with a range of disabilities, such as people with autism or Down’s syndrome who live in group homes, people with physical disabilities who receive personal care services at home, and people who are receiving behavioral health treatment in residential facilities. Some nonelderly people with disabilities receive LTSS in a variety of community-based settings such as group homes, adult day health programs, and/or their own homes. Other nonelderly people with disabilities receive LTSS in institutional settings such as intermediate care facilities for people with intellectual or developmental disabilities (ICF/IDDs) or behavioral health treatment centers for people with mental illness or substance use disorder. Many nonelderly people with disabilities, both in the community and in institutions, rely on Medicaid as the primary payer for the LTSS on which they depend for meeting daily self-care needs.
Nonelderly people with disabilities and the direct care workers who provide their LTSS have similar risk factors for serious illness or death from COVID-19 compared to their counterparts in nursing homes, due to the close contact required to provide assistance with daily personal care tasks, such as eating, dressing, and bathing; the congregate nature of many of these settings; and the highly transmissible nature of the coronavirus. Seniors in nursing homes are explicitly included in the top priority group in all states’ COVID-19 vaccine distribution plans, but nonelderly people with disabilities who use LTSS may be not prioritized. This issue brief presents current state-level data about COVID-19 cases and deaths in settings that primarily serve nonelderly people with disabilities and summarizes available research on this population’s elevated risk of severe illness and death; explains how nonelderly people with disabilities and their LTSS providers are reflected in state vaccine prioritization plans; and discusses key issues related to vaccine access for these populations.
What is known about COVID-19 among people with disabilities?
As of February 11, 2021, 31 states report at least some data on COVID-19 cases and deaths in LTSS settings that primarily serve nonelderly people with disabilities (Figure 1 and Appendix Table 1). These settings include both home and community-based settings such as group homes, personal care homes, adult day programs, and other community-based settings; and institutional settings such as intermediate care facilities and psychiatric institutions. Not all states report all types of settings within each category. These data exclude settings that primarily serve elderly adults, such as nursing facilities and assisted living facilities (ALFs), to best reflect cases and deaths solely among nonelderly adults with disabilities. For state-level data broken out by resident/staff cases/deaths, details on the types of facilities included in each state’s count, dates of data, links to the state reports, and additional notes, see Appendix Table 1.
Figure 1: Availability of COVID-19 Cases and Deaths Data In LTSS Settings that Primarily Serve Nonelderly Adults With Disabilities
The wide variety in state reporting makes it difficult to compare between states or have a complete understanding of how people with disabilities have been impacted by the pandemic. Among states reporting data, there were 111,000 cases and over 6,500 deaths across these settings as of February 11, 2021 (Figure 1). Of the 31 states reporting data, 8 states report data only for institutional settings, 8 states report data only for home and community-based settings, and 15 states report data for both settings. Thirty-one states report cases and 25 states report deaths. States also vary in whether they report only data on residents and staff separately or combined (Appendix Table 1). State reporting also varies in other ways, such as inclusion of only active cases (e.g., MA, UT), inclusion of data within broader long-term care reporting (e.g., ID, MD, MS, OK, GA, KY, LA, NC, ND), and level of detail in facility-level information. Additionally, states use different definitions or categorizations for the same types of facilities, making cross-state comparison challenging.
Data from a limited number of states suggest that LTSS residents in institutions other than nursing and assisted living facilities, as well as those in some community-based settings, face an elevated risk of COVID-19 infection (Table 1). Overall, limited data on the number of people in HCBS and institutional settings other than nursing and assisted living facilities makes calculating case or death rates difficult. However, eight states (CT, IL, NJ, OR, PA, WA, WI, TX) provide resident census data to calculate the shares of residents that have been impacted in certain settings. Among the states that provide census data on institutional settings, cumulative data show that between 19% (Connecticut’s mental health facilities) and 50% (Pennsylvania’s state centers for individuals with intellectual disabilities) of residents were infected. These rates are on par with the share of residents infected in nursing homes, which, using 2019 resident census data and resident case counts as of the end of January 2021, is about 50%. These rates are also higher than population level rates, which show more than 8% of the US population infected as of mid-February 2021. For states that provide census data on home or community-based settings, between 2% (Oregon’s Adults with Intellectual or Developmental Disabilities Foster Care HCBS waiver) and 19% (Illinois’ Community Integrated Living Arrangements group homes) of residents were infected. Given the limited sample size and wide state variation, this data should be interpreted with caution. However, this data supports other research suggesting that congregate settings, particularly larger facilities, are at high risk of having an outbreak.
Table 1: Share of Residents Who Were Infected with Coronavirus in Selected State Settings
Residents Coronavirus Cases
Resident Census
Share of Residents Infected With Coronavirus
Home and Community-Based Settings
Illinois Community Integrated Living Arrangements
1,859
9,992
19%
Oregon ODDS Services – Adult DD Foster Care
66
2,928
2%
Oregon ODDS Services – Adult DD Group Homes
155
3,022
5%
Washington DDA Community Residential Service Providers
668
4,500
15%
Wisconsin HCBS Waiver: IRIS
1,381
22,332
6%
Wisconsin HCBS Waiver: Managed Long-Term Care
8,155
55,009
15%
Institutional Settings
Connecticut DMHAS Facilities
142
760
19%
New Jersey State Psychiatric Facilities
332
1,151
29%
Pennsylvania State Centers
321
640
50%
Pennsylvania State Hospitals
560
1,348
42%
Texas State Supported Living Centers
1,302
2,777
47%
Texas State Hospitals
715
1,678
43%
NOTES: Data are “as of” various dates; data was collected on 2/11/2021. These settings were selected based on states that specified a resident census count upon which certain case counts were based. Resident census counts in each setting reflect multiple facilities/residences. See Appendix Table 1 for links to state reports.SOURCE: KFF analysis of state-reported data on cases and deaths in settings serving people with disabilities.
Other research shows that nonelderly people with disabilities who receive LTSS in settings other than nursing homes face similar COVID-19 risk factors compared to people in nursing homes. Like those in nursing homes, people with disabilities rely on the close physical proximity of caregivers for communication and daily needs, which limits their ability to adopt preventive measures such as social distancing. An October 2020 study found that people with I/DD living in group homes in New York are at greater risk of contracting and dying from COVID-19 compared to the general population. Another study from July 2020 found greater risk for contracting COVID-19 among people with I/DD, and a greater case fatality rate for nonelderly adults with I/DD, compared to those without I/DD. A November 2020 analysis of private insurance claims found that people with “developmental disorders” (such as speech/language, scholastic skills, and central auditory processing disorders) had the highest odds of dying from COVID-19 and those with intellectual disabilities (such as Down’s syndrome) had the third highest risk of death from COVID-19.
Research also suggests that people with disabilities who are members of racial or ethnic minority groups are disparately affected by COVID-19. A January 2021 study found that counties with higher rates of COVID-19 were home to disproportionately higher shares of people with I/DD who are Black, Asian, Hispanic or Native American; below poverty; young; and female. A January 2021 House Ways & Means Committee Majority Staff report noted that Black working people with disabilities are more likely to have experienced job loss during pandemic, compared to other racial or ethnic groups.
In addition to increased risk from COVID-19, people with disabilities who rely on LTSS to meet daily needs also risk experiencing adverse health outcomes due to interruptions in care caused by the pandemic. An HHS report on direct service providers found that workforce shortages have been exacerbated during the pandemic, increasing the risk of adverse health outcomes among people with disabilities due to lack of care. A MACPAC report on people with I/DD noted that some people with disabilities have suspended in-home services during the pandemic and some workers have declined to enter client homes due to health and safety concerns, including challenges with accessing personal protective equipment. People with disabilities also have faced discriminatory access to care and care rationing based on disability during the pandemic, which has been the subject of HHS Office for Civil Rights guidance and several case settlements.
Direct care workers who provide LTSS to people with disabilities outside of nursing homes also face increased risks from COVID-19, similar to their nursing home counterparts. For example, a House Oversight Committee survey in August 2020 found that behavioral health treatment facility staff are more likely to have contracted COVID-19 compared to the general population. In addition, 24% of family caregivers for people with I/DD are over age 60 and therefore at higher risk of complications and death themselves from COVID-19.
How are people with disabilities reflected in state vaccine prioritization plans?
State vaccine prioritization plans explicitly include people in nursing homes and seniors in general, consistent with the Centers for Disease Control and Prevention (CDC) Advisory Committee on Immunization Practices (ACIP) recommendations. In December 2020, ACIP recommended that health care personnel and long-term care facility residents be placed in the top priority group (Phase 1a) for COVID-19 vaccine distribution. The ACIP recommendations define long-term care facilities as nursing homes, skilled nursing facilities, and assisted living facilities. Other ACIP guidance notes that states may choose to include people who reside in congregate living facilities, such as group homes, in the same priority group as frontline facility staff, due to “their shared increased risk of disease.” States have discretion about which groups to prioritize in their vaccine distribution plans. State vaccination plans and priority groups are continuing to evolve in response to changes in federal guidance as well as other considerations such as vaccine availability. State plans also vary widely in their comprehensiveness and transparency, with some offering more detail on priority populations than others.
Few state vaccination plans explicitly mention people with disabilities (other than people with “high risk medical conditions”). Prioritizing certain high risk medical conditions may include some but not all people with disabilities. In addition, the high risk medical conditions group does not always include or account for the increased risk to nonelderly people with disabilities who receive direct care services and/or live in congregate settings outside nursing homes. A few states do specifically prioritize people with disabilities in their vaccination plans. For example, Tennessee includes people ages 18-74 who are unable to live independently and Oregon includes people with disabilities who receive services in their homes in Phase 1a, the same priority level as people in nursing homes. Maryland and Ohio include people with developmental disabilities in Phase 1b, Illinois includes people with disabilities in Phase 1b, and Nevada and Washington include people with disabilities in Phase 1c (limited to those with disabilities that prevent their adopting of protective measures in Washington). California recently clarified that as of March 15, 2021, health care providers can use their clinical judgment to prioritize people with a developmental or “other severe high-risk disability” who, if infected with COVID-19, are likely to develop severe life-threatening illness or death, will have limited ability to receive ongoing care or services vital to well-being and survival, or will face challenges in adequate and timely COVID-19 care due to their disability.
While all state vaccination plans include people in nursing homes in Phase 1a, and most include ALFs, few mention other LTSS settings, and those that do typically do not place other LTSS settings at the same priority level as nursing homes. Three states (DC, NJ, OH) include psychiatric hospitals in Phase 1a. Nine states include group homes in Phase 1b (AK, AL, DC, MD, NM, ND, SD, WA) or 1c (DE for those with high risk conditions). Two states (WI, WY) include people receiving services under certain Medicaid HCBS waivers in Phase 1b. A few states include other LTSS settings in Phase 1b: behavioral health treatment centers (IA, ND, NM), ICF/IDDs (DC, NH), and people receiving LTSS at home (IA, PA). Other state plans generally mention congregate settings (in Phase 1b or 1c) without further details so it is unclear whether LTSS settings are included.
Few state vaccination plans explicitly mention direct care workers who provide LTSS in settings other than nursing homes. Staff at congregate settings typically are included in the same phase or earlier than residents. Some states specify staff in different LTSS settings in Phase 1a, but it is not always clear from state plans that all LTSS workers are included in the “health care workers” category. For example, some family caregivers and others who provide self-directed HCBS are recognized as Medicaid HCBS providers for purposes of reimbursement but may not work through a provider agency or be recognized as having the same licensing as providers in LTSS facilities.
What other policy issues will affect access to vaccines for people with disabilities?
People with disabilities who receive services in the community or in non-nursing facility institutions may face accessibility barriers at vaccine distribution sites. In many cases, people with disabilities will need to travel to a distribution site to receive their vaccines. For example, to date, the federal government’s Long-Term Care Pharmacy Partnership program has been limited to facilities where the majority of residents are age 65 or older, and has not included congregate settings that primarily serve nonelderly people with disabilities, such as those with I/DD or behavioral health needs. The Biden Administration’s National Strategy for COVID-19 Response and Pandemic Preparedness supports expanding this program to other congregate settings, including those that serve people with I/DD. The accessibility of community-based vaccine distribution sites also could affect the ability of people with disabilities to receive vaccines. These considerations include factors such as whether sites are physically accessible for people with mobility impairments and whether reliable public or other transportation is available to get people to the site. Vaccine distribution efforts could consider partnering with state Medicaid agencies to leverage Medicaid’s non-emergency medical transportation (NEMT) benefit. Medicaid benefit provides transportation to and from healthcare providers and could be used to facilitate access to community-based vaccine distribution sites for enrollees, including those with disabilities. Transportation to receive vaccines may be especially important due to the temperature and storage requirements that may create challenges for administering the currently approved vaccines in people’s homes.
People with disabilities and their direct care providers may benefit from focused messaging as part of general vaccine outreach and public education efforts. Outreach efforts targeted to people with disabilities could be part of broader public education strategies related to vaccine distribution. Making information available in plain language and in accessible formats (such as for people with vision, hearing, or cognitive disabilities) can help ensure that it is useful to people with disabilities. Accessible information about where and when to access the vaccine will be important, especially as state prioritization plans continue to evolve, and many people with disabilities are eager to receive the vaccine given their increased risk. Public outreach campaigns also may consider how to address concerns about the COVID-19 vaccine that stem from health care discrimination experienced by people with disabilities by offering opportunities for two-way dialogue to discuss questions and concerns and build trust. Historically, many people with disabilities have experienced discrimination by being segregated in institutions and subject to involuntary sterilization. People with disabilities continue to experience barriers to needed healthcare services, due to inaccessible buildings or medical equipment (such as examination tables, radiology machines, and scales) or ineffective communication (such as lack of sign language interpreters during medical appointments). In addition, during the COVID-19 pandemic, policies to ration access to treatment, such as ventilators, have been successfully challenged as discriminating against people with disabilities. Public health departments and others involved in outreach efforts could partner with state Medicaid agencies to reach vulnerable populations, such as people with disabilities and their health care providers. Many people with disabilities receive Medicaid, and state Medicaid programs already may have established relationships with community-based health care and LTSS providers who may be trusted sources of information for enrollees.
Finally, policymakers may want to consider people with disabilities in data collection efforts to help inform and refine current vaccine distribution and access efforts and identify disparities such as those based on race or ethnicity. The Biden Administration’s National Strategy acknowledges that gaps in data exist and endorses improved COVID-19 data collection and public health guidance specific to high risk populations, including people with disabilities and those who are members of racial/ethnic minority groups.
Looking ahead more broadly in pandemic response efforts, provisions in the House Energy and Commerce Committee’s COVID-19 relief bill recognize the similar risks posed to residents and direct care workers in nursing homes and congregate community-based settings. The bill would provide $1.8 billion for COVID-19 testing, contact tracing, and mitigation activities in congregate settings, including shared living arrangements for people with disabilities as well as institutional settings such as long-term care facilities, psychiatric hospitals, psychiatric residential treatment facilities, intermediate care facilities, and other residential care facilities. In addition, the bill would allow states to use temporary enhanced federal matching funds for Medicaid home and community-based services to help seniors and people with disabilities in both nursing homes and congregate community settings relocate to their own homes in the community. The COVID-19 pandemic’s disproportionate impact on people who live and work in both institutional and community-based congregate settings has renewed interest among policymakers, seniors, people with disabilities, direct care workers, caregivers, and others in Medicaid’s role in providing services and supports for independent community living.
Appendix
Appendix Table 1: State-Reported Data On COVID-19 Cases and Deaths In Settings Serving People With Disabilities,as of February 11th, 2021
Supported living, state operated living alternatives, group homes/group training homes, companion homes, ICFs, and licensed staffed residential programs
HCBS Waiver Program – home-based care, adult family homes, community based residential facilities, residential care apartment complexes, group residential
8,074
1,036
9-Feb
NOTES: Data was collected on 2/11/2021. “Resident and/or staff” counts indicate counts where state did not specify whether reported values included residents and/or staff. Relevant state reports can be accessed via hyperlinks in state names. Some state names may reflect multiple hyperlinks. 1 Censored values were imputed with 5.5 to calculate CA state totals. 2 Includes residents transferred out of group homes. 3 May include settings that serve seniors 4 Group home outbreaks reflect outbreaks after July 10th. 5 Additional relevant settings may be included in overall LTC data, but are not severable, so are not reflected here. 6 Presumed and confirmed deaths.7 Censored values were imputed with 2.5 to calculate PA state totals. 8 UT reports only active outbreaks in ICFs, so there is not enough information to report this data.
SOURCE: KFF review of state-reported data on cases and deaths in settings serving people with disabilities.