The Impact of Gun Violence on Children and Adolescents

Authors: Nirmita Panchal and Sasha Zitter
Published: May 27, 2025

The United States experienced a sharp increase in firearm mortality among youth in recent years, with firearms becoming the leading cause of death for children and adolescents by 2020. Beyond firearm deaths, there are many more youth who survive gunshot wounds or are otherwise exposed to gun violence, which can lead to negative behavioral health outcomes. For example, increased youth suicide risk has been linked to communities exposed to school shootings. School shootings in the U.S. have increased in prevalence over time, as has exposure of school-aged children to these shootings, up from 19 per 100,000 school-aged children from 1999-2004 to 51 per 100,000 from 2020 to 2024.

The new Trump Administration has revoked multiple gun safety initiatives in the interest of preserving Second Amendment rights. These initiatives include dismantling the School Safety Committee, an Executive Order to review and revise firearm regulations by the Bureau of Alcohol, Tobacco, and Firearms that may infringe on Second Amendment rights, and the removal of the former Surgeon General’s advisory that identified gun violence as a public health crisis.

This brief explores the impacts of gun violence on children and adolescents (ages 17 and below) and current policies affecting gun accessibility and safety. Key findings include:

  • Firearm death rates among children and adolescents increased 46% from 2019 to 2021, primarily driven by gun assaults. From 2021 to 2023, the firearm death rate has held steady at 3.5 per 100,000 children and adolescents. The increase in gun deaths during the pandemic is most pronounced among Black and Latino youth, among which gun assaults also account for the majority of firearm deaths.
  • Nonfatal firearm injuries are two to four times more likely to occur than fatal ones, and Black youth are much more likely than their White peers to be injured by or exposed to a gun violence incident.
  • Exposure to gun violence can have severe adverse effects on the mental health and well-being of children and adolescents, including increased likelihood of depression, PTSD, anxiety, and poor academic performance.
  • The new Trump Administration has rolled back multiple Biden-era gun safety policies. Simultaneously, access to mental health and trauma support may be impacted by federal budget cuts and restructuring.

How have firearm deaths changed in recent years among children and adolescents?

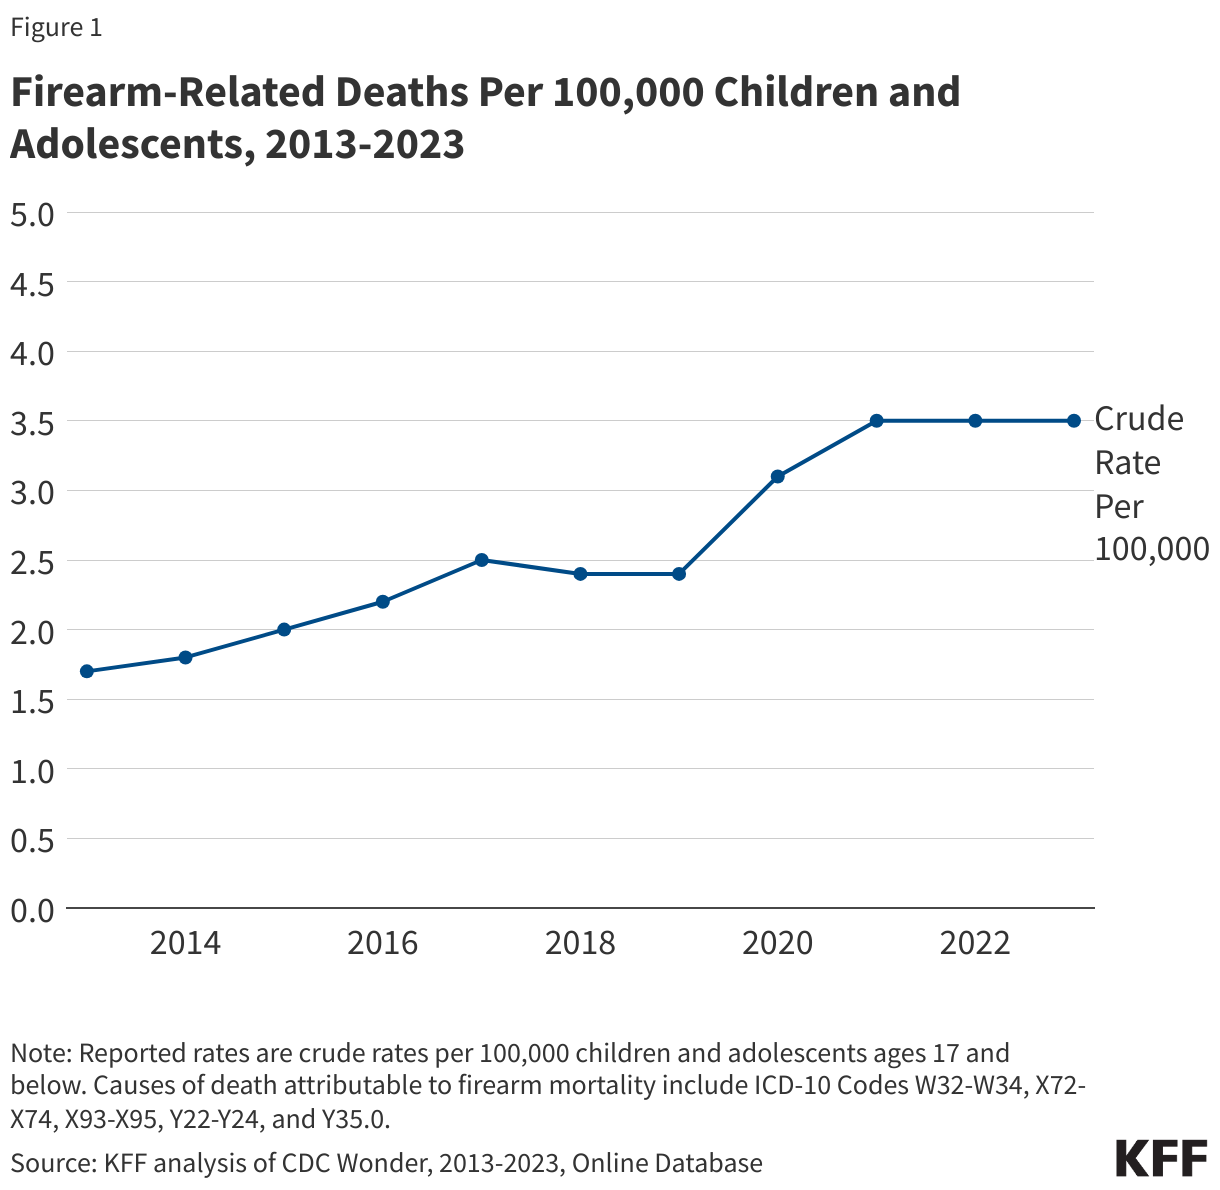
Firearm-related deaths have increased among children and adolescents since the pandemic began, with seven children per day dying by firearm in 2023. From 2013 to 2023, nearly 21,000 children ages 17 and younger died by firearm.1  During this period, firearm death rates gradually rose until 2017, then slowed through 2019, before sharply rising with the onset of the pandemic and holding steady in 2023 (Figure 1). From 2019 to 2023, the firearm death rate among children and adolescents increased by 46% (from 2.4 to 3.5 per 100,000). This translates to seven children per day dying by firearm in 2023.

Firearm-Related Deaths Per 100,000 Children and Adolescents, 2013-2023

Recent increases in firearm deaths were driven by gun assaults, which accounted for nearly two out of three firearm deaths among children and adolescents in 2023. Gun assault deaths among children and adolescents have increased over the past decade, resulting in 1,622 deaths in 2023 (Figure 2). Leading up to the pandemic, gun assaults made up about half of all child and adolescent firearm deaths. However, from 2019 to 2023, the share of these firearm deaths attributed to gun assaults grew from 54% to 63%.

Firearm Deaths Among Children and Adolescents, by Type, 2013-2023

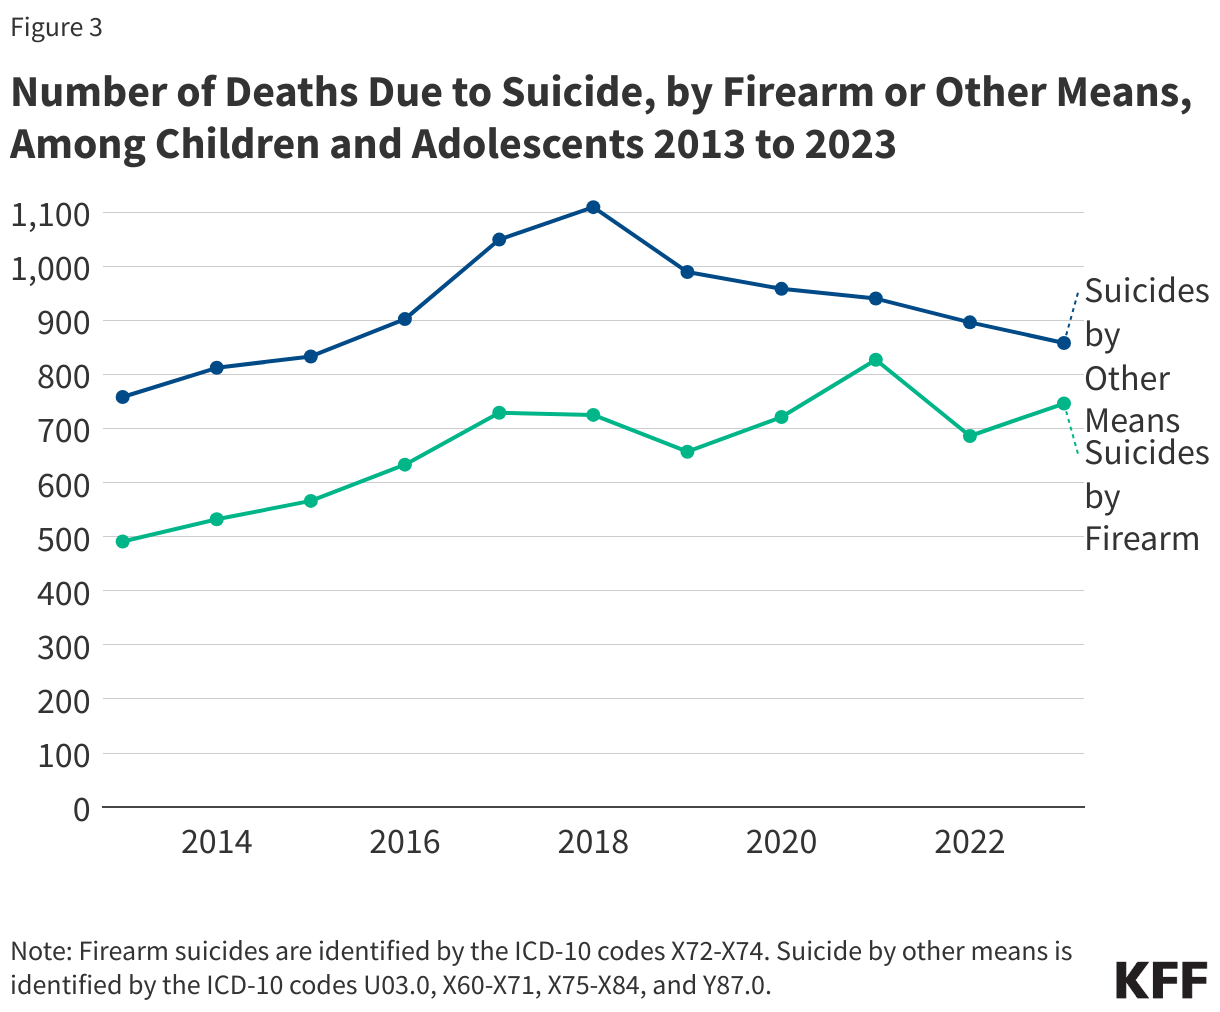
Among child and adolescent firearm deaths in 2023, 29% were suicides and 5% were accidental. Suicides by firearm have increased over the past decade among children and adolescents, peaking in 2021 with 827 deaths (Figure 3). Suicides by other means, however, have consistently declined since 2019. In 2023, firearms were involved in 47% of total suicide deaths among children and adolescents.

Number of Deaths Due to Suicide, by Firearm or Other Means, Among Children and Adolescents 2013 to 2023

How do youth firearm deaths vary by demographic characteristics?

Firearm death rates have sharply increased among Black and Hispanic children and adolescents since the pandemic began. In 2023, the rate of firearm deaths among Black youth was 11.7 per 100,000 – substantially higher than any other racial and ethnic group and over four times higher than White youth (Figure 4). Additionally, from 2018 to 2023, the rate of firearm deaths nearly doubled among Black youth and increased by 73% among Hispanic youth. While firearm death rates for American Indian and Alaska Native (AIAN) youth fluctuated over the same period, they remained higher than the rates of their White, Hispanic, and Asian peers throughout the period. White youth experienced relatively stable and lower firearm mortality rates from 2018 to 2023, while Asian youth had the lowest firearm mortality rates across the period (Figure 4).

Total Firearm Death Rates for Children and Adolescents by Race/Ethnicity, 2018-2023

The recent increases in firearm deaths among Black and Hispanic children and adolescents were primarily driven by gun assaults. Since the onset of the pandemic, the gap in gun assault death rates between Black and White children and adolescents has significantly widened. The gun assault death rate among Black youth grew from 4.9 to 10.3 per 100,000 between 2018 and 2022, dropping slightly to 9.7 in 2023. Among White youth, it remained steady and below 1.0 per 100,000 (Figure 4). The gun assault death rate among Hispanic youth doubled 0.9 to 2.0 per 100,000 between 2018 and 2022 before dropping slightly to 1.8 per 100,000 in 2023.

In 2023, Black youth accounted for 46% of all youth firearm deaths although they made up only 14% of the U.S. youth population (Figure 5). From 2018 to 2023, the share of firearm deaths attributed to Black children and adolescents grew from 35% to 46%; and the share attributed to Hispanic children and adolescents grew from 16% to 19%.

Child and Adolescent Firearm Death Distribution vs. Population Distribution, by Race and Ethnicity

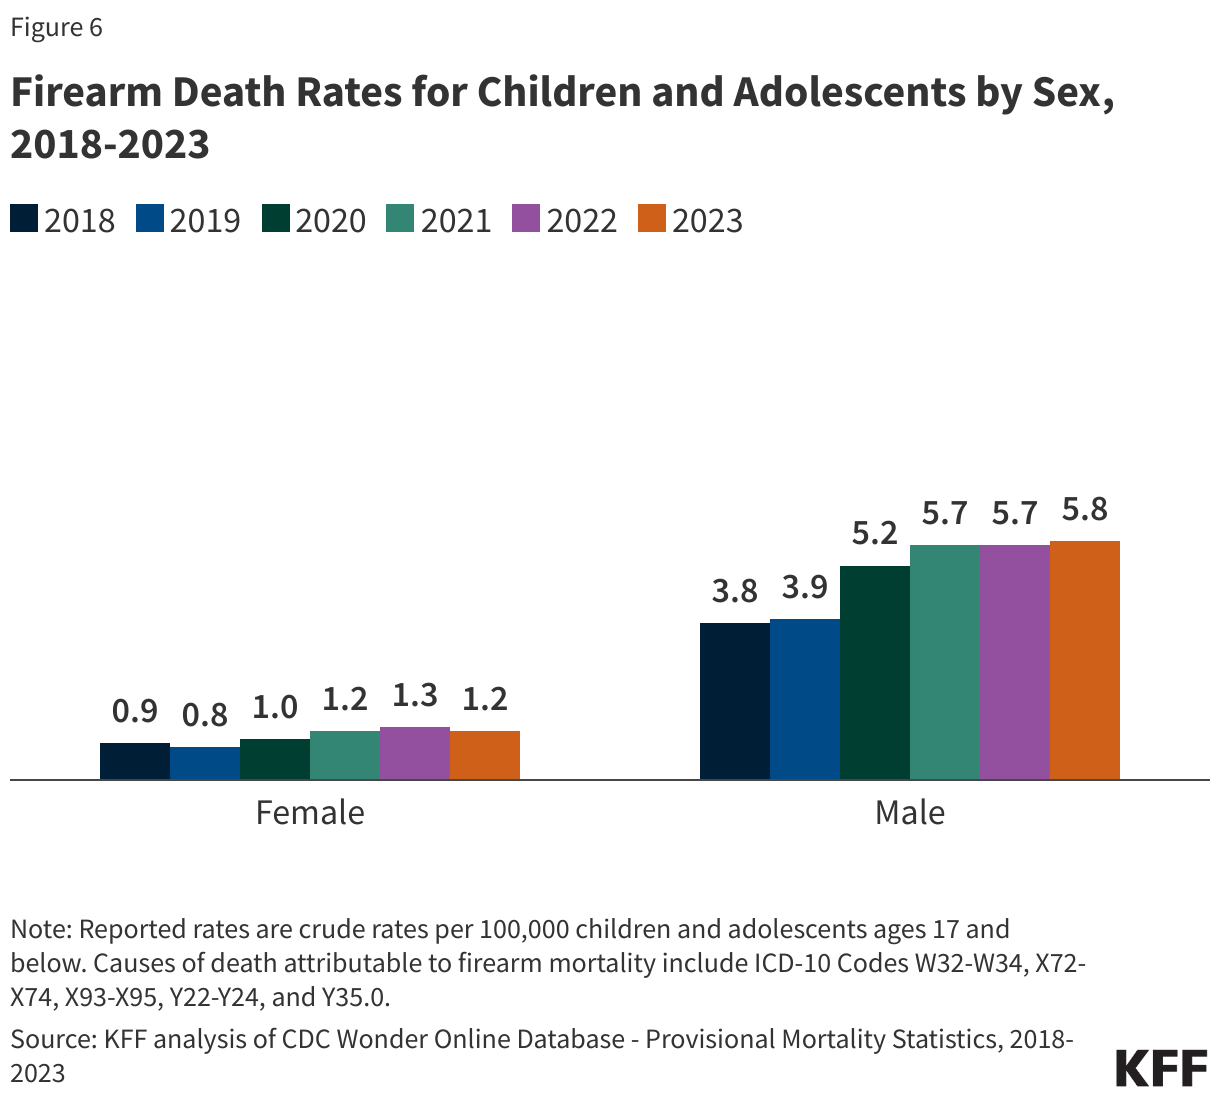
Firearm death rates for male children and adolescents are over four times higher than their female peers. From 2018 to 2023, the rate of deaths due to firearms increased by 53% among male children and adolescents but remained lower and stable among females (Figure 6).

Firearm Death Rates for Children and Adolescents by Sex, 2018-2023

Among firearm deaths, suicides by firearm are more common among adolescents compared to younger children, while accidental gun deaths are more common among younger children than adolescents (Figure 7). Gun assaults accounted for roughly two-thirds of firearm deaths among both adolescents and younger children in 2023. The second most common type of firearm death among adolescents was firearm suicides (32%), and among younger children was accidental gun deaths (21%).

Distribution of Firearm Death Types Among Children and Adolescents, 2023

Firearm death rates among children and adolescents vary considerably by state; however, almost all states have seen growth in these death rates in pandemic years. From 2020 to 2023 the states with the highest firearm death rates among children and adolescents were the District of Columbia, Mississippi, and Louisiana (10.3, 9.0, and 8.8 per 100,000 respectively for combined years, 2020-2023. The District of Columbia was also among the states with the highest school shooting exposure rates among school-aged children and adolescents in the 2020-2024 period (356 per 100,000, respectively). The states with the lowest firearm death rates were Massachusetts, New Jersey, and New York (0.7, 0.9, and 1.1 per 100,000 respectively for combined years, 2020-2023). Almost all states experienced an increase in firearm death rates from pre-pandemic to pandemic years, with the largest changes seen in Nebraska, Connecticut, and North Carolina (125%, 100%, and 100% respectively) (Figure 8).

State-by-State Shifts in Firearm Death Rates Among Children and Adolescents During the Pandemic

What do we know about nonfatal firearm injury exposure among children and adolescents?

The number of nonfatal firearm injuries far exceeds the number of firearm fatalities among children and adolescents. However, estimates vary, with research suggesting nonfatal firearm injuries occur anywhere from two to four times more often than firearm fatalities. Recent data also indicate that since the pandemic began, nonfatal firearm injuries among children and adolescents have increased. The majority of youth nonfatal firearm injuries are a result of assaults.

Many children and adolescents are exposed to gun violence, even if they are not directly injured. Data on exposure to gun violence among youth is generally limited. However, a recent KFF analysis found that 51 per 100,000 U.S. school-age children were exposed to a school shooting from 2020-2024. Additionally, a CDC analysis found that in 34% of unintentional child and adolescent firearm deaths, at least one other child was present during the incident. Prior data from the National Survey of Children’s Exposure to Violence found that 8% of children and adolescents were exposed to a shooting in their lifetime, with a higher share (13%) reported among adolescents (ages 14-17). Further, in a recent KFF poll, 17% of adults in the U.S. reported witnessing someone being injured by a gun.

Black children and adolescents are more likely to experience firearm injuries and exposures than their White peers.Leading up to the pandemic, Black and male children and adolescents were more likely to experience nonfatal firearm injuries than their peers. This disparity among Black youth firearm injuries and exposures has been exacerbated since the pandemic began. In general, children of color are more often exposed to gun violence than their White peers. Children living in areas with a high concentration of poverty are more likely to experience firearm-related deaths, and poverty disproportionately affects children of color.

How does gun violence affect the mental health and well-being of children and adolescents?

Gun violence can adversely affect the mental health and well-being of children and adolescents. Exposure to gun violence is linked to post-traumatic stress disorder and anxiety, in addition to other mental health concerns among youth. Gun violence may also lead to challenges with school performance, including increased absenteeism and difficulty concentrating. In response to indirect gun violence, such as witnessing a shooting or hearing gunshots, many children and adolescents report feeling sad, anxious, or fearful. Children and adolescents are exposed to gun violence in multiple ways, outlined below.

  • Neighborhood and community violence. Many children and adolescents experience violence within their communities. Firearm homicides occurring within an adolescent’s community have been linked to anxiety and depression among adolescents, particularly for females. Other analyses have similarly found an association between incidents of neighborhood firearm homicides and poor mental health outcomes among youth.
  • Suicide. Suicides are the second leading cause of death among adolescents and many suicides involve a firearm. Research has found that access to firearms, particularly in the home, is a risk factor for suicide deaths among children and adolescents. Nearly half of suicide attempts occur within 10 minutes of the current suicide thought, further underscoring access to firearms as a risk factor for suicide.
  • Domestic or intimate partner violence. Women and children are often the victims of intimate partner violence, which may involve firearms. The presence of a firearm in the home is linked to the escalation of intimate partner violence to homicides. Even when firearms are not used, they may serve as a means of threatening and intimidating victims of domestic violence.
  • Mass shootings.Although mass shootings, including school shootings, account for a small portion of firearm-related deaths, they can negatively impact the mental health of children and communities at large. Research has found that youth antidepressant use and suicide risk increased in communities with exposures to school shootings. Additionally, a survey prior to the pandemic found that the majority of teenagers and their parents felt at least somewhat worried that a school shooting may occur at their school. School shootings are on the rise, with the U.S. average yearly rate of student exposure to a school shooting increasing threefold over time (from 19 per 100,000 students in 1999-2004 to 51 in 2020-2024). In response to school shootings, nearly all schools practice active shooter drills, which may have a negative psychological impact on participants. Although research is limited on how mass shootings affect individuals not directly exposed to them, current literature suggests that information and knowledge of mass shootings may be linked to increased levels of fear and anxiety.

Youth survivors of firearm injuries are at increased risk of mental health and substance use issues, in addition to chronic physical health conditions. An analysis of commercially insured children and adolescents found that, in the year following a firearm injury, survivors were significantly more likely to experience psychiatric and substance use disorders compared to their peers. Additionally, the increases in psychiatric disorders were more pronounced among youth with more severe firearm injuries compared to youth with less severe firearm injuries. Youth gunshot survivors are more likely to utilize mental health services following their injury compared to their uninjured peers. However, a study of youth survivors enrolled in Medicaid found that more than three out of five survivors had not received mental health services within the first six months following their injury.

Negative mental health impacts can extend to the family members of youth gun violence victims.Parents, particularly mothers, of youth firearm-injury survivors had an increase in psychiatric disorders and mental health visits in the year following the firearm incident, based on an analysis of commercially insured individuals. These increases in psychiatric disorders and mental health visits were more pronounced among families of youth firearm fatalities.

Gun violence disproportionately impacts Black children and adolescents, leaving them more vulnerable to negative mental health outcomes. In addition to increased assaults, firearm suicides, and exposure to community violence, Black communities are disproportionately exposed to police shootingsResearch found that Black people living near the scene of a police killing of an unarmed Black individual experienced worsened mental health in the months that followed. Separately, despite mental health concerns among Black youth injured by gun violence, research on mental health service utilization in the months following a firearm injury is mixed, with one study finding higher utilization among Black youth compared to their White peers, and another study finding the reverse. Historically, Black individuals are less likely to receive mental health treatment and face additional barriers to care, such as the lack of culturally competent care.

What policies address child and adolescent exposure to gun violence and poor mental health?

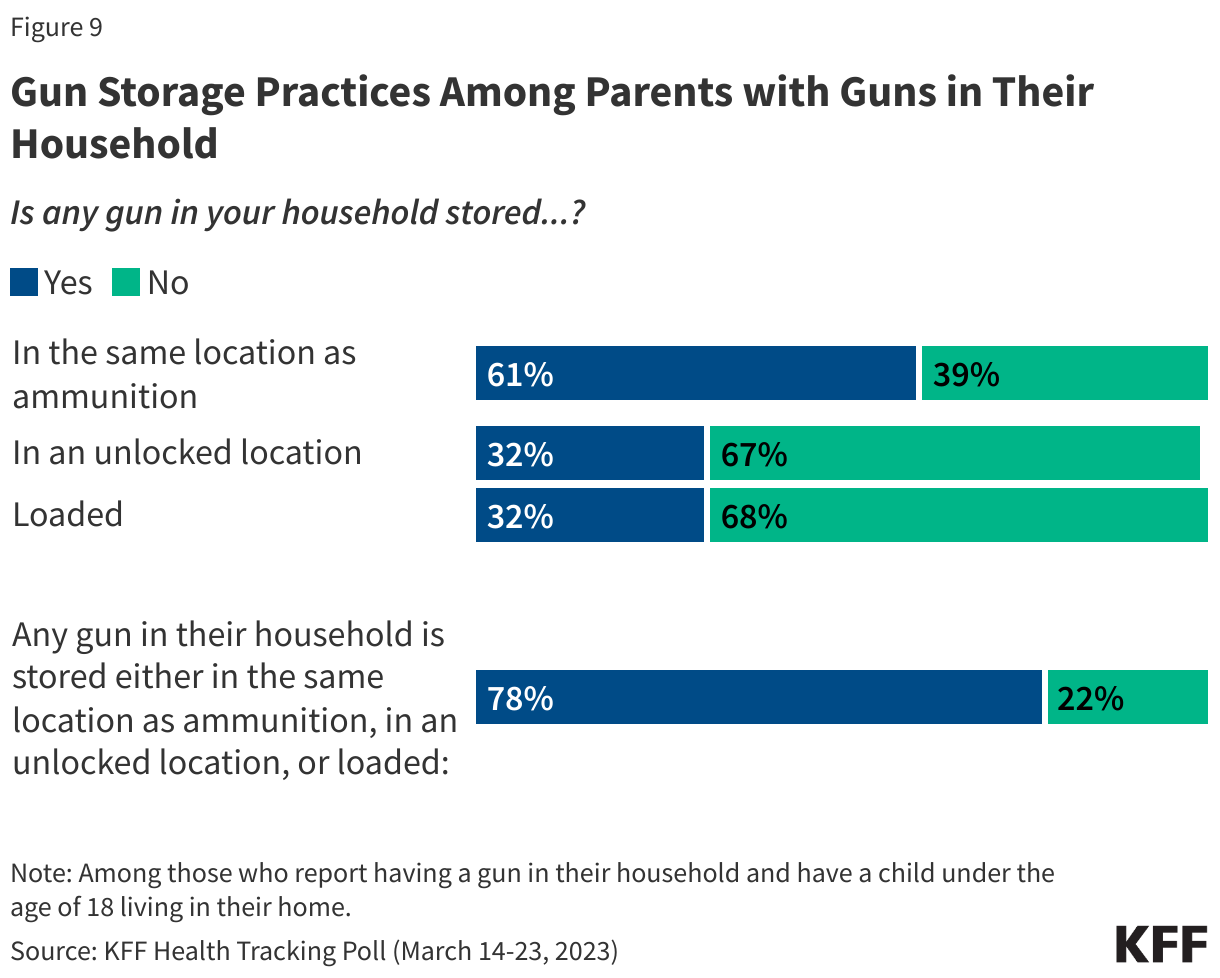
Gun control debates are deeply divided politically in the U.S.; but beyond gun control, other approaches seek to reduce the impact of firearms on health, for example, through safe storage practices.Safe storage and child access prevention provisions have been linked to a reduction in adolescent firearm homicides and non-fatal gun injuries. These provisions vary widely across states; some states have multiple provisions, while others have none. Some states have also enacted unique approaches to promote gun safety. For example, beginning with the 2023-2024 school year, local education agencies in California are required to notify parents annually on the safe storage of firearms; and some states provide tax rebates on safe storage devices. The Biden-Harris administration put forth additional steps to promote safe storage of firearms, including guidance from the U.S. Department of Justice, which was taken offline during the current Trump Administration. A KFF poll found that 44% of parents with children under the age of 18 have a gun in their household. Among parents with guns in their home, about one-third said a gun is stored loaded (32%) or stored in an unlocked location (32%) (Figure 9). More than half of parents (61%) said any gun in their home is stored in the same location as ammunition. The KFF poll also found that only 8% of parents said their child’s pediatrician talked to them about gun safety.

Gun Storage Practices Among Parents with Guns in Their Household

The Trump Administration is rolling back some Biden-era policies aimed at addressing gun reform and expanding youth mental health services for children and adolescents. During the Biden Administration, the Bipartisan Safer Communities Act (BSCA) was passed in response to increasing gun violence. The BSCA outlined provisions on gun reform and improving access to youth mental health services, including through schools. However, in May 2025, the Trump administration canceled $1 billion in BSCA grant funding for school-based mental health services. Gun safety groups fear that President Trump will attempt to further weaken or eliminate the BSCA. Additionally, other measures that may address youth mental health and gun violence trauma, including the rollout of 988, may also be in jeopardy. Under the Trump Administration, the Department of Government Efficiency (DOGE) laid off about a quarter of the 988 Hotline’s digital communications team. New federal funding freezes have also been put in place on prevention work by federal authorities to stop terrorism and mass shootings.

Gun violence disproportionately affects many children and adolescents of color, particularly Black children and adolescents, and this disparity has grown since the pandemicChildren and adolescents of color may also face added barriers to mental health care in light of long-standing cultural inequities and a lack of culturally informed care. In years prior, mental health initiatives aimed at Black and Latino people were introduced in Congress and SAMHSA announced funding opportunities to create a Behavioral Health Center of Excellence aimed at improving behavioral health equity for Hispanic and Latino communities. SAMHSA’s funding, however, has been cut by the Trump Administration by approximately $11.4 Billion, preventing the entity from using money that was previously earmarked for mental health and substance use disorder resources.

Gun violence can lead to increased mental health and substance use concerns. The recent increase in child and adolescent firearm injuries and deaths come at a time when concerns about youth mental health have grown but access to and utilization of mental health care may have worsened.

  1. KFF analysis of youth firearm mortality is based on data from Center for Disease Control and Prevention (CDC) Wonder injury and mortality database. In this analysis, firearm-related deaths are defined as gun assault deaths, suicide deaths by firearm, deaths due to accidental firearm discharge, legal intervention leading to firearm death, and firearm deaths from an undetermined cause. ↩︎

Proposed Medicaid Federal Match Penalty for States that Have Expanded Coverage for Immigrants: State-by-State Estimates

Published: May 22, 2025

Editorial Note: This piece was originally published on May 21, 2025 and was updated on May 22, 2025 to reflect revisions made in the version of the bill passed by the House.

Introduction

The House reconciliation bill will substantially reduce federal Medicaid spending and coverage and increase the number of uninsured according to estimates from the Congressional Budget Office (CBO). The bill includes a provision that would penalize states that expand coverage for immigrants by reducing the federal Medicaid matching rate for the Affordable Care Act (ACA) Medicaid expansion population from 90% to 80% for states that either provide health coverage or financial assistance to purchase health coverage to certain groups of immigrants. However, the groups of immigrants receiving coverage that would subject states to the penalty was revised several times before the bill was passed by the House:

  • The initial version of the bill passed by the House Energy and Commerce committee would reduce federal Medicaid funding for states that provide coverage to immigrants who were not a qualified alien or otherwise lawfully residing in the United States—affecting 14 states and DC that have expanded coverage to undocumented immigrants with their own funds.
  • A revision made to the bill before it was considered by the House Rules Committee removed “otherwise lawfully residing” immigrants from coverage that could be provided without the penalty, effectively broadening the penalty to an additional 19 states that have taken up a federal option available in Medicaid and the Children’s Health Insurance Program (CHIP) to expand coverage for lawfully residing children and pregnant people.
  • Per amendments made to the final version of the bill passed by the House, the penalty was limited to states providing coverage to immigrants who are not a “qualified alien” or a “child or pregnant woman who is lawfully residing in the United States” covered under the Medicaid option for these groups. This change appears to largely apply the penalty to the 14 states and DC that cover undocumented immigrants with state funds. However, because the exception is more limited than the prior language, which excluded states covering “otherwise lawfully residing” immigrants from the penalty, additional states that cover lawfully residing groups through other pathways could be affected.

KFF data show that 14 states plus DC cover children regardless of immigration status, including 7 states plus DC who cover at least some adults regardless of status, that would be affected by the current version of the provision. In Utah and Illinois, the provision could result in federal funding and coverage losses for the entire ACA Medicaid expansion population, since the states have “trigger” laws that require them to terminate the expansion if federal funding decreases. As noted, additional states that have expanded coverage for lawfully residing immigrants could be affected by the penalty.

This analysis examines the potential impacts of this policy change on state Medicaid spending, including state-by-state estimates of potential losses in federal financing (and increases in state spending) if the 14 states and DC that cover immigrants regardless of immigration status maintain their programs. It also presents enrollment data for these programs to estimate the number of people who may be at risk for coverage losses if states eliminate these programs based on KFF analysis of publicly available state enrollment data, budget documents, and media reports. Losses in federal financing and coverage may be larger if additional states are affected by the provision.

If states maintained their coverage programs, they would need to find ways to offset the loss of federal funding. This could include increasing state tax revenues, decreasing spending on non-Medicaid services such as education, or making other Medicaid cuts. If states eliminated their programs, there would likely be increased uninsured rates and barriers to care for immigrant families and negative impacts for the U.S. economy and workforce due to the role immigrants play.

Potential Impacts on State Spending if States Maintain Coverage and are Subject to the FMAP Penalty

The analysis assumes that, starting in fiscal year (FY) 2027, expenditures for people eligible in the ACA Medicaid expansion would be matched at 80% instead of 90% in the 14 states and DC that offer coverage for people regardless of immigration status. This analysis does not make assumptions about specific state behavior and instead illustrates the potential impact on state Medicaid spending if all states maintained their existing coverage programs in response to this policy change. CBO projected that the provision to penalize states the 14 states and DC that offer state funded coverage to undocumented immigrants would result in federal savings of $11 billion between 2025 and 2034 and a coverage loss of 1.4 million people. This estimate accounts for assumptions about state behavioral responses and other secondary effects.

A reduction in the expansion match rate or “FMAP” for the 14 states and DC with state-funded coverage for people regardless of immigration status could shift $92 billion in costs from the federal government to the states over the next ten years if the states maintained their programs (Figure 1). State Medicaid spending increases across the states range from $30 billion in California to $300 million in Vermont or from 8% in Oregon and Washington to 3% in Massachusetts, Vermont, New York, and Minnesota. The cost shift would be larger if additional states that cover lawfully residing immigrants are affected by the penalty.

Reducing the ACA Medicaid Expansion FMAP in States that Cover Undocumented Immigrants with their Own Funds Could Shift $92 Billion in Costs to the States Over the Next Ten Years

In addition, there would be large Medicaid spending and enrollment declines in Utah and Illinois if their ACA expansion coverage was eliminated per their current state “trigger” laws. Utah and Illinois have laws in place that automatically end expansion if the federal match rate were to drop, meaning the provision could result in funding and coverage losses for the entire ACA Medicaid expansion population in these states. Prior KFF analysis found that if states drop their ACA Medicaid expansion coverage altogether, 78,000 (or 23%) of Medicaid enrollees could lose coverage in Utah and 840,000 (or 28%) of Medicaid enrollees could lose coverage in Illinois by FY 2034. This would result in a decrease of about $11 billion in federal Medicaid spending in Utah and $96 billion in Illinois over a ten-year period. It’s likely many of these expansion enrollees would become uninsured and gains in financial security, access to care, and health outcomes associated with Medicaid expansion would be reversed.

If states maintained their current coverage, they would need to find ways to offset the loss of federal funding. This could include increasing state tax revenues, decreasing spending on non-Medicaid services such as education, which is the largest source of expenditures from state funds, or making other Medicaid cuts. Given the size of the federal Medicaid funding cuts in the reconciliation bill, states would likely face substantial challenges in efforts to replace the loss of federal funds and significant pressure to drop their current coverage programs.

Potential Impacts on Coverage if States Eliminate Coverage to Avoid the FMAP Penalty

More than 1.9 million people could lose health coverage if states eliminate their state-funded coverage for immigrants regardless of immigration status to avoid the penalty. About 1.9 million people are enrolled in state-funded coverage programs for immigrants based on enrollment data from 7 of the 14 states providing coverage to children and DC and 6 of the 7 states and DC providing coverage to at least some adults (Table 1). This includes roughly 1.6 million adults and about 300,000 children, although data are not available from six states that cover children (Illinois, Maine, Massachusetts, New York, Rhode Island, and Washington) and Minnesota does not report separate data for adults and children. As such, these data undercount the number of people enrolled in these programs and at risk for coverage losses. Moreover, the dates of the enrollment data vary across states. If additional states that cover lawfully residing immigrants eliminate coverage to avoid the penalty, coverage losses would also be larger. As noted, CBO estimates that 1.4 million people would become uninsured by 2034 due to original version of the penalty which applied to states covering undocumented immigrants; this estimate represents a different time period than these enrollment data and makes assumptions about state behaviors in response to the provision.

States could avoid the FMAP penalty by eliminating their programs, but there would likely be increases in the uninsured rate and barriers to accessing care among immigrant families. Although most immigrants are working, they are often employed in jobs that do not offer employer-sponsored health coverage and undocumented immigrants are prohibited from enrolling in federally funded coverage options. As such, without these programs most will not have access to an affordable coverage option and become uninsured. People who are uninsured often delay or go without needed care, which can contribute to health conditions becoming worse and more costly. Reduced coverage and access to care may also negatively impact the U.S. economy and workforce due to lost productivity since immigrants play an outsized role in many occupations including health care, construction, and agriculture.

Nearly Two Million People Are Enrolled in State-Funded Coverage Programs for Immigrants Based on Partial Enrollment Data from 10 of 14 States and DC

Methods

State spending estimates under the proposed policy change follow the methods outlined in a prior KFF analysis, with a few exceptions:

  • The FMAP is reduced from 90% to 80% in the 14 states and DC with state-funded coverage regardless of immigration status (for Figure 1 estimates).
  • The policy change is implemented in FY 2027.

To determine the cost shift to states, the analysis calculates the difference in state Medicaid spending under the proposed policy change and KFF’s baseline projections of state Medicaid spending over the next ten years.

VOLUME 23

New Vaccine Requirements, Anti-mRNA Narratives, and Disputed Gender-Affirming Care Report


Summary

This volume highlights how new vaccine requirements and the spread of anti-mRNA sentiments are fueling confusion and distrust. It also examines reactions to a federal report on gender-affirming care for minors and investigates how TikTok is being used to promote false health claims through deepfake personas targeting young women.


Recent Developments

HHS’ New Placebo Requirements for Vaccine Approval Prompt Confusion About Existing Procedures

jiang suying / Getty Images

The Department of Health and Human Services (HHS) announced that it will require all new vaccines to undergo placebo-controlled trials before approval, framing this as a shift from existing practices. A placebo-controlled trial is a study that compares participants who receive an experimental vaccine to a control group that receives a placebo—an inert substance—to help isolate the effects of the vaccine from other factors. While many vaccines, including COVID-19 vaccines, were tested this way, the American Medical Association (AMA) and the World Health Organization (WHO) do not consider placebos ethical when withholding a known effective vaccine could expose participants to unnecessary risk. In such cases, researchers use other rigorous methods, such as comparing a new vaccine to an approved one to evaluate differences in safety, immune response, and effectiveness. The HHS announcement has led to questions about the safety of existing vaccines among those unfamiliar with how clinical trials are designed and why placebo use is not always appropriate.

Online discussion about placebo-controlled trials spiked on May 1 and May 4, following news reports of HHS’ new policy. Some posts with large engagement argued that placebo-controlled trials should not be used when a vaccine is known to be protective, aligning with the AMA and WHO. Others misleadingly presented the policy change as evidence that past vaccine trials lacked proper oversight or were “corrupt.” A widely shared post from a medical doctor and lawyer with over 900,000 followers called the update long overdue and said it would finally hold vaccine makers to higher safety standards. Others expressed genuine confusion about study designs by expressing a lack of knowledge about how often placebo groups are used in clinical trials.

Polling Insights:

As regulatory guidelines surrounding vaccines change, KFF’s latest Tracking Poll on Health Information and Trust finds that fewer than half the public say they currently have at least “some” confidence in federal government health agencies to ensure the safety and effectiveness of vaccines approved for use in the U.S. While half or fewer across partisans express confidence, Democrats are somewhat more likely than independents and Republicans to say they have “a lot” or “some” confidence in federal health agencies to ensure vaccines are safe and effective.

Just Under Half of the Public Express Confidence in Federal Health Agencies To Ensure Vaccine Safety and Effectiveness, Including Half or Fewer Across Partisans

Changing COVID-19 Booster Testing Standards Add to Uncertainty Around Safety

Thanasis / Getty Images

Social media conversations have also reflected concern and skepticism about COVID-19 boosters after HHS officials stated that these boosters may be held to stricter evidence requirements that could treat them as entirely new products. This framing has led to confusion about what qualifies as a “new vaccine,” particularly in contrast to updated COVID-19 boosters. While a new vaccine may target either a novel or existing pathogen using new technology or formulations, COVID-19 boosters are updates to previously approved vaccines designed to target evolving strains of the same virus. Unlike brand-new vaccines, which undergo extensive clinical trials, updated COVID-19 boosters were previously approved using existing safety data from the original vaccine, along with lab and animal studies showing that the updated shot produces a strong immune response to new variants. Experts warn that the shift could delay access to boosters as new strains of viruses spread, while weakening trust in long-standing safety procedures.

Confusion about boosters began to grow after the FDA questioned data around boosters and delayed full approval of Novavax’s updated COVID-19 vaccine, calling it a new product and requesting additional trial data. Novavax, a protein-based alternative to mRNA vaccines, has been authorized for emergency use since 2022 after a large placebo-controlled trial showed high efficacy and few serious adverse effects. The updated version targets newer variants and functions as a booster for individuals who have previously been vaccinated. Prior to the FDA’s decision to apply new product standards for all COVID-19 boosters for people under 65, some high-profile social media accounts reacted to the Novavax delay with concern about boosters. One X account with approximately 3.7 million followers called for the COVID-19 vaccines to be banned, calling them “worthless” and “dangerous.” Another post, from a physician with one million followers, falsely claimed that new variants are invented to justify continued booster campaigns.

mRNA Vaccine Concerns Gain Political Traction Despite Scientific Consensus

Luis Alvarez / Getty Images

Misleading information about mRNA vaccines continues to circulate online, contributing to support for policy proposals that aim to ban the technology. Extensive research and real-world data show that mRNA vaccines have a strong safety profile and offer protection against severe illness, hospitalization, and death from infectious diseases, like COVID-19, and potentially cancer. But a group of legislators in Minnesota recently introduced a bill that would classify mRNA vaccines as “weapons of mass destruction,” with criminal penalties of up to 20 years in prison. Although unlikely to pass, the bill represents the growing reach of concern about mRNA technology. Similar measures have emerged in other states: Iowa, Montana and Idaho have considered proposals that would impose criminal penalties on providers. 

Social media conversations continue to reflect unsubstantiated concern about mRNA vaccines, sometimes showing support for legislation aiming to ban them. One Texas doctor with over 500,000 followers, previously suspended for sharing false information about vaccines, said that Minnesota legislators were “lead[ing] the way” with the proposal. Another widely shared post featured a video of a doctor with a revoked medical license recommending that viewers and their families “not get vaccinated, ever again, with an mRNA vaccine.” These conflict with the broad scientific consensus supporting mRNA vaccines and contribute to doubt about COVID-19 vaccines. According to the FDA, serious adverse effects from the COVID-19 vaccines—which are predominantly mRNA-based in the United States—occur in fewer than 1 in 200,000 vaccinated individuals, and research has shown that COVID-19 vaccines have saved tens of millions of lives globally.

Polling Insights:

New KFF polling shows that mRNA technology is obscure to much of the public. About twice as many adults think vaccines that use mRNA technology are “generally safe” (32%) as say they are “generally unsafe” (16%), but about half (52%) report not knowing enough about this technology to say. In addition, nearly half of the public (45%) report having heard the false claim that mRNA vaccines can alter a person’s DNA — a myth related to COVID-19 vaccines that began circulating early in the pandemic. While just 3% think this false claim is “definitely true” and one quarter say it is “definitely false” (24%), most fall in the malleable middle, saying it is either “probably true” (26%) or “probably false” (45%). However, there are important differences by party identification and ethnicity when it comes to believing or leaning toward believing the myth that mRNA vaccines alter DNA, with at least one-third of Republicans (37%), independents (33%), and Hispanic adults (38%) saying the claim is either “definitely true” or “probably true.”

Large Majorities of the Public and Partisans Are Uncertain if the Myth That mRNA Vaccines Can Change Your DNA Is True

Reactions to HHS Report Amplifies Misleading Narratives About Health Care for Transgender Youth

Besiki Kavtaradze / Getty Images

Misleading narratives about gender-affirming care for transgender and nonbinary people are circulating following the May 1 release of a new HHS report about gender dysphoria. The 400-page report, commissioned by an executive order aimed at limiting youth access to gender-affirming care, states that it surveys existing literature on gender-affirming interventions for children and adolescents, concluding that “the evidence for benefit of pediatric medical transition is uncertain, while the evidence for harm is less uncertain.” Major medical groups, including the American Academy of Pediatrics and the American Psychological Association, criticized the report and continue to support access to transition-related care based on other reviews and studies that have found a positive impact of gender-affirming care on health. On the day the report was released, mentions of gender-affirming care spiked on social media. Some high-profile accounts, including a podcast host with almost five million followers, circulated quotes from the report’s foreword that highlighted potential risks associated with gender-affirming care while emphasizing uncertainty about the benefits.

The report spurred other incorrect claims, including the false notion that surgical interventions are common among minors, but such procedures are exceedingly rare. One study that looked at data from more than 22 million minors found that less than .01% of transgender and gender diverse minors ages 13 to 17 underwent gender-affirming surgery, and none under 12 received such care. The HHS report’s framing of “exploratory therapy,” a practice that can include gender identity conversion efforts, drew attention online, but a recent KFF brief explains that major health associations have condemned this therapy as harmful and unsupported by evidence. Social media posts also amplified claims that many youth regret care, but research shows regret is uncommon. While not all transgender people seek medical care, a 2021 meta-analysis found that among those who do, the prevalence of regret is 1%. The report further claimed that many transgender or nonbinary people seek to “detransition” (return to their sex assigned at birth). But studies show that most transgender and nonbinary people do not return to their sex assigned at birth, and the KFF/Washington Post Trans Survey found that about eight in ten trans adults (78%) report being more satisfied with their lives after transitioning.


AI & Emerging Technology

Deepfake Health Scams Target Young Women on TikTok

About Four in Ten TikTok Users Say They Trust Health Information They See on the App, Including Larger Shares of Younger Users

A March investigation by Media Matters, also reported by Rolling Stone, uncovered a network of TikTok accounts using deepfake personas to push health and wellness products, often targeting women with fertility or cosmetic concerns. The accounts created backstories and personal testimonies to enhance credibility and drive sales through TikTok Shop links. One account, for example, featured videos of an influencer claiming various identities, such as a doctor and former model, to endorse hair growth supplements. A reverse image search, though, showed that the woman was likely generated by deepfake technology. Following publication of the investigation, the accounts identified in the article were removed from TikTok. This tactic reflects a broader trend identified in a 2024 study published in Journal of Medical Internet Research, which concluded that the alternative health community on TikTok is more likely to use emotional storytelling to build trust than conventional health videos, a strategy that these deepfake personas are designed to mimic.

A 2024 KFF poll found that most TikTok users report seeing health-related content on the app, and among these users women are more likely than men to say they’ve seen information or advice about mental health (71% v. 61%) or birth control (41% v. 25%) on the app. In addition, about half of women of reproductive age – those ages 18 to 49 – report seeing information or advice on TikTok about prescription birth control (54%) or abortion (48%). While fewer than half (40%) of TikTok users say they trust information about health issues that they see on the app at least “somewhat,” this rises to half among women ages 18-49. Notably, younger adults and women are more likely than older adults and men, respectively, to say they use TikTok every day.

About The Health Information and Trust Initiative: the Health Information and Trust Initiative is a KFF program aimed at tracking health misinformation in the U.S., analyzing its impact on the American people, and mobilizing media to address the problem. Our goal is to be of service to everyone working on health misinformation, strengthen efforts to counter misinformation, and build trust. 


View all KFF Monitors

The Monitor is a report from KFF’s Health Information and Trust initiative that focuses on recent developments in health information. It’s free and published twice a month.

Sign up to receive KFF Monitor
email updates


Support for the Health Information and Trust initiative is provided by the Robert Wood Johnson Foundation (RWJF). The views expressed do not necessarily reflect the views of RWJF and KFF maintains full editorial control over all of its policy analysis, polling, and journalism activities. The Public Good Projects (PGP) provides media monitoring data KFF uses in producing the Monitor.

Mapping Hospital Employment By State

Published: May 21, 2025

Congress is considering substantial reductions in Medicaid spending as part of a budget reconciliation bill—the One Big Beautiful Bill Act—with the goal of offsetting part of the cost of tax cuts and other expenditures. While there are a number of Medicaid policy changes in the bill, three changes account for the vast majority of the savings according to estimates from the Congressional Budget Office: requiring states to implement work requirements for the expansion group, increasing barriers to enrolling in and renewing Medicaid coverage, and limiting states’ ability to raise the state share of Medicaid revenues through provider taxes. Any large cuts in Medicaid spending would likely have implications for hospitals, given that the program accounted for about one fifth (19%) of all spending on hospital care in 2023. Medicaid spending cuts, along with other policy changes under consideration, could lead to decreases in payments to hospitals and increases in the number of uninsured Americans, both of which would likely affect hospital finances, access to hospital services, and the quality of patient care. These changes could also impact local economies, given that hospitals are often major employers in their communities.

The interactive 50-state maps below show the number of hospital employees by state and how hospital employment ranks among industry subsectors based on 2023 data from the Quarterly Census of Employment and Wages (QCEW), which includes more than 95% of U.S. jobs. Most hospitals are part of a broader health system, but system employees working in other settings (such as in separate physician practices) are not included. (See Methods for additional information about the data). Key takeaways include the following:

  • Hospitals employed 6.7 million individuals in 2023.
  • Hospitals employed about 131,000 individuals on average across the 50 states and DC, with hospital employment ranging from about 13,000 in Wyoming to about 610,000 in California.
  • Hospitals employed more than 100,000 individuals in 23 states and more than 400,000 individuals in four states: California, Florida, New York, and Texas.
  • Hospitals are the sixth largest employer in the country, and among the top five largest employers in 22 states, when comparing industry subsectors. Nationwide, the hospital subsector follows educational services; food services and drinking places; professional, scientific, and technical services; administrative and support services; and ambulatory health care services in employment rankings. Some physicians and other employees in the ambulatory health care services subsector may in fact be part of the same health system as hospitals but are not included in hospital employment if they work in other settings.
  • Hospitals ranked among the top eight employers in every state and were the ninth largest employer in DC.
  • Hospitals were the second largest employer in West Virginia and the third largest employer in North Dakota, South Dakota, and Wyoming.
Hospitals Employed 6.7 Million People in 2023, and More Than 100,000 People in 23 States
Hospitals Are the Sixth Largest Employer in the Country Across Industry Subsectors and Rank Among the Top Five Employers in 22 States

This work was supported in part by Arnold Ventures. KFF maintains full editorial control over all of its policy analysis, polling, and journalism activities.

Methods

This analysis uses data from the Quarterly Census of Employment and Wages (QCEW), which is administered by the Bureau of Labor Statistics (BLS). As BLS notes, the QCEW data provide a “quarterly count of employment and wages reported by employers covering more than 95 percent of U.S. jobs.” The QCEW includes workers covered by state unemployment insurance laws as well as federal workers covered by the Unemployment Compensation for Federal Employees (UCFE) program. Employment counts are referred to in this analysis as the number of individuals employed, though QCEW counts each job separately for individuals with multiple jobs.

Analyses of hospital and other employment relied on the 2023 average annual employment numbers reported by BLS. Industry subsector rankings were based on 3-digit NAICS codes. Employment for a given industry subsector and employer type were not included in totals or considered for purposes of ranking when not disclosed by BLS. In most states (46), this excluded 1% of employment reported in the QCEW or less. In the four remaining states (Delaware, Hawaii, Rhode Island, and Wyoming) and DC, this excluded 2% to 6% of employment. Among hospitals, BLS did not disclose state government hospital employment in DC, Iowa, Kentucky, Michigan, Rhode Island, South Dakota, Vermont, and Wyoming and local government hospital employment in Massachusetts and South Dakota.

U.S. Global Health Country-Level Funding Tracker

Published: May 21, 2025

This tracker provides U.S. global health funding data by program area and country. It includes Congressionally appropriated (planned) funding amounts from FY 2006 to FY 2023, as well as obligations and disbursements from FY 2006 to FY 2025 (FY 2024 and 2025 data are partially reported). It is important to note that these data do not reflect recent changes made by the Trump administration, starting on January 20, 2025, that have resulted in a freeze in funding, significant funding reductions, and cancellation of the majority of global health projects (see the KFF fact sheet on the proposed reorganization of U.S. global health programs for more information). Data were obtained from ForeignAssistance.gov (see About This Tracker below for more details). For examples of analyses that can be done using the tracker, please expand the section below.

Sample Analyses

This interactive can be used to understand how much funding the U.S. provides to global health programs in other countries. For example, in FY 2023, the most recent year with complete data, the U.S. appropriated $6.9 billion, obligated $6.1 billion, and disbursed $6.2 billion to country-specific global health programs (additional funding was also channeled to global activities and regional programs). Of the $6.1 billion in obligations:

  • 87 countries received U.S. funding for global health programs overall, including 61 countries that received funding for HIV, 57 for global health security (GHS), 47 for maternal and child health (MCH), 38 for family planning and reproductive health (FP/RH), 29 for malaria, 27 for nutrition efforts, 26 for tuberculosis (TB), and 19 for other public health threats.
  • The top 10 countries, accounting for 61% of funding, were: Nigeria ($574 million), Tanzania ($487 million), Uganda ($427 million), Mozambique ($423 million), Zambia ($412 million), Kenya ($381 million), South Africa ($364 million), Malawi ($259 million), Democratic Republic of the Congo ($219 million), and Ethiopia ($198 million).
  • Regionally, countries in Sub-Saharan Africa received the largest share of U.S. global health funding (85% or $5.2 billion), followed by East Asia and Oceana, South and Central Asia, and Western Hemisphere (each at 4% or ranging from $226-264 million), Middle East and North Africa (2% or $106 million), and Europe and Eurasia (1% or $83 million).
  • Low-income countries received the largest share of funding (46% or $2.9 billion), followed by lower-middle-income countries (43% or $2.6 billion), and upper-middle-income countries (11% or $651 million); high-income countries received 0.2% ($10 million).

About This Tracker

The U.S. is the largest donor to global health in the world, providing bilateral (direct country-to-country) support for U.S. global health programs in almost 90 countries in FY 2023, with additional countries reached through U.S. regional efforts and U.S. contributions to multilateral organizations. This tracker provides historical data on bilateral U.S. government funding for global health by country, region, and income-level. It presents data on country-specific global health funding channeled through the Department of State (State) and U.S. Agency for International Development (USAID), which account for approximately 85% of all U.S. funding for global health. Funding channeled through other agencies – the National Institutes of Health (NIH), Centers for Disease Control and Prevention (CDC), and Department of Defense (DoD) – is not included, as these data are not available at the country-level. Funding directed to “regional” or “worldwide” programs, which may reach additional countries, is also not included. See our companion resource, KFF U.S. Global Health Budget Tracker, to view data on U.S. funding for global health overall, including funding channeled through these other agencies. Data in this tracker present three transaction types:

  1. Appropriated: funding amounts based on Congressional appropriations for a given fiscal year which may be obligated and disbursed over a multi-year period;
  2. Obligations: binding agreements that will result in disbursements (or outlays), immediately or in the future, and
  3. Disbursements: actual paid amounts (an outlay of funds) to a recipient in a given year.

These amounts will be updated as new data become available. Queried data can be downloaded using the button within the interactive, and the full data can be downloaded here. For questions related to this resource, or for inquiries on further analyses on U.S. global health funding, please contact globalhealthbudget@kff.org.

Sources

KFF analysis of data from the U.S. Foreign Assistance Dashboard, U.S. State Department regional classifications, and World Bank income classifications.

News Release

Amid Increased Immigration Enforcement, a Majority of Lawfully Present Immigrants Are Worried They or a Family Member Could Be Detained or Deported 

KFF Poll and Focus Groups Highlight Views and Experiences of Immigrants in the Early Days of President Trump’s Second Term

Published: May 20, 2025

A new KFF poll of immigrants finds that six in 10 lawfully present immigrants say they worry about the possibility that they or a family member could be detained or deported, contributing to feelings of increased stress, anxiety, and other health problems. 

The increased fears come against a backdrop of more restrictive federal immigration policies and increased enforcement actions and are among the most notable takeaways from the new KFF survey of immigrants’ views and experiences during the early days of President Trump’s second term.  

The survey builds on the 2023 KFF/LA Times Survey of Immigrants, and a KFF survey of immigrants in 2024 during the presidential election cycle. A separate new companion KFF report based on focus group conversations with likely undocumented immigrants and their families provides a window into how the current immigration policy landscape is affecting their and their children’s daily lives and health and well-being. 

The new poll shows that immigrants’ worries about detention or deportation have risen sharply since 2023, even among lawfully present immigrants and naturalized citizens. Four in ten immigrants overall (41%) now say they worry about the possibility that they or a family member could be detained or deported, up 15 percentage points from 2023 (26%).

Such fears have affected immigrants’ health and well-being, with one-third of immigrants overall saying they have experienced worsening health conditions, increased stress and anxiety, or problems eating or sleeping since January due to concerns about their or a family member’s immigration status. The share rises to 41% among lawfully present immigrants. 

Other key takeaways include:  

  • About one-third of immigrants say they have seen or heard reports of ICE (Immigration and Customs Enforcement) presence in their community. 
  • About one in seven (13%) immigrants overall, including one in five lawfully present immigrants say they or a family member have limited their participation in at least one day-to-day activity like going to a community event, work, or seeking medical care due to concerns about drawing attention to someone’s immigration status.  
  • Four in 10 immigrants say they feel “less safe” since President Trump took office, including substantial shares of both lawfully present immigrants (44%) and naturalized citizens (34%). Most immigrants who identify as Democrats or lean that way (57%) say they feel less safe, but half of Republican and Republican-leaning immigrants (52%) say they feel safer since Trump took office.
  • About four in 10 immigrants overall (43%) expect their financial situation to worsen in the coming year, including a majority of Democrats (57%). Republican immigrants are more positive – four in 10 expect their finances to get better while three in 10 expect them to get worse.  

Political views of immigrants 

As among the public overall, immigrants’ views of President Trump and his policies are driven by partisanship. About two-thirds of immigrants disapprove of how President Trump is handling his job, and a similar share say things in the U.S. have gotten off on the wrong track.  But majorities of Republican immigrants say they approve (75%) of the president’s job performance and that things in the U.S. are going in the right direction (71%).  

President Trump’s worst approval rating among immigrants is on his handling of inflation (75% disapprove), and majorities also disapprove of his performance on foreign policy (66%), and immigration (62%). A large majority oppose the administration’s efforts to end birthright citizenship (79%). Republican immigrants are much more approving of President Trump’s performance and his policies, but 41% of Republican immigrants disapprove of his handling of inflation, and this group is split on his efforts to end birthright citizenship (52% approve, 48% disapprove).

Focus group findings 

In the companion report, based on four focus groups KFF conducted in March 2025 with 29 Hispanic adults who were likely undocumented or living with a likely undocumented family member, nearly all participants said that they were experiencing higher levels of fear and uncertainty due to shifting immigration policies, as well as financial concerns due to the current state of the economy. 

Participants described how fears are negatively impacting work as well as their family’s daily lives and routines. Some focus group participants said they have become increasingly fearful of going to work and/or that they have noticed fewer workers showing up at their workplaces due to immigration-related fears. Many said they were limiting their time outside the home and avoiding a range of activities, such as driving, traveling, and participating in community and recreational activities, including attending church or events.  

Fears also have taken a toll on the health and well-being of focus group participants and their children, most of whom are U.S. citizens. Participants described suffering from insomnia, loss of appetite, and symptoms such as stomach problems and migraine headaches due to fear and stress. 

Methodology:

Designed and analyzed by public opinion researchers at KFF, the survey was conducted March 6-April 13, 2025, online and by telephone among a nationally representative sample of 511 U.S. immigrants in English, Spanish, Chinese, Korean, and Vietnamese. The margin of sampling error is plus or minus 7 percentage points for the full sample. For results based on subgroups, the margin of sampling error may be higher. Focus group interviews with Hispanic immigrant adults were conducted in Spanish with participants recruited separately from the survey. The four groups drew participants from California, Texas, New Jersey and New York, and parts of the Midwest (Kansas, Missouri, North Carolina, Nebraska). Full methodological details are available at kff.org.

Implementing Work Requirements on a National Scale: What We Know from State Waiver Experience

Published: May 20, 2025

On May 18, the House Budget Committee advanced a budget reconciliation bill that includes significant changes to the Medicaid program. As anticipated, Medicaid work requirement provisions are included and preliminary estimates released by the Congressional Budget Office (CBO) show that this provision would reduce federal spending by $280 billion over ten years, nearly half of all estimated Medicaid savings in the bill.

If enacted, all states would be required to condition initial and continued Medicaid expansion eligibility on meeting work requirements and to exempt certain individuals from the requirements. KFF analysis shows that 92% of Medicaid adults are either working (64%) or have circumstances that may qualify them for an exemption. In previous analysis, CBO has found that a Medicaid work requirement would not have any meaningful impact on the number of Medicaid enrollees working.

States would have flexibility in some areas, including determining how many months to “look back” to verify compliance at application and renewal and whether to require more frequent verifications in between renewal periods. States would be encouraged to use available information (through “data matching”) to verify individuals’ compliance with the requirements. The provisions raise many operational and implementation questions, particularly considering the experience of Arkansas and Georgia with implementing work requirements through waivers:

  • Enrollee Awareness / Outreach. Requiring all states to impose Medicaid work requirements would require extensive outreach and education in every state. In Arkansas, lack of awareness and confusion about work requirements (imposed in 2018) were common. Despite robust outreach efforts, many enrollees in Arkansas were not successfully contacted. The state noted in a recent waiver request that its complex 2018 work requirement policies caused “confusion and uncertainty,” resulting in people not knowing whether they were subject to the requirements.
  • Exemptions. While proponents of work requirements describe them as applying to “able-bodied” adults, some people with disabilities (or serious or complex medical conditions) will be subject to the requirements, as they don’t meet criteria to receive SSI but qualify for Medicaid through the ACA expansion. Similar to the proposed federal legislation, Arkansas adopted safeguards including “medically frail” and “good cause” exemptions and “reasonable accommodations” to try to protect coverage of people with disabilities or other challenges; however, many enrollees struggled to access these safeguards and reported difficulties navigating the process to qualify for an exemption.
  • Data Matching. The bill raises questions about the capacity and ability of state systems (and staff) to accurately “data match” (e.g., using payroll and other data) the work or exemption status of millions of individuals. How effective states are with data matching will likely impact how many individuals will need to submit proof of work hours or exemption status, and ultimately the number of individuals at risk of losing coverage. States with older or weaker systems or less integration may be less effective. But even with effective systems, not all work can be verified through existing data sources. More informal work (like “gig work”) may lack traditional employment records or pay stubs and may not be reflected in state data systems. Many people with low incomes may have inconsistent hours or income, which could create additional hurdles. Arkansas successfully data matched about two thirds of enrollees, exempting them from reporting work hours or exemption status. Among those who had to actively report, about 70% did not obtain an exemption or report compliance, ultimately resulting in over 18,000 people losing coverage.  Arkansas recently highlighted (in its new waiver request) that limitations with “data matching” led to some individuals with medical conditions or disabilities that prevented them from working to “fall through the cracks” when the state implemented its work policies in 2018.
  • Verification at Application. Only one state (Georgia) has experience conditioning Medicaid eligibility at application on meeting work requirements. Over 18 months since Georgia launched its “Pathways” program, the state has only enrolled 7,000 individuals—far short of the state’s own estimated enrollment of 25,000 adults in the first year and 64,000 over 5 years. The state’s interim waiver evaluation revealed that work requirements had a significant impact on lowering program enrollment, particularly for adults ages 50-64.
  • Administrative Costs. Implementing work requirements involves complex systems changes (e.g., developing or adapting eligibility and enrollment systems), enrollee outreach and education, and staff training. According to GAO, federal and state administrative costs to implement Medicaid work requirements are sizeable. Recent investigative reporting found Georgia’s “Pathways” program has cost the federal and state government more than $86 million (as of the end of 2024), with three-quarters spent on consulting fees. GAO recently confirmed it is examining the costs of Georgia’s Pathway program, with a report expected this fall.
  • Targeted Work Supports. Research has shown that access to affordable health insurance and care promotes individuals’ ability to obtain and maintain employment, helping people manage chronic conditions and supporting people’s ability to work jobs that may be physically demanding. While most Medicaid adults are already working, some states have launched initiatives to support employment for Medicaid enrollees, without making employment a condition for eligibility. Montana created “HELP-Link,” a free voluntary workforce support program for eligible expansion adults (funded only with state dollars), which also helps participants address barriers to work including transportation and child care. A study of Montana’s Medicaid expansion, including HELP-Link, found an increase of four to six percentage points in labor force participation among low-income, non-disabled adults ages 18-64 following expansion, compared to higher-income non-Medicaid Montanans and to the same population in other states. While federal Medicaid funds cannot be used for work supports (e.g., to help individuals overcome barriers to work like child care and transportation), CBO has found that targeted work supports can help boost employment. Unlike welfare reform, the Medicaid work requirement in the reconciliation bill does not provide supports like child care, transportation, or job training.

The bill seeks to implement work requirements on a national scale, including requiring states to verify individuals’ monthly work status and implement a long list of exemptions—policies that proved challenging for Arkansas and Georgia to operationalize and led to 18,000 people losing coverage in Arkansas, without increasing employment. CBO’s hefty estimated federal savings from the proposed national Medicaid work requirements signals an expectation that the draft policies under consideration would result in significant coverage loss and prevent many people from enrolling.

Marketplace Enrollees with Unpredictable Incomes Could Face Bigger Penalties Under House Reconciliation Bill Provision

Published: May 19, 2025

New legislative proposals released this week could potentially expose Marketplace enrollees to higher costs if their income at the end of the year differs from what they originally estimated. Most Marketplace enrollees (92% in 2025) receive a tax credit to help pay their premiums, and the vast majority of those receive the credit in advance to lower their monthly payments, rather than when they file their taxes.

To receive the Advance Premium Tax Credit (APTC), Marketplace enrollees must estimate their income for the upcoming year. If, by the time they file their taxes over a year later, their income is different, they must reconcile the tax credit they received with what they were eligible for. This could result in receiving additional assistance or having to repay some or all of the credit back to the federal government. The ACA currently caps how much low and middle-income enrollees must repay. Currently, individuals with incomes between 100% and 400% of the federal poverty level (FPL) have a capped repayment amount, regardless of how much their income changes. Repayment limits range from $375 to $1,625 for an individual, on a sliding scale based on income. Premium tax credits are only available for people whose income is above the poverty level.

At least three current policy issues could affect Marketplace enrollees with volatile incomes:

  1. A recent Trump Administration proposed rule suggests there could be a widescale practice of people with incomes below poverty inflating their expected incomes to exceed the poverty level to gain eligibility for premium tax credits. In response, the proposed rule would require some applicants to submit additional documentation to support their expectation that their income will exceed poverty in the coming year. Additionally, individuals who do not file their taxes and reconcile their premium tax credits would become ineligible for these tax credits in future years. These potential changes could reduce federal spending on tax credits and address concerns about fraud, but could also pose challenges and reduce coverage for enrollees with less predictable income.
  2. Additionally, the House Reconciliation bill would codify the proposed rule described above. It would similarly require certain Marketplace applicants to present documentation verifying expected changes in their income before they can enroll in subsidized coverage. In addition it would eliminate repayment caps on the premium tax credit, meaning enrollees would have to repay the full amount of their excess premium tax credit.
  3. Later this year, enhanced premium tax credits are set to expire unless Congress extends them, meaning that tax credits will be lower for all subsidized enrollees and people with incomes over four times poverty will no longer be eligible for premium tax credits. Because the original ACA did not include any repayment caps for people with incomes over four times poverty, even a small increase in a household’s income putting them over that threshold would mean they have to pay back the entire premium tax credit.

To explore the challenges families may face in predicting their annual income, this analysis uses data from the 2023 Survey of Income and Program Participation (SIPP). It compares each family’s estimated annual income — based on the first three months of reported monthly income — to their actual income at the end of the year.

Key Findings

  • Many Americans experience high income volatility, in particular potential ACA Marketplace shoppers. One in five people aged 19-64 were in families that saw more than a 20% difference in their income, split approximately equally between people who ended up with higher income and those who ended up with lower income.
  • People with less stable work are more likely to have high income volatility. For example, among people aged 19-64, families in which someone lost a job were more likely to have a 20% swing in their family income.
  • For those near poverty, predicting annual income may be especially difficult. Many people with incomes just above poverty at the beginning of the year end up below poverty by the end of the year, and conversely many who start out with incomes below poverty end up with incomes above poverty. More than half (61%) of people with starting incomes below poverty end the year with an income more than 20% different than their income during the first three months of the year.

Income Volatility Among ACA Marketplace Shoppers:

Overall, one in five people (21%) aged 19-64 were in families that had high levels of income volatility, defined here as a difference of at least 20% between the estimated annual income based on the first three months of the year and the families’ actual income. People potentially shopping on the Marketplaces—those that had at least 6 months of non-group coverage or uninsurance—experience higher levels of income volatility than others. In 2023, more than one in four (26%) adults aged 19–64 with non-group coverage or who were uninsured for at least six months had high income volatility—higher than 18% among those with employer-based coverage.

Having an uninsured adult family member is associated with high income volatility: 29% people aged 19 to 64 in a family with at least one person who was uninsured for at least one month had high income volatility, compared to 19% for people in a family without an uninsured member during the year. In 2023, 9.5% of the population under age 65 were uninsured, the majority (73.7%) in families with at least one full-time worker in the family. Unaffordable coverage is the most cited reason for being uninsured.

Repayment caps currently in effect protect Marketplace enrollees with high levels of income volatility from large tax bills for excess premium tax credits. For example, consider a 56-year-old individual in Boulder County, CO, who estimated their annual income would be $40,000 (266% of the federal poverty level for 2025), but ultimately earned $55,000 (365% FPL). They would have received $7,123 in advance premium tax credits but were only ultimately eligible for $4,774—an excess of $2,349. Under current rules, their repayment would be capped at $1,625, limiting the amount they owe to about 3% of their income. If the repayment caps were eliminated, however, they would be responsible for repaying $2,349.

Marketplace Shoppers Are More Likely to Experience High Income Volatility

Income Volatility Among Families near Poverty:

People with family incomes close to the threshold for qualifying for a premium tax credit (100%) have particularly volatile incomes. Among adults aged 19–64 in families with incomes between 100% and 150% of FPL during the first three months of the year, nearly one-in-ten ended the year with incomes below the poverty line. Conversely, many people with incomes below poverty during the first three months of the year finish the year with an income above the poverty line (30%). These people may lose out on potential subsidized coverage if they had assumed that their income would be below poverty.

The high share of people near poverty moving across the poverty threshold reflects the significant income volatility many low-income families experience. 3 in 5 adults living in poverty (61%) and nearly one in three (31%) of those with incomes between 100% and 150% of the federal poverty level (FPL), saw their annual income differ by more than 20% from what they earned in the first three months of the year. Under current IRS rules, households that fall below the poverty line are not required to repay the full premium tax credit they received, as long as their income estimate was made in good faith.

Adults in Families With Incomes Close to the Federal Poverty Level Are More Likely to Experience High Income Volatility

Common Causes of Income Volatility:

A family’s poverty level can change for many reasons, including shifts in household income or changes in family structure, such as birth, marriage, or divorce. In some cases, such as among seasonal workers, families may anticipate uneven income over the year. In others, these changes are unexpected. Families with an adult that was laid off during the year were more likely to have high income variability. Among adults aged 19 to 64, 42% of those in families where someone was looking for work or had been laid off for at least three weeks during the year experienced high-income volatility, compared to 18% of those in families without such disruptions. Other factors associated with high income volatility among non-elderly adults included:

  • Involuntary job loss for someone in the family during the year (36% vs 19%)
  • Someone in the family having multiple jobs during the year (33% vs 16%)
  • Having someone in the family who was absent without pay from a job (32% vs 20%) for at least one week during the year.

Unpredictable annual income is often tied to the type of work someone does and how they are paid. For example, workers who are paid hourly but have irregular shifts may find it difficult to estimate their total earnings over the course of a year. Similarly, those in contract or gig economy jobs often don’t know in advance how many hours they will be able to work. Certain occupations are particularly associated with high income volatility: 38% of families with a packager, 32% with a landscaper or childcare worker, and 30% with a truck driver, food preparation worker, or security guard experienced high levels of income volatility. Additionally, 25% of households with a part-time worker had high income volatility.

Families Experiencing Job Instability Are More Likely to Face High Income Volatility

Families Whose Incomes Exceeds the APTC Eligibility Thresholds

In 2022, the Inflation Reduction Act increased premium tax credits for all subsidized enrollees and expanded eligibility for premium tax credits to individuals in families with annual incomes above 400% of the FPL for the first time, but this provision is set to expire after 2025. Unless extended, individuals who see income increases beyond 400% of poverty, may become ineligible for the tax credits that subsidized their coverage. Fifteen percent of adults aged 19 to 64 with incomes between 350% and 450% of FPL experienced high income volatility. Among families with incomes between 100% and 400% of FPL after the first three months of the year, 9% of adults ended the year above 400% of FPL, while 2% ended the year below the poverty line.

More than 1 in 10 Adults With Estimated Incomes Between 100% and 400% of Poverty End the Year Outside That Range

Without premium tax credits, many potential Marketplace shoppers may not have the financial resources to enroll in coverage. For others, the risk of misestimating their income—and facing large repayment obligations—may discourage them from applying. Current rules cap the amount that households with incomes between 100% and 400% of the federal poverty level (FPL) must repay if they receive excess premium tax credits. However, proposals included in the Ways and Means reconciliation bill would eliminate these repayment caps, potentially exposing households with volatile incomes to significant tax burdens.

Although repayment caps do not apply to households with incomes above 400% of FPL ($60,240 for an individual in 2025), the enhanced premium tax credits currently limit the amount such enrollees may need to pay for ACA Marketplace coverage. That is, even if their income exceeds expectations, they may remain eligible for some level of premium subsidy. For example, consider a family of three (aged 52, 52, and 19) in Kanawha County, WV, who estimated their income at $100,000 (387% FPL) but ultimately earned $105,000 (407% FPL). With the enhanced subsidies, they would receive a $34,463 premium tax credit but would have been eligible for $33,718—a difference of $745. They would be required to repay only the $745 when filing taxes—less than 1% of their annual income. If the enhanced subsidies expire, however, this family’s income above 400% of poverty would disqualify them for any tax credits . By falling off the subsidy cliff, they would be required to repay the entire premium tax credit of $34,463, or about 33% of their annual income.

Without Enhanced Subsidies, a Family of Three Whose Income Exceeds the Subsidy Cliff Must Repay All Financial Assistance Received

Methods

The Survey of Income and Program Participation (SIPP) reports the incomes and other characteristics for households and household members for each month during the year. The annual income used in this analysis approximates the modified adjusted gross income used to determine eligibility for premium tax credits. Total personal income during the reference year was summed up for each member of the family, except from the following sources:

  • Income received from means-tested transfer programs (including SSI, TANF, GA, and the Veterans Pension program)
  • Amount received from VA benefit payments for a service-connected disability, other VA payments, G.I. Bill benefits, or VA Insurance proceeds
  • Amount received in workers’ compensation, employer disability payments, or payments from a sickness, accident, or disability insurance policy
  • Amount received in survivor benefits from Veterans’ compensation or pension, income from a paid-up life insurance, Black Lung Benefits, workers’ compensation, or other survivor income
  • Amount of child support or alimony payments received

The estimated annual income of each family, based on its reported household income during the first three months of the year, was compared to the actual annual income of the family at the end of the year to see how well the early year income predicted the annual amount. Families where the annual income predicted by the first three months was either 20 percent below or above the actual annual amount were considered to have “high income volatility.”

Families were defined by SIPP and included in the analysis if they had data for 12 months, had at least one adult whose annual earned income exceeded $1000, and whose reference person was at least 15 years old; adults within a family were also required to have 12 months of data. The income to poverty ratio (%FPL) was calculated using the 2022 federal poverty guidelines and the estimated annual income from the first three months of the year.

10 Things to Know About U.S. Funding for Global Health

Published: May 15, 2025

Note: This resource does not reflect recent changes that have been implemented by the Trump administration, including a foreign aid review and restructuring. For more information, see KFF’s Overview of President Trump’s Executive Actions on Global Health. This resource was originally published on February 4, 2025, and will be updated as needed to reflect additional developments.

Introduction

U.S. engagement in global health is multifaceted and includes a broad range of activities, one of which is financially supporting health efforts worldwide. As the largest donor to global health in the world, the U.S. supports bilateral efforts, directly funding implementation of global health activities in partner countries, and multilateral health institutions (i.e., international organizations that pool support from multiple donors for one or more areas of global health). Here are 10 things to know about U.S. funding for global health:

1. U.S. global health funding totals approximately $12 billion but only represents less than 1% of the federal budget.

U.S. global health funding, most of which is part of the broader U.S. foreign aid budget that includes funding for development, economic, and humanitarian assistance programs, totaled $12.4 billion (through regular appropriations) in FY 2025 but accounted for less than 1% of the federal budget, which totaled approximately $1.6 trillion (see Figure 1). In some years, on top of regular appropriations, global health funding is also provided through emergency supplemental funding to address disease outbreaks, but this funding generally makes up a small piece of the federal budget pie.

Figure 1

U.S. Global Health Funding as a Share of the Federal Budget, FY 2025

2. U.S. funding for global health is complex!

Funding supports multiple program areas at several agencies and departments for both bilateral and multilateral efforts and is provided both annually and in emergency situations.

Program Areas

The U.S. government supports global health efforts aimed at addressing numerous areas, funding programs to address HIV (through PEPFAR, the President’s Emergency Plan for AIDS Relief), tuberculosis (TB), malaria (through PMI, the President’s Malaria Initiative), maternal and child health (MCH), nutrition, family planning and reproductive health (FP/RH), neglected tropical disease (NTDs),  global health security, as well as the vulnerable children program and other public health threats, which include programs for cross-cutting health activities like the Health Reserve Fund and the global health workforce through the Global Health Workforce Initiative (see more detail on program areas below).

Agencies/Departments

The U.S. supports these efforts via several agencies, departments, and accounts. Agencies and departments that receive funding for global health include the U.S. Department of State (State), U.S. Agency for International Development (USAID), Centers for Disease Control and Prevention (CDC), National Institutes of Health (NIH), and the Department of Defense (DoD). In addition, funding is provided through several accounts at State and USAID including: the Global Health Programs (GHP) account at State and USAID, Contributions to International Organizations (CIO) and International Organizations and Programs (IO&P) accounts at State, and the Assistance for Europe, Eurasia and Central Asia (AEECA), Development Assistance (DA), Economic Support Fund (ESF) and International Disaster Assistance (IDA) accounts at USAID (see more detail on agencies, departments, and accounts below).

Bilateral and Multilateral Funding

Funding is provided bilaterally, directly supporting the implementation of global health activities in almost 80 partner countries that span six regions across the globe (see more detail on bilateral efforts below), and multilaterally, providing support to international organizations that pool funding from multiple donors for one or more areas of global health. Multilateral health institutions the U.S. supports through financial contributions include the Global Fund to Fight AIDS, Tuberculosis and Malaria (Global Fund), Gavi the Vaccine Alliance (Gavi), United Nations Children’s Fund (UNICEF), World Health Organization (WHO), Pan American Health Organization (PAHO), Joint United Nations Programme on HIV/AIDS (UNAIDS), United Nations Population Fund (UNFPA), TB Drug Global Drug Facility, and the Pandemic Fund (see more detail on these multilateral health efforts below).

Regular Annual and Emergency Supplemental Appropriations

Finally, U.S. funding for global health is comprised of funding provided through the regular appropriations process, which takes place annually (see more detail on the federal budget process below), and through emergency supplemental funding for disease outbreaks, which often takes place during public health emergencies.

3. U.S. global health funding is determined annually through a multi-step process that involves the President and Congress.

U.S. funding for global health is discretionary1  and determined annually through the U.S. federal budget process, which is initiated by the President and is ultimately set by Congress (see Table 1), which specifies most, but not all, funding (about 99% each year) by agency and program area in annual appropriations bills. Funding for some global health activities that are not specified by Congress are determined at the agency level (more details in the following section).

Timeline of the U.S. Annual Federal Budget Process

The President’s request often differs from Congress’ enacted levels; in some years, the difference between the request and enacted levels is negligible, while in others, it is significant. For instance, from FY 2018 – FY 2021, the President’s request was significantly lower than what Congress ultimately approved (see Figure 2). Until recently (FY 2023 and FY 2024), Congress provided higher funding levels than the President’s request over the past decade.

Figure 2

U.S. Funding for Global Health, Request vs. Enacted Levels, FY 2015 - FY 2024

4. The majority of U.S. funding for global health is channeled through the Department of State and U.S. Agency for International Development.

The U.S. government funds and carries out its global health efforts through multiple agencies and departments, although most funding is provided by Congress to the Department of State (State) (52%), which advances U.S. objectives and interests worldwide through developing and implementing the President’s foreign policy; followed by the U.S. Agency for International Development (USAID) (33%), which supports long-term and broad-based economic growth in countries and advances U.S. foreign policy objectives; National Institutes of Health (NIH) (7%), which conducts biomedical and behavioral science research and is one of the world’s leading research entities on global health; and Centers for Disease Control and Prevention (CDC) (6%), which focuses on disease control and prevention and health promotion. In addition, a small portion (2.5%) of global health funding is channeled through the Department of Defense (DoD) (see Figure 3).

Figure 3

U.S. Global Health Funding, by Agency, FY 2025

As mentioned earlier, most global health funding amounts are specified by Congress in annual appropriations bills, though some amounts are determined at the agency-level (see Table 2). State and USAID funding is provided in the State, Foreign Operations and Related Programs (SFOPs) appropriations bill; CDC and NIH funding is provided in the Labor, Health and Human Services (Labor HHS) appropriations bill, and DoD funding is provided in the Department of Defense appropriations bills. Within these bills, Congress specifies funding levels for global health program areas (e.g. HIV, TB, MCH, GHS, etc.) under the Global Health Programs (GHP), Contributions to International Organizations (CIO) and International Organizations and Programs (IO&P) accounts at USAID and State as well as for global health programs at CDC. Congress does not specify global health funding amounts under some accounts at USAID2  and some amounts3  at NIH and DoD, and instead provides this authority to the administration.

Appropriations Bills, U.S. Government Agencies and Departments, and Accounts that Provide U.S. Global Health Funding

5. Global health funding has been mostly flat for more than a decade with some exceptions, including increases in some years to respond to outbreaks and for some program areas.

The U.S. investment in global health grew significantly in the early 2000s, in large part because of the creation of major global health organizations and initiatives like the Global Fund in 2001 and PEPFAR in 2003. However, funding has been relatively flat since 2010, with spikes in some years due to the U.S. emergency response to disease outbreaks. U.S. global health funding is comprised of funding provided through the regular appropriations process, with additional funding provided some years through emergency supplemental funding for disease outbreaks, such as Ebola (FY 2015), Zika (FY 2017), and COVID-19 (FY 2020-2021). All additional funding provided through emergency supplemental appropriations must be approved by Congress, and this funding is on top of any regularly appropriated funding. Overall, global health funding reached its highest level to date in FY 2021, largely due to the U.S. global response to the COVID-19 pandemic (that year, emergency funding represented 45% of U.S. global health funding and regular appropriations accounted for 55%); without emergency funding, the high point was in FY 2023 ($12.9 billion). In FY 2025, global health funding was provided through a continuing resolution (CR) which maintained the prior year (FY 2024) amount of $12.4 billion (see Figure 4).

Figure 4

U.S. Funding for Global Health, FY 2006 - FY 2025

6. Bilateral HIV accounts for the largest share (nearly 50% through regular appropriations) of U.S. global health funding.

The majority of U.S. global health funding is provided for specific areas including bilateral HIV or PEPFAR, tuberculosis, malaria or PMI, maternal and child health, nutrition, family planning and reproductive health, neglected tropical disease, and global health security (see Table 3), with some additional funding provided for other efforts including contributions to the World Health Organization (WHO) and Pan American Health Organization (PAHO).4 

Since FY 2006, most U.S. global health funding over time through regular appropriations has been directed to bilateral HIV programs, accounting for approximately 50% of U.S. global health funding in most years (see Figure 5). The Global Fund (learn more about the Global Fund in the multilateral discussion below) accounted for the next largest share over the period, followed by maternal and child health and malaria. More recently, the U.S. has emphasized global health security more, with funding for these efforts increasing considerably during the COVID-19 pandemic and afterward. Consistent with this trend, in FY 2025, the latest year of data available, most funding was provided to HIV efforts ($5.4 billion or 44%), followed by the Global Fund ($1.7 billion or 13%) and maternal and child health and global health security (both $1.3 billion or 10%) (see Figure 6). These shares may differ during times of emergency, when significant funds have been provided on a one-time basis to address emerging outbreaks.5 

Key Program Areas of U.S. Global Health Funding

Figure 5

Distribution of U.S. Global Health Funding, by Program Area, FY 2006 - FY 2025

Figure 6

U.S. Global Health Funding (in millions), By Program Area, FY 2025

7. Most U.S. global health funding (approximately 80%) is for bilateral programs reaching almost 80 countries in six regions.

In FY 2023, the most recent year country-specific amounts are available, 81% of U.S. global health funding was provided bilaterally (country-to-country, directly funding implementation of global health activities in partner countries) spanning six regions (see Figure 7). While this funding was directed to almost 80 countries, with additional countries receiving support through U.S. regional programs and contributions to multilateral organizations, ten countries accounted for almost 60% of U.S. bilateral support for global health (Figure 8).

Looking by region, most U.S. bilateral support for global health programs in FY 2023 was provided in sub-Saharan Africa (84%), followed by South and Centra Asia (5%) and the Western Hemisphere (4%) (Figure 9). Looking by income, the majority (88%) of U.S. funding for global health was provided to low and lower-middle-income countries (46% and 42% respectively) (see Figure 10).

Figure 7

Countries Where the U.S. Operates Global Health Programs, by Region, FY 2023

Figure 8

Top 10 Recipient Countries of U.S. Global Health Funding, FY 2023

Figure 9

U.S. Global Health Funding, by Region, FY 2023

Figure 10

U.S. Global Health Funding, by Income, FY 2023

8. Approximately a fifth of U.S. global health funding supports multilateral organizations.

While the majority of U.S. funding for global health is provided bilaterally (81%), the U.S. has a long history of engagement with multilateral health organizations, which pool support from multiple countries for one or more areas of global health, and provides about a fifth (19%) of its global health funding to support6  these institutions (see Figure 10). Multilateral initiatives complement U.S. bilateral global health efforts, helping make progress toward U.S. goals in various program areas, and in some cases, multilateral support allows the U.S. to reach a larger number of countries.

As mentioned earlier, multilateral health institutions the U.S. supports include the Global Fund to Fight AIDS, Tuberculosis and Malaria (Global Fund), Gavi the Vaccine Alliance (Gavi), United Nations Children’s Fund (UNICEF), World Health Organization (WHO), Pan American Health Organization (PAHO), Joint United Nations Programme on HIV/AIDS (UNAIDS), United Nations Population Fund (UNFPA), TB Drug Global Drug Facility, and the Pandemic Fund (see Table 4). The Global Fund is the largest multilateral recipient by far of U.S. global health funding followed by Gavi (see Figure 11).

The U.S. provides funding to these organizations every year, with the exception of UNFPA due to ongoing political debates about abortion and the invocation of the Kemp-Kasten Amendment, which has been used by the President to prohibit funding to UNFPA in some years (see the KFF Kemp-Kasten explainer for more detail). During its first term, the Trump Administration also temporarily suspended funding to the WHO in 2020, though these actions were reversed by the Biden Administration in 2021 and the funding was ultimately provided. Most recently in 2025, as one of the first actions taken during its second term, the Trump Administration issued an executive order to formally withdraw from the WHO and suspend funding. In addition, the Pandemic Fund, a newer multilateral financing mechanism launched in 2022 aimed at helping countries build their capacity to prevent, prepare for, and respond to epidemics and pandemics, has not received funding from the U.S. since 2022. However, Congress has included provisions in recent appropriations bills to transfer up to a certain amount of global health funding toward the entity if a public health emergency arises.

Nevertheless, the U.S. is often the largest or one of the largest donors to multilateral health efforts. For example, compared to other donors, the U.S. ranks first in donor support to the Pandemic Fund (accounting for 41% of its funding), the WHO (accounting for 14% of its funding), and the Global Fund (accounting for 33% of its funding) and third in donor support to Gavi (accounting for 13% of its funding). In 2025, several of these multilateral health institutions will have replenishment conferences where the U.S. and other donors will pledge their support for the next funding cycle (see the KFF tracker on U.S. support to four multilateral health institutions).

Multilateral Health Organizations the U.S. Financially Supports

Figure 11

U.S. Global Health Funding (in millions), Bilateral and Multilateral Share, FY 2025

9. The U.S. provides over 40% of total donor government assistance for global health.

The U.S. plays an integral role in international assistance for health and provides support for global health in the form of Official Development Assistance (ODA) for health. ODA is financial support from donor governments to low- and middle-income countries for areas such as economic development, health, education, governance, or infrastructure, which is provided both bilaterally and through multilateral organizations. The U.S. is the largest donor to global health, providing 42% of all international health assistance among major donor governments (see Figure 12).7  In addition, the U.S. has historically devoted a larger share of its foreign assistance to health than any other donor government, contributing almost 30% of its foreign assistance to global health in 2023 (see Figure 13).

Figure 12

US. was the Largest Donor Government of International Health Assistance in 2023

Figure 13

Donor Governments with the Largest Share of Development Assistance Directed to International Health in 2023

10. Congress and the Administration can place requirements and/or restrictions on U.S. global health funding.

Congress: In addition to specifying funding levels for global health programs, Congress can also specify statutory requirements and policy provisions that:

  • direct how funds are spent,
  • determine which organizations receive funding, and
  • shape the implementation and scope of global health activities.

For instance, one statutory requirement that directs how U.S. foreign assistance, including global health funding, is spent is the Helms Amendment, which prohibits the use of foreign assistance to pay for the performance of abortion as a method of family planning or to motivate or coerce any person to practice abortion. In terms of more general global health policy provisions included in appropriations bills, an example of a common provision is one that directs agencies to provide reports to Congress on certain program areas. A more recent policy provision included in the FY 2024 appropriations bill was a one-year reauthorization of PEPFAR.

Administration: The administration can also place requirements and restrictions on global health funding. For instance, starting with the Reagan administration, the “Mexico City Policy” (MCP)8  has required foreign NGOs to certify that they will not “perform or actively promote abortion as a method of family planning” using funds from any source (including non-U.S. funds) as a condition of receiving U.S. global health assistance. It has been instituted and rescinded along party lines, and expanded over time, by executive action shortly after a new administration takes office. More recently, the Trump administration issued an executive order initiating the U.S. withdrawal from the World Health Organization (WHO) and halting all funding to the multilateral organization.

  1. As opposed to mandatory funding, which is funding that is dictated and set by law. Mandatory spending, which includes funding for entitlement programs such as Social Security, Medicare, Medicaid, and veteran’s programs, remains essentially unchanged from year to year, as funding levels for these programs are set by the laws that authorize and govern them. ↩︎
  2. Congress specifies some Economic Support Fund (ESF) funding amounts at USAID (i.e. funding for family planning and reproductive health through the ESF account is often specified by Congress but funding for HIV through this account is not specified by Congress) and does not specify funding amounts for the Assistance for Europe, Eurasia and Central Asia (AEECA), Development Assistance (DA), and CIO accounts at USAID. ↩︎
  3. Congress specifies some funding amounts for NIH and DoD in annual appropriations bills, including funding for the Fogarty International Center (FIC) at NIH and funding for global HIV at DoD. ↩︎
  4. Areas that receive global health funding and are not a part of the key program areas listed were combined into an “other” category. “Other” includes U.S. contributions to the World Health Organization (WHO) and Pan American Health Organization (PAHO), as well as funding for the Emergency Reserve Fund, which was created in the FY 2017 Omnibus bill to respond to contagious infectious disease outbreaks and would be made available if there is an “emerging health threat that poses severe threats to human health.” It also includes funding for “other public health threats,” which includes funding for health activities that are not consistently a line item within the U.S. budget (for example, in the FY 2024 budget, the U.S. provided funding to cross-cutting health activities through the Health Reserve Fund and to the global health workforce through the Global Health Workforce Initiative). ↩︎
  5. In the years where emergency supplemental funding for disease outbreaks has been provided, funding has gone to general global health activities, though sometimes funding is provided for specific global health programs including bilateral HIV (i.e. through emergency COVID-19 funding in FY 2021), the Global Fund (i.e. through emergency COVID-19 funding in FY 2021), and global health security (i.e. through emergency Ebola funding in FY 2015, FY 2018, and FY 2019; emergency Zika funding in FY 2016; and emergency COVID-19 funding in FY 2021). ↩︎
  6. Represents “assessed” or “core” funding— funding that is specified by Congress and generally used to support essential functions and operations. The U.S. also provides funding to multilateral organizations through “voluntary” or “non-core” contributions—funding that is used for specific projects or initiatives the U.S. seeks to support. Unlike core funding, non-core funding is not specified by Congress in annual appropriations bills. ↩︎
  7. Totals are based on Official Development Assistance (ODA) amounts as reported by donor governments to the Organisation for Economic Co-operation and Development (OECD) and include bilateral disbursements for health as well as the health-adjusted share of core contributions to multilateral organizations. Bilateral health amounts are based on three OECD sectors from the Credit Reporting System (CRS) database: (1) Health; (2) Population Policies & Programs and Reproductive Health (includes HIV/AIDS & STDs); and (3) Other Social Infrastructure and Services – Social Mitigation of HIV/AIDS. The health-adjusted share of donor government core contributions to multilateral organizations is calculated by applying the health share of a multilateral organization’s total disbursements (as reported in the CRS database) to the donor government’s core contribution for that multilateral organization (as reported in the OECD’s “Member use of the multilateral system” database). ↩︎
  8. The Mexico City Policy was renamed “Protecting Life in Global Health Assistance” by President Trump during his first term. ↩︎

Major Federal and State Funding Cuts Facing Planned Parenthood

Published: May 15, 2025

Planned Parenthood clinics have provided sexual and reproductive health services across the country since 1916 and currently serve over 2 million patients a year through close to 600 clinics across the United States. In many communities Planned Parenthood is the only clinic offering reproductive health care, including contraception, sexually transmitted infection testing and treatment, abortion services, pregnancy testing, cancer screenings like Pap smears and breast exams, and other preventive services. One third of Planned Parenthood’s revenue comes from state and federal government funding, including Medicaid, to provide health care services. According to Planned Parenthood’s 2022-2023 Annual Report, abortion services make up 4% of all the health services they provide, and federal funds rarely go toward abortion care (only in cases of rape, incest and life-threatening situations). The vast majority of the state and federal funding goes to reimburse reproductive and preventive services. “Defunding” Planned Parenthood has long been a priority of Republican leadership at both state and federal levels and was highlighted as a priority in Project 2025. There are currently multiple efforts at the federal and state level to limit funding to Planned Parenthood.

According to newly released KFF Health Tracking Poll data, one in three women (32%) say they have gone to a Planned Parenthood clinic for care, as well as one in ten men (11%) (Figure 1). Nearly half of Black women have gone to a Planned Parenthood clinic. Over four in ten individuals with Medicaid say they have received services at Planned Parenthood and one third of those with private insurance. One in five Republican women and four in ten Democratic women have received care at a Planned Parenthood clinic.

One in Three Women Have Received Health Care Services at a Planned Parenthood Clinic

There are currently three major efforts underway to cut funding to Planned Parenthood that could result in major reductions in services and staff, and ultimately, could result in clinic closures.

1. Medicaid

There have been efforts by anti-abortion groups and policymakers to exclude Planned Parenthood clinics from participating in the Medicaid program for many years because of their involvement in the provision of abortion services, even though federal funds cannot be used to pay for abortion services outside of cases of rape, incest, and life endangerment. KFF analysis shows that in 2021, one in 10 women on Medicaid who obtained family planning services got their care at Planned Parenthood. The share ranges from three in ten women with Medicaid in California (29%), to no women in in North Dakota and Wyoming where Planned Parenthood does not have a presence. Among the Medicaid patients who used Planned Parenthood for their family planning care, 85% obtained contraceptive services and about half got STI and/or gynecological care (Figure 2).

The Majority of Medicaid Beneficiaries Who Received Family Planning Services at a Planned Parenthood Clinic Received Contraceptive and STI Services

Republicans in Congress are currently considering a reconciliation financing bill that would ban federal Medicaid payments to Planned Parenthood and other Medicaid essential community providers across the country for services they provide to Medicaid beneficiaries. The Congressional Budget Office estimates that this will increase federal Medicaid spending by $300 million over ten years. In 2017, when Republicans were in the majority, they made a similar attempt to exclude Planned Parenthood from Medicaid via the reconciliation bill to repeal and replace the Affordable Care Act. While that bill did not pass, it would have cut off all federal payments to Planned Parenthood, including Medicaid reimbursement for contraceptive, STI, and preventive care for one year. The network of safety net providers, including health centers, health departments, and outpatient hospital sites likely would not have had the capacity to fully absorb the loss of Planned Parenthood in many communities in 2017, nor would they today. Prior research in Texas found that removing Planned Parenthood from the Texas family planning waiver program resulted in reduced contraceptive continuation and an increase in Medicaid covered births.

Several states have also attempted to exclude Planned Parenthood from their state Medicaid programs. Texas eventually terminated Planned Parenthood from its full-scope Medicaid program in 2021, and other states (South Carolina, Idaho, Tennessee) also have pending Section 1115 waiver applications at Centers for Medicare & Medicaid Services that would allow them to do the same. The Supreme Court is currently considering a case about South Carolina’s efforts to exclude Planned Parenthood from participating in their state’s Medicaid program and whether Medicaid beneficiaries can sue if they cannot freely choose their provider so long as they are willing and qualified to provide care, which is one of the federal provisions of the Medicaid law. The Supreme Court will likely rule on this in June and if the court rules in favor of South Carolina, states will have greater latitude to exclude Planned Parenthood from their Medicaid program.

2. Title X

The Trump Administration is currently withholding Title X funds from all nine of the Planned Parenthood grantees in the Title X program, which amounts to $20.6 million to provide services to low-income and uninsured people, saying the grantees are not aligned with the president’s opposition to Diversity, Equity, and Inclusion. In addition, other grantees that include Planned Parenthood clinics in their networks have received notices that that their funding is being withheld. Altogether, 144 Planned Parenthood clinics in 20 states are affected by the Title X decision to withhold funding (Figure 3).

Figure 3

While Title X makes up a smaller share of funding that supports services at Planned Parenthood clinics compared to Medicaid, these funds enable clinics to provide free and low-cost contraceptive methods, STI testing and treatment, pregnancy tests, cancer screenings like Pap smears and breast exams, and other preventive services. Already, two Planned Parenthood clinics in Utah and four Planned Parenthood clinics in Michigan have announced they will close due to Title X funds being withheld.

President Trump’s budget proposes terminating the $286 million appropriation for the Title X program. Furthermore, Project 2025 calls for reinstating the Title X regulations from the first Trump Administration that prohibited clinics from participating in the program if they had co-located abortion services or provided abortion referrals. This blocked 410 Planned Parenthood clinics from participating in Title X funding until the Biden Administration reversed the Trump Administration regulations.

3. Teen Pregnancy Prevention

Six Planned Parenthood affiliates receive funds from the Federal Teen Pregnancy Prevention (TPP) program to implement programs and develop, test, and evaluate innovative approaches to prevent teen pregnancy across the United States. These grantees, funded in 2023, have received $5.6 million annually to reach populations with the greatest unmet need with the goal of improving the optimal health of adolescents and reducing teen pregnancies and sexually transmitted infections.

On March 31, 2025, the TPP grantees were notified that the continuation applications due on April 15, 2025, would require them to demonstrate alignment with current Presidential Executive Orders, many of which are in direct conflict with the content in the evidence-based programs the grantees are funded to implement. This includes Executive Orders that ban the promotion of racial equity and gender inclusivity, current tenets of the TPP program (and also the care provided by family planning clinics). The funding opportunity the grantees applied under was called “Advancing Equity in Adolescent Health through Evidence-Based Teen Pregnancy Prevention Programs and Services” and applicants had to demonstrate as part of their grant application the extent to which they were committed to advancing health equity. Five of the six Planned Parenthood TPP grantees have filed a lawsuit against the Trump administration asking the Court to set aside the new alignment requirements and order HHS to allow grantees to continue receiving funding under the initial grant agreement. President Trump’s budget also proposes eliminating the Teen Pregnancy Prevention program along with Title X.