Key Takeaways
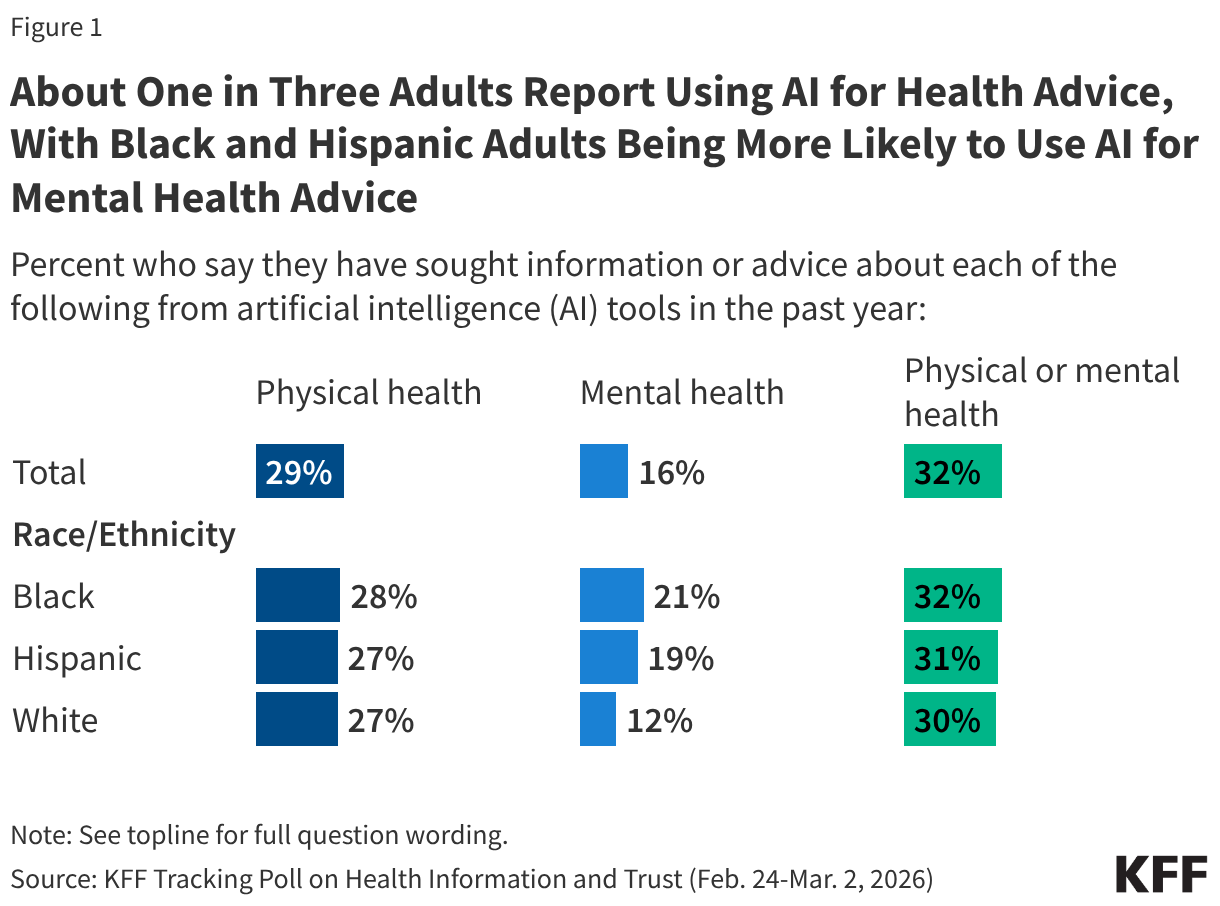
- About four in ten (41%) U.S. adults say they support the Make America Healthy Again (MAHA) movement – a group largely made up of Republicans and supporters of the Make America Great Again (MAGA) movement. Yet, many of the concerns elevated by the MAHA movement about food safety and corporate influence resonate with a larger share of the public beyond those who identify as supporters. Majorities of the public say there is not enough regulation of chemical additives in food (75%) or of pesticides used in agriculture (64%) in the U.S., and most adults express distrust in agricultural, food, and pharmaceutical companies to act in the public’s best interest. At the same time, confidence in the government agencies that are tasked with regulating these industries is low across partisans; about a third of the public express confidence in the FDA (36%) and the EPA (36%) to act independently without outside interference.
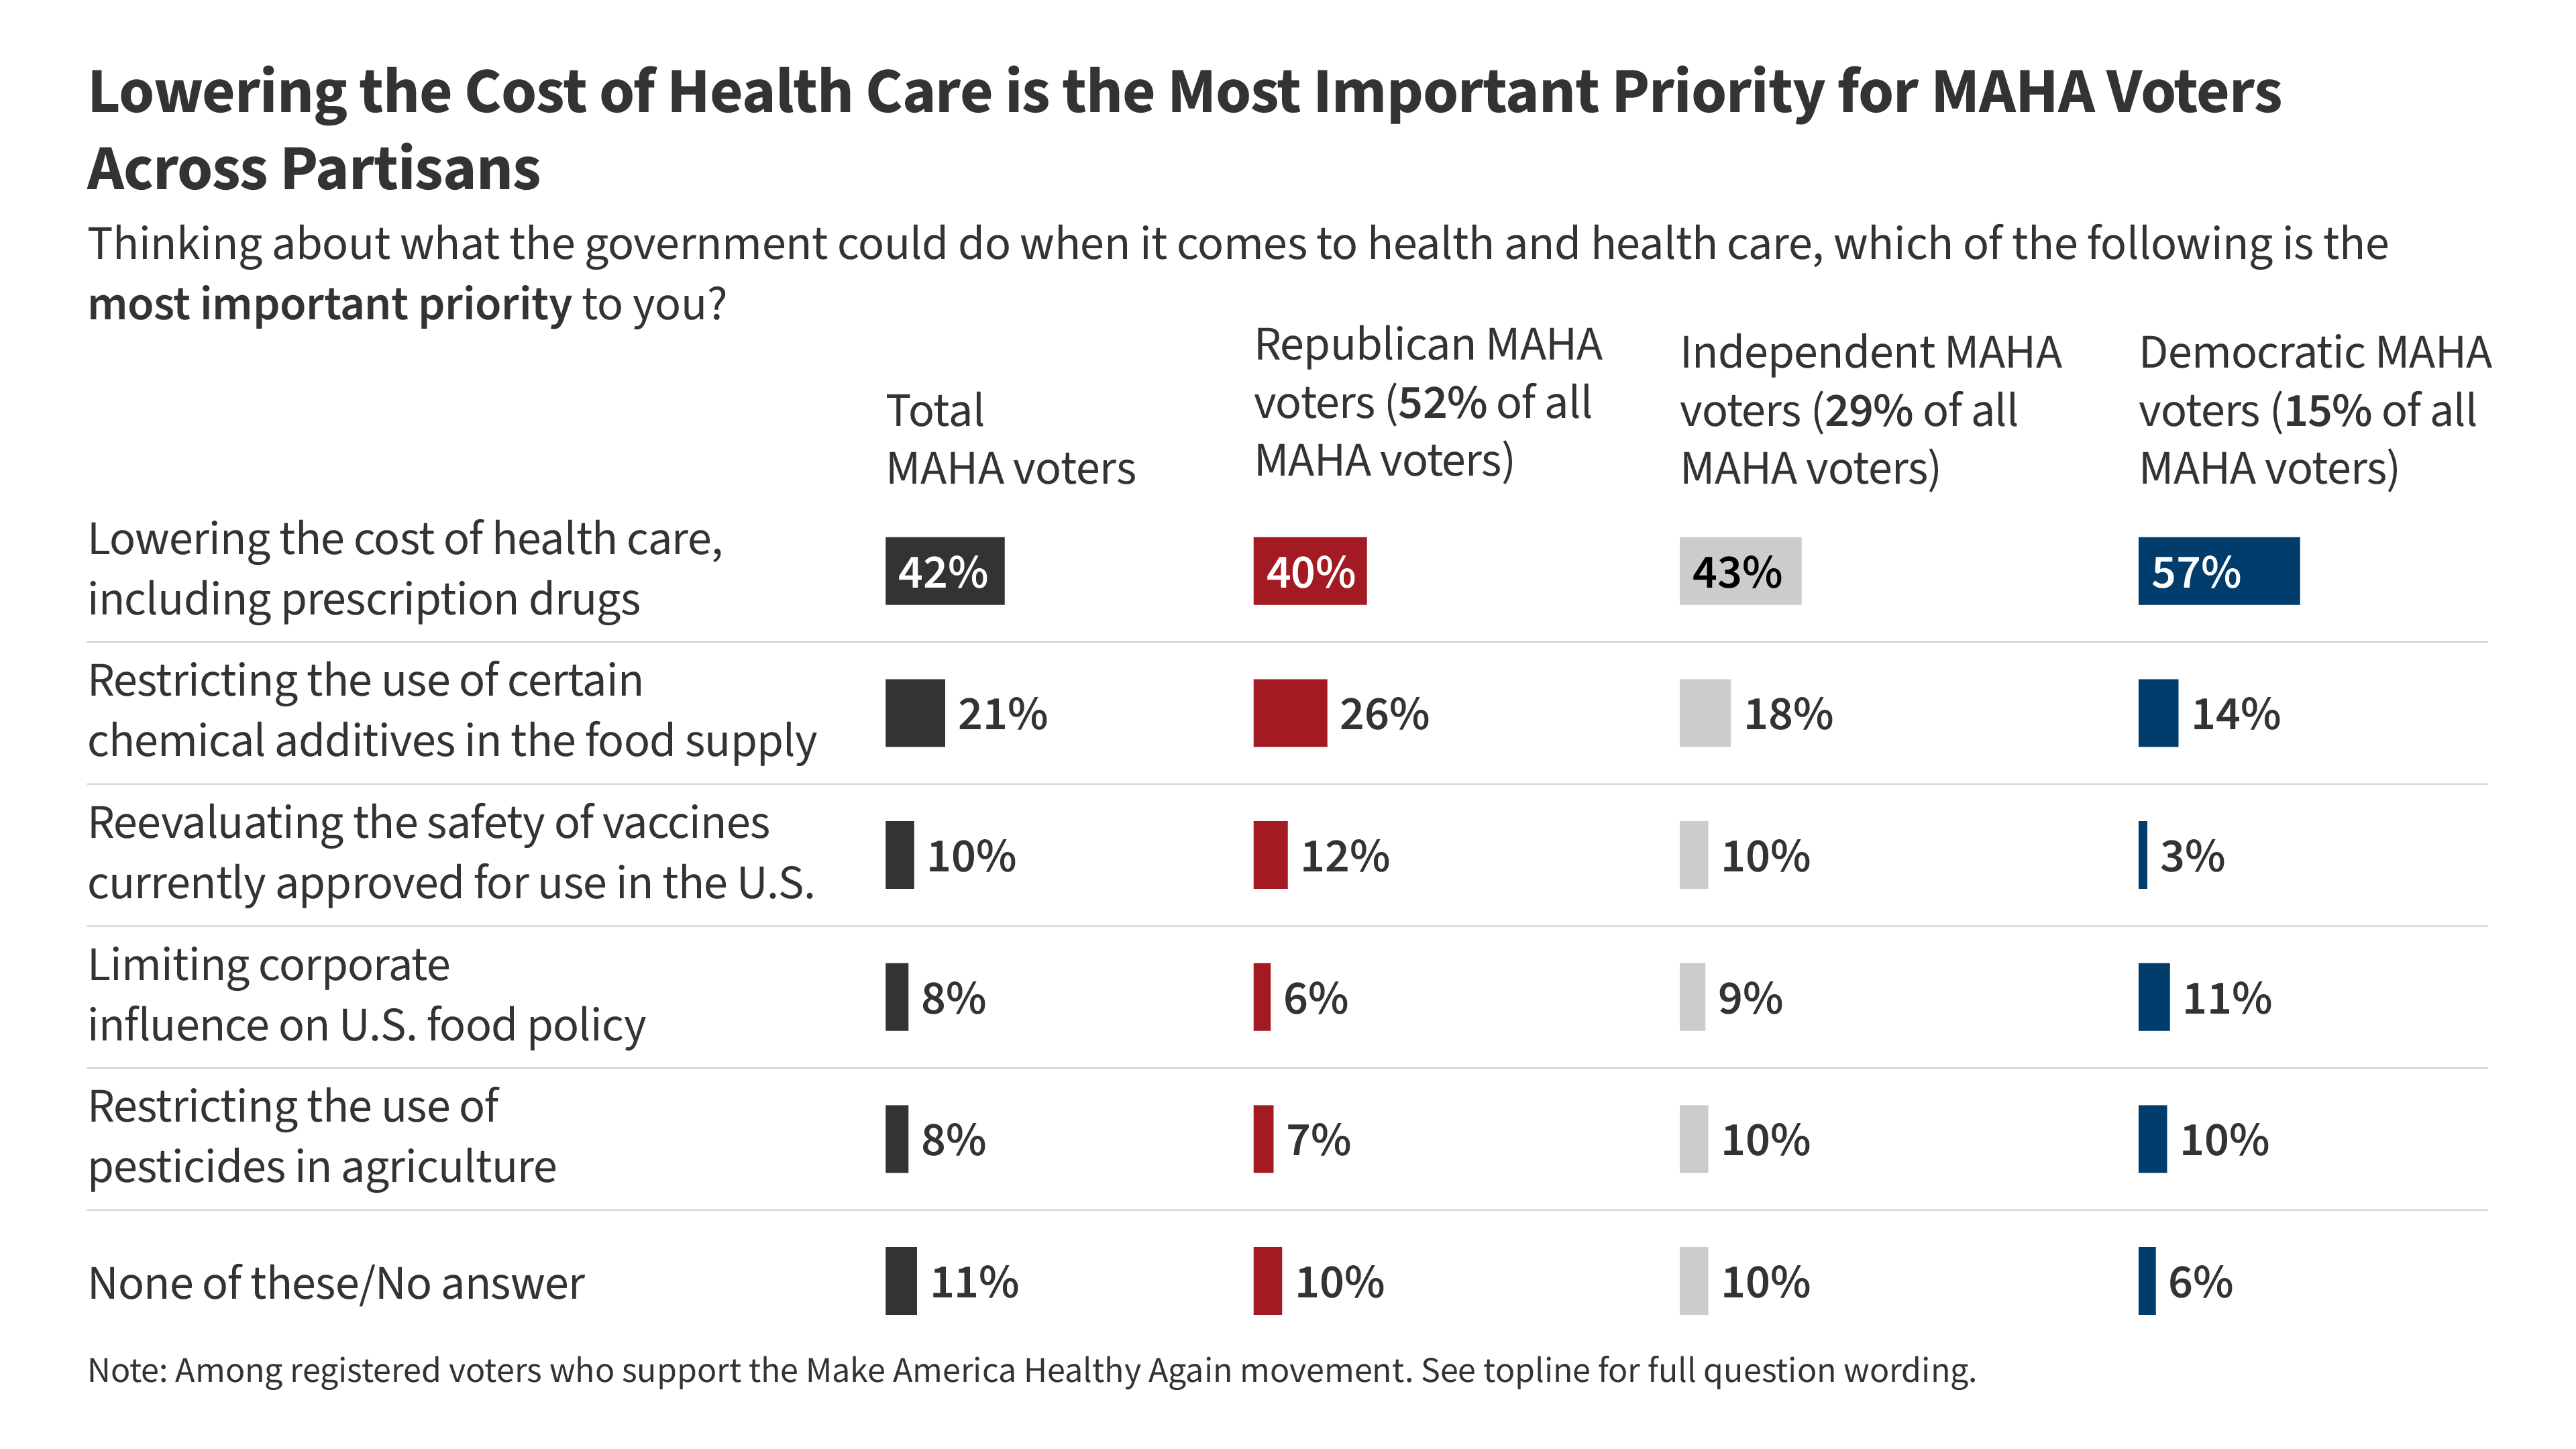
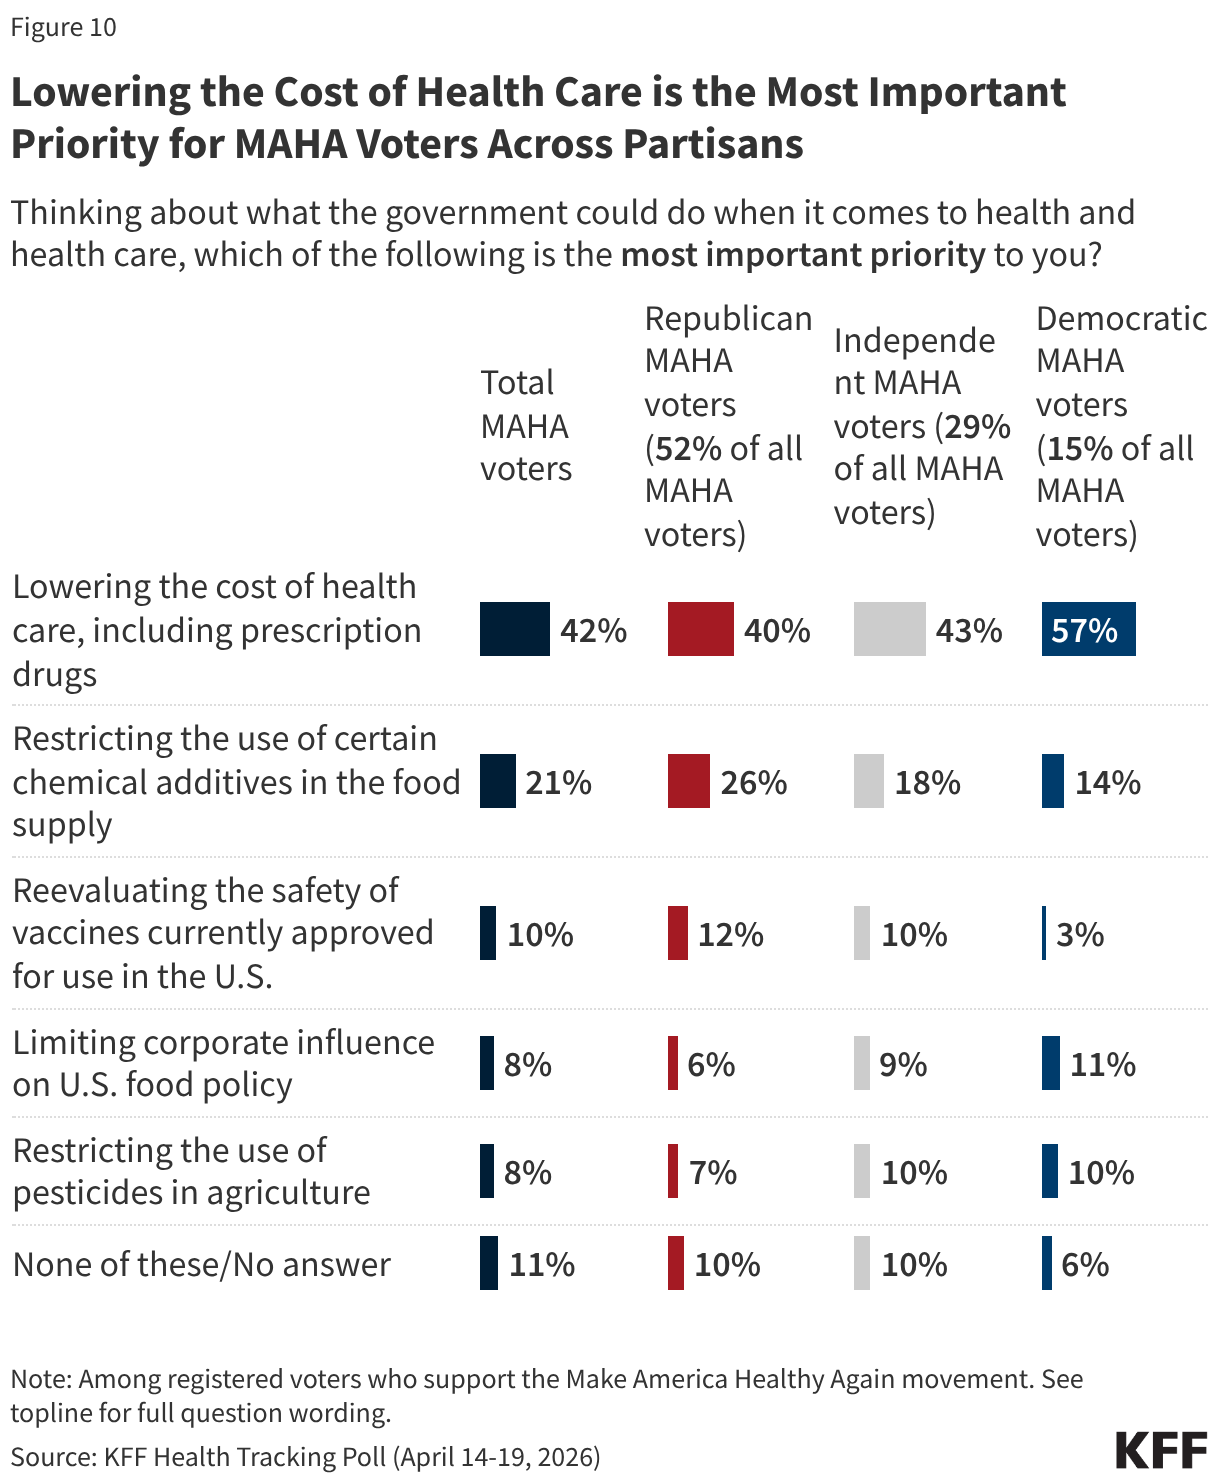
- Even as MAHA issues resonate, the cost of health care is a more prominent focus for voters than issues like food and vaccine policy. Most voters say health costs will have a “major impact” on their decision to vote (55%) and who they vote for (61%) in November, compared to about four in ten who say the same of vaccine or food policy. Even among voters who support the MAHA movement, health care costs are the dominant priority by a wide margin when compared with other areas of health. When asked to select the most important health priority for the federal government, four in ten MAHA voters (42%) choose lowering health costs, twice the share who choose restricting chemical additives in the food supply (21%) and far outranking other MAHA priorities like reevaluating vaccine safety (10%), limiting corporate influence in U.S. food policy (8%), or restricting pesticide use in agriculture (8%).
- Voters overall give the Trump administration low approval ratings on two key health areas elevated by the MAHA movement; about four in ten approve of the administration’s handling of vaccine policy (38%), and fewer than half approve of the administration’s handling of food policy (46%). The Democratic Party holds the advantage over the Republican Party in who voters trust to handle vaccine policy (41% vs. 25%) and to ensure federal health agencies act independently without corporate influence (33% vs. 24%). Voters are more evenly divided on whether they trust Democrats (31%) or Republicans (27%) to handle the safety of food additives and pesticides, or neither party (31%).
Who Are MAHA Supporters?
Make America Healthy Again (MAHA) is the political and public health movement promoted by the Trump administration and led by Health and Human Services (HHS) Secretary Robert F. Kennedy Jr. The movement has elevated issues such as vaccine safety, the role of corporate interests in federal health agencies, and the presence of chemical additives and pesticides in the food supply. KFF’s latest Health Tracking Poll shows about four in ten adults say they are supporters of the MAHA movement, but some of the concerns elevated by the MAHA movement resonate well beyond its core supporters.
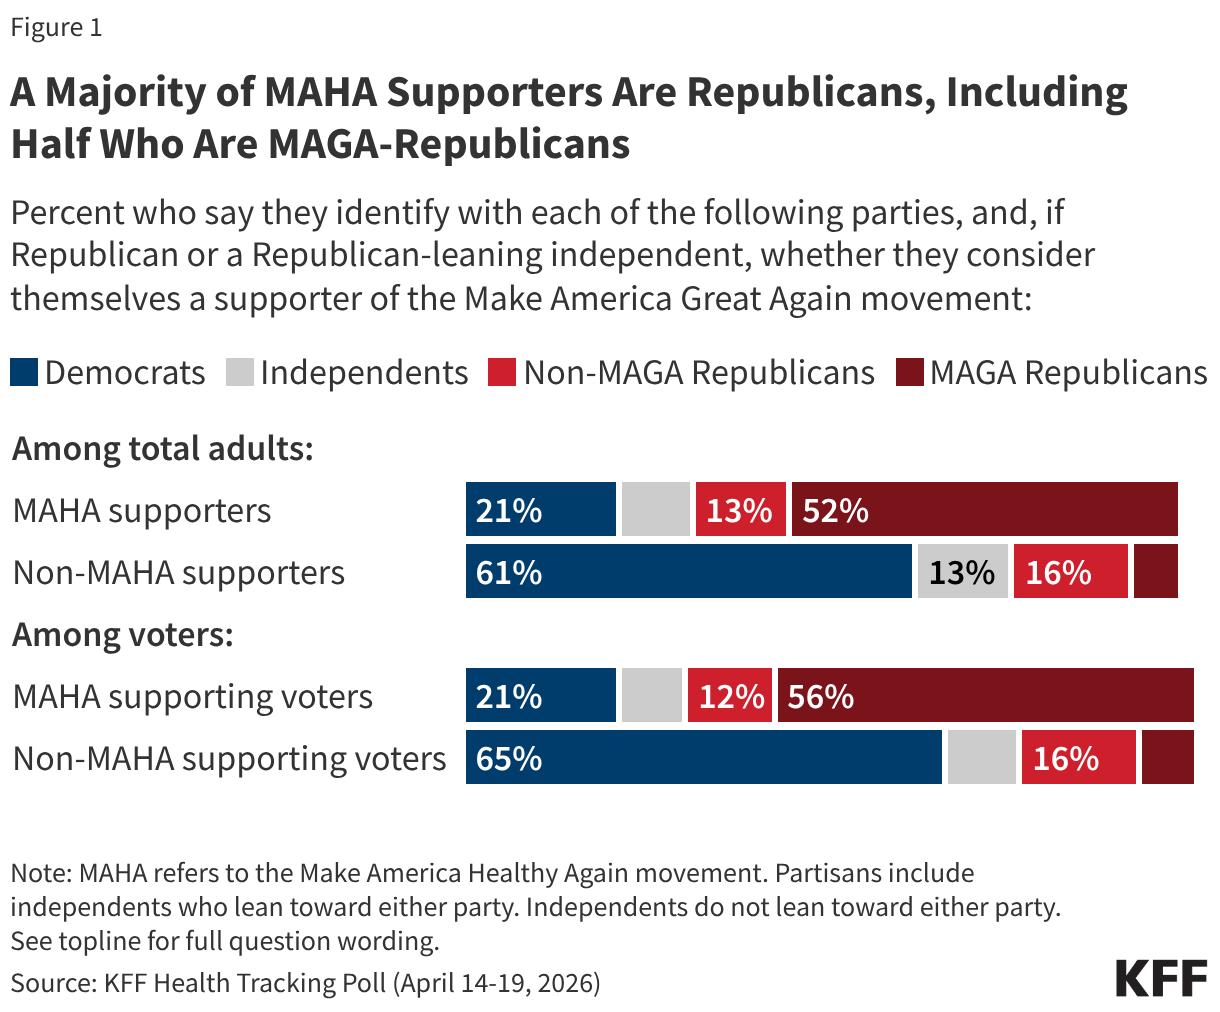
Overall, about four in ten (41%) adults – and a similar share of voters (43%) – say they are supporters of the MAHA movement, with support closely tied to partisanship and support of the Make America Great Again (MAGA) movement. Two-thirds of MAHA supporters identify as Republican or Republican-leaning independents, including about half (52%) who are supporters of the MAGA movement. Far fewer MAHA supporters are Democrats or Democratic-leaning independents (21%) or independents who do not lean toward either political party (10%). Among registered voters who support MAHA, the partisan composition is similar.
Among MAHA-supporting voters, just over half say they “strongly” support the movement (55%) and 45% say they “somewhat” support it, translating to about one in four voters overall as strong MAHA supporters (24%) and one in five who “somewhat” support it (19%).
When asked specifically why they support the MAHA movement, supporters give a range of answers, with the two most common relating to generally wanting people to be healthier (19%) and removing or regulating harmful substances in food (15%). Some MAHA supporters mention improving nutritional habits for Americans (7%) or lowering obesity rates (7%). Five percent of MAHA supporters cite health care access and affordability as their reasons for supporting the movement, despite the MAHA movement’s lack of focus on these issues. Just 4% of MAHA supporters cite vaccines and medical choice as their reason for supporting the movement. Few MAHA supporters specifically express support for President Trump or HHS Secretary Robert F. Kennedy Jr. (2%) as their reasoning for supporting the movement.
In Their Own Words: What is the Main Reason You Support the MAHA Movement?
“It is morally correct. We don’t want to poison our kids with vaccines they don’t need. We don’t want to eat food that leads to morbidity to make companies’ profit margins higher,” 43-year-old Republican man, Pennsylvania
“America uses far too much harmful ingredients that most other countries ban,” 28-year-old independent man, Indiana
“To get people healthier so taxpayers don’t have to pay for their health care,” 58-year-old Republican woman, Kentucky
“We should be promoting healthier lifestyles in the country,” 29-year-old Republican woman, Iowa
“The MAHA movement gives patients more freedom to choose the doctors they actually want to see…While I support it for now, I'll be waiting to see how these policies are actually implemented,” 39-year-old independent man, Washington
“It’s about making the next generation healthy,” 27-year-old independent woman, Arizona
“I followed Kennedy before he was in office and I’m hoping that he will continue with what he stood for before,” 51-year-old independent woman, Tennessee
“Health care should be a right,” 65-year-old Democratic man, New York
Where MAHA Concerns Resonate With the Public: Food Safety, Pesticides, and Industry Influence
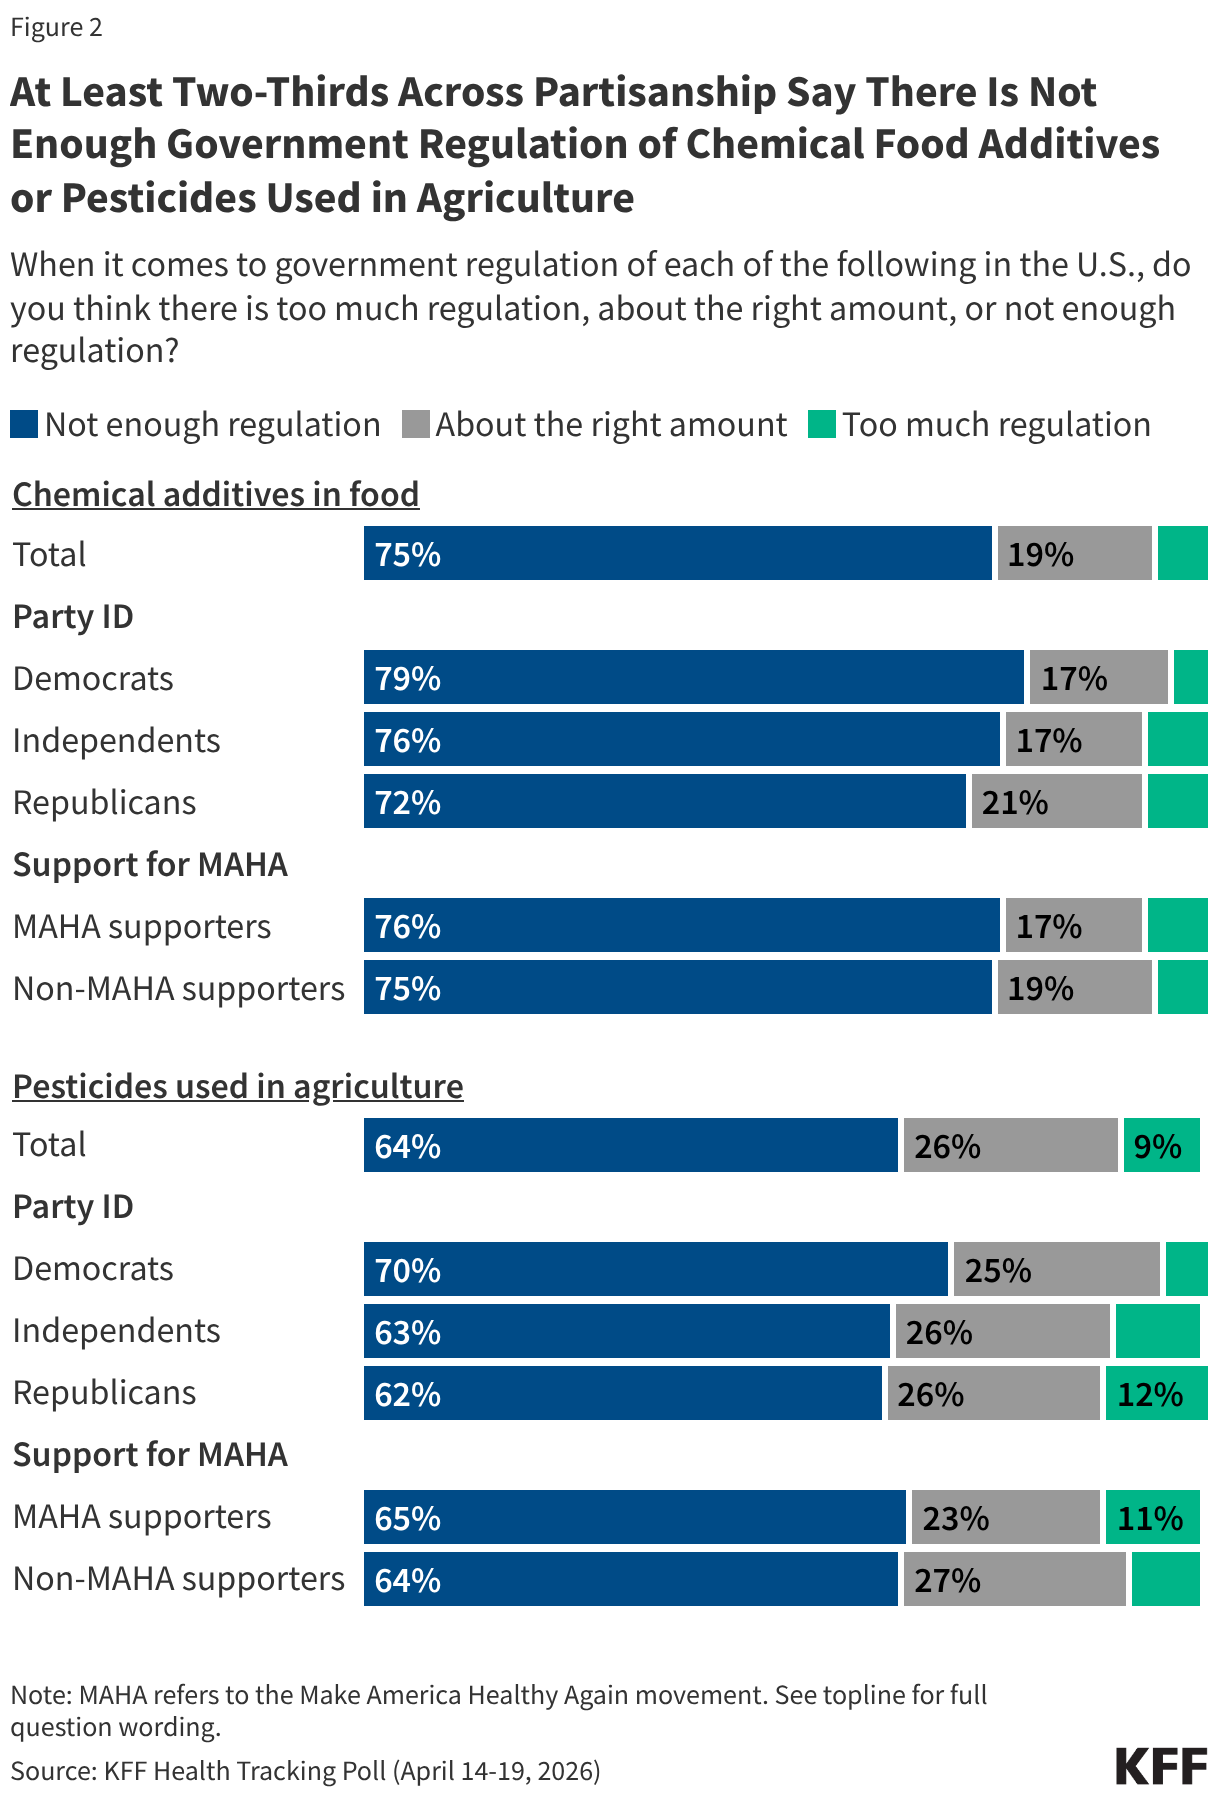
Among the public, there is broad, bipartisan agreement that there is not enough government regulation of chemical additives in food and pesticides in agriculture in the U.S. Three-quarters of adults say there is not enough government regulation of chemical food additives, and about two-thirds (64%) say the same about pesticides used in agriculture. Majorities across partisan lines and among both MAHA supporters and those who do not support the movement agree, suggesting this is an area where MAHA’s concerns align with broader public sentiment.
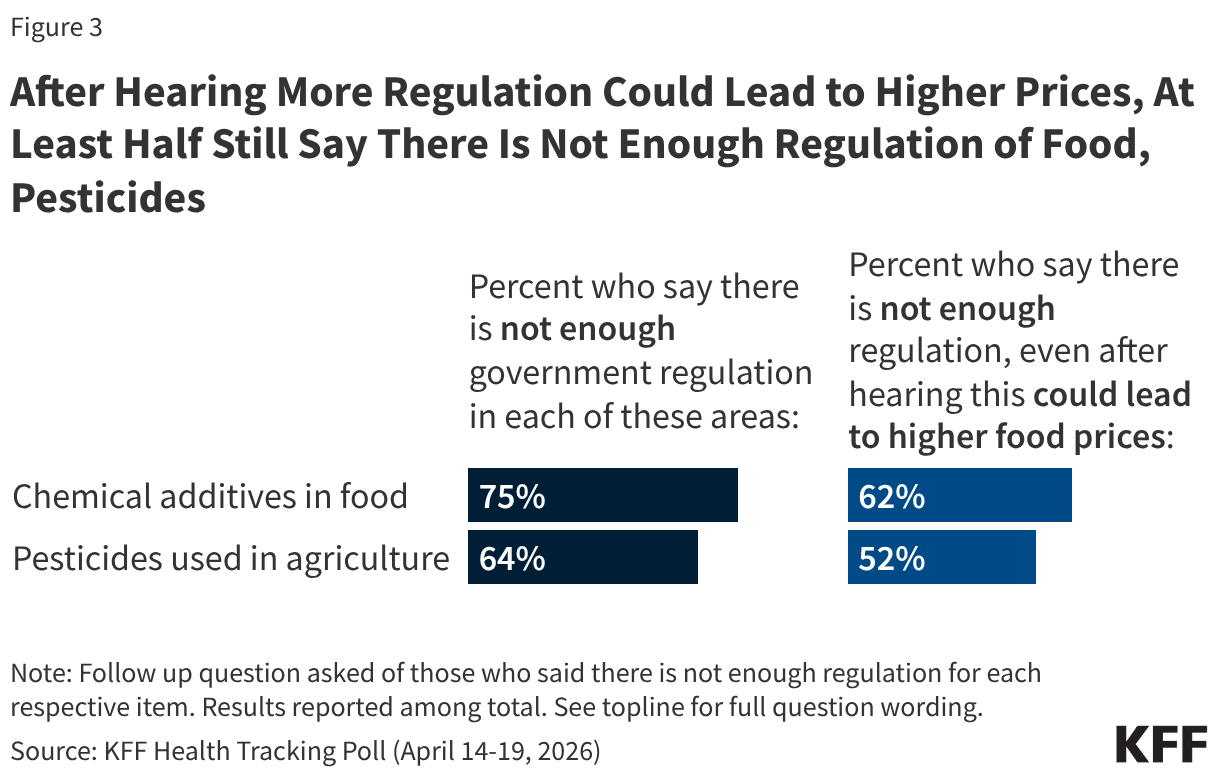
Some food industry groups and public health experts have argued that restrictions on approved food ingredients could limit access to affordable groceries for families in the U.S. When those who originally said there is “not enough regulation” of chemical additives in food or pesticides used in agriculture are presented with the caveat that increased regulation could lead to higher food prices for consumers, most still support increased regulation. But the possibility of increased costs does move some people. The share saying there is not enough regulation of food additives drops by 13 percentage points after hearing that increased regulation could increase costs (from 75% to 62%), with a similar drop in the share who maintain that there is not enough regulation of pesticides (from 64% to 52%).
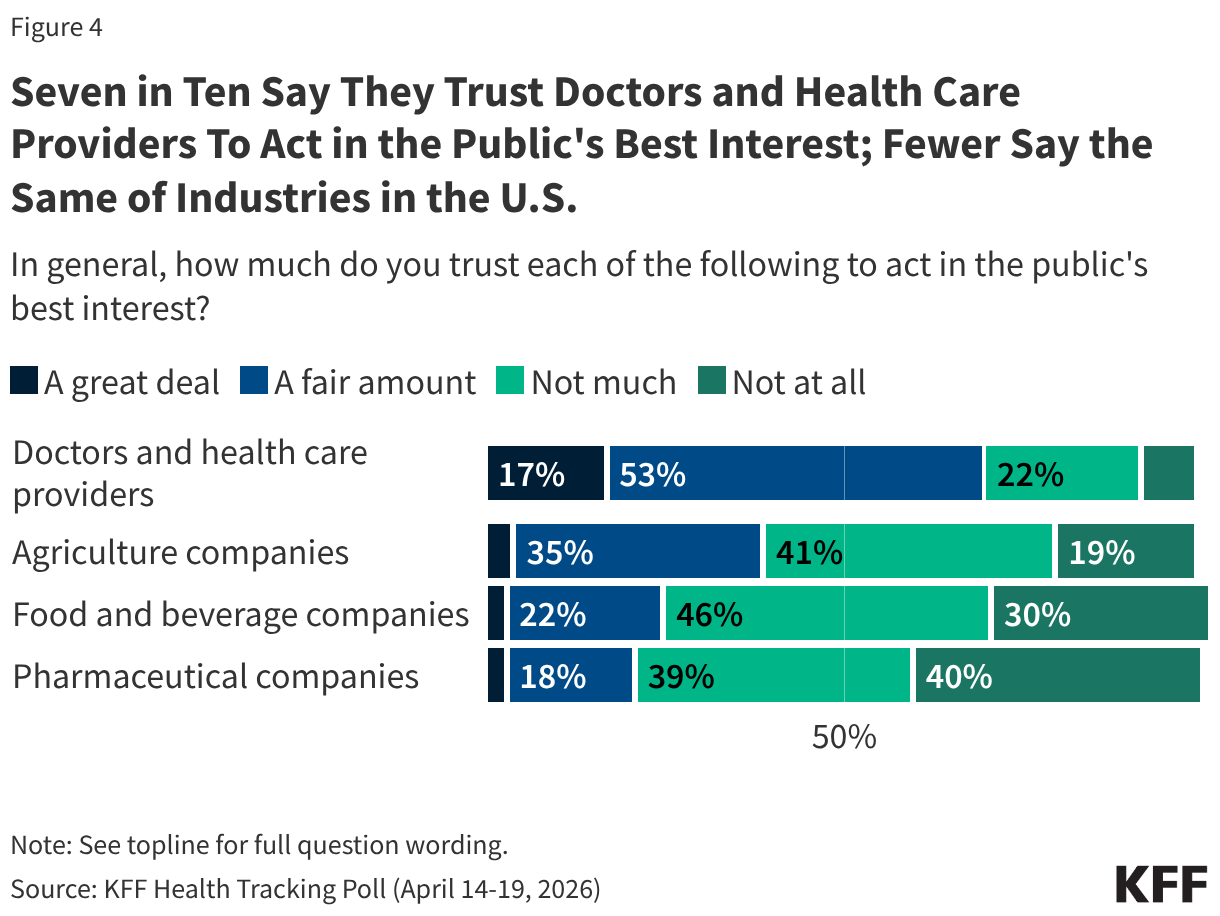
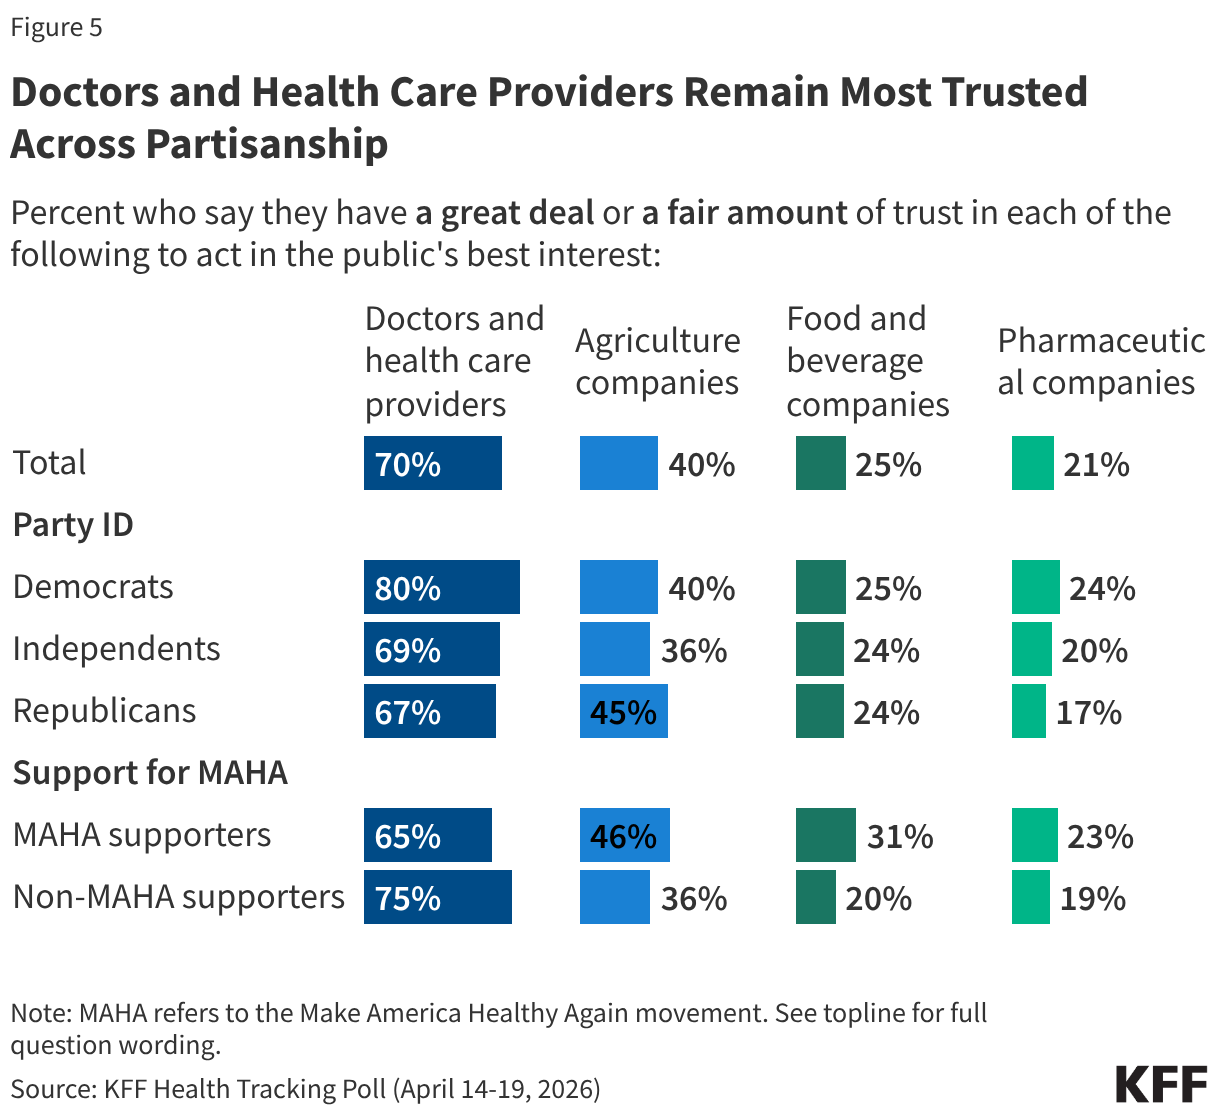
The public perception that there is not enough regulation may be rooted in broader skepticism toward the industries themselves. Most U.S. adults do not trust pharmaceutical companies, food and beverage companies, or agricultural companies to act in the public’s best interest. One in four or fewer adults say they trust food and beverage companies (25%) or pharmaceutical companies (21%) “a great deal” or “a fair amount” to act in the public's best interest, while a somewhat larger share (40%) trust agricultural companies on this measure. Very small shares – fewer than 5% – trust each of these groups “a great deal” to act in the public’s best interest.
By contrast, seven in ten adults say they trust doctors and health care providers at least “a fair amount” to act in the public’s best interest.
Across partisanship, and among those who do and do not support the MAHA movement, fewer than half trust agricultural companies, food and beverage companies, or pharmaceutical companies to act in the public’s best interest. However, most Democrats (80%), independents (69%), and Republicans (67%) have a great deal or a fair amount of trust in doctors and health care providers to act in the public’s best interest.
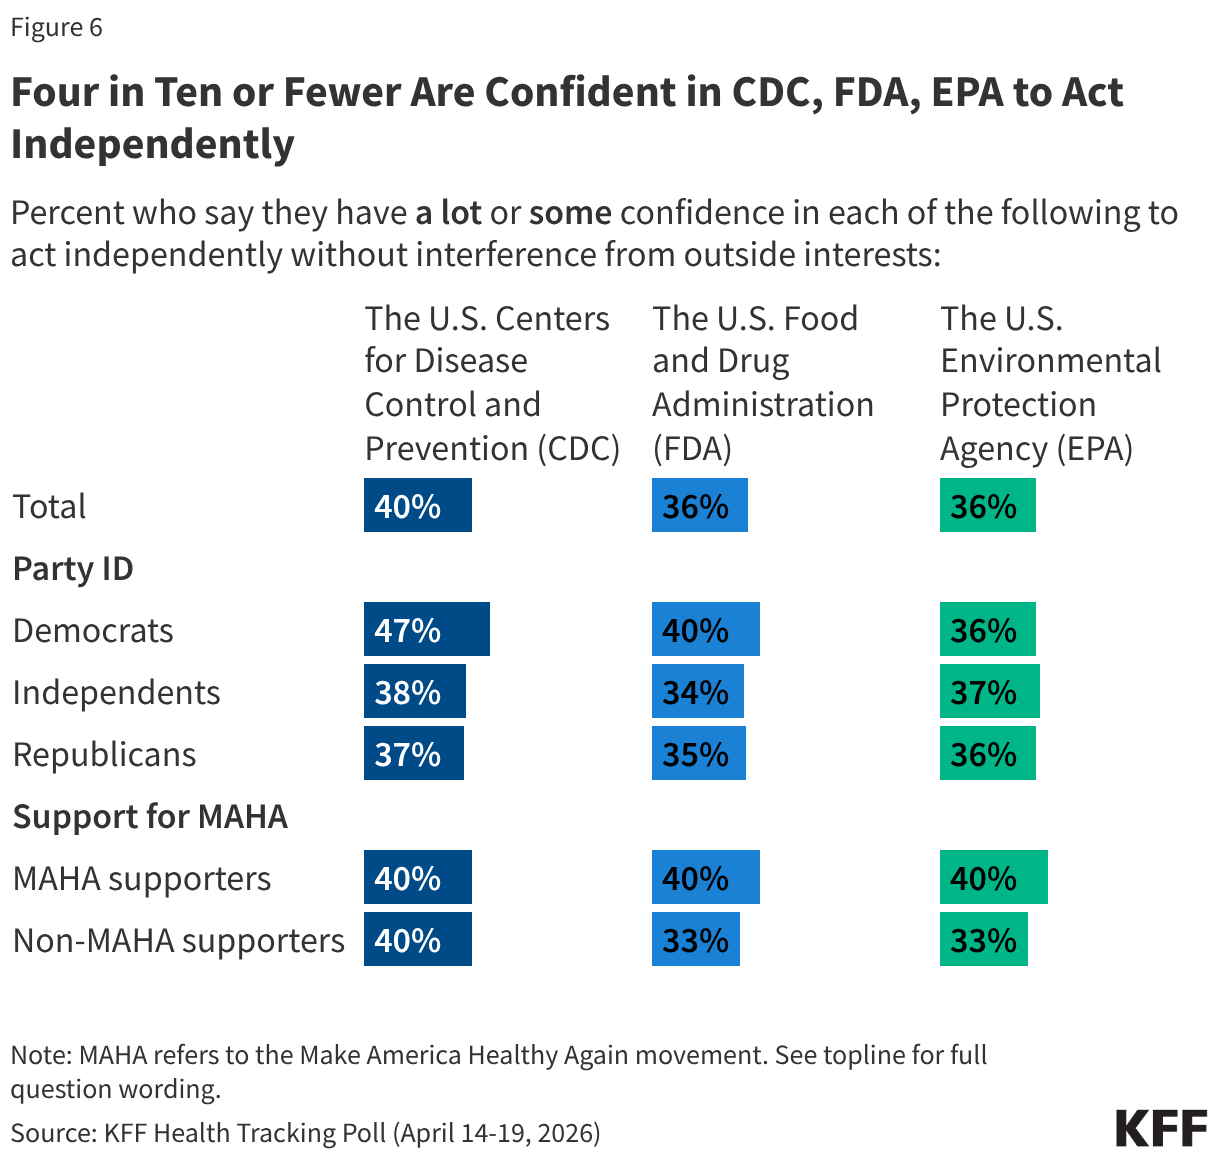
Confidence in the government agencies with major responsibilities for food safety and public health is low across partisans. Four in ten or fewer adults say they have “a lot” or “some” confidence in the U.S. Centers for Disease Control and Prevention (CDC) (40%), U.S. Food and Drug Administration (FDA) (36%), or the U.S. Environmental Protection Agency (EPA) (36%) to act independently without interference from outside interests. Democrats are slightly more likely than Republicans or independents to express confidence in the CDC (47% vs. 37% and 38%, respectively), but partisan differences largely disappear when it comes to confidence in the FDA and EPA.
U.S. adults who support the MAHA movement and those who do not are similarly skeptical. Four in ten MAHA supporters say they are confident in each of these agencies to act independently, leaving six in ten MAHA supporters who have “a little” or “no confidence at all.”
MAHA and Other Health Care Issues in the Election
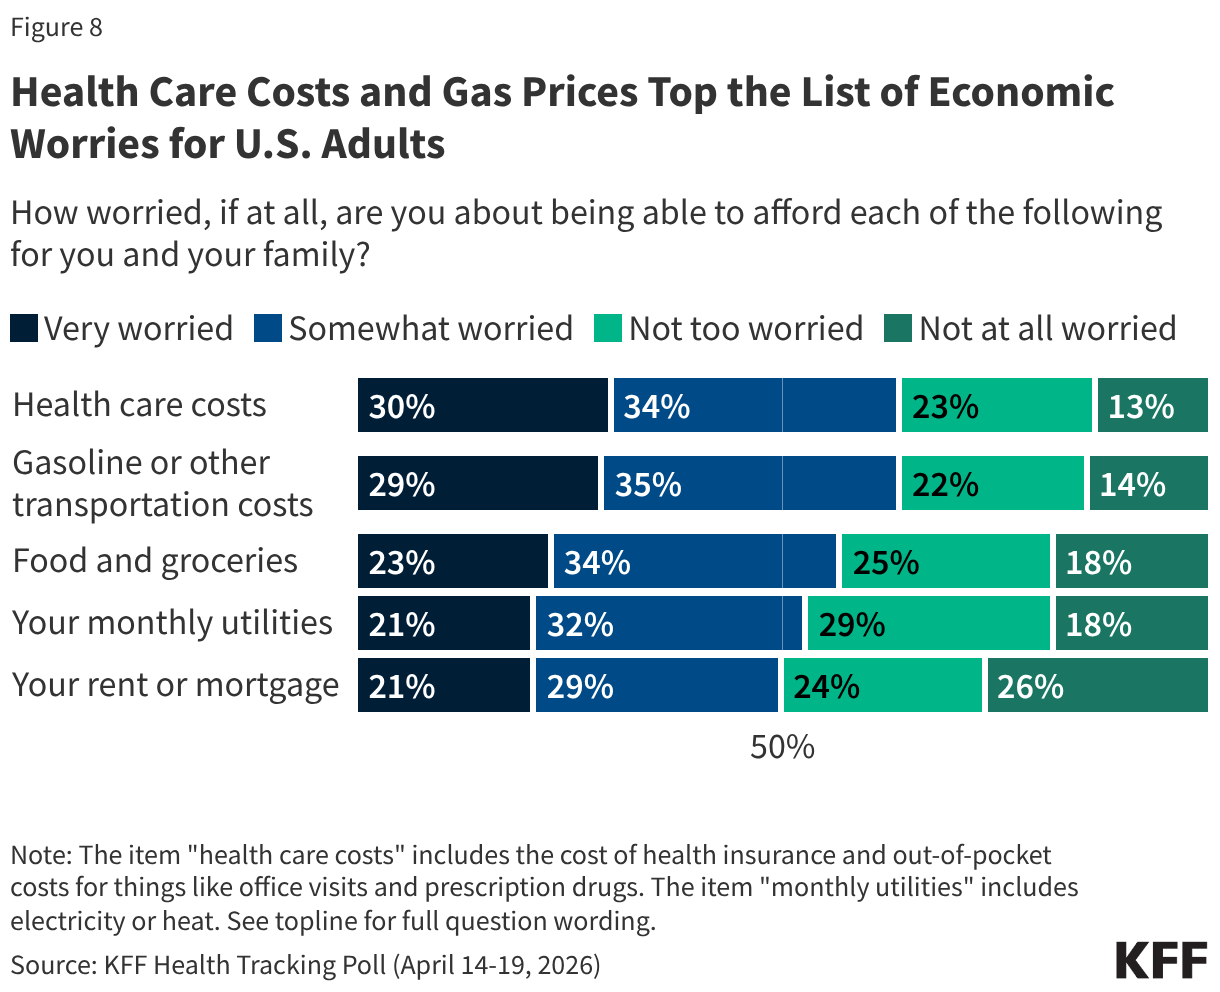
Despite the resonance of these issues elevated by the MAHA movement, health care costs overshadow these concerns for voters heading into the 2026 midterm elections. Previously released findings from the April 2026 KFF Health Tracking Poll show health care costs remain a primary economic concern for the public. Reflecting that, costs are voters’ top health concern heading into the 2026 midterm elections, outweighing policy areas elevated by the MAHA movement, such as vaccines or food safety.
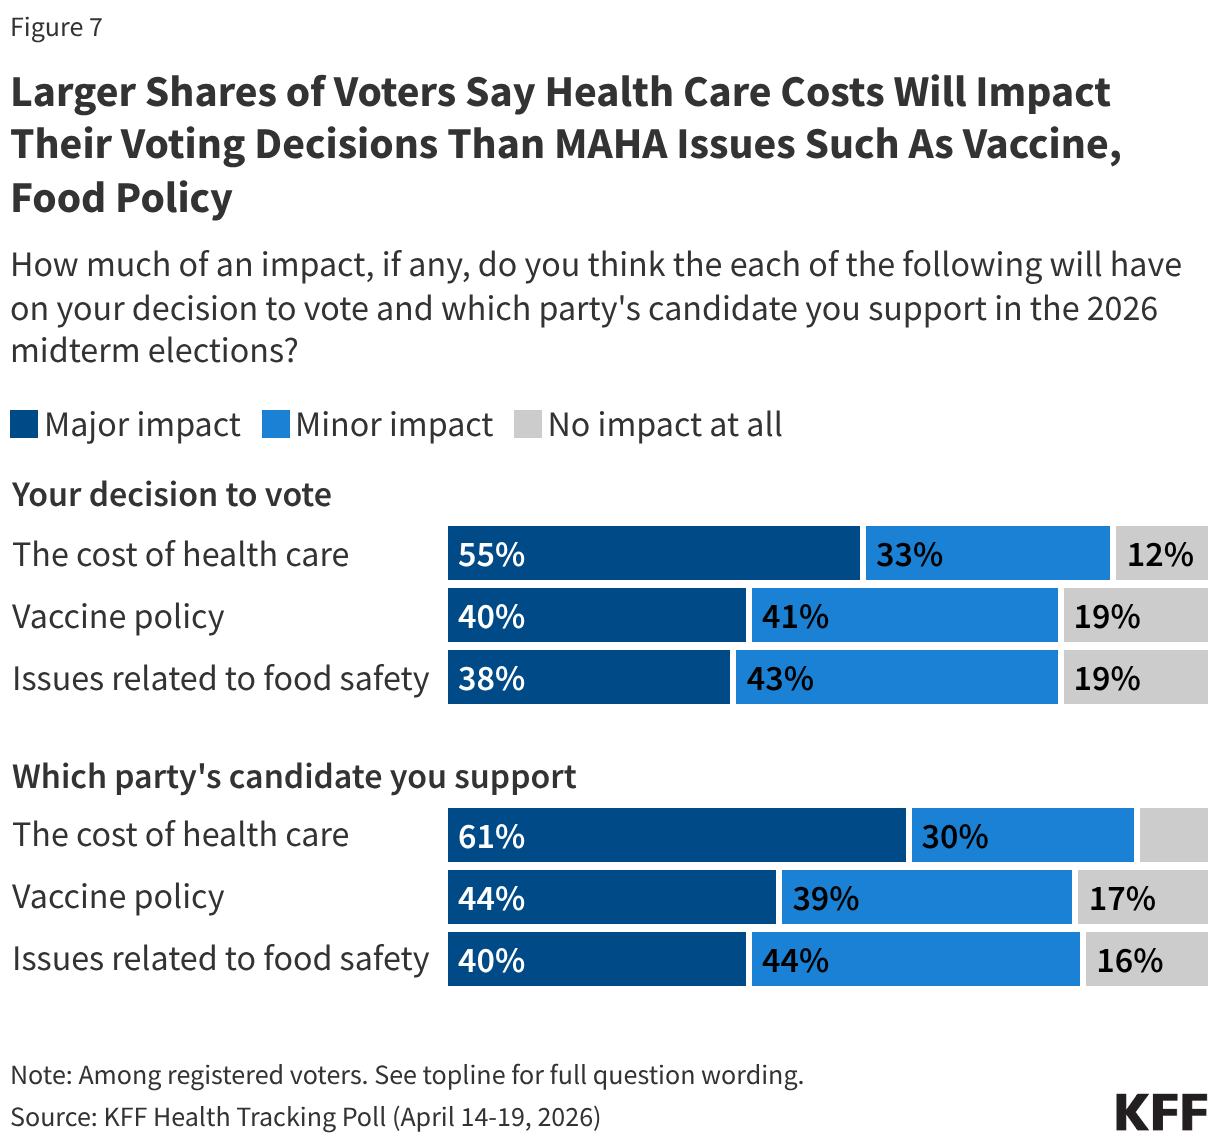
More than half of voters say health care costs will have a “major impact” on their decision to vote (55%) or which party’s candidate they will support (61%). When it comes to vaccine policy and food policy, about four in ten voters say these issues will have a “major impact” on their decision to vote or which party’s candidate they will support, at least 15 percentage points lower than the share who say the same about health care costs.
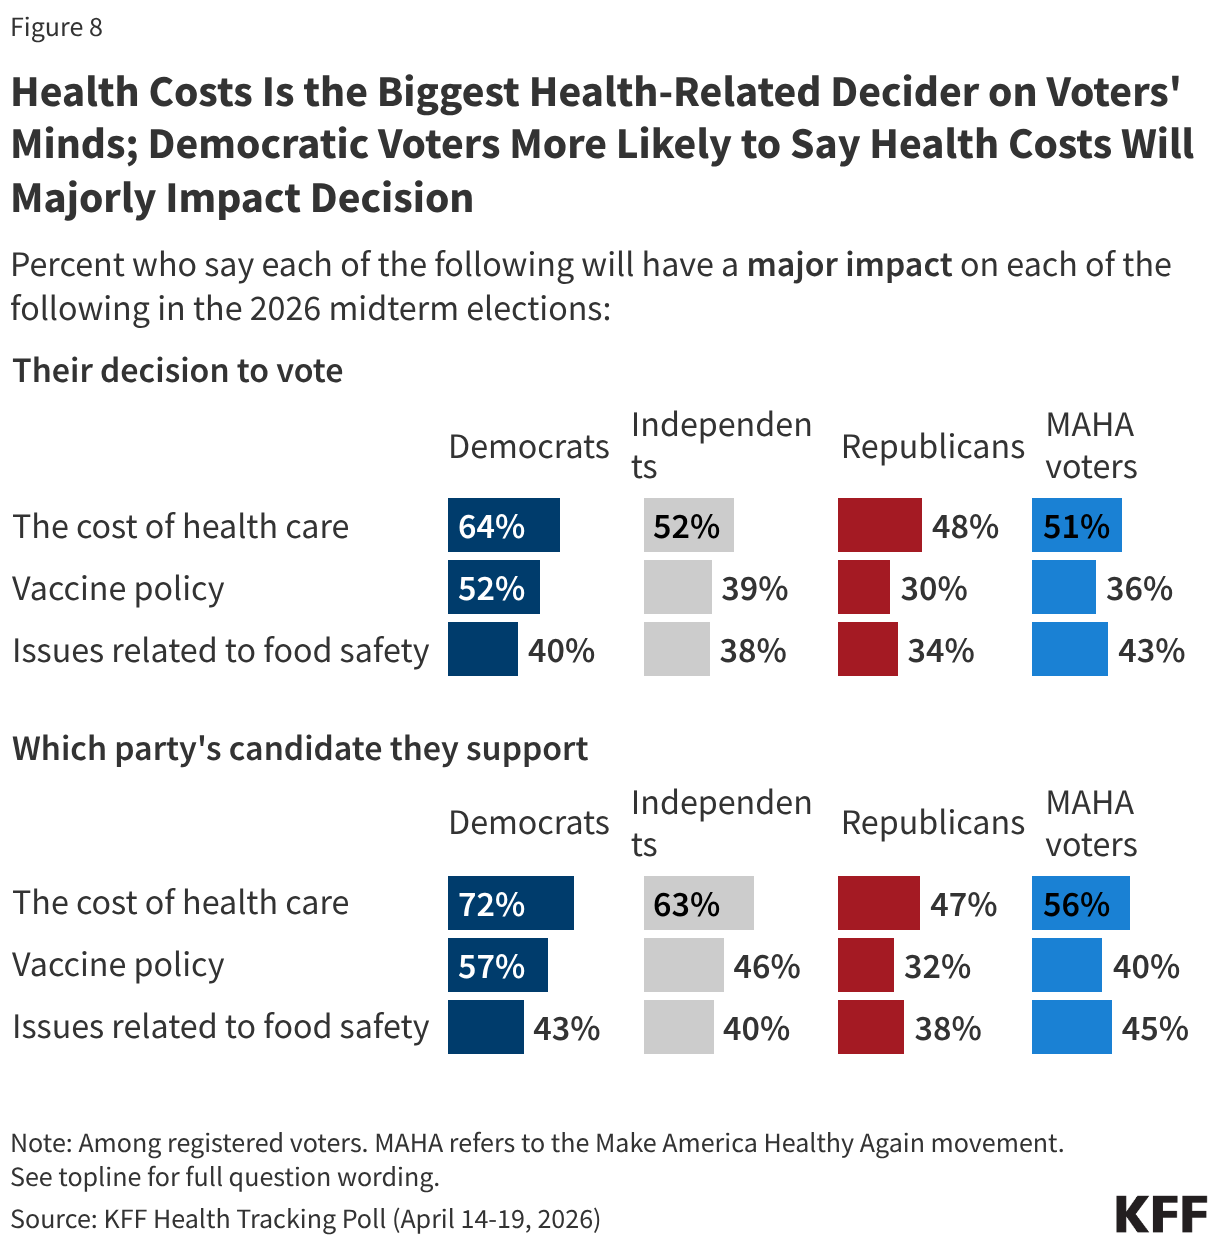
While the issue of health costs is more salient for Democratic voters than for Republicans, larger shares across partisans say health costs will have a major impact on their voting decisions than say the same about vaccine policy or food safety. For example, about half of independent voters (52%) say health care costs will have a major impact on their decision to turn out in November, compared to about four in ten who say the same about vaccine policy (39%) and food safety (38%). Patterns are similar for Republican voters (48%, 30%, and 34%, respectively) and Democratic voters (64%, 52%, and 40%, respectively).
Among voters who say they support the MAHA movement – a majority (56%) of whom identify as MAGA Republicans – at least half say the cost of health care will have a major impact on their decision to vote (51%) or which party’s candidate they support (56%). Despite the MAHA movement elevating issues such as vaccine and food safety, fewer MAHA voters – about four in ten – say vaccine policy or issues of food safety will majorly impact their voting decisions.
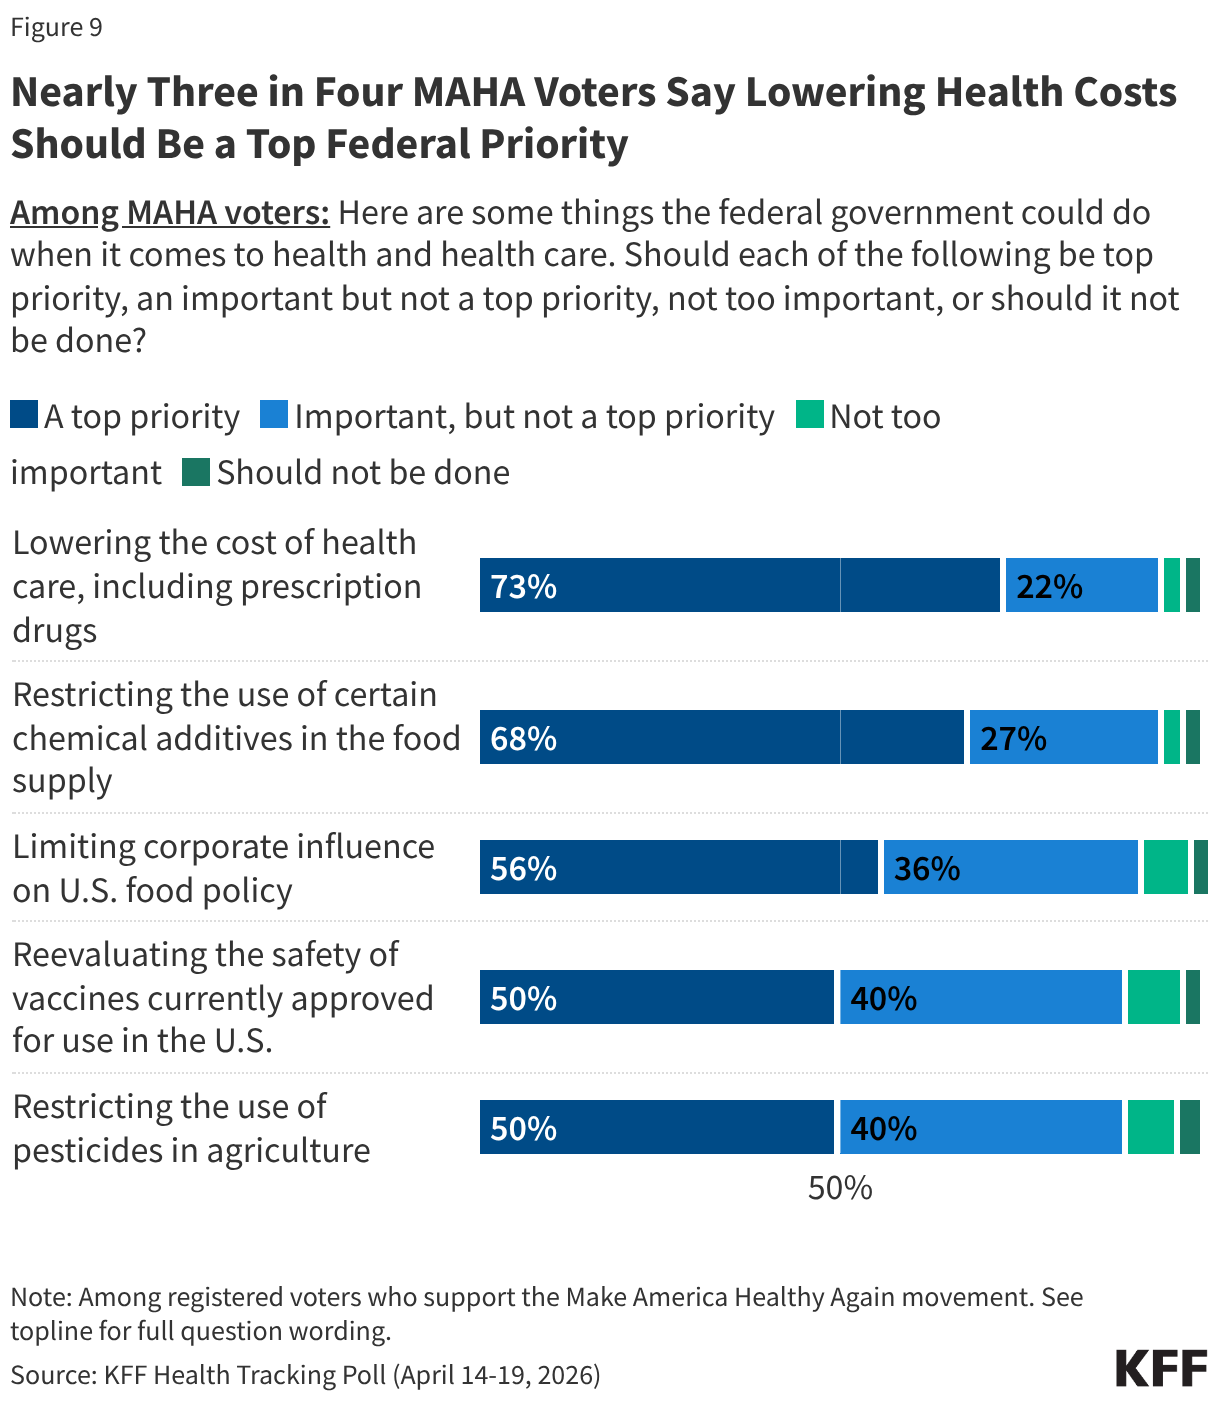
MAHA-supporting voters express broad enthusiasm for federal action across the movement’s core agenda, but once again, health care costs remain the dominant priority. Nearly three-quarters of MAHA voters (73%) say lowering the cost of health care, including prescription drugs, should be a top priority for the federal government. This is followed by restricting the use of certain chemical additives in the food supply (68%) and limiting corporate influence on U.S. food policy (56%). Half of MAHA voters say reevaluating the safety of vaccines currently approved for use or restricting the use of pesticides in agriculture should be top priorities. Across all five items, one in ten or fewer MAHA voters say any of these efforts are “not too important” or “should not be done.”
When asked to choose the single most important health priority to them, about four in ten MAHA-supporting voters (42%) choose lowering the cost of health care, including prescription drugs—twice the share who say the same of restricting chemical additives in the food supply (21%). Fewer cite reevaluating vaccine safety (10%), limiting corporate influence in U.S. food policy (8%), or restricting pesticide use in agriculture (8%) as their single top priority.
The cost of health care tops the list of health care priorities for MAHA voters regardless of partisanship. Among voters who support the MAHA movement, six in ten Democrats (57%) and four in ten independents (43%) and Republicans (40%) say lowering the cost of health care is the most important priority. For each of these groups, health care costs rank at least 14 percentage points ahead of restricting the use of chemical additives in food, and even further ahead of issues like reevaluating vaccine safety and restricting pesticide use.
Trump Administration Approval and Party Preference on MAHA Health Issues
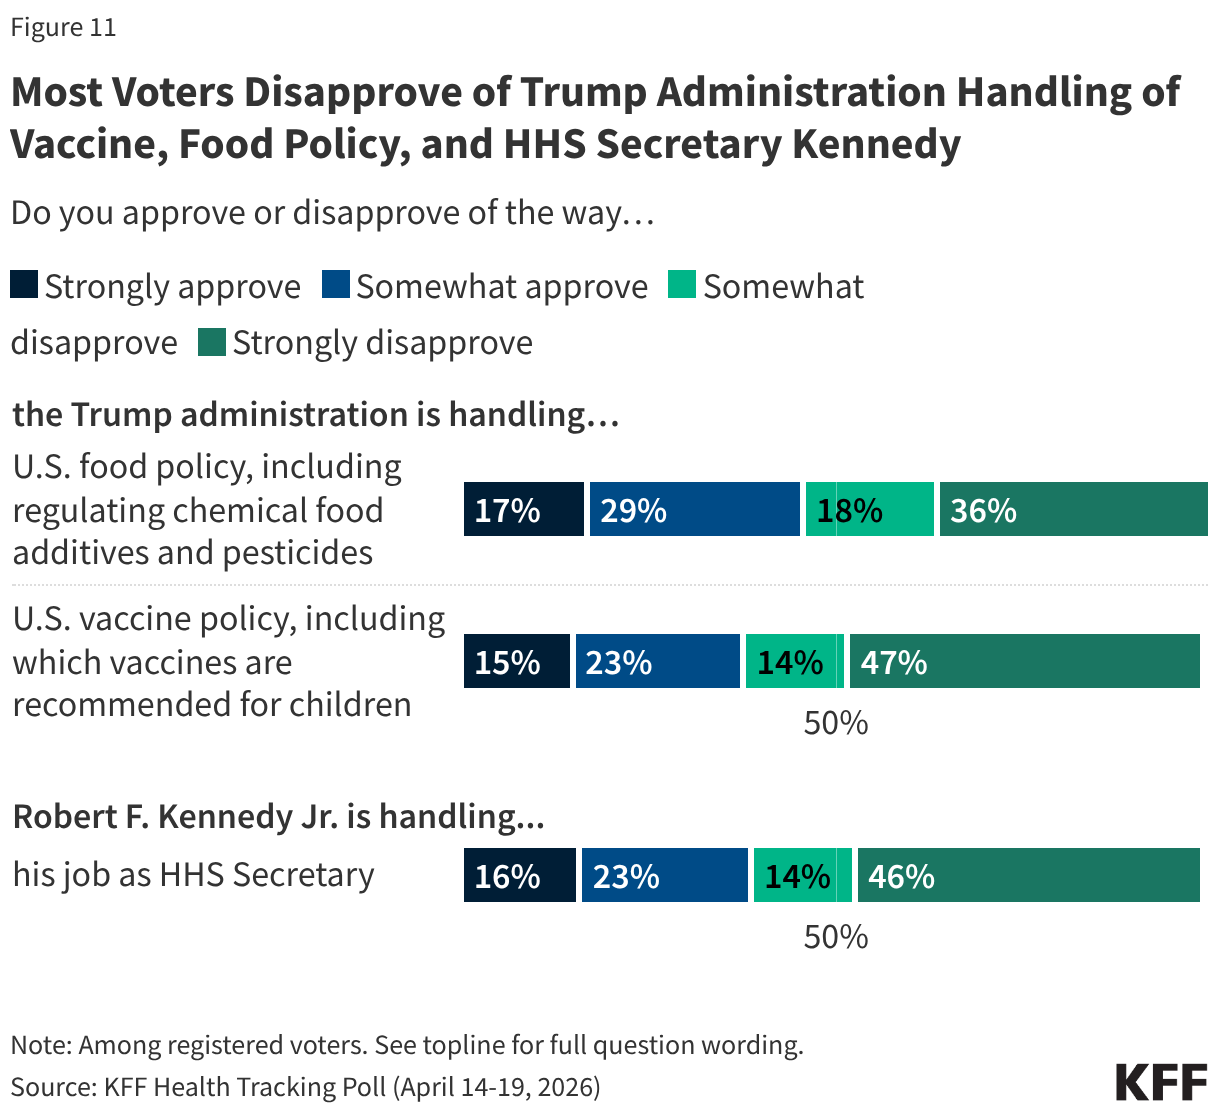
Voters give the Trump administration low approval ratings on two key policy areas elevated by the MAHA movement. Just under half (46%) of voters approve of the administration’s handling of food policy, and a larger share (54%) disapprove. Just a few months after the changes made to the childhood vaccine schedule by HHS, about four in ten voters approve of the administration’s handling of U.S. vaccine policy (38%) and six in ten (61%) disapprove, including about half (47%) who “strongly disapprove.”
As the head of the MAHA Commission and Secretary of Health and Human Services, Robert F. Kennedy Jr. is the spokesperson for many of the administration’s federal health policies. About four in ten voters say they approve of the way Secretary Kennedy is handling his job (39%) and six in ten disapprove, including nearly half (46%) who “strongly disapprove.”
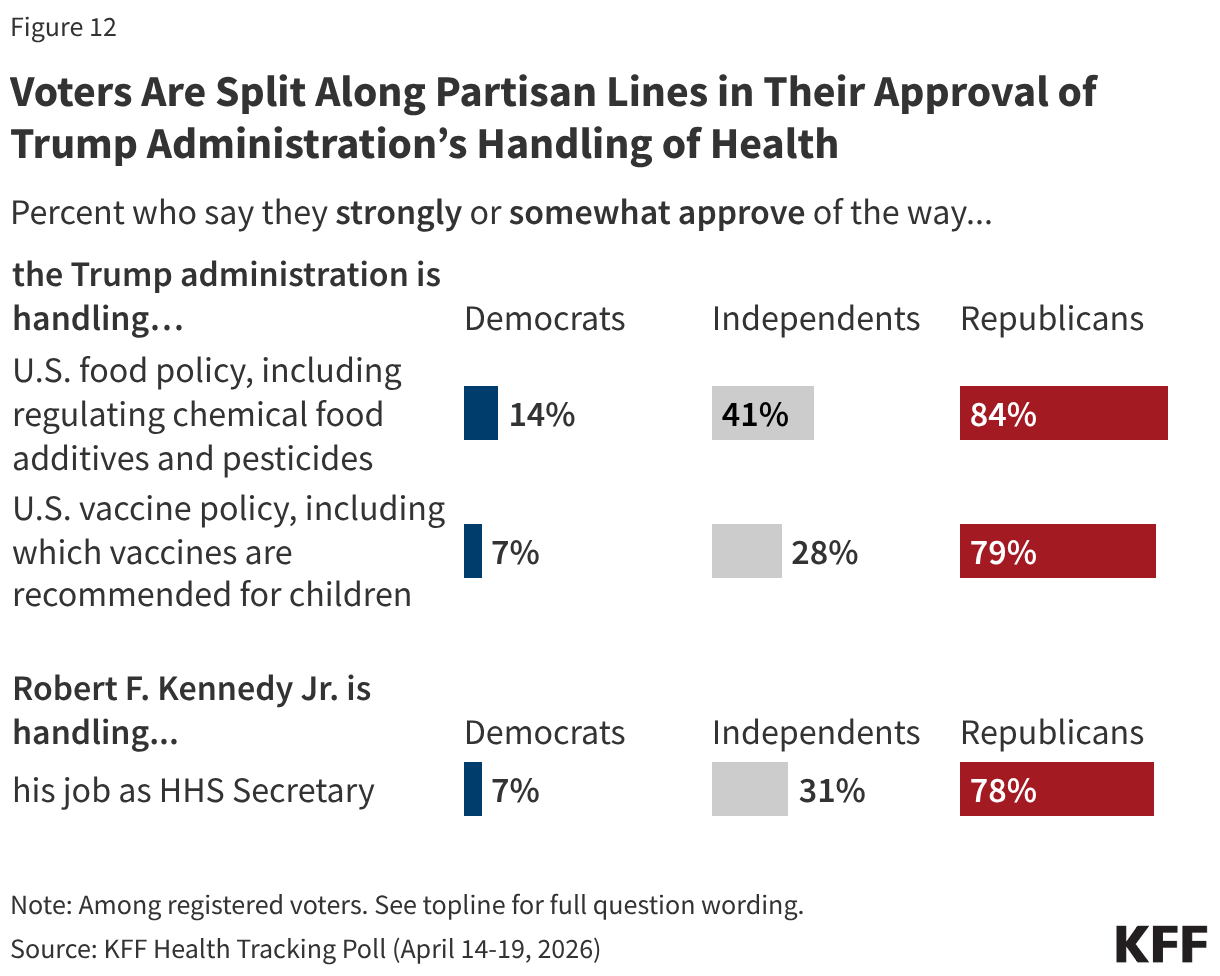
Unsurprisingly, voters are split along partisan lines, with the Trump administration receiving high approval ratings from Republicans on food and vaccine policy as well as Secretary Kennedy’s handling of his job at HHS, and most Democrats disapproving.
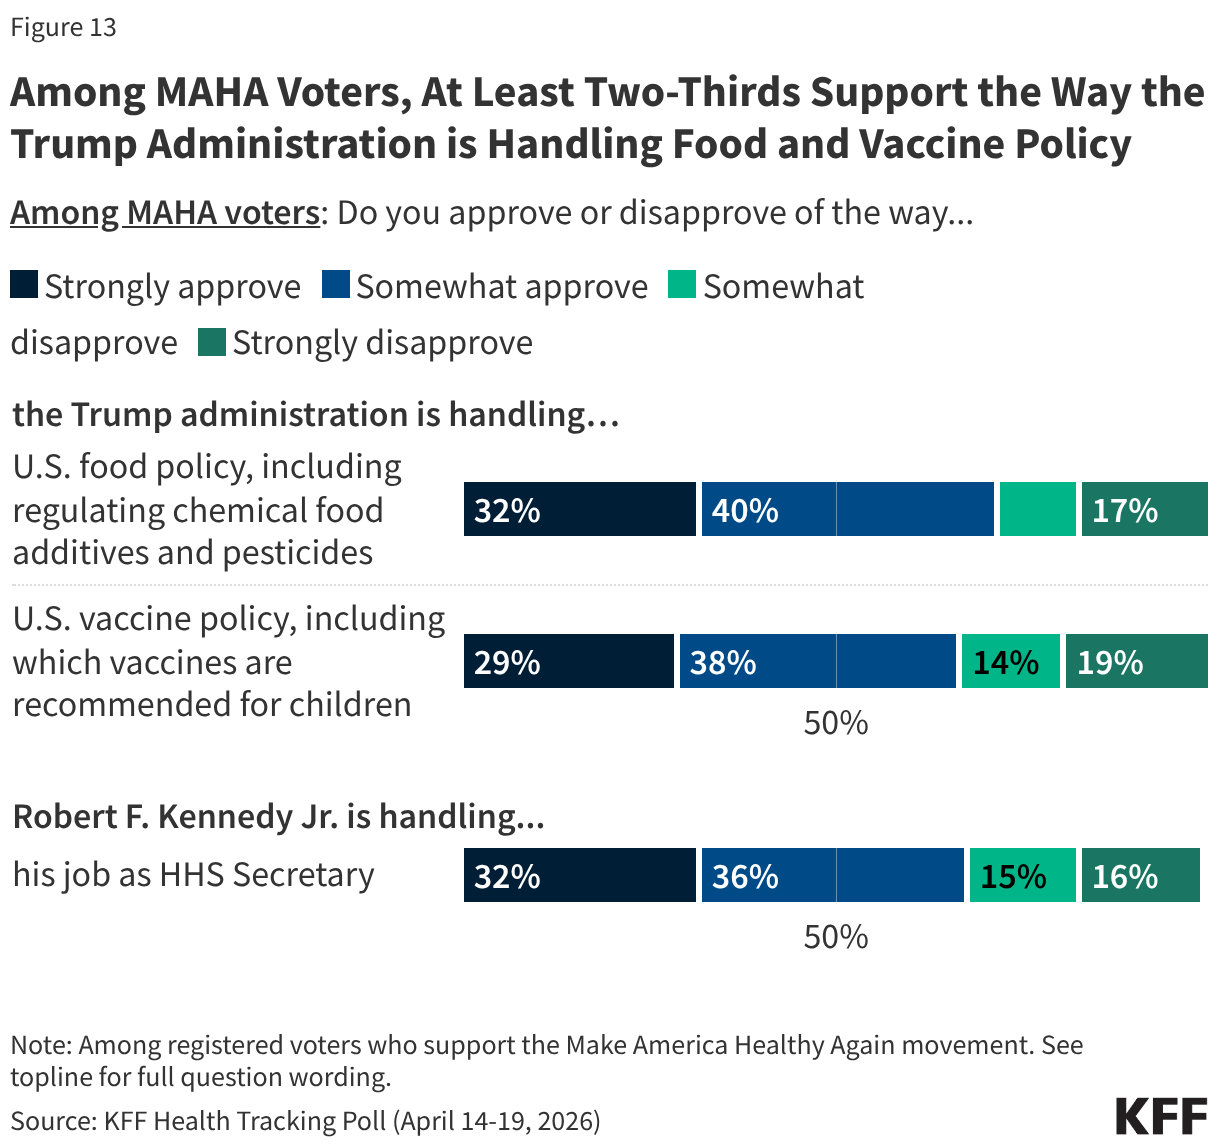
Despite Secretary Kennedy’s leadership at HHS and recent changes focused on MAHA priorities, approval of the administration’s handling of issues like vaccine policy is far from unanimous among the movement’s supporters. About seven in ten MAHA voters approve of the administration’s handling of food policy (72%) and vaccine policy (67%), and Secretary Kennedy’s handling of his job as Health Secretary (69%). On each of these areas, just a third “strongly” approve of the administration and a similar share disapprove: tepid ratings for a group that aligns with Kennedy’s signature movement.
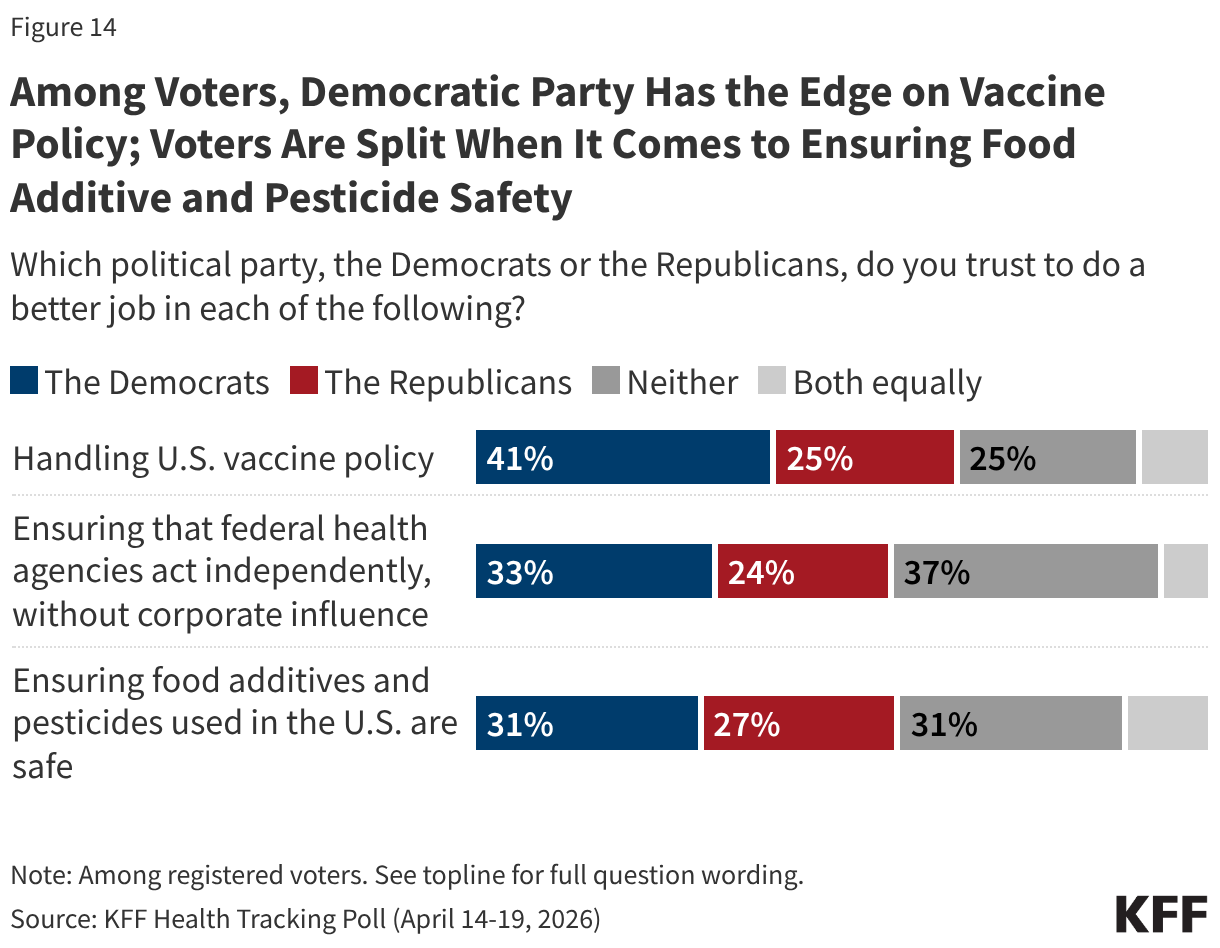
With about six months until the 2026 midterm elections, the Democratic Party has a strong edge over the Republican Party when it comes to who voters trust to address vaccine policy, and a narrower edge on ensuring federal agencies act independently. Voters are split over who they trust to do a better job ensuring food additives are safe. Democrats have a double-digit advantage over Republicans when it comes to who voters trust to handle vaccine policy (41% vs. 25%). While the Democratic Party has a smaller advantage among voters on which party they trust to ensure that federal health agencies act independently without corporate influence (33% vs. 24%), nearly four in ten (37%) say they trust “neither party.”
Similar shares of voters say they trust the Democratic Party (31%), the Republican Party (27%), or “neither party” (31%) more when it comes to doing a better job ensuring food additives and pesticides in the U.S. are safe.