Abortion Coverage Limitations in Medicaid and Private Insurance Plans
Editorial Note: This brief was originally published on April 30, 2026 and was updated on May 21, 2026 to reflect changes in Pennsylvania
Key Findings
- The Dobbs decision had a major impact on abortion access across the U.S., resulting in state laws that restrict or prohibit the provision of abortion in a large swath of the nation. In addition to state laws affecting the provision of abortion, some states have addressed abortion coverage options under Medicaid or private insurance by implementing new state laws or in response to court decisions on cases that challenged funding restrictions. Since Dobbs, six states (of a total of 13 states) have implemented policies that require abortion coverage in private plans, and five states have eliminated Medicaid coverage restrictions.
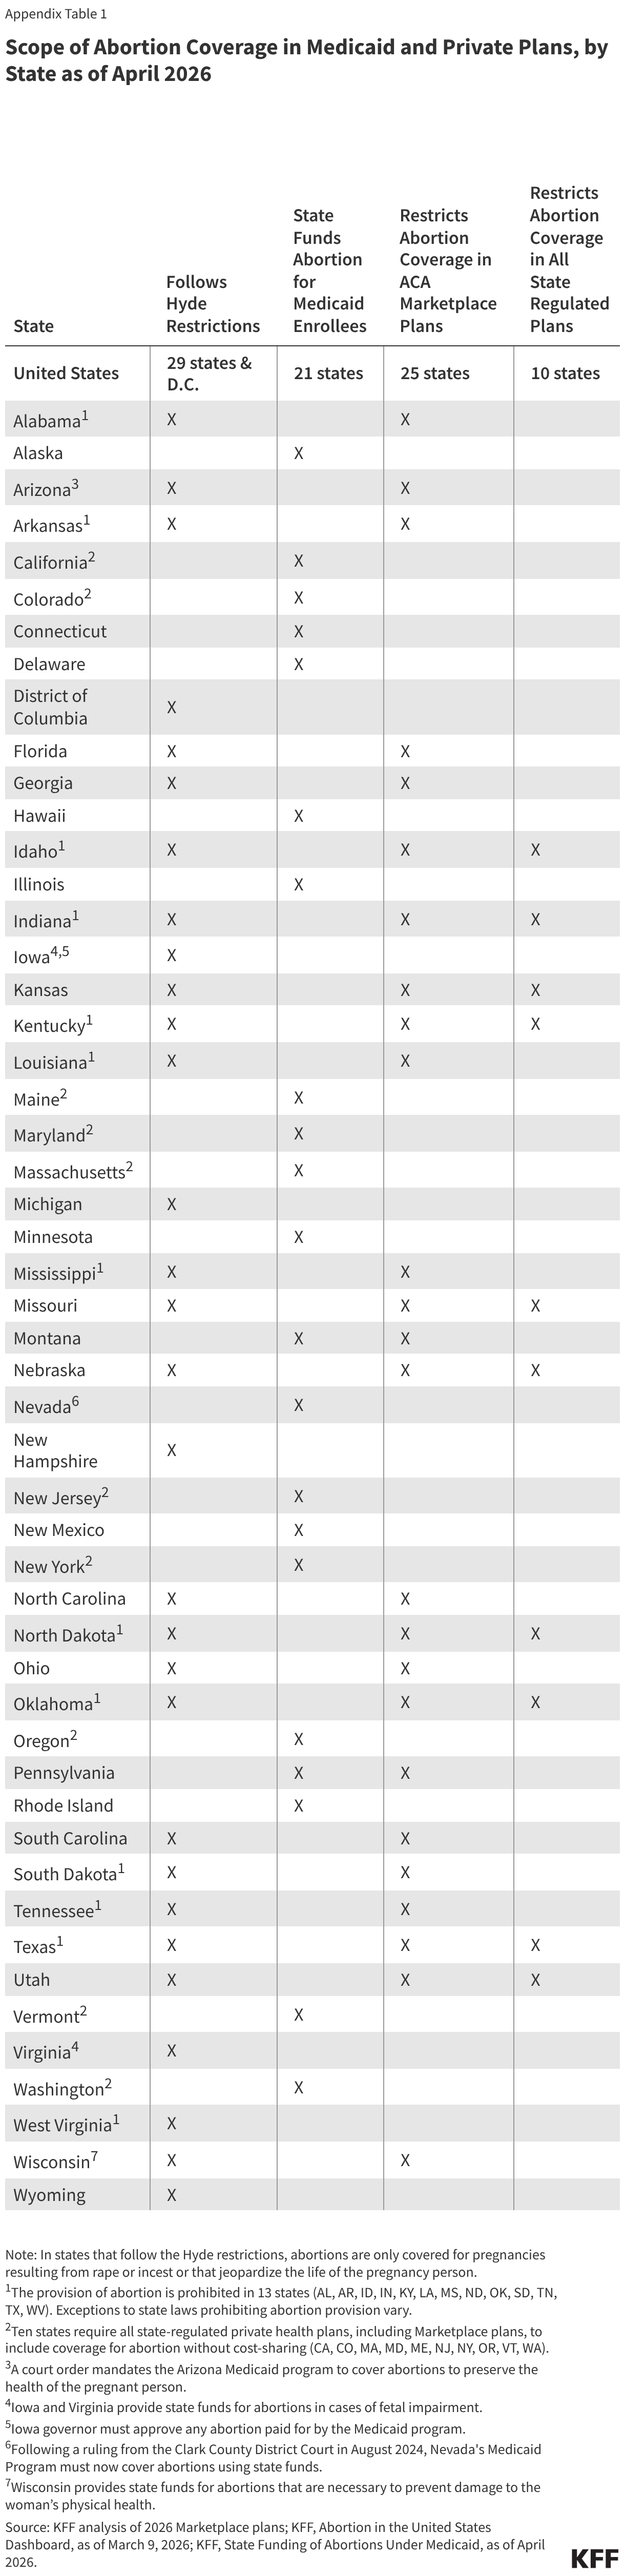
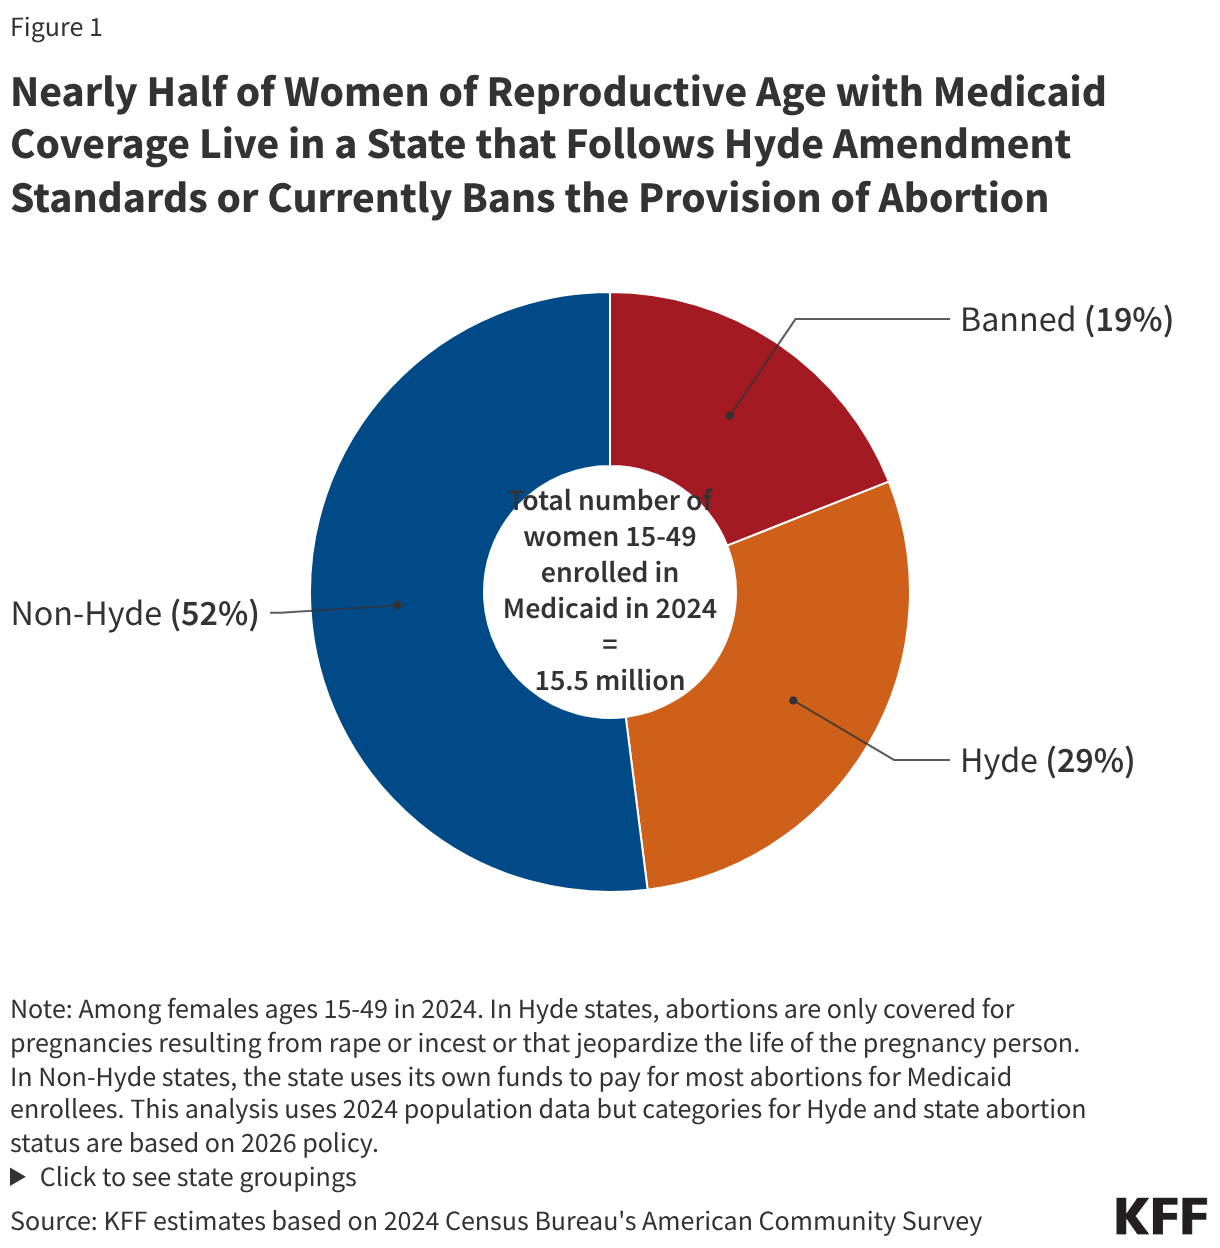
- Among the 37 states that do not have laws prohibiting abortion, 17 states and D.C. follow the Hyde Amendment restrictions, which restrict the use of federal funds for all abortions with the exceptions of pregnancies resulting from rape or incest or endanger the life of the pregnant person. However, twenty states use state funds to pay for abortions for Medicaid enrollees beyond the Hyde Amendment restrictions, up from 16 states in 2019. Despite the expansion of abortion funding for Medicaid enrollees, over half of women of reproductive age (15-49) with Medicaid coverage live in a state that follows the Hyde Amendment restrictions (33%) or has a law banning the provision of abortion (19%).
- Federal and states policies also shape access to coverage for abortion in private insurance plans. States are responsible for regulating fully insured individual, small, and large group plans, including Affordable Care Act (ACA) marketplace plans. Among the states that do not ban the provision of abortion, four impose Hyde-like restrictions on the circumstances under which state regulated private plans may cover abortion.
- The ACA allows states to enact laws barring all plans participating in the state marketplace from covering abortion. As of January 2026, 25 states prohibit abortion coverage in their ACA Marketplace plans. In contrast, 13 states require all state regulated plans, including Marketplace plans, to include abortion coverage regardless of the circumstances, and the remaining 12 states and D.C. are silent on the issue.
- A review of the 2026 Marketplace plans in the 12 states and D.C. that have no specific laws requiring or prohibiting abortion coverage finds six states have no Marketplace plans that include abortion coverage. The remaining six states and D.C. have at least one plan in the 2026 Marketplace that includes abortion coverage on the exchange.
- Abortion coverage remains a focal point of debate in Congress and a target for investigation by the Trump administration. During the failed 2025 negotiations to extend enhanced premium tax credits, there were proposals to ban the use of federal ACA tax credits for Marketplace plans that include abortion benefits. Since then, the administration has issued guidance on the management of non-federal premium funds that ACA plans are required to collect and segregate if they offer abortion coverage and launched investigations aimed at further restricting abortion coverage within these plans.
Introduction
While the 2022 Dobbs decision overturning Roe v. Wade eliminated federal abortion protections and allowed states to ban the provision of abortion, federal and state restrictions on abortion coverage persist even in states without laws that prohibit abortion. State and federal efforts to address insurance and Medicaid coverage of abortion services began soon after the 1973 Supreme Court’s Roe v. Wade decision legalizing abortion and have continued to the present day. Since 1977, the Hyde Amendment, which bans the use of any federal funds for abortion, allowing only exceptions for pregnancies that endanger the life of the pregnant person, or that result from rape or incest, has been a major barrier to coverage of abortion services for low-income women.
Decades later, the issue of abortion coverage was at the heart of many debates in the run up to the passage of the Affordable Care Act (ACA) and subsequently led to renewed legislative efforts at the state level to limit coverage of abortions, this time in private insurance plans. Further federal restrictions on abortion coverage are still being debated in current day policy discussions. Most recently, there have been proposals to ban the use of federal ACA tax credits for Marketplace plans that include abortion as a covered benefit. This policy was recently discussed as part of the failed negotiations to extend the federal tax credits in the fall of 2025. In March 2026, the Trump Administration launched investigations to ascertain whether states that require health insurance plans to cover abortion are violating the Weldon Amendment, a federal law that that prohibits federal funds from going to state or local governments that “discriminate” against health care entities which refuse to provide, pay for, cover, or refer for abortions.
This brief reviews current federal and state policies on Medicaid and insurance coverage of abortion services in the U.S. and presents national and state estimates on the availability of abortion coverage for people enrolled in private plans, Marketplace plans, and Medicaid.
Federal and State Laws Regarding Coverage or Payment for Abortion
Over 1.1 million abortions occurred in the United States in 2025. Federal and state laws, as well as insurers’ coverage policies, shape the extent to which individuals can have coverage for abortion services under both publicly funded programs and private health insurance plans. People who seek an abortion but do not have coverage for the service have to shoulder the out-of-pocket costs of the services (though some clinics offer abortion services on a sliding scale based on income). The cost of an abortion varies depending on factors such as location, facility, timing, and type of procedure. The median cost of a medication abortion is $563, whereas the median cost of a second-trimester abortion is $1,000. Though the vast majority (~93%) of abortions are performed in the first trimester of pregnancy, the costs are challenging for people with lower incomes. Approximately 4% of abortions are performed at 16 weeks or later in the pregnancy. For people with medically complicated health situations or who need abortions later in pregnancy, the costs can be prohibitive. In some cases, individuals find they have to delay their abortion while they take time to raise funds, or they may first learn of a fetal anomaly later in pregnancy when the costs are considerably higher. Prior analysis has found that 43% of women ages 18-49 could not handle a $500 emergency expense using their savings. Across the U.S. abortion coverage restrictions disproportionately affects low-income people, who have limited ability to pay for abortion services with out-of-pocket funds.
Since 1977, federal law has banned the use of any federal funds for abortion unless the pregnancy is a result of rape, incest, or if it is determined to endanger the pregnant person’s life. This rule, also known as the Hyde Amendment, is not a permanent law; rather it has been attached annually to Congressional appropriations bills for the Department of Health and Human Services (HHS) and has been approved every year by Congress. The Hyde Amendment restricts federal abortion funding under Medicaid, Indian Health Service, Medicare, and the Children’s Health Insurance Program. Over the years, similar language has been incorporated into a range of other federal programs that provide or pay for health services for people who could become pregnant, including the military TRICARE program, the Peace Corps, the Federal Employees Health Benefits program and federal prisons. The Department of Veteran Affairs, which provides coverage for military veterans and their families, does not cover abortion nor abortion counseling for their beneficiaries, with limited exceptions for people whose life is endangered. State level policies also have a large impact on how insurance and Medicaid cover abortions, particularly since states are responsible for operating Medicaid programs and regulating insurance plans.
Medicaid
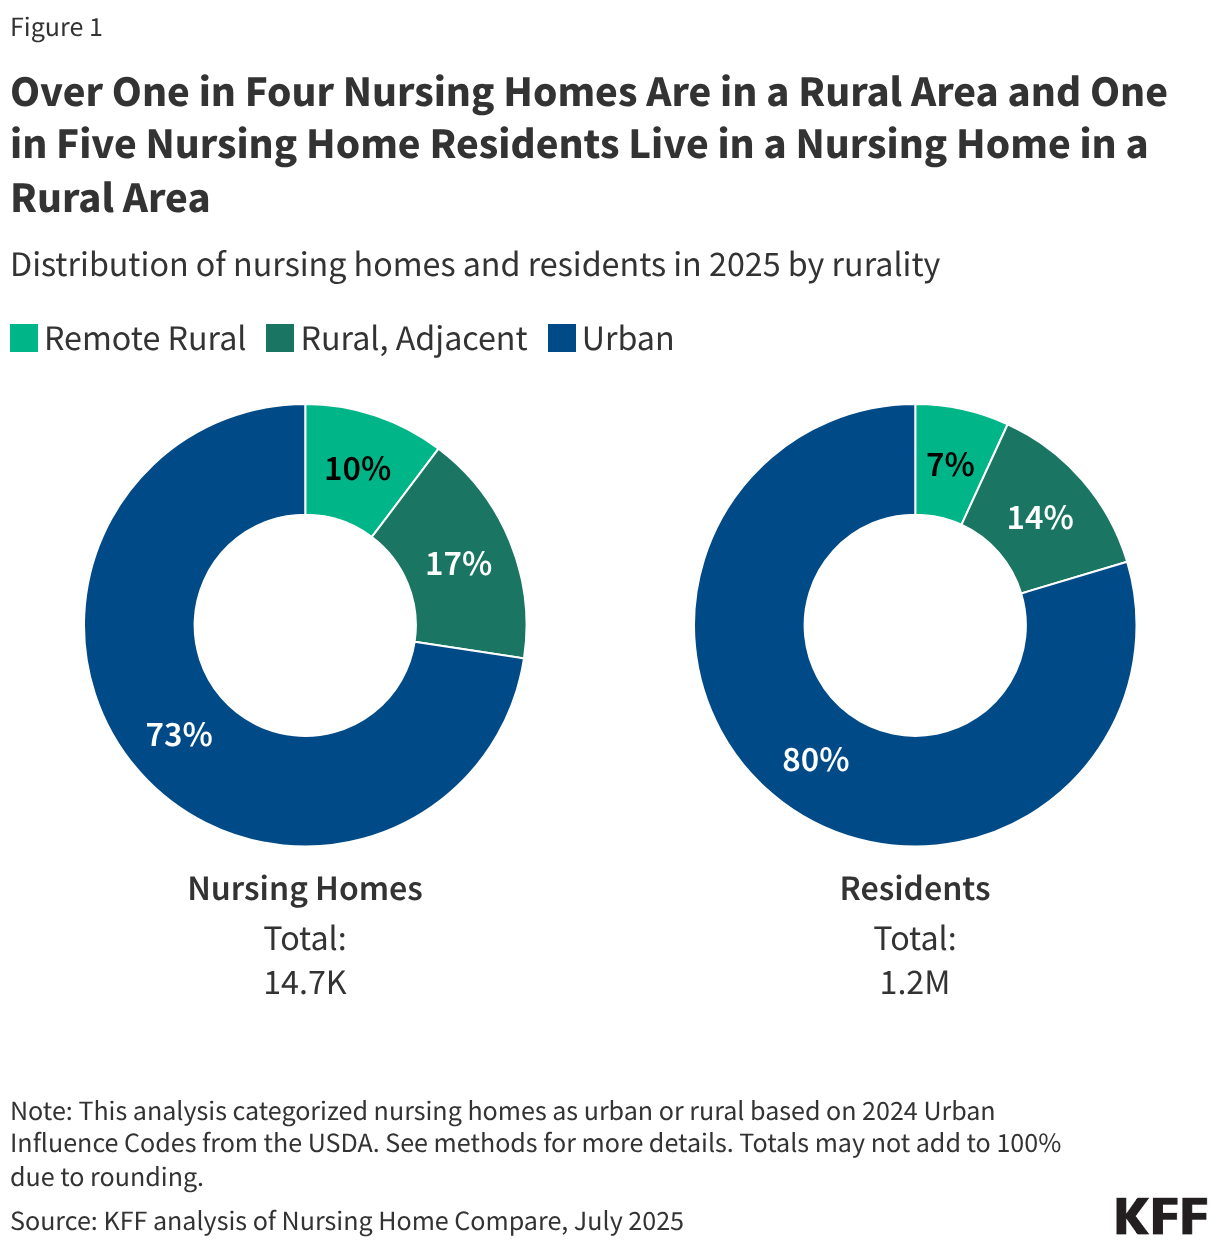
The Medicaid program, a federally and state funded program, serves millions of low-income women and is a major funder of reproductive health services nationally. Approximately two-thirds of adult women enrolled in Medicaid are in their reproductive years. As discussed earlier, the federal Hyde Amendment restricts state Medicaid programs from using federal funds to cover abortions beyond the cases of life endangerment, rape, or incest, however, a state may use its own funds to cover abortions in other circumstances. Currently, 20 states use state-only funds to pay for abortions for women on Medicaid in circumstances different from those federal limitations set in the Hyde Amendment. In the years following the Dobbs decision, four states—Colorado, Delaware, Nevada and Rhode Island—have eliminated Medicaid abortion coverage restrictions, either via a new state law or a court decision. On April 24, 2026, the Pennsylvania Commonwealth Court ruled that the state’s ban on Medicaid coverage for abortion services was unconstitutional, but following an appeal from the state’s Attorney General on May 20, 2026, the court’s decision is paused while the appeal is pending. In 17 states that do not prohibit the provision of abortion and the District of Columbia, Medicaid programs do not pay for any abortions beyond the Hyde exceptions. The 13 states that currently have laws prohibiting abortion provision also follow the Hyde restrictions. Nearly half of women with Medicaid coverage live in states that use their own funds to pay for abortion services, beyond the federal Hyde limitations (Figure 1).
Since the Dobbs ruling, many states have enacted laws that prohibit or highly restrict abortion and do not necessarily allow exceptions for rape or incest. As of March 2026, thirteen states have laws that ban the provision of abortion, and while all of these laws contain exceptions to safeguard the life of the pregnant person, most do not have exceptions for cases of rape or incest, and therefore, would not allow for the provision of those services to Medicaid enrollees in those states. Most Medicaid enrollees living in states where abortion provision is prohibited are not able to use their coverage in their state for an abortion that qualifies as a Hyde circumstance and those who can travel out of state will most likely not be able to find a provider able to bill their home state’s Medicaid program.
Additionally, some states have extensive reporting requirements for cases of rape and incest. A 2019 GAO study found that some states have requirements for people claiming abortion coverage under Hyde that include provider certification of rape, incest, or life endangerment; beneficiary certification of rape or incest; official documentation (such as police report or report with a public health agency) of rape or incest; prior authorization by the state Medicaid program; and prior certification of counseling for the abortion. Since 2013, Iowa has required formal approval from the Office of the Governor to secure reimbursement for any abortions covered by Medicaid.
Although Hyde abortions are not accessible in states where laws prohibit the provision of abortion, federal courts have ruled that the Medicaid statute, as modified by the Hyde Amendment, requires states to pay for abortions that fall under the Hyde Exceptions and have blocked enforcement of state statutes that prohibit coverage for these exceptions. The Hyde Amendment requires coverage in cases of rape, incest, and life endangerment. In 1998, in a letter to all the state Medicaid directors explaining a change to the Hyde Amendment, Health and Human Services stated that: “All abortions covered by the Hyde Amendment, including those abortions related to rape or incest, are medically necessary services and are required to be provided by states participating in the Medicaid program.” However, a 2022 Congressional Research Service (CRS) overview of the Hyde Amendment, published after the Dobbs decision, lists open questions, such as whether payment for travel for abortion services also falls under the scope of the Hyde Amendment and conjectures that the interplay of state abortion laws and the Amendment may be relitigated. Despite this clear guidance, and court precedent, historically the Centers for Medicare & Medicaid Services (CMS) has not taken any enforcement action against states for failing to comply with covering abortion in all of the circumstances required by Hyde.
Private Insurance
States are responsible for regulating fully insured individual, small, and large group plans issued in their state. This includes plans available through the ACA marketplace and plans purchased by some employers for their workers. State laws have jurisdiction over whether abortion coverage is included or excluded in private plans that are not self-insured (which are regulated by the federal government under ERISA). Four states (Kansas, Missouri, Nebraska, Utah) that do have laws prohibiting the provision of abortion impose restrictions on the circumstances under which insurance will cover abortions (Appendix Table 1). Six states with highly restrictive abortion laws—Idaho, Indiana, Kentucky, North Dakota, Oklahoma, and Texas—also have private insurance restrictions in place. Utah limits private insurance plans regulated by the state from covering abortion unless the abortion is necessary to save the life of the mother or avert serious risk of loss of a major bodily function, if the fetus has a defect as documented by a physician that is uniformly diagnosable and lethal, and in cases of rape or incest. Kansas, Missouri, and Nebraska only allow fully insured private plans regulated by the state to cover abortion when it is necessary to save the woman’s life, and abortions under all other circumstances are not covered.
While some states allow insurers to sell riders for abortion coverage on the private market, a KFF analysis conducted prior to the Dobbs decision found that no insurers offered abortion riders to people insured through individually purchased plans, and only one insurance company in one state offered an abortion rider in the group market. The lack of abortion riders leaves people insured by private plans in these states with no option to secure coverage for abortion services. Utah law specifically prohibits abortion coverage riders.
Just as some states proscribe insurance plans from covering abortion, other states require plans to include abortion as a covered service. Currently, 13 states require all state-regulated private health plans, including Marketplace plans, to include coverage for abortion. Ten of these states also require no cost-sharing for abortion services—Illinois and Minnesota allow cost-sharing if there is cost-sharing for similar services in the plan, and Delaware only prohibits cost-sharing for abortions over $750. California and Washington require all plans, including individual and employer plans, to treat abortion coverage and maternity coverage neutrally, meaning that all plans are required to include both maternity and abortion coverage.
ACA Marketplace Plans
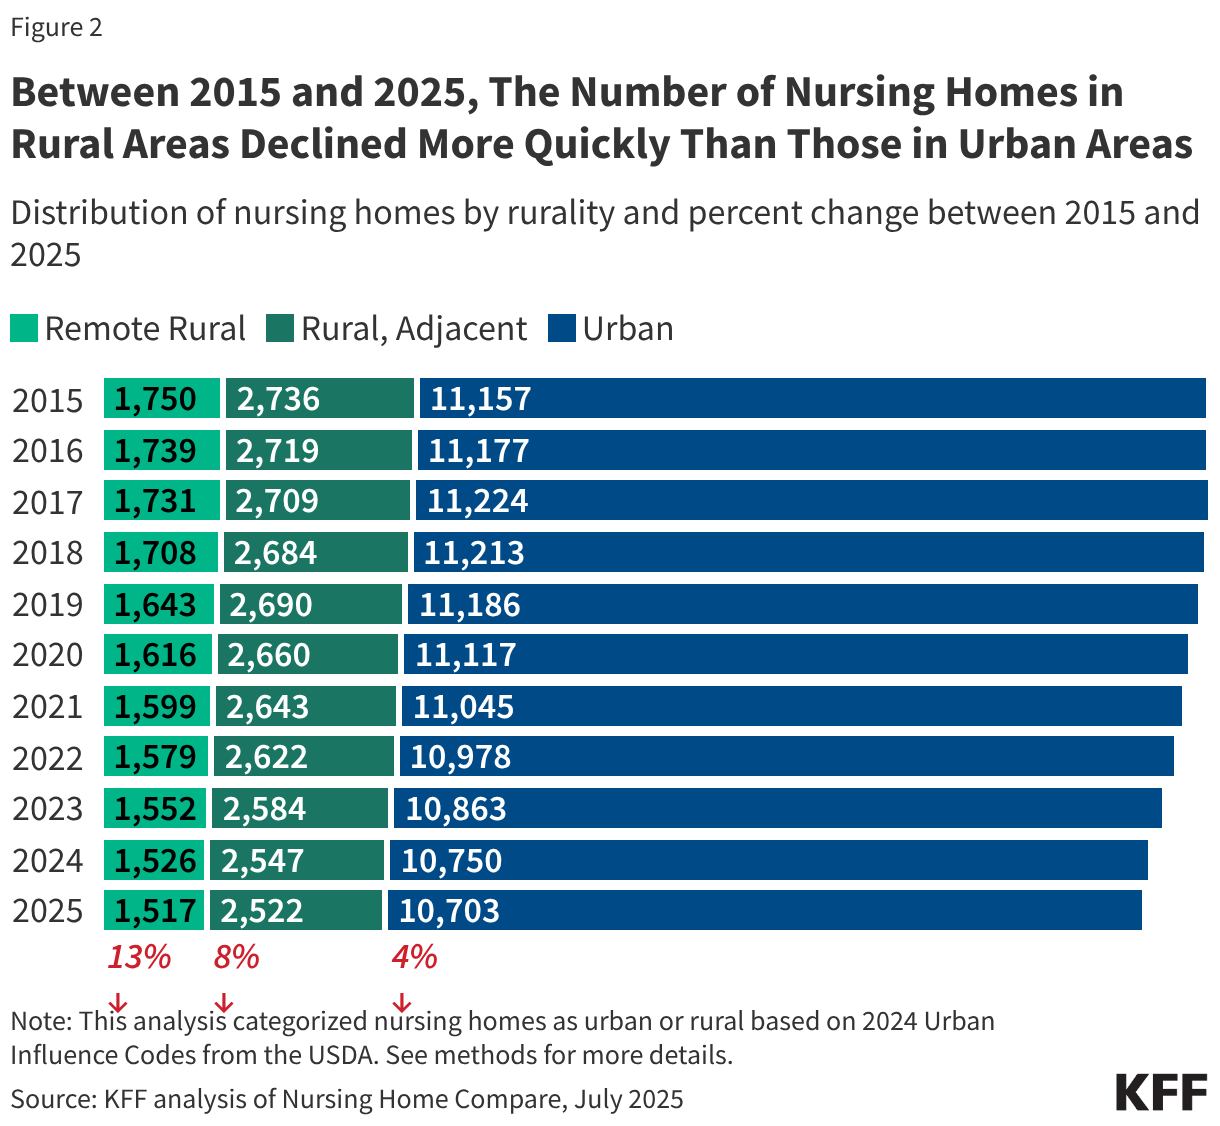
All plans offered on the ACA Marketplaces must provide coverage for 10 Essential Health Benefits (EHB), including maternity care and prescription drugs. Abortion services, however, are explicitly excluded from the list of EHBs that all plans are required to offer. Under federal law, no plan is required to cover abortion and states can enact laws that bar all plans participating in the state Marketplace from covering abortions. As of January 2026, 25 states have passed laws that prohibit abortion coverage in their ACA Marketplace plans and an additional 12 states and D.C. are silent on the issue. The remaining 13 states require all ACA plans to cover abortion (Figure 2). All 13 states with laws prohibiting the provision of abortion, except for West Virginia, have laws in place that also prohibit abortion coverage. Most state laws include narrow exceptions for pregnant people whose pregnancies endanger their life or are the result of rape or incest. The ACA prohibits plans in the state Marketplaces from discriminating against any provider because of “unwillingness” to provide abortions.
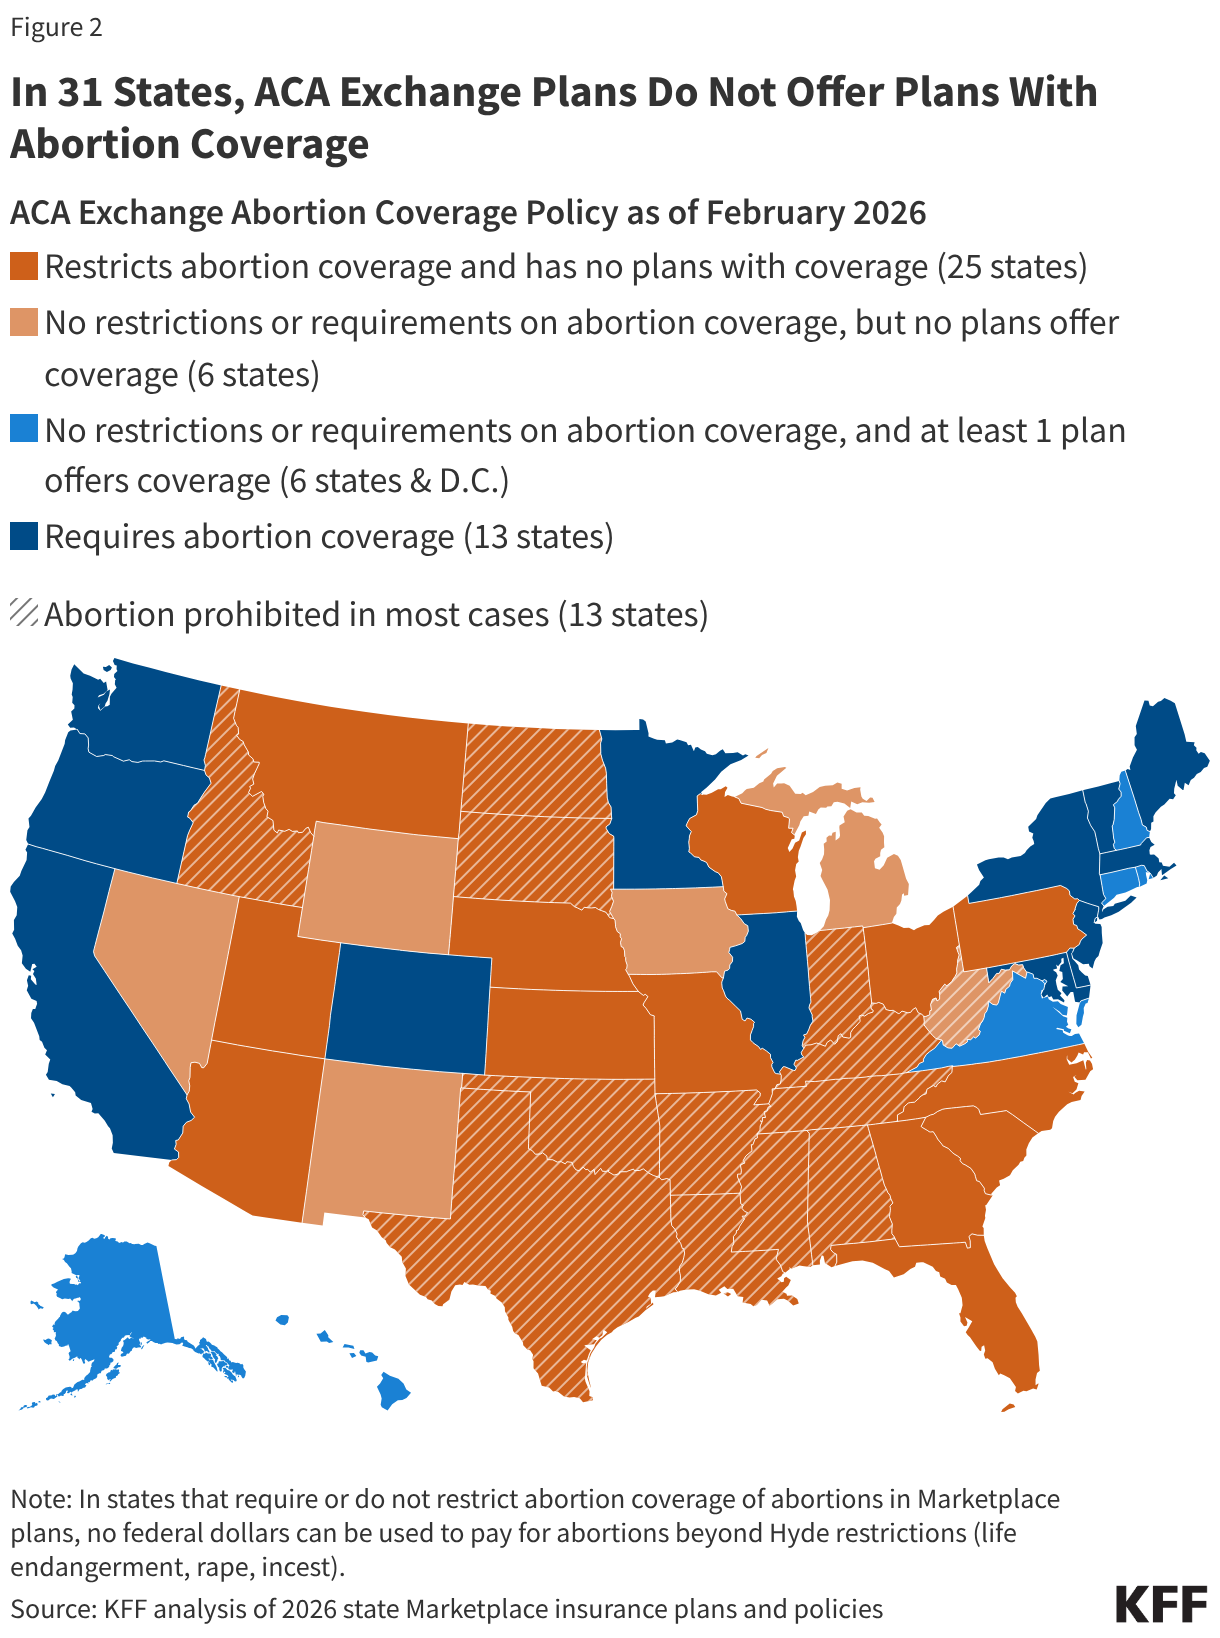
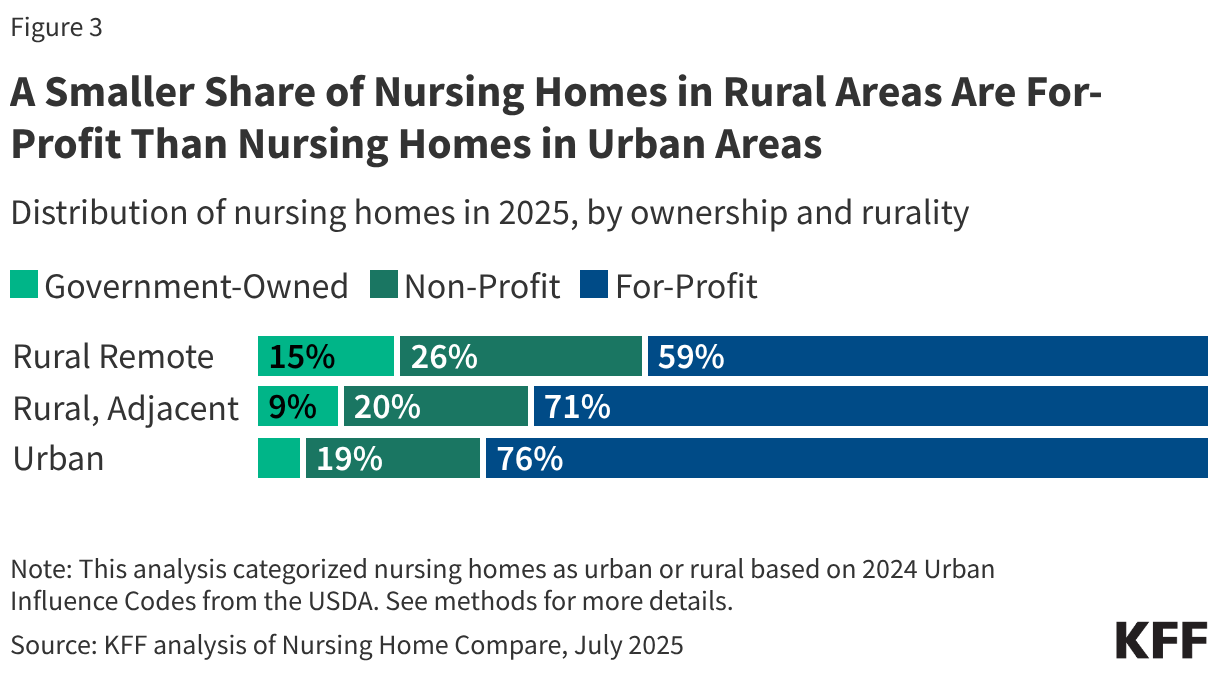
In a KFF review of the 2026 Marketplace plan statement of benefits and plan brochures in the 12 states and D.C. that have no laws requiring or prohibiting abortion coverage, six states (Iowa, Michigan, New Mexico, Nevada, West Virginia, and Wyoming) do not have any Marketplace plans that include abortion coverage (Figure 3). Six states (Alaska, Connecticut, Hawaii, New Hampshire, Rhode Island, and Virginia) and D.C. have at least one plan in their 2026 ACA Marketplace that includes abortion coverage. Although Michigan repealed their state’s ban on abortion coverage in Marketplace plans in 2023, this analysis found that while many plans in the state do not cover abortion, the statement of benefits in many other plans are silent regarding coverage or exclusion of abortion services. As a combined result of the state laws and insurance company choices, individuals in 31 states currently do not have access to a qualified health plan that includes coverage for abortions.
While the reasons why issuers in states that permit abortion coverage choose to exclude abortion coverage are not known, it is possible that the complexity of the requirements specific only to abortion coverage could be a deterrent to the plans. Plans that choose to include abortion coverage are also subject to additional reporting standards and audit requirements, and must also charge a separate premium for the coverage.
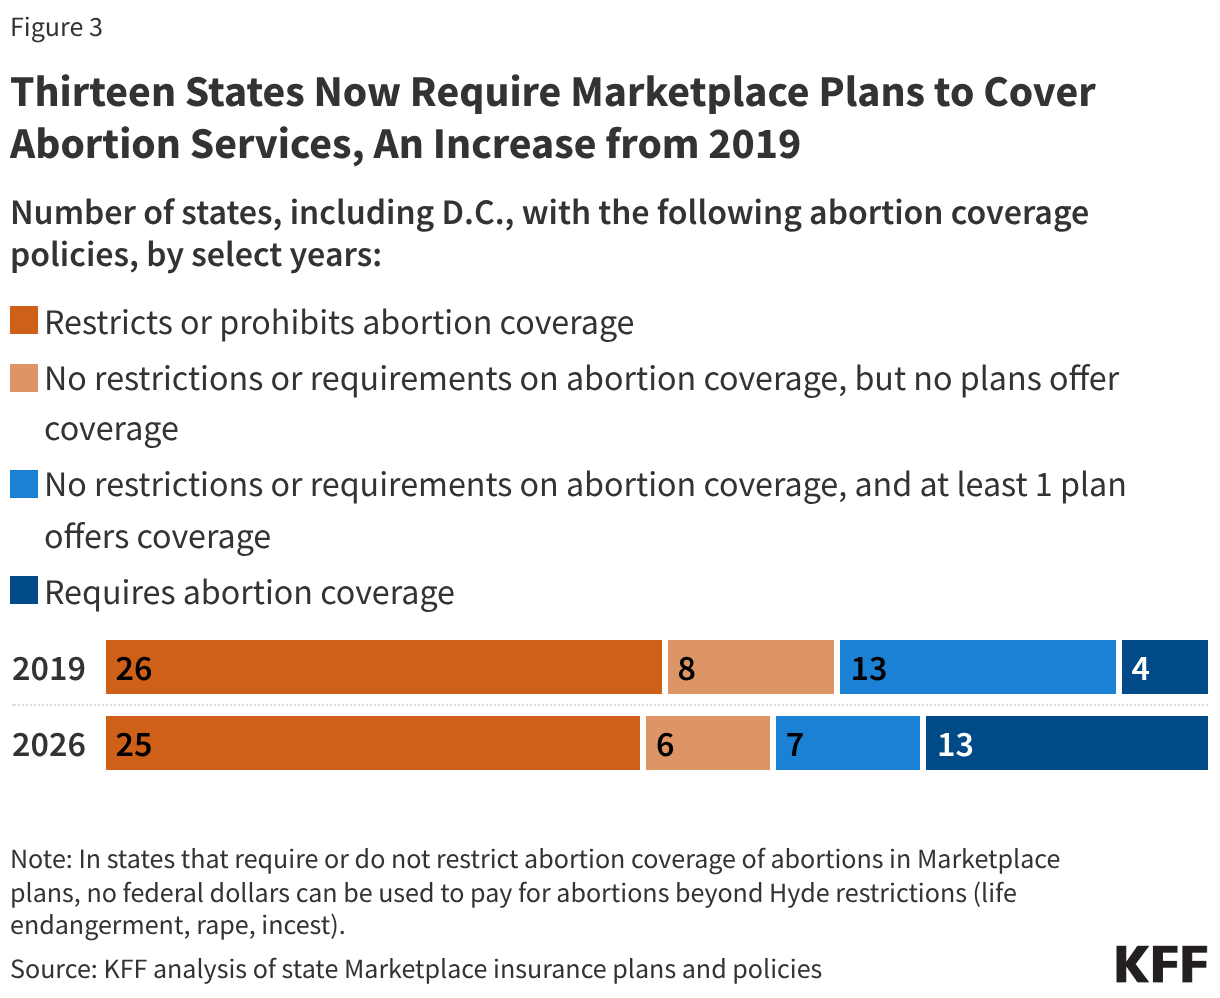
Compared to 2019, the last time KFF conducted a review of abortion coverage in ACA marketplace plans, more states now require abortion coverage in their marketplace plans (4 states vs 13 states). Six states (Colorado, Delaware, Massachusetts, Minnesota, New Jersey, Vermont) have passed laws following the Dobbs decision requiring all state regulated private plans, including ACA marketplace plans, to cover abortion services. Overall, 19 states and D.C. currently have Marketplace plans that offer abortion coverage, compared to 16 states and D.C. in 2019. Many of the states that now require coverage previously had no laws requiring or prohibiting coverage but had at least one plan that offered abortion coverage in 2019, including Vermont, Maryland, and Colorado. For individuals living in one of the six states and D.C. that have no laws requiring or restricting coverage and do offer at least one plan with abortion coverage, the actual availability of coverage depends on whether there is a plan offered in their area that includes abortion services since not all plans are offered across the whole state. For example, in Virginia, Kaiser Permanente plans are the only ones that offer abortion coverage for ACA Marketplace enrollees.
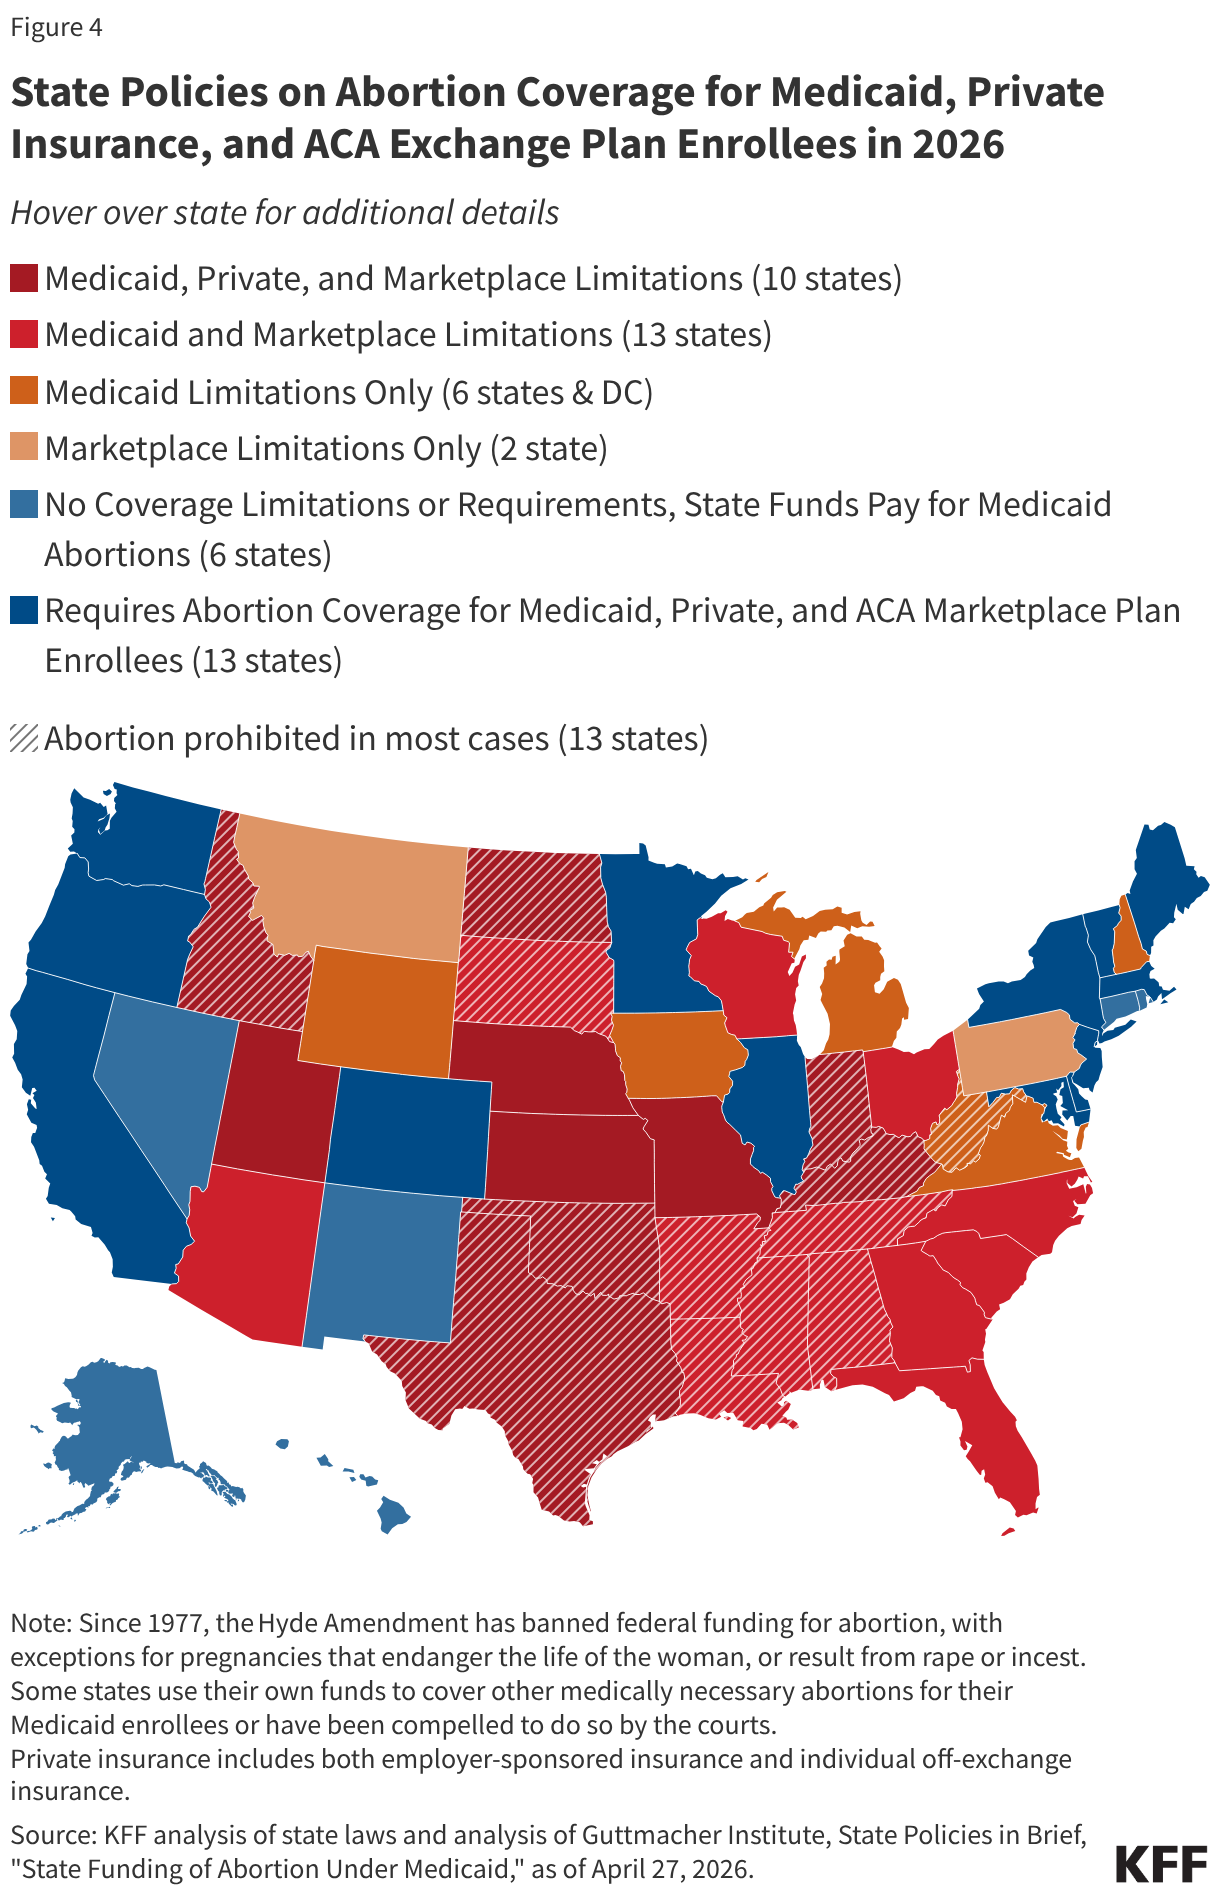
The combination of federal and state abortion provision and coverage policies has constrained options in many states. Not surprisingly, for people living in the 13 states where the provision of abortion is prohibited, regardless of their type of insurance coverage, access to abortion services within their state is extremely limited or essentially nonexistent (except for abortion medications obtained through the mail). However, in many states without these laws, abortion coverage is also limited. In four of those states, people enrolled in Medicaid, private, and Marketplace plans, have practically no abortion coverage options (Figure 4). In eight additional states, individuals who qualify for Medicaid or who are insured through their state Marketplace also do not have access to abortion coverage; in five other states and DC, people enrolled in Medicaid have extremely limited coverage. Six of these states do not offer any 2026 Marketplace plans that include abortion coverage.
Special Rules for Billing and Payment for Marketplace Plans that Include Abortion Coverage
In the 19 states & DC that either require coverage of abortions in Marketplace plans or have no restrictions or requirements for abortion coverage but offer at least one plan that covers abortion, abortion coverage must be paid for using non-federal dollars. Plans must notify consumers of the abortion coverage as part of the Summary of Benefits and Coverage (SBC) explanation at the time of enrollment. The ACA outlines a methodology for states and insurers to follow to ensure that no federal funds are used towards coverage for abortions beyond the Hyde limitations. Any plan that covers abortions beyond Hyde limitations must estimate the actuarial value of such coverage by accounting for the cost of the abortion benefit (valued at least $1 per enrollee per month) and segregate these funds from other premium funds. This estimate cannot take into account any savings that plans may achieve as a result of the patients having abortions (such as the costs of prenatal care or delivery).
The segregated funds for abortion coverage that are sitting with the plans have grown over the last 15 years. In July 2025, Maryland allocated the funds remaining in these accounts to be used to help pay for expenses of patients who travel to Maryland for an abortion. In response to state actions and building interest to reallocate these funds to support abortion services, in December 2025, CMS issued new guidance addressing how ACA Marketplace plans use the segregated funds collected from enrollees for non-Hyde abortion coverage. The new guidance states that ACA plans only need to segregate the funds for the current coverage year. At the end of the plan year, after all claims have been paid, plans may treat the premium funds collected for the coverage of non-Hyde abortions the same as other premiums funds collected, meaning that the plans can keep the funds for other uses, not just for abortion services.
Appendix