Abortion Trends Before and After Dobbs
Note: This brief was updated on July 15, 2025 to incorporate new data on abortion statistics.
- In the two years since the Supreme Court ruling that overturned Roe v. Wade, the total number of abortions nationally has slightly increased. The most recent data from the Society for Family Planning’s #WeCount project show that there were 1.14 million abortions in 2024, up from 1.05 million abortions in 2023. For most of the decade prior to the Dobbs ruling, there was a steady decline in abortion rates nationally, with a slight uptick in the years just before the ruling.
- The upward trend in abortion volume is likely due to multiple reasons, including expanded telehealth capacity, the ability to mail medication abortion pills to patients, and the lower costs for telehealth abortions through virtual clinics compared to in-person care. Medication abortion via telehealth now accounts for 25% of all abortions.
- In contrast to the abortion bans, several states have passed laws to protect abortion access for their residents and expand access to people seeking abortions from other states which have contributed in part to the increased the number of abortions in those states compared to pre-Dobbs time frame. Twelve (12) states require state-regulated private plans to cover abortion, many without cost-sharing, and 20 Medicaid programs use state-only funds to cover nearly all medically necessary abortions. Twenty-three (23) states passed shield laws intended to reduce the legal risks for clinicians who provide abortion care to patients who live in states where abortion is banned or restricted.
- The upward trend in abortion volume can also be attributed to increased interstate travel. The travel rate for abortion care across state lines nearly doubled from 2020 to 2024, with Illinois, North Carolina, New Mexico, and Kansas experiencing the highest volume of out-of-state abortion patients last year.
Following the 2022 ruling in Dobbs v. Jackson Women’s Health Organization, it was generally expected that the abortion rate would drop due to the number of states that rapidly adopted abortion bans (12 states) and early gestational restrictions (6 states). There is no doubt these policies have made abortion access much more challenging or even impossible for those seeking abortion who live in restrictive states; yet, contrary to expectations, recent data show that the number of abortions in the U.S. overall has slightly increased in two years following the Supreme Court ruling. The combination of growth in telehealth availability for abortion care, lower telehealth costs, increased legal reproductive health care protections through state efforts, and higher rates of interstate travel, all likely contributed to the unexpected trajectory in abortion volume. However, the possibility of more state bans and restrictions combined with the ongoing legal challenges seeking to further restrict access may reverse this trend. Additionally, future actions that the Trump administration could take at the federal level could further limit abortion availability and access even in states that have enshrined the right to abortion, particularly if the administration restricts the distribution of medication abortion pills through the Comstock Act or targets the provision of telehealth abortions through regulatory revisions at the Food and Drug Administration.
This brief reviews the different sources of abortion data in the U.S., the factors that have affected abortion rates across the country before and after Dobbs, and what we may see as the Trump administration, Republican majorities in the House and Senate, and a conservative federal judiciary shape policy in the coming years.
How is abortion tracked at the state and federal level?
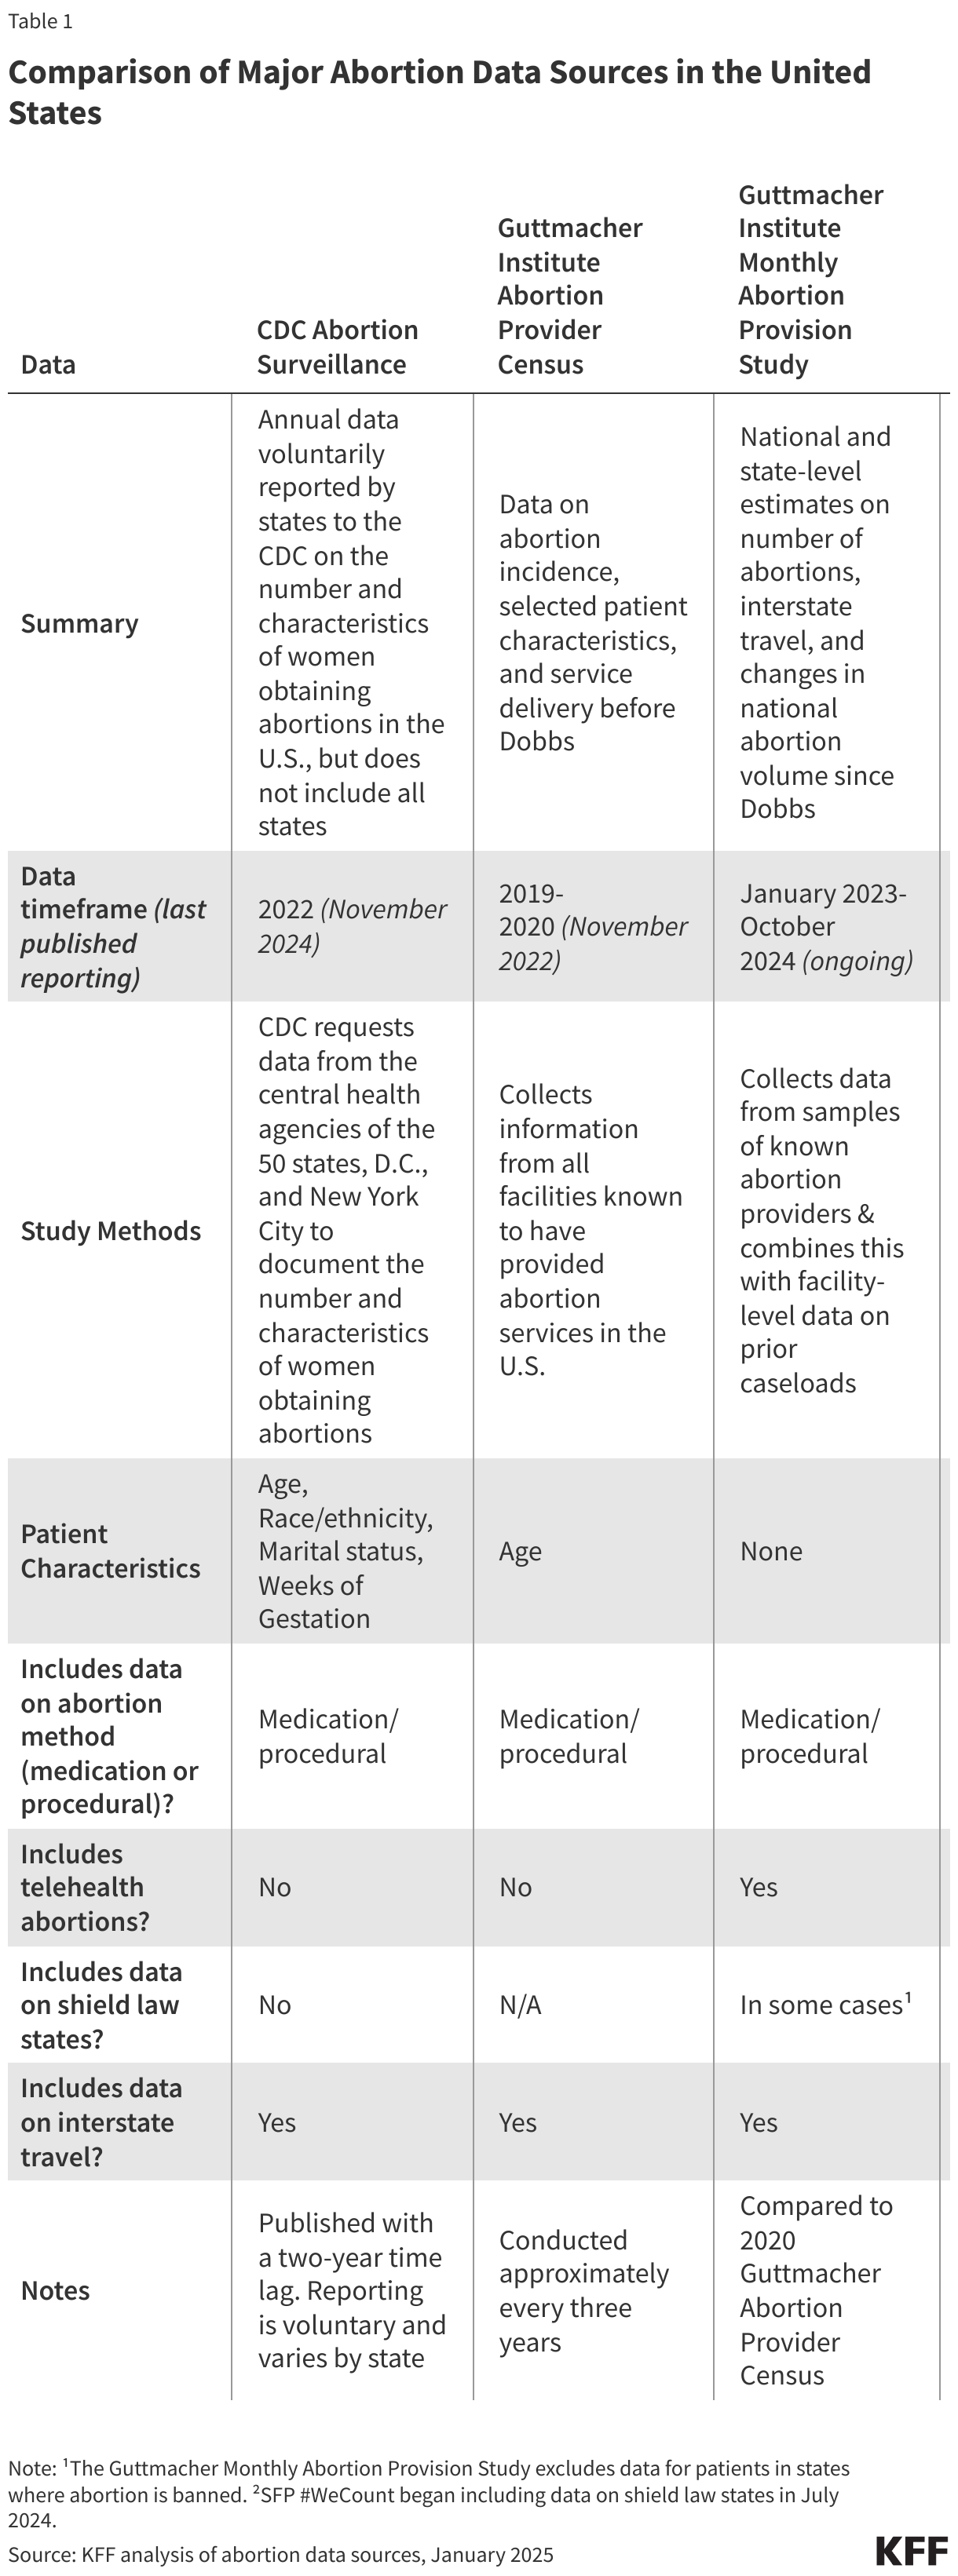
Three major organizations collect and report national and state-level data on abortion volume and rates: the federal Centers for Disease Control and Prevention (CDC), the Guttmacher Institute, and most recently, the Society of Family Planning through its (SFP) #WeCount project.
For decades, the federal CDC Abortion Surveillance System has requested data from the central health agencies of the 50 states, D.C., and New York City to document the number and characteristics of women obtaining abortions. Reporting to the CDC is voluntary and not all states participate in the surveillance system. Notably, California, Maryland, and New Hampshire have not reported data on abortions to the CDC system for years. Most states collect and report data on the demographic characteristics of patients, gestational weeks, and type of abortion procedure. CDC publishes data from the surveillance system annually, with the most recent data on abortions in 2022, reflecting a 2-year lag. As of April 2025, following the termination of federal staff from the Reproductive Health Division, it is unclear whether the CDC will continue to update its Abortion Surveillance System which currently presents data from 2022 that was released in November 2024.
Prior to the Dobbs ruling, the Guttmacher Institute, an independent research and advocacy organization, periodically conducted the Abortion Provider Census (APC), collecting data on abortion incidence, abortion facilities, and patient characteristics. Data from the APC are based primarily on questionnaires completed by known facilities that provide abortion in the country, information from state health departments, and Guttmacher estimates for a small portion of facilities. The most recent APC reports data from 2020. Following the Dobbs ruling, the Guttmacher Institute established an additional data collection initiative, the Monthly Abortion Provision Study, to track abortion volume within the formal U.S. health care system. This ongoing effort collects data on and provides national and state-level estimates on abortions while also tracking the changes in national abortion volume since 2020.
While the CDC and Guttmacher APC data differ in terms of collection methods, timeframe, and completeness, both have shown similar trends in abortion rates over the past decade. One notable difference is that Guttmacher’s survey has included continuous reporting from all states, which explains at least in part the higher abortion volume in their data.
Society of Family Planning’s (SFP) #WeCount is a newer national reporting initiative that measures changes in abortion access following the Dobbs ruling. The project provides semiannual reports on the monthly number of abortions by state and includes data on abortions provided through in-person health care settings and through telehealth. The #WeCount report started collecting data in April 2022 and has published two full years of abortion data since Dobbs.
How has the abortion rate changed over time?
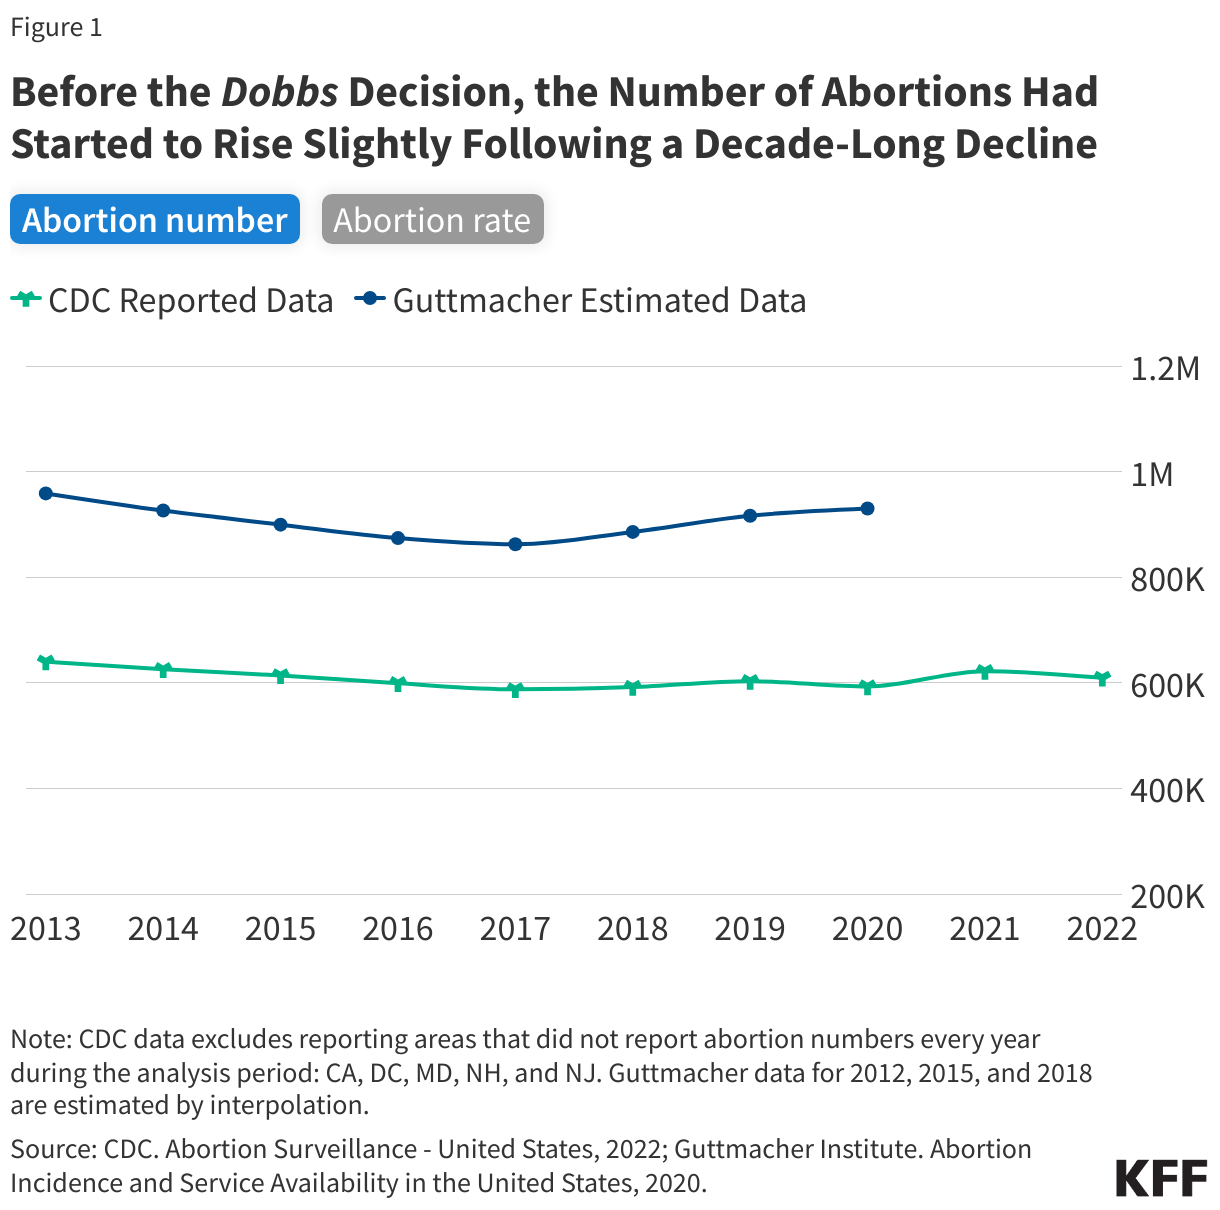
For most of the decade prior to the Dobbs ruling, there was a steady decline in abortion rates nationally, but there was a slight increase in the years just before the ruling.
The most recent CDC data are from 2022, the same year as the Dobbs decision, and show that abortion rates declined from 2013 through 2017 and remained steady in the years leading up to the court decision (Figure 1). CDC reported 609,360 abortions in 2022 and a rate of 11.2 abortions per 1,000 women (excludes CA, DC, MD, NH, and NJ). In contrast, the Guttmacher Institute reported 930,160 abortions in 2020 and a rate of 14.4 abortions per 1,000 women. Guttmacher’s study showed a slight upward trend in abortion from 2017 to 2020 whereas CDC’s report showed a stable rate in abortions from 2017 to 2022 except for a slight uptick in 2019 and 2021.
Experts generally attribute the long-term decline in abortion rates to increased use of more effective methods of contraception. The slight increase in the years leading up to the Dobbs decision could be due to greater state-level coverage of Medicaid enrollees that made abortion access more affordable in some states as well as broader financial support from abortion funds to help individuals pay for the costs of abortion care.
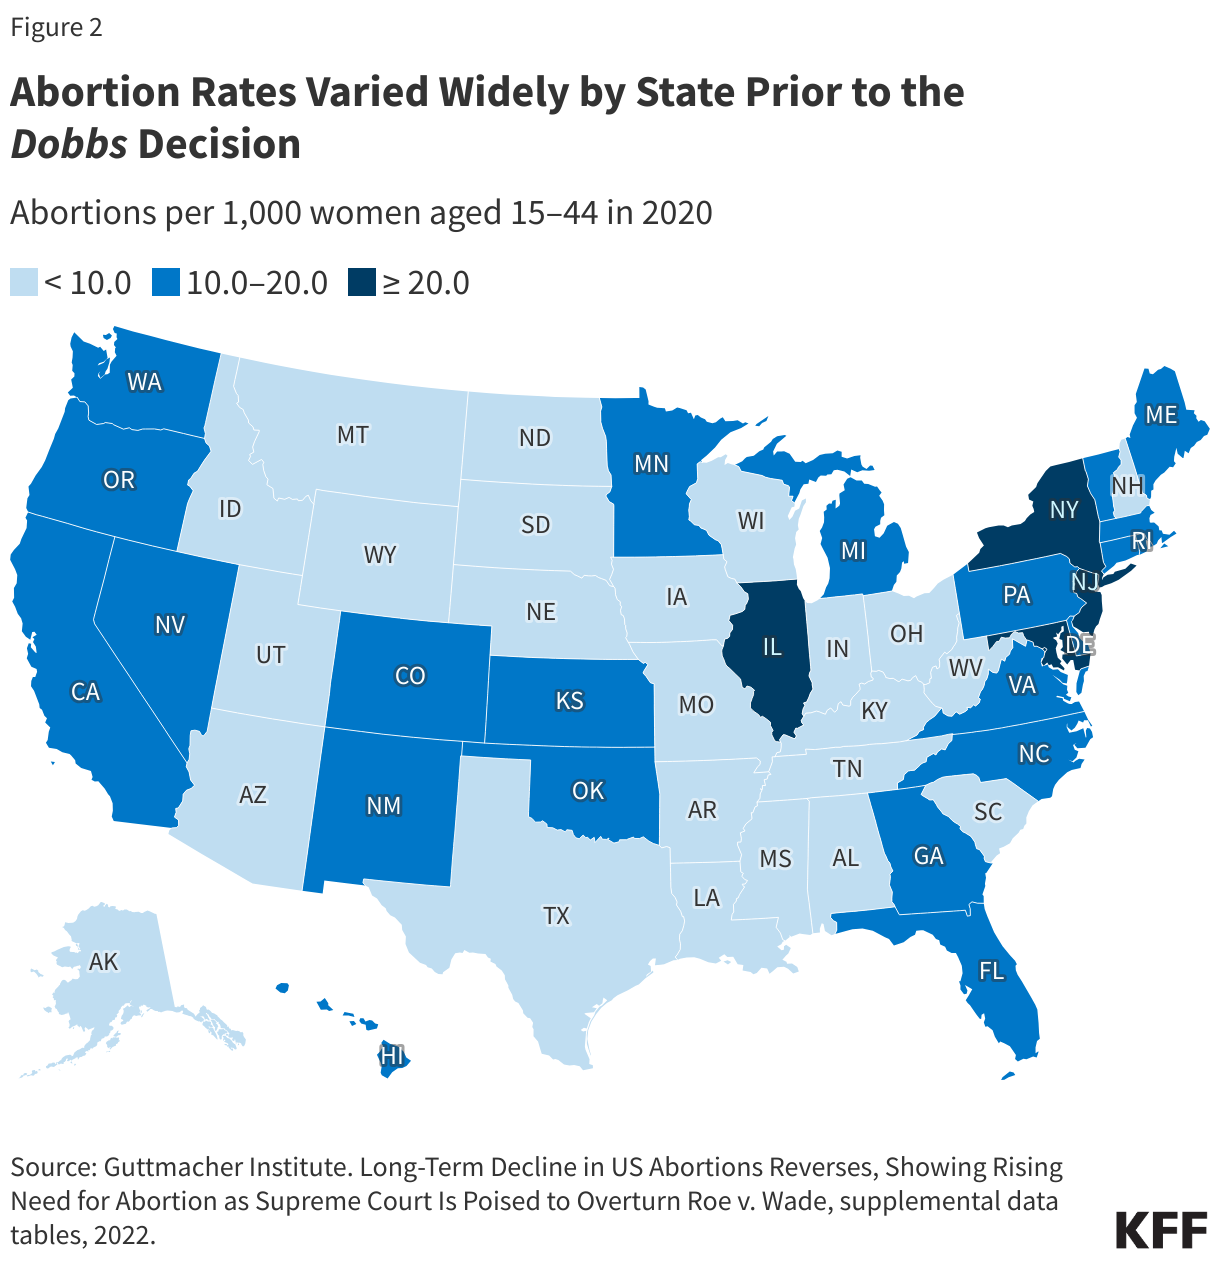
Even prior to the Dobbs ruling, abortion rates varied widely between states.
National averages can mask local and more granular differences. Some of the variation in abortion volume and rates has been due to the wide differences in state policies that have shaped the availability of abortion, with some states historically placing restrictions on abortion (such as targeted regulations of abortion providers, requirements for multiple visits, and mandatory waiting periods), that constrained abortion access and availability. In some states, there were only one or two abortion providers even before Dobbs.
What has happened to abortion volume since Dobbs?
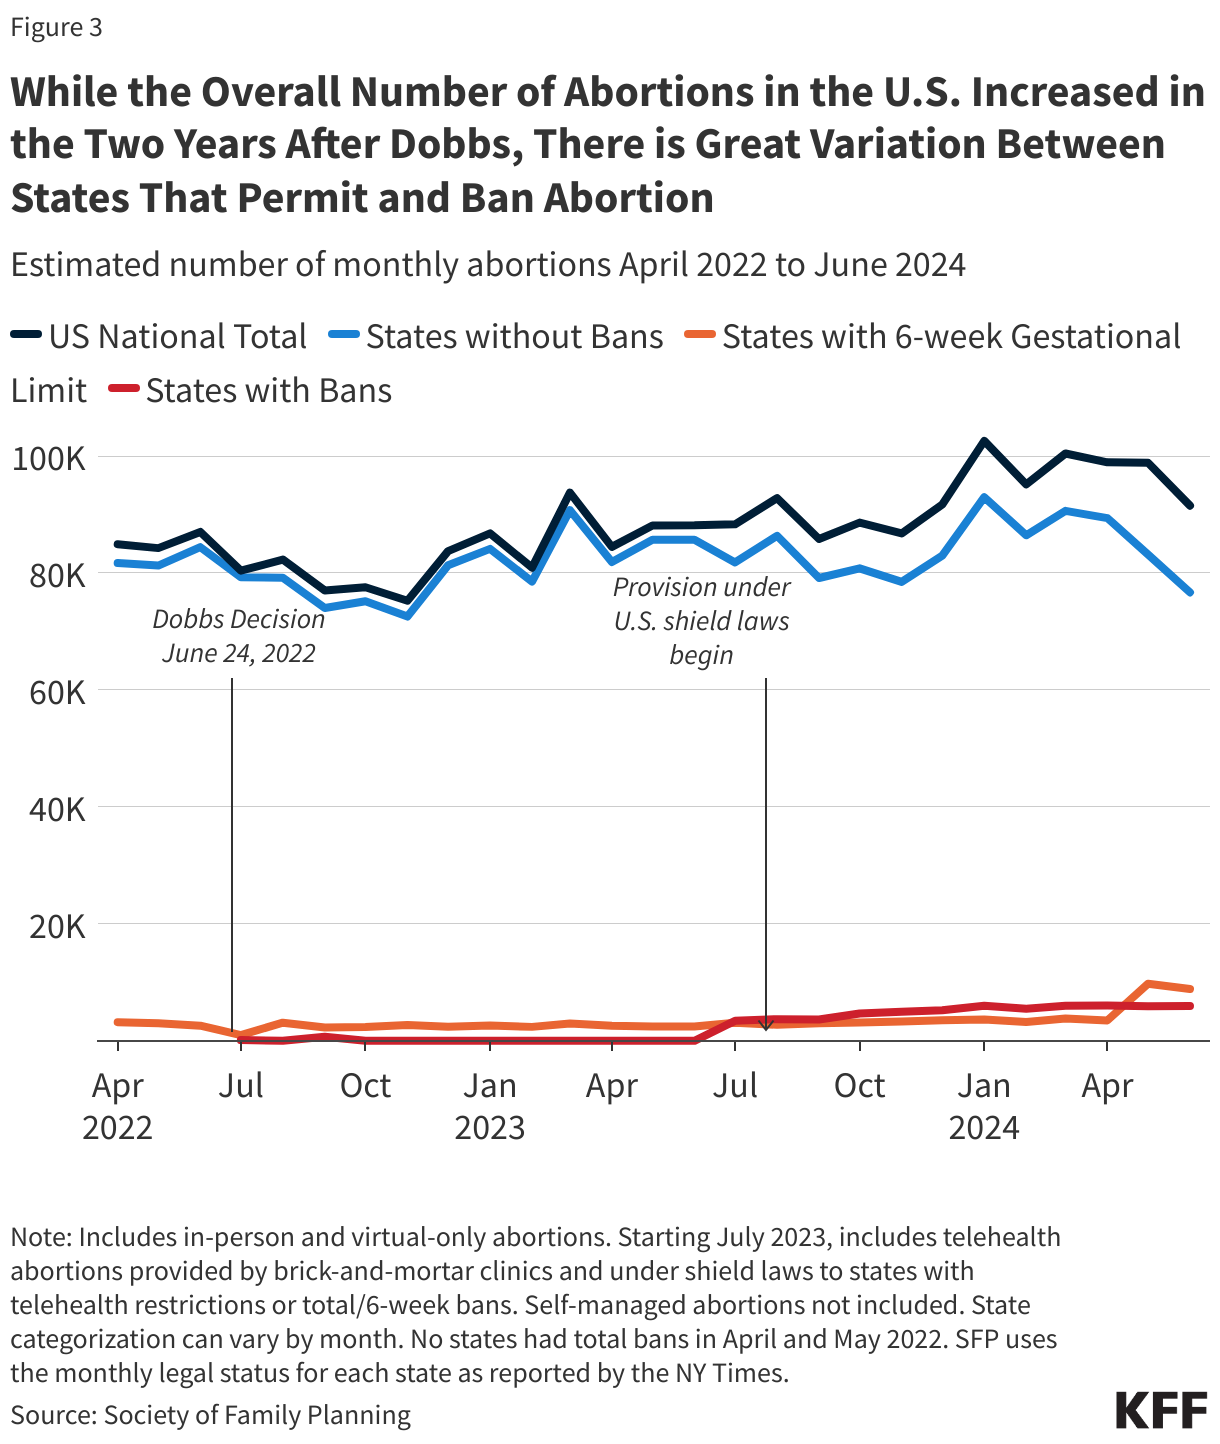
The SFP and Guttmacher Institute data both find that while the number of abortions in the U.S. dropped immediately following Dobbs, the total number of abortions nationally has increased two years following the ruling. However, the consistency observed at the national level obscures wide state-level variation and sharp declines in the number of abortions in states with bans and early gestational restrictions.
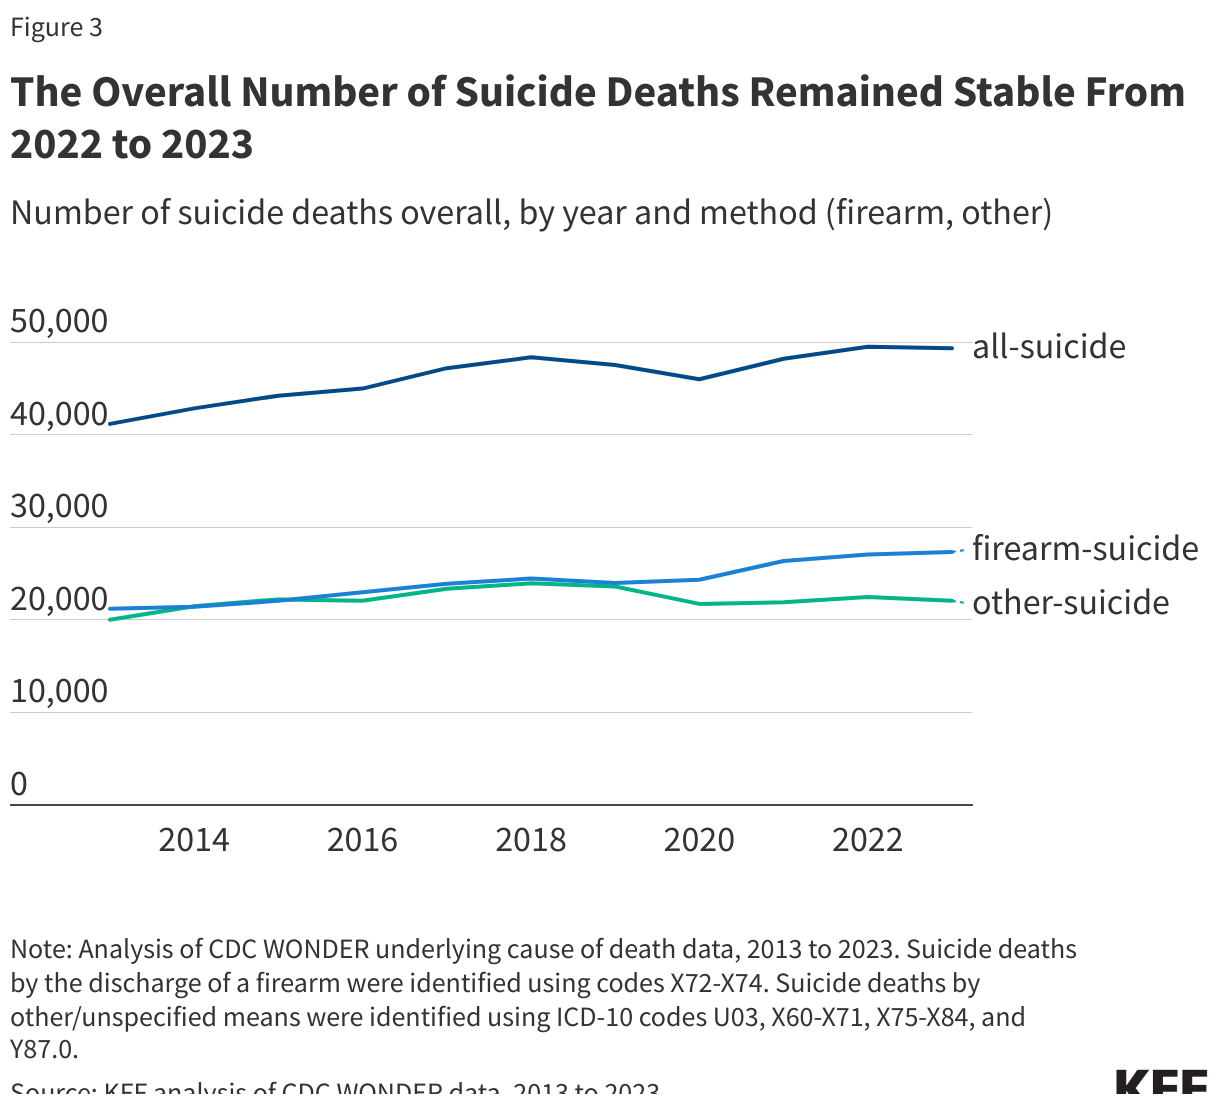
The latest SFP’s #WeCount data show that in 2024, there were an estimated 1.14 million abortions, slightly up from 1.05 million in 2023. The monthly average number of abortions increased from 88,000 abortions per month in 2023 to 95,200 in 2024 (Figure 3).
Why did the number of abortions increase after states instituted bans?
While it was not a total surprise that states without abortion bans had an increase in abortions following the Dobbs ruling, the reasons behind this increase are complex. The upward trend is likely due to a combination of increased interstate travel for abortion access by people coming from abortion ban states, the presence of state-level laws in states that protect providers who offer abortion services, lower costs associated with telemedicine medication abortions, and expanded virtual/telehealth capacity and the ability to mail medication abortions pills to patients among both bricks-and-mortar and telemedicine-only providers.
The Rise of Medication Abortion, Telehealth, and Virtual Clinics
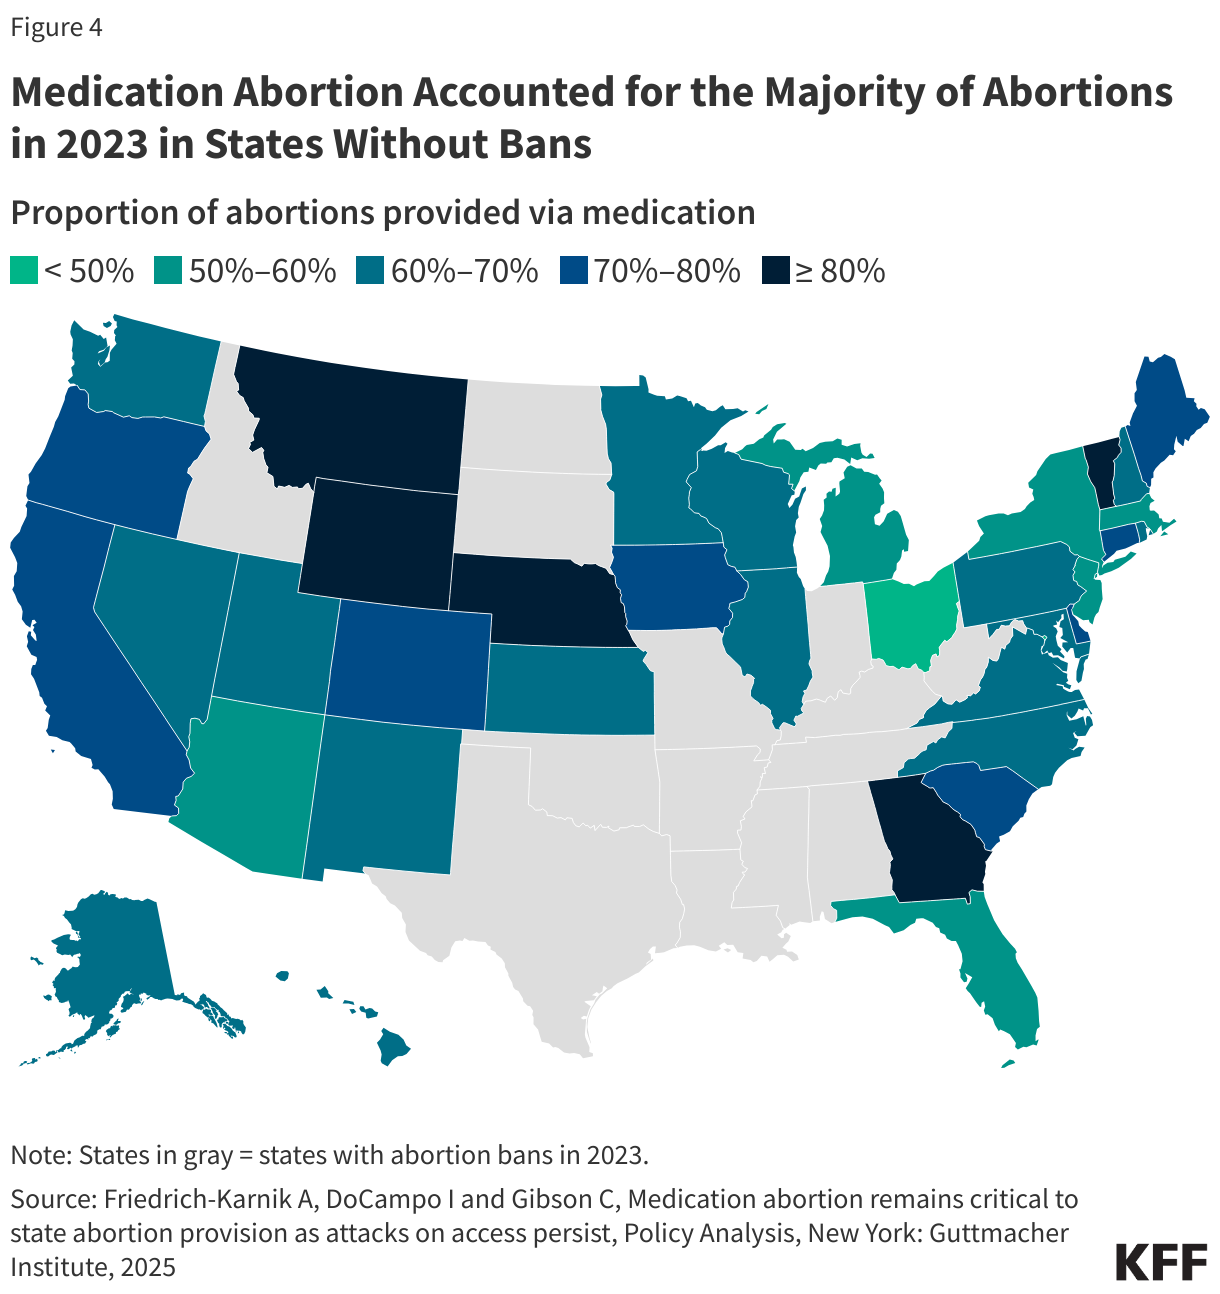
While procedural abortions are only performed in a clinical setting, medication abortion can be provided either in a clinical setting or remotely via telehealth. Medication accounts for nearly two thirds (63%) of abortions nationally. Approved by the U.S. Food and Drug Administration (FDA) in 2000, medication abortion has a solid safety and effectiveness record regardless of whether the pills are dispensed in person by a clinician (either medical doctor or advanced practice clinician) or via telehealth and mailed or dispensed through a retail pharmacy. Medication abortion successfully terminates the pregnancy 99.6% of the time, with a 0.4% risk of major complications, and an associated mortality rate of less than 0.001 percent (0.00064%). The latest Guttmacher data show that in states without bans, medication accounted for the majority of abortions in 2023 (Figure 4). In five states (MT, WY, NE, GA, and VT), more than eight in ten abortions were medication abortions.
Access to medication abortion via telehealth had been historically limited by an FDA policy (Risk Evaluation Mitigation Strategy or REMS) that had permitted only physicians in a health care setting to dispense mifepristone in person. This resulted in a restriction on the ability to mail the pills or for retail pharmacies to dispense. In December 2021, the FDA revised this policy lifting the requirement that clinicians dispense the drug only in-person. This was done, in part, to alleviate the burden placed on the health care delivery system during the COVID-19 public health emergency. In January 2023, the FDA finalized a policy change that allows retail pharmacies to dispense medication abortion pills to patients with a prescription. These changes opened the door to greater use of telehealth for medication abortions.
The increase in telehealth abortions has also been driven in part by the rise in the number of virtual abortion clinics. The number of virtual clinics began to rise after the FDA revised its in-person dispensing requirement in 2021 and now accounts for a quarter (24%) of facilities that offer medication abortion services.
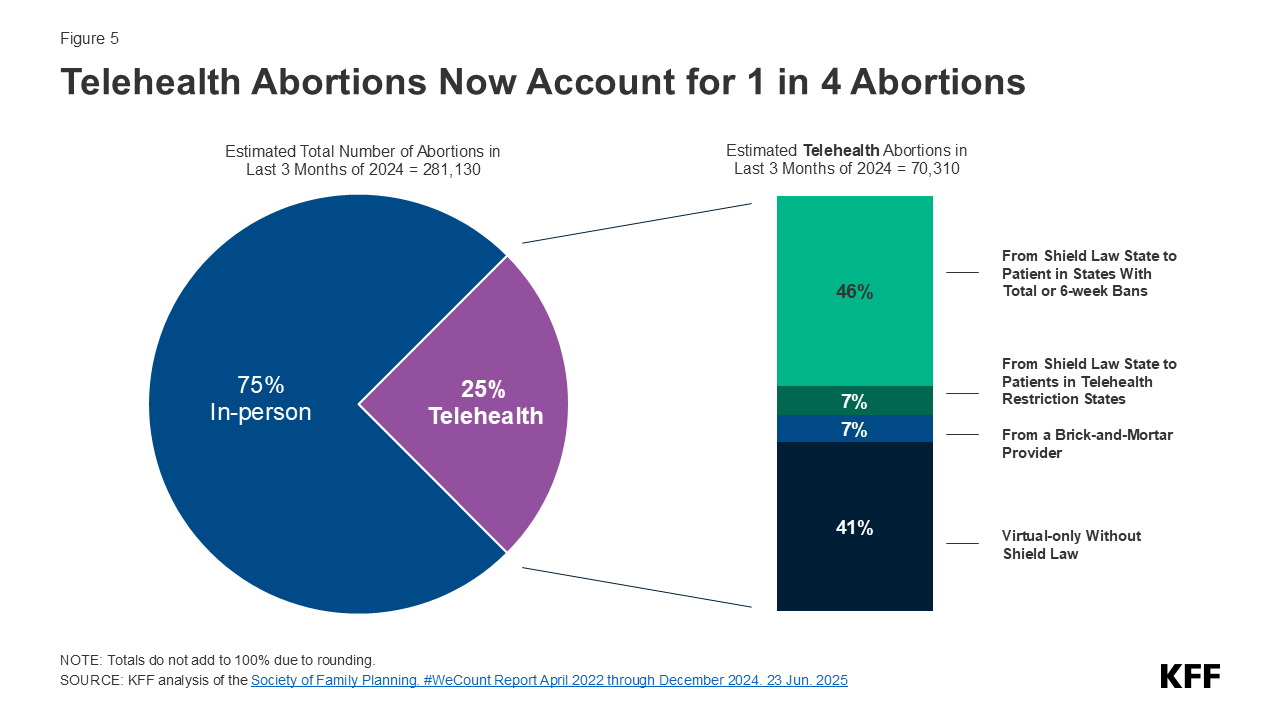
SFP’s #WeCount study breaks out monthly averages for telehealth abortions, and the most recent report shows that telehealth abortions accounted for 25% of all abortions in the last quarter of 2024 (Figure 5). The latest #WeCount reports distinguish between telehealth abortions provided by brick-and-mortar facilities from those provided under shield laws that give some legal protections to clinicians who provide abortion care via telehealth to people living in states with bans and restrictive policies. More than half of these telehealth abortions were performed under shield laws (53%), 7% of abortions were from online services offered by clinics that traditionally operate from physical locations (brick-and-mortar facilities), and four in ten (41%) were from virtual-only clinics. The provision of telehealth abortions varies widely across states, ranging from 7% of all abortions in some states and reaching 40% of all abortions in other states.
Costs for Telemedicine Abortions
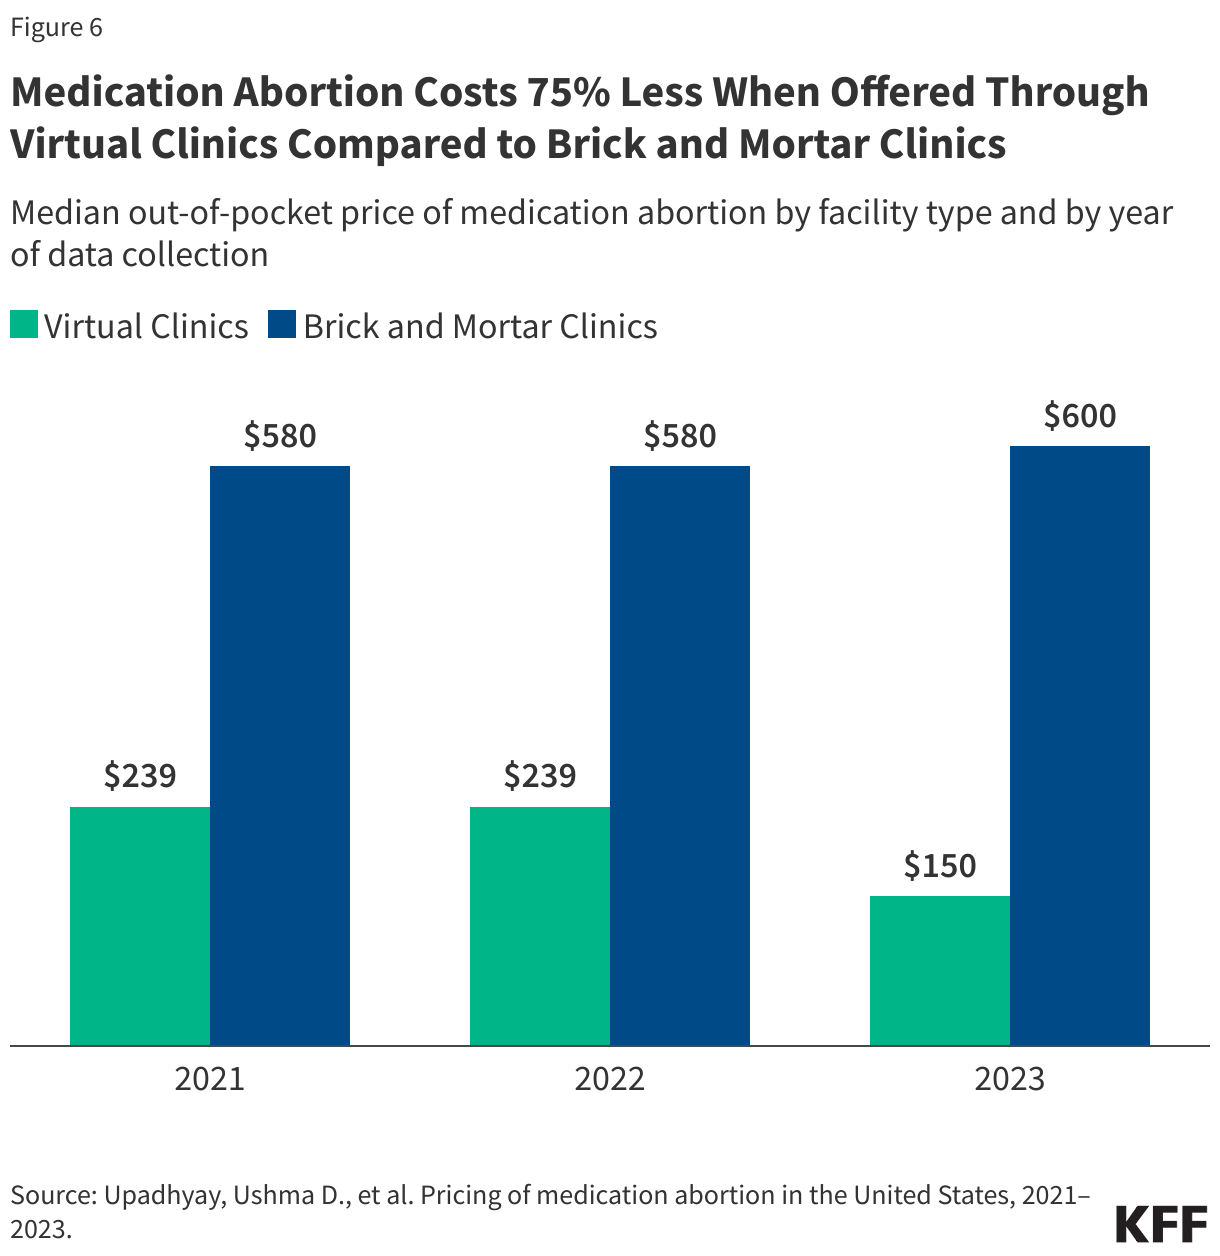
The median price of medication abortion offered through brick-and-mortar clinics increased from $580 in 2021 to $600 in 2023. In contrast, the median price of medication abortions via virtual clinics decreased from $239 in 2021 to $150 in 2023, which is 75% less than the cost of in-person care (Figure 6). Virtual clinics do not incur many of the costs of a physical clinic, such as building maintenance, meeting regulations for surgical centers, and security to handle protesters. The increased availability of telehealth and virtual clinics has lowered the costs of care and reduced financial barriers resulting from abortion services as well as travel and other related expenses.
Costs for some have also been offset by the availability of financial assistance and logistical support from national and local networks of abortion funds. Since Dobbs, these networks received a reported 39% more requests for abortion support and financially supported more than 100,000 individuals seeking abortion care. While donations to these networks increased immediately following Dobbs, the frequency of donations has slowed, and funds have begun to taper. Some organizations recently reported suspending operations altogether, signaling that abortion volume may consequently dwindle as demand outpaces donations.
State-Level Protections
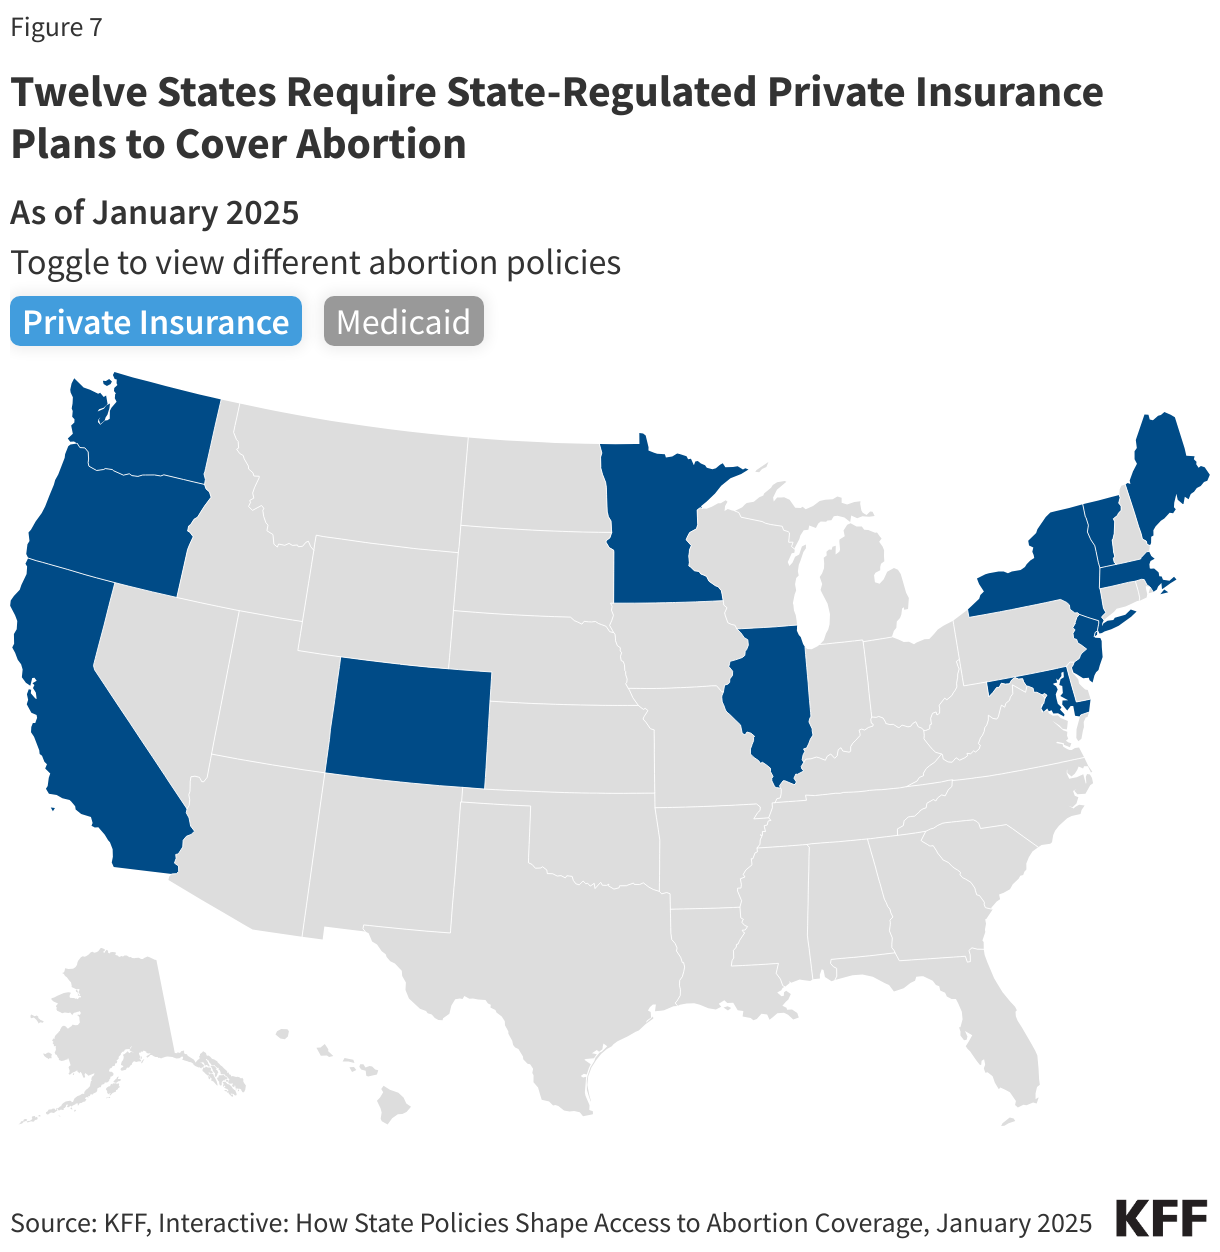
Over the past several years, some of the states where abortion remains legal have passed laws to protect abortion access for their residents and expand access to people seeking abortions from other states. For example, residents in California are protected from civil liabilities for providing or receiving abortion services, and providers are protected from professional discipline. Policies that have been implemented include using state funds to cover abortions under Medicaid beyond federal limitations, raising Medicaid reimbursement rates for abortion services, requiring state-regulated private plans to cover abortion, and enacting shield laws to protect clinicians who provide abortions in their states either in person or via telemedicine.
Today, 12 states require state-regulated private plans to cover abortion, some without any cost-sharing (Figure 7).
State actions to use their own revenues to pay for abortions have also expanded access to abortion services. States are not restricted by the federal Hyde Amendment (which bans the use of federal funds for abortion in Medicaid, Medicare and other public programs unless the pregnancy is a result of rape, incest, or if it endangers the woman’s life) and have the option to use state-only funds to cover abortions under other circumstances for women on Medicaid, which 20 states do currently.
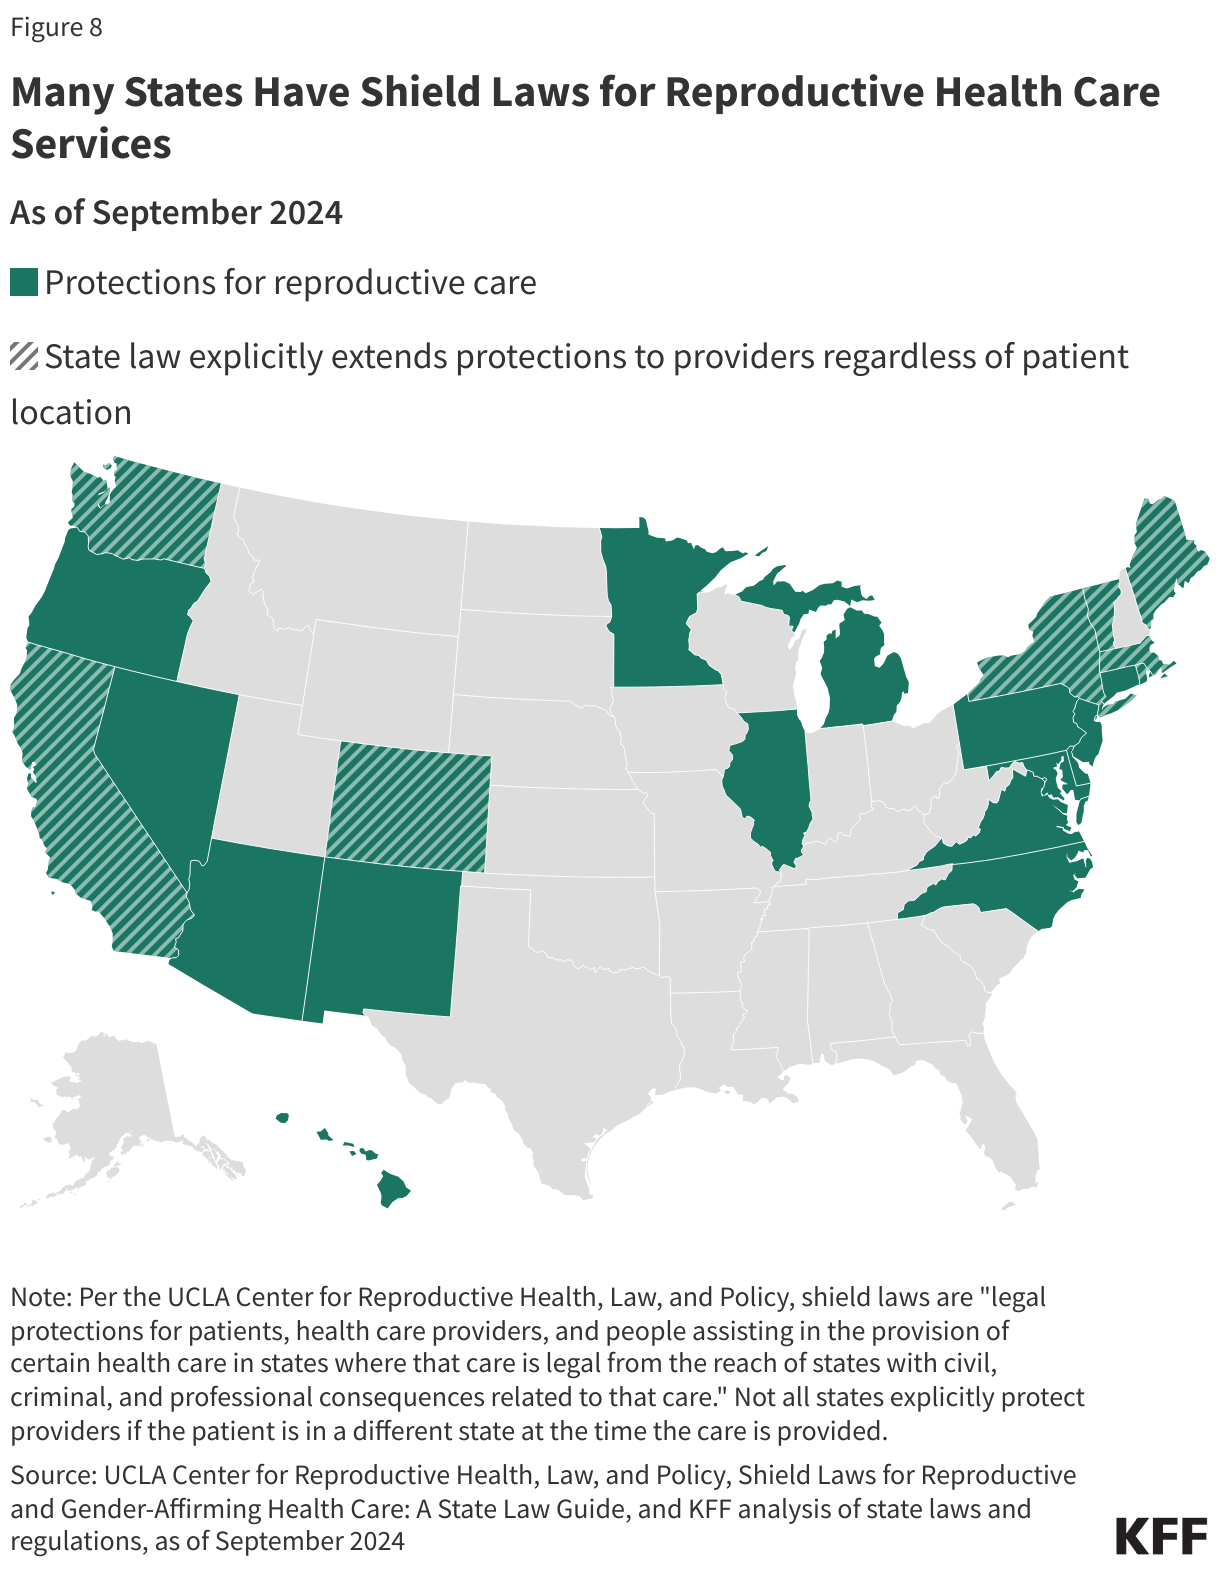
A growing number of states passed shield laws to reduce the legal risks for clinicians who provide abortion care to patients who live in states where abortion is banned or restricted. While the details of these laws vary state to state, some policies protect clinicians from professional discipline for offering health care that is criminalized in another state, and others protect clinicians who provide care to patients across state lines, such as by prescribing and mailing abortion pills via telehealth services to patients in their state of residence. Some states also passed broader shield laws to protect patients and people assisting with reproductive services from civil and criminal consequences. As of February 2025, 22 states and Washington D.C. have enacted shield laws, with 8 states extending explicit protections to clinicians regardless of patient location or state of residence (Figure 8).
Interstate Travel
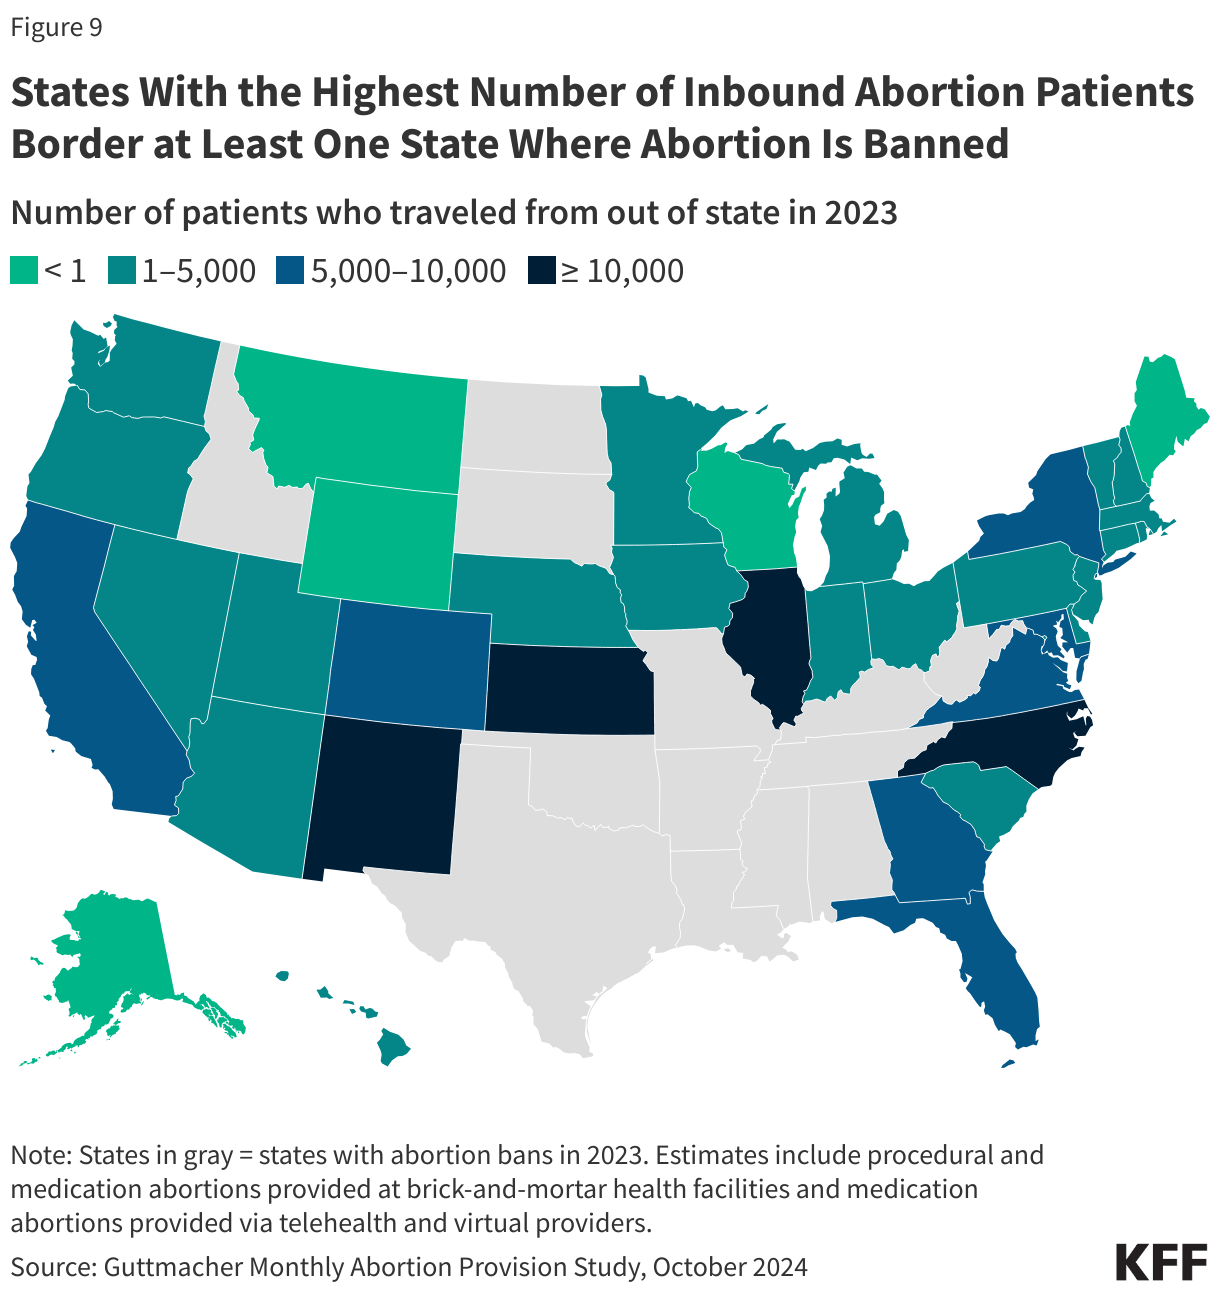
The Guttmacher Institute Monthly Abortion Provision Study is the only data source so far to provide in-depth information on interstate travel pre- and post-Dobbs. Guttmacher estimates that prior to Dobbs, nearly one in ten people obtained an abortion by traveling across state lines in 2020. Even though abortion was legal, there were considerable restrictions in many states that made abortion access very limited, which led to the need for interstate travel for abortion care for some people. The latest data show that 155,000 patients traveled out of state for abortion care in 2024, a slight drop from 170,000 in 2023 but nearly double the number of travelers in 2020 (81,000). The states with the highest number of people traveling inbound for abortion care border at least one state where abortion is banned, including Illinois (35,470 patients), North Carolina (16,640 patients), Kansas (15,930 patients), and New Mexico (12,730 patients) (Figure 9).
The volume of interstate travel into Florida and North Carolina is especially notable as they were two of the last southern states in 2023 where abortion was legal beyond six weeks of gestation. However, the policies in these two states became more restrictive. North Carolina went from a 20-week ban to a 12-week ban in July 2023, and Florida’s 15-week ban changed to a 6-week ban in May 2024. The volume of interstate travel into Florida declined from 9,100 travelers in 2023 to 4,010 travelers in 2024 (data not shown). Conversely, the volume of interstate travel into North Carolina increased from 14,860 in 2023 to 16,640 in 2024 (data not shown). This is largely due to Florida’s stricter gestational stage ban, which curtailed abortion access in the region and has resulted in patients in southern states having to travel elsewhere for abortion care.
While the data show that abortions slightly increased one full year after Dobbs, ongoing and impending legal challenges, state legislative efforts, and federal executive actions could further alter the reproductive care landscape and have impacts beyond abortion counts. A recent JAMA study, for instance, found that fertility rates have increased in states with complete or 6 week abortion bans, namely among populations with the greatest structural disadvantages and barriers to obtaining abortion care. A concurrent study showed infant mortality rates have also risen in these states, many of which are already experiencing some of the worst maternal, infant, and child health outcomes in the U.S. The findings from these studies underscore the widespread repercussions of policy efforts aimed at restricting abortion access.