Most Office-Based Physicians Accept New Patients, Including Patients With Medicare and Private Insurance
Over the past decade, health care prices paid by private insurers have risen sharply. These higher prices contribute to higher health care costs per person, which contribute to higher premiums and out-of-pocket spending among the privately insured. In contrast to Medicare, which pays physicians based on a fee schedule, prices for those with private insurance are negotiated by payers and providers, and on average, private insurers pay 143% more for physician services than Medicare. The difference in Medicare and private prices has served as the basis for proposals to adopt Medicare rates, or a multiple of Medicare rates, for those with private insurance, or as part of a Medicare-like plan through a public option or single payer plan.
Over the years, some have questioned whether the level of Medicare payments for physicians are too low to cover the costs of providing care and have raised concerns that moving towards Medicare rates would cause access problems. Previous KFF analysis has found that even though Medicare payments to physicians are lower, the vast majority of Medicare beneficiaries report having a usual source of care and high levels of satisfaction with the quality of their medical care. In addition, two separate KFF analyses, using data from 2012-2013 and 2020, found that the nearly all physicians accept Medicare, and only a small fraction “opt out” of Medicare altogether.
This brief builds on and updates the previous KFF analyses by drawing on the 2019 National Electronic Health Records Survey (NEHRS) to examine: 1) the share of non-pediatric office-based physicians accepting new patients with Medicare or private insurance and how these rates have changed over time; and 2) the share of physicians accepting new patients by physician specialties, geographic areas, and physician and practice characteristics across Medicare and private insurance. We are only able to assess whether doctors report accepting any new patients and cannot evaluate whether all new patients are accepted or how timely or convenient it is to schedule an appointment. This analysis further examines the extent to which non-pediatric physicians are opting out of Medicare, by specialty and state, drawing on 2022 opt-out affidavit data published by the Centers for Medicare & Medicaid services and data on the total number of active state-licensed physicians from Redi-Data, Inc (See Methods box for details).
Key findings include:
- Across almost every dimension we examine, the share of physicians accepting new Medicare patients is similar to the share accepting new patients with private insurance, with the only exception being the share of obstetricians and gynecologists accepting new Medicare patients (93%) is somewhat lower than the share accepting new privately-insured patients (99%). Physicians accepting new patients with private insurance will not be participating in every plan’s network, and similarly will not be in every Medicare Advantage plan network.
- Most non-pediatric office-based physicians accept new Medicare patients (89%), as well as new private insurance patients (91%).
- In 2011 and 2019, 88% and 89% of non-pediatric office-based physicians accepted new Medicare patients, respectively, with modest fluctuations in the years in between. The share accepting new patients with private insurance increased by 10 percentage points over the period, rising from 81% in 2011 to 91% in 2019, a share similar to Medicare.
- Across most specialties, the majority of physicians (at least 80%) accept new patients with Medicare and private insurance. Almost all surgical specialists accept new Medicare and privately-insured patients (96% for both). Among primary care physicians the rates are lower, but comparable for new patients with Medicare (83%) and private insurance (86%), similar to the share of physicians in other medical specialties accepting new Medicare (87%) and privately-insured (88%) patients. The share of physicians accepting new patients is lowest among psychiatrists with 60% accepting new Medicare patients and 59% accepting new privately-insured patients.
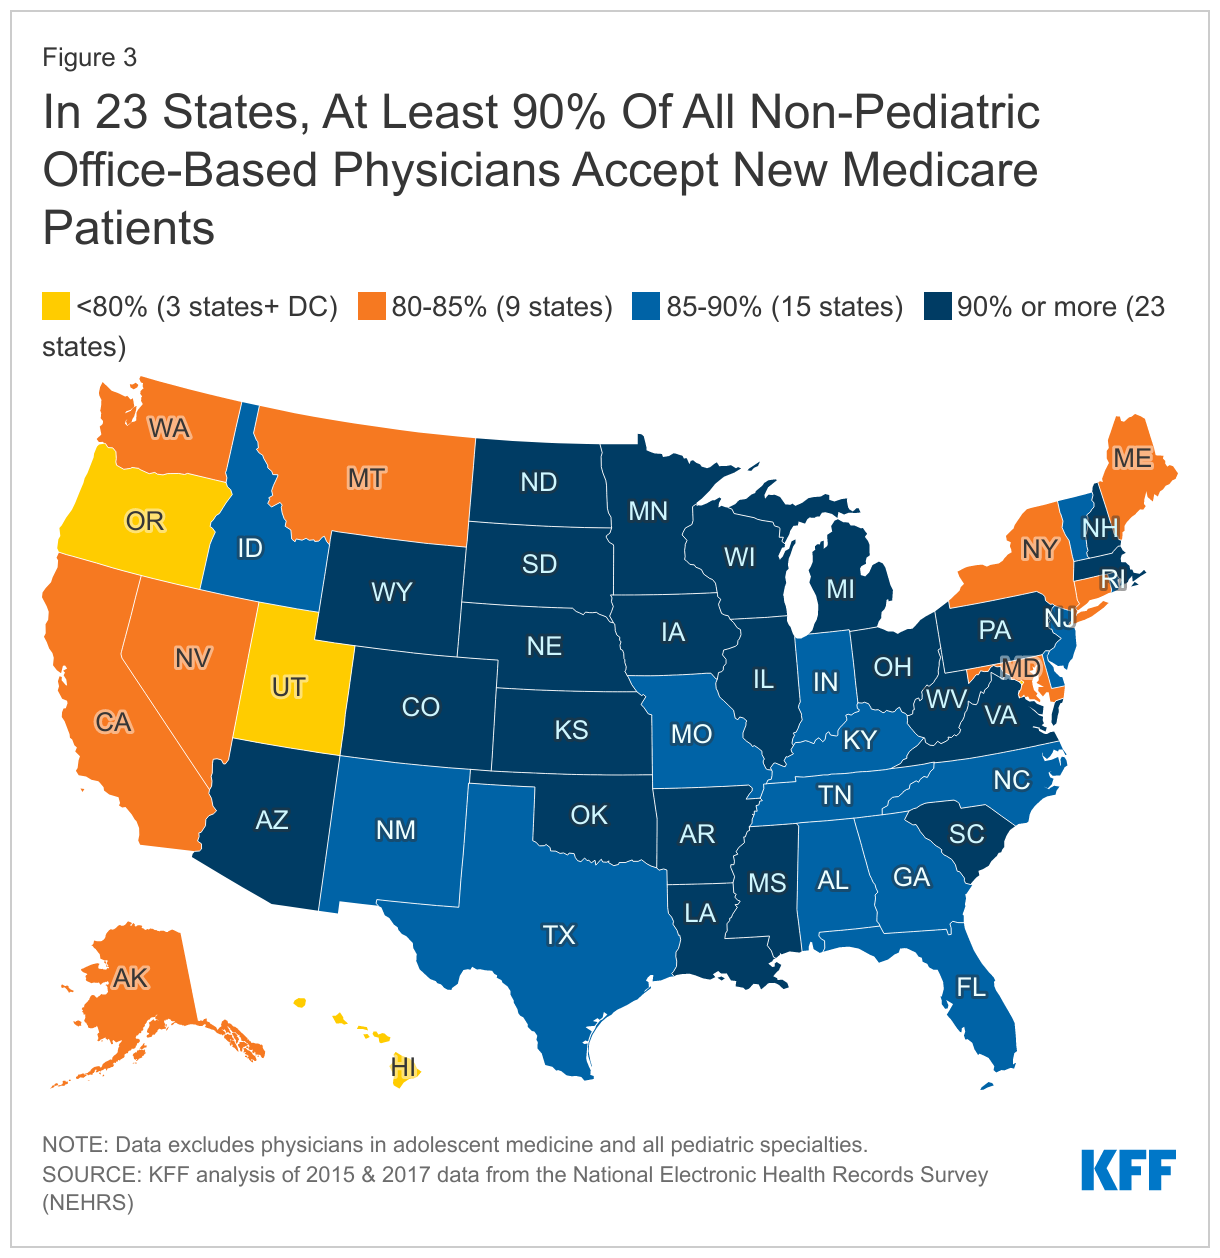
- In 23 states, at least 90% of all non-pediatric office-based physicians accepted new Medicare patients in 2015-2017. Across states, the share of physicians accepting new Medicare patients ranged from a high of 95% in three states (Iowa, Minnesota, and Pennsylvania) to a low of 76% in the District of Columbia, similar to the range across states for privately-insured patients.
- A very small (1%) share of non-pediatric physicians formally opted-out of the Medicare program in 2022, with psychiatrists accounting for a disproportionate share of physicians opting-out. In all states except for Alaska and Colorado, less than 2% of physicians have opted-out of Medicare.
Findings
Acceptance of new patients by office-based physicians by type of insurance coverage
Differences in payment rates may affect whether people with different types of insurance coverage have comparable access to physician services. We use data from the National Electronic Health Records Survey (NEHRS) for 2011 to 2019 (the most recent year of data) to assess whether there are differences in the share of non-pediatric office-based physicians who are accepting new patients across Medicare and private insurance.
The vast majority of non-pediatric office-based physicians accept new patients, with similar shares accepting new Medicare and privately-insured patients. Overall, 95% of office-based physicians accepted new patients in 2019. The share of physicians accepting new patients was similar for Medicare (89%) and private insurance (91%), with no statistically significant differences between the payers (Figure 1). The share of physicians accepting any new patients is higher than the share accepting Medicare or private insurance because some physicians only accept patients with one type of insurance but not others, including types of insurance not broken out here (i.e., self-pay patients).
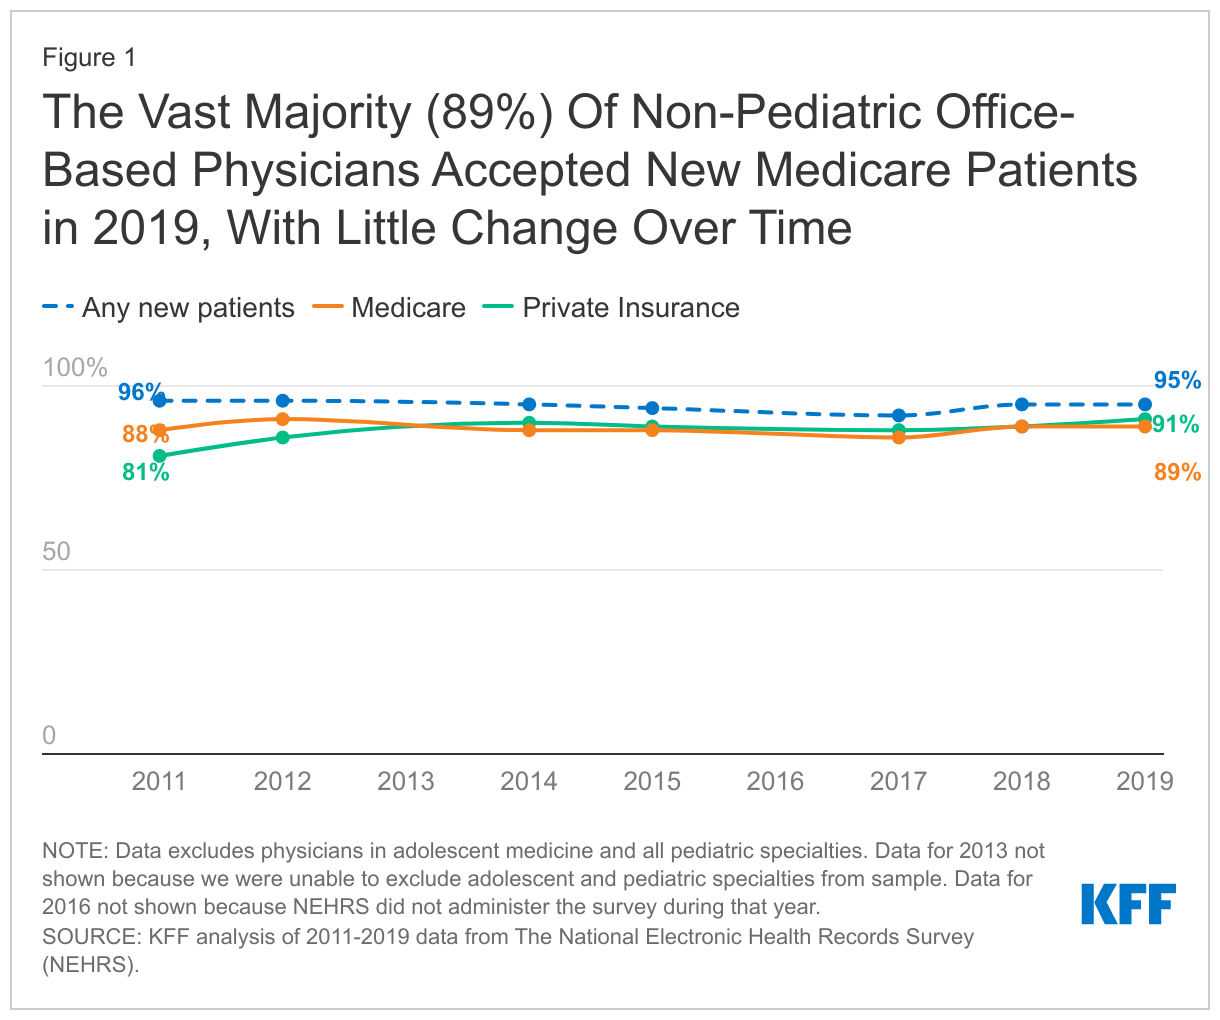
Between 2011 and 2019 the overall share of non-pediatric office-based physicians accepting new patients was stable and a consistent share accepted new Medicare patients. In 2011 and 2019, 88% and 89% of office-based physicians accepted new Medicare patients, respectively, with modest fluctuations in the years in between. During this same period, the share of physicians accepting new privately-insured patients increased from 81% in 2011 to 91% in 2019, becoming more similar to the share that accepted new Medicare patients (Figure 1).
Share of physicians accepting new Medicare and privately-insured patients, by specialty
To understand whether access varies more for some types of physicians, we examine whether the share of physicians accepting new patients is different for primary care, medical and surgery specialty groups, and among 12 common specialties.
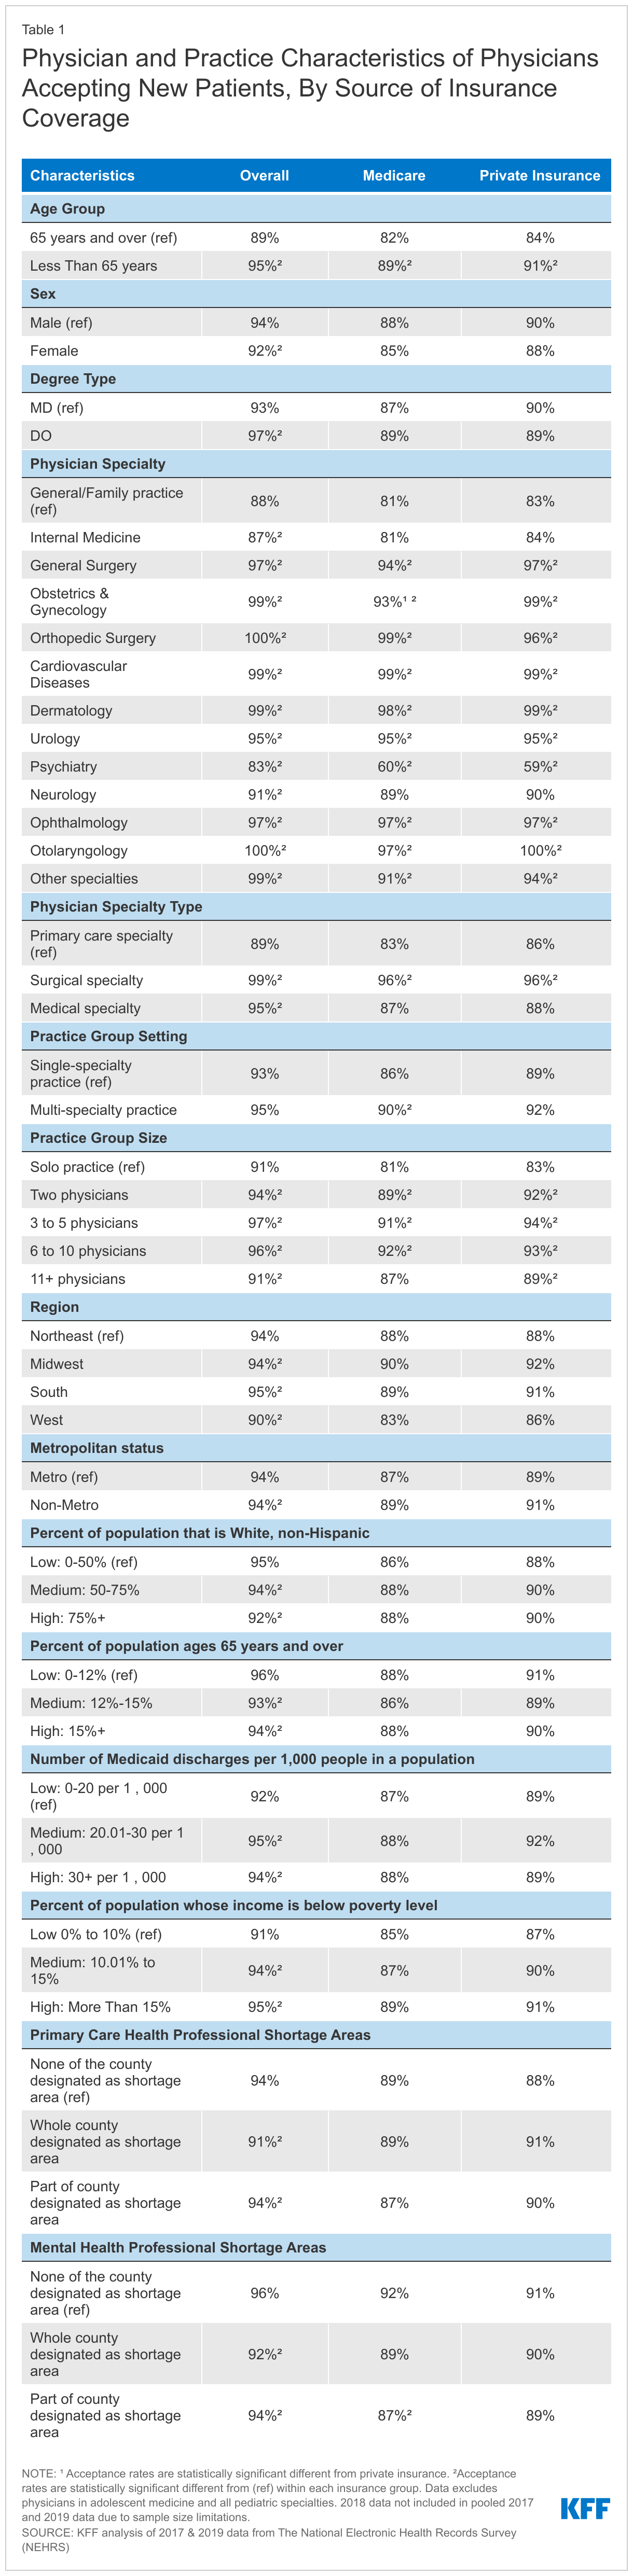
A smaller share of primary care physicians accept new Medicare or privately-insured patients than physicians in other medical or surgical specialties. To look at differences by specialty type, we pooled 2017 and 2019 NHERS survey data. Overall, a smaller share of primary care physicians (89%) reported having an open practice—meaning they accept any new patients—compared to other medical specialists (95%) and surgical specialists (99%). This pattern was consistent across Medicare and private insurance. A smaller share of primary care physicians accepted new Medicare (83%) or privately insured patients (86%), while the vast majority of surgical specialists accepted new patients with either type of insurance (96% for both). Among other medical specialists, 87% were accepting new Medicare patients and 88% were accepting new privately-insured patients (Table 1).
In most specialties, similar shares of physicians accept new Medicare and privately-insured patients. Except for obstetrics and gynecology, there were no statistically significant differences in the share of physicians accepting new patients with Medicare and private insurance. A larger share of obstetricians and gynecologists accepted new privately-insured patients (99%) than new Medicare patients (93%) (Figure 2, Table 1). Notably, almost 1 in 5 of general/family practice and internal medicine physicians were not taking new Medicare patients, similar to the share not taking new privately-insured patients.
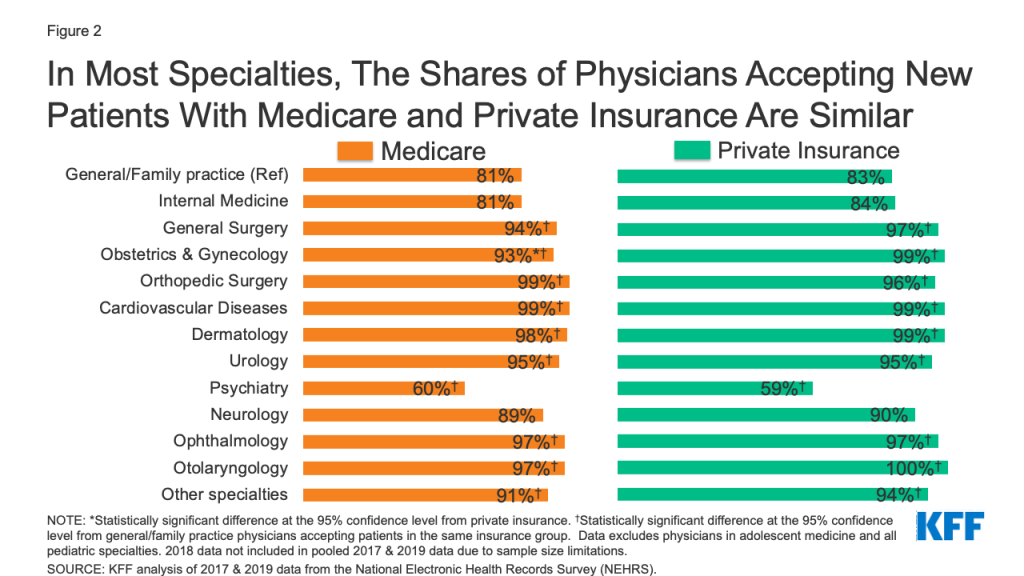
Among all non-pediatric, office-based physicians, psychiatrists were least likely to accept new patients regardless of insurance type. Among psychiatrists, similar shares were accepting new Medicare (60%) and privately-insured (59%) patients (Figure 2, Table 1). For both Medicare and private insurance, the share of psychiatrists accepting new patients was at least 20 percentage points lower than the share of physicians in general/family practice accepting new patients.
Variation in acceptance of new patients across states, in counties that have provider shortages, and by metropolitan status
To understand whether access to physician services varies geographically, we examined the share of office-based physicians accepting new patients by state, metropolitan status, as well as for counties that are designated as primary care or mental health professional shortage areas (HPSAs). Examining whether the share of physicians accepting new Medicare or privately-insured patients varies in HPSA designated counties highlights how differences in payment rates interacts with the supply of providers to affect access to physician services.
state-level shares of physicians accepting new patients
In every state, a large majority of non-pediatric office-based physicians accept new Medicare patients, with some variation among states. In 23 states, at least 90% of physicians accepted new Medicare patients (Figure 3). The five states with the highest share of physicians accepting new Medicare patients were Iowa (95%), Minnesota (95%), Pennsylvania (95%), South Carolina (95%), and North Dakota (94%). The states with the smallest share of physicians accepting new Medicare patients were the District of Columbia (76%), Utah (79%), Oregon (79%), Hawaii (79%), and Maryland (80%). This pattern was generally similar for privately-insured patients, where the share of physicians accepting new patients ranged from 96% (Arkansas) to 72% (the District of Columbia).
county and rural status variation
The Health Resources and Services Administration (HRSA) designates counties as primary care and/or mental health professional shortage areas (HPSAs) if the availability of providers or services is lower than necessary to support the population’s needs. When a county is designated as a HPSA, there are additional incentives for health care professionals to provide services, including a 10 percent bonus payment for providing care to Medicare beneficiaries and eligibility for special federal and state student loan repayment programs for providers that accept Medicare, Medicaid and CHIP patients in these areas. We examine whether the lower supply of providers in HPSA-designated areas is correlated with fewer physicians accepting new patients.
The vast majority of physicians in counties with primary care or mental health shortages accept new Medicare patients, with similar rates for privately-insured patients. In counties where the whole county is designated as a primary care HPSA, 89% of physicians accepted new Medicare patients and 91% of physicians accepted new privately-insured patients. Similarly, in mental health HPSAs, most physicians accepted both new Medicare (89%) and privately-insured (90%) patients. While the share of physicians in these areas accepting new patients is generally high, access can still be problematic since there are not enough physicians available in these areas to provide care.
Most (89%) physicians practicing in rural areas accept new Medicare patients, similar to the share of physicians accepting new privately-insured patients (91%). The share of physicians accepting new patients were similar across Medicare and private insurance in both rural and urban areas (Table 1).
Variation in acceptance of new patients by physician and practice characteristics
The composition of physicians is changing as more women enter medicine, the share of physicians who hold a Doctor of Osteopathic Medicine (DO) rather than a Doctor of Medicine (MD) is increasing, and doctors practice medicine longer, raising the average age of physicians in the United States. Additionally, physicians are increasingly practicing as part of large or multi-specialty groups, rather than in solo or small practice settings. As the composition of the physician workforce and how physicians practice changes, understanding the relationship between physician and practice characteristics and the acceptance of new patients, and whether this varies by payer, is helpful in assessing how access to physician services may evolve over time. We examine physician acceptance rates by physician characteristics (age, sex, degree type) and practice characteristics (group size, group setting), using 2017 and 2019 pooled data from the NEHRS.
The share of physicians accepting new Medicare patients was generally similar across physician demographic groups, but younger physicians were more likely to take new patients. There were no statistically significant differences in the share of physicians accepting new patients between Medicare and private insurance by physician age, sex or degree type (Table 1). Across both Medicare and private insurance, physicians who were younger than age 65 were more likely than physicians ages 65 and older to take new patients, with 89% and 91% of physicians under age 65 accepting new Medicare and privately-insured patients, respectively, compared to 82% and 84% of physicians age 65 and over. A similar trend was evident for physicians younger than age 50 compared to physicians ages 50 and older. There were no statistically significant differences within insurance groups by physician sex or degree type.
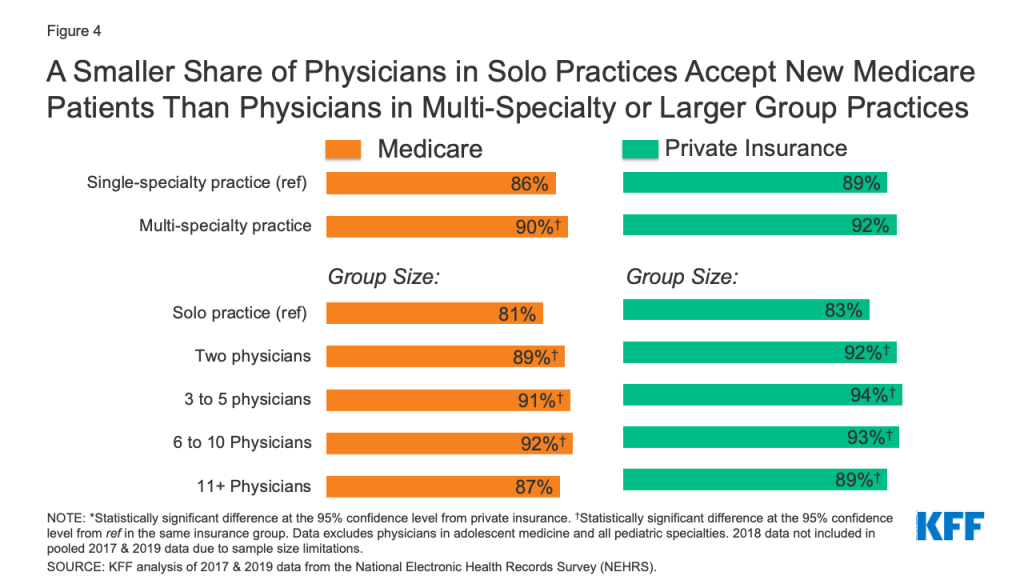
Solo practicing physicians were least likely to report that they were accepting new patients with both Medicare and private insurance. The share of physicians accepting new Medicare and privately-insured patients was similar when comparing by the size and practice type. By group size, a smaller share of physicians in solo practices accepted new Medicare (81%) or privately-insured (83%) patients than in practices with 2 physicians (89% for Medicare, 92% for privately-insured), 3-5 physicians (91% for Medicare, 94% for privately insured), and 6-10 physicians (92% for Medicare, 93% for privately-insured). Additionally, a smaller share of physicians in solo practices accepted new privately-insured patients (83%) than physicians in practices with or 11 or more physicians (87% for Medicare, 89% for privately-insured); however, differences between physicians in solo practices and physicians in practices with 11 or more physicians were not statistically significant for new Medicare patients.
A larger share of physicians in multispecialty group practices accepted new Medicare (90%) patients compared to physicians in single-specialty practices (86%) (Table 1, Figure 4). Differences between Medicare and privately-insured patients and between single- and multi-specialty practices for private insurance were not statistically significant.
Physician Opt-Out Rates in the Medicare Program
Physicians and other health providers may participate in Medicare by either 1) agreeing to accept Medicare’s fee schedule amounts as payment-in-full (i.e., participating providers) or 2) accepting Medicare patients but choosing whether to accept Medicare’s approved amount on a claim-by-claim basis (i.e., non-participating providers). Physicians can also choose to “opt-out” of the Medicare program entirely by submitting an opt-out affidavit to Medicare. Physicians who have opted-out of Medicare enter into private contracts with their Medicare patients, allowing them to bill their Medicare patients any amount they deem appropriate and Medicare patients are responsible for the entire cost of these services. Prior KFF analyses found that a historically small share of physicians have chosen to opt-out of Medicare entirely. Our analysis examines the extent to which non-pediatric physicians are opting-out of Medicare, by specialty, and by state. We use opt-out affidavit data from the Centers for Medicare & Medicaid services as of March 2022. To calculate the total number of active state-licensed physicians, we draw January 2022 data from Redi-Data, Inc.
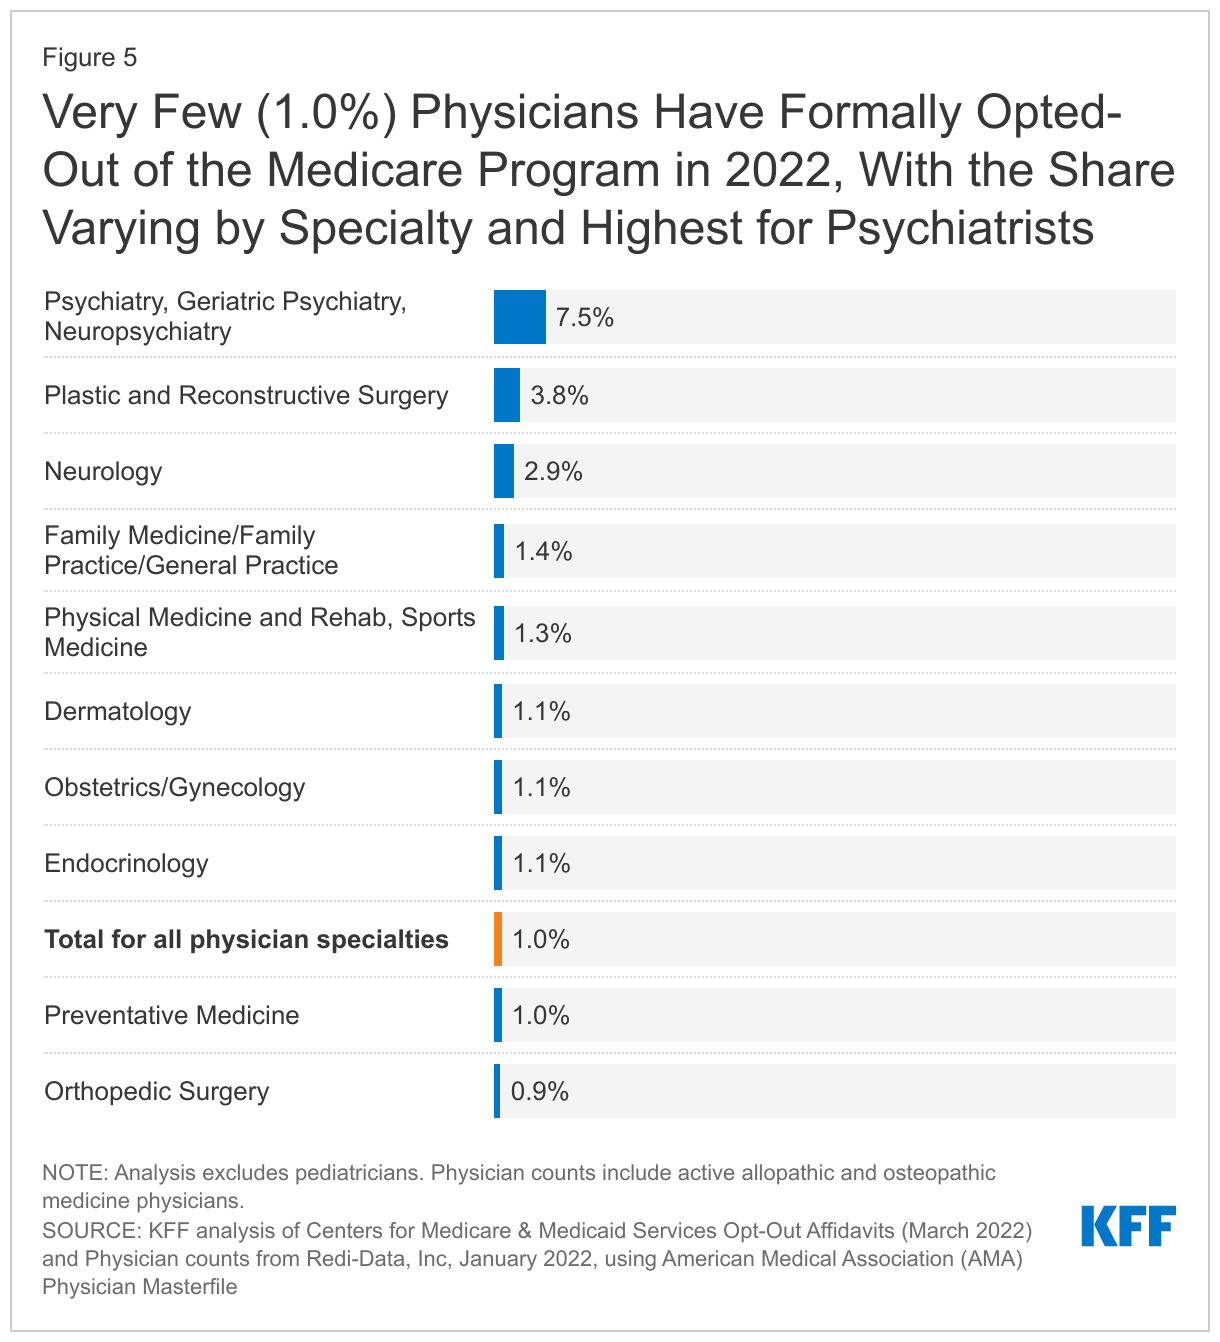
Only 1% of all non-pediatric physicians have formally opted-out of the Medicare program in 2022, with opt-rates varying by specialty, and highest for psychiatrists (7.5%). As of March 2022, 10,105 non-pediatric physicians have opted-out of Medicare, accounting for a very small share (1.0%) of the total number of active physicians, consistent with the shares reported in 2013 and 2020. Opt-out rates vary by specialty and are highest for psychiatrists (7.5%), physicians in plastic and reconstructive surgery (3.8%), and neurology (2.9%) (Figure 5). Among the 10,105 physicians opting out of Medicare, psychiatrists account for 42% of these physicians.
In all but two states (Alaska, Colorado), less than 2 percent of non-pediatric physicians have opted-out of Medicare. As of March 2022, Alaska (3.3%), Colorado (2.2%), District of Columbia (1.9%), Wyoming (1.9%), and Idaho (1.9%) have the highest rates of non-pediatric physicians who have opted out of Medicare. States with the lowest physician opt-out rates include North Dakota (0.1%), West Virginia (0.1%), South Dakota (0.2%), Nebraska (0.3%), and Minnesota (0.4%).
Discussion
Our analysis finds that the vast majority of non-pediatric office-based physicians accept new patients. We also find that the share accepting new Medicare patients largely mirrors the share accepting new privately-insured patients, despite higher payments from private insurers relative to Medicare. This suggests that Medicare’s relatively lower payment rates for physician services do not generally lead to fewer physicians accepting new Medicare patients. We note, however, that due to data limitations we were unable to differentiate the extent to which physicians accepting new patients are accepting all, most, or just some new patients, or the timeliness of getting appointments and needed care. We also cannot assess how many physicians participate in any or all private insurance or Medicare Advantage networks, or the impact of concierge medicine on patients’ access to physician services.
The high share of non-pediatric, office-based physicians accepting new patients – both Medicare and privately insured – was consistent across most specialties, geographic areas, and physician and practice characteristics. Increasingly, hospitals are acquiring medical practices and providing more services in a hospital setting. Due to data limitations, we are unable to assess how these trends may affect access to physician services, either overall or for patients with different types of insurance.
Notably, psychiatrists are significantly less likely than other physicians to accept new patients with either Medicare or private insurance. This finding does not suggest that Medicare rates specifically contribute to access problems for beneficiaries, but it does raise a concern about access to psychiatrists and potentially other mental health practitioners, an issue that was likely exacerbated by the COVID-19 pandemic with the increase in the share of adults reporting symptoms of anxiety disorder and/or depressive disorder.
Despite concerns that lower physician fees paid by Medicare relative to fees paid by private insurance may disincentivize physicians from taking Medicare patients, our analysis suggests that Medicare beneficiaries continue to have good access to physicians, similar to people with private insurance.
This work was supported in part by Arnold Ventures. We value our funders. KFF maintains full editorial control over all of its policy analysis, polling, and journalism activities.
Methods
This analysis draws on data from the National Electronic Health Records Survey (NEHRS) for survey years 2011 through 2019 to examine the share of physicians accepting new patients across Medicare and private insurance. NEHRS is a nationally representative sample survey limited to office-based physicians who principally engage in patient care activities, are non-federally employed, are not in specialties of anesthesiology, pathology, and radiology, and are younger than 85 years of age at the time of the survey. Our analysis excludes physicians in adolescent medicine and all pediatric specialties. Physicians who did not know whether they accepted a form of payment were also excluded from the analysis. These physicians accounted for less than 5% of observations.
To examine physician acceptance rates by physician and practice characteristics, we pooled 2017 and 2019 NEHRS data due to sample size limitations that precluded analyses of single-year data stratified by different characteristics.
To examine physician acceptance rates by state, we drew on data from 2015 & 2017 NEHRS because 2018 & 2019 NEHRS does not include state-level data and the 2016 survey was not administered.
Trend analyses of physician acceptance rates do not include 2013 data because we were unable to exclude pediatric specialties for this year. Additionally, trend analyses do not include 2016 data because NEHRS was not administered that year.
Our analysis of NEHRS data includes some limitations. NEHRS does not ask respondents their reasons for not accepting new patients by insurance coverage, which limits our ability to fully ascertain factors that contribute to physician acceptance rates. Additionally, the survey does not inquire about the extent to which physicians accepting new patients are accepting all, most, or just some new patients. Another limitation to our analysis is that NEHRS is limited to office-based physicians and therefore, our findings cannot be generalizable to physicians practicing in hospitals or other outpatient departments. Further, the survey does not distinguish Medicare provided under managed care (i.e., Medicare Advantage) versus traditional Medicare. Therefore, whether physicians are more inclined to accept Medicare patients in either Medicare Advantage plans or traditional Medicare is unknown. Differences between states and physician characteristics may also reflect differences in the composition of the workforce.
Even with pooled data, there are limited sample sizes in some groups and some states. While all states have at least 50 observations, readers are cautioned that there is uncertainty around these estimates when making comparisons between states or groups.
This analysis also draws on Medicare opt-out affidavit data from the Centers for Medicare & Medicaid Services (CMS) to examine the extent to which non-pediatric physicians are opting out of Medicare. Medicare opt-out affidavit data is as of March 2022. We excluded pediatricians as well as other non-physician specialists. We obtained January 2022 data on the number of active allopathic and osteopathic physicians by specialty and state from Redi-data, Inc, which utilizes data from the American Medical Association (AMA) Physician Masterfile. One limitation of this analysis is that due to data source limitations, we were unable to exclude active physicians in professional activity other than patient care, such as research and administration. For more details on our methods on the Medicare opt-out analysis, please see the Methods section of the brief, “How Many Physicians Have Opted-Out of the Medicare Program?”.
Appendix