What are the Implications of the 2025 Budget Reconciliation Bill for Hospitals?
 On May 22, 2025, the U.S. House of Representatives passed a budget reconciliation bill—called the One Big Beautiful Bill Act (OBBBA)—that includes significant reductions in federal Medicaid spending to help offset the cost of tax cuts, along with changes to the Affordable Care Act (ACA), immigration reforms and other provisions. Together, the combination of policies that increase the number of uninsured, policies that limit the ability of states to raise revenues to increase provider payments, and other changes are expected to have financial consequences for hospitals, affecting some hospitals more (or less) than others. Financial pressure on hospitals could affect patient care to the extent that hospitals respond by cutting certain expenses—such as by offering fewer services, laying off staff, or investing less in quality improvements—or close altogether, especially in rural areas. This is in addition to the direct impact of losing coverage on individuals, who would be less likely to obtain needed care as a result.
According to the Congressional Budget Office (CBO), the bill is projected to cut federal Medicaid spending by $793 billion and reduce spending related to the ACA Marketplaces by $268 billion over a decade, totaling $1.04 trillion in cuts after accounting for the indirect effects on federal revenues. CBO projects that the number of uninsured Americans would increase by 10.9 million as a result of the OBBBA—7.8 million due to changes to Medicaid and 3.1 million due to changes to the ACA exchanges—and by 16.0 million when combined with the expected expiration of the ACA enhanced premium tax credits and the implementation of proposed rules for the ACA exchanges. The substantial increase in uninsured Americans would likely lead to more uncompensated care, putting an additional strain on hospital finances. The bill would also restrict states’ future ability to raise the state share of Medicaid revenues through provider taxes, which often support higher payments for hospitals, and would limit the ability of states to create new state directed payments to increase payments to hospitals. The impact of the OBBBA on hospital finances would vary across hospitals. For example, it is likely that the OBBBA would have a disproportionate impact on hospitals caring for a relatively large number of Medicaid patients and other patients with low incomes.
Because the OBBBA is projected to increase the deficit, CBO projects it would trigger about $500 billion in mandatory reductions in Medicare spending between 2026 and 2034, including a 4% reduction in payments to hospitals, unless Congress takes action to circumvent them (which Congress has historically done).
This issue brief discusses the potential implications of the OBBBA for hospitals and explains how some hospitals (such as rural hospitals as well as urban hospitals that serve a large share of Medicaid patients) may be less well positioned than others (such as hospitals that serve a large share of commercial patients) to absorb revenue losses given their current financial status. Analyses of hospital operating margins are based primarily on RAND Hospital Data and reflect 2023 numbers.
About 4 in 10 hospitals had negative operating margins, and 12% had margins below -10%, but 24% had margins at or above 10%, suggesting some will have greater capacity than others to absorb any losses
About four in ten (39%) hospitals had negative operating margins in 2023 (Figure 1). Operating margins are a measure of financial standing that indicate the extent to which hospitals profit or lose money on patient care and other operating activities. Hospitals with negative operating margins could have a particularly hard time absorbing any losses resulting from the reconciliation bill. This could especially be the case for the more than one in ten (12%) hospitals with operating margins below -10%.
However, the remaining three fifths (61%) of hospitals had positive margins, though some of these hospitals had relatively modest margins (e.g., 22% had positive margins of less than 5%). Roughly a quarter of all hospitals (24%) had relatively high margins of at least 10%. These hospitals may be most likely to withstand major spending reductions in the OBBBA.

Rural hospitals were more likely to have negative margins than urban hospitals
A larger share of rural versus urban hospitals had negative margins (44% versus 35%) (Figure 2). The share with negative margins was especially high among hospitals in the most remote rural areas (49%), defined here as rural areas not adjacent to a metropolitan area.
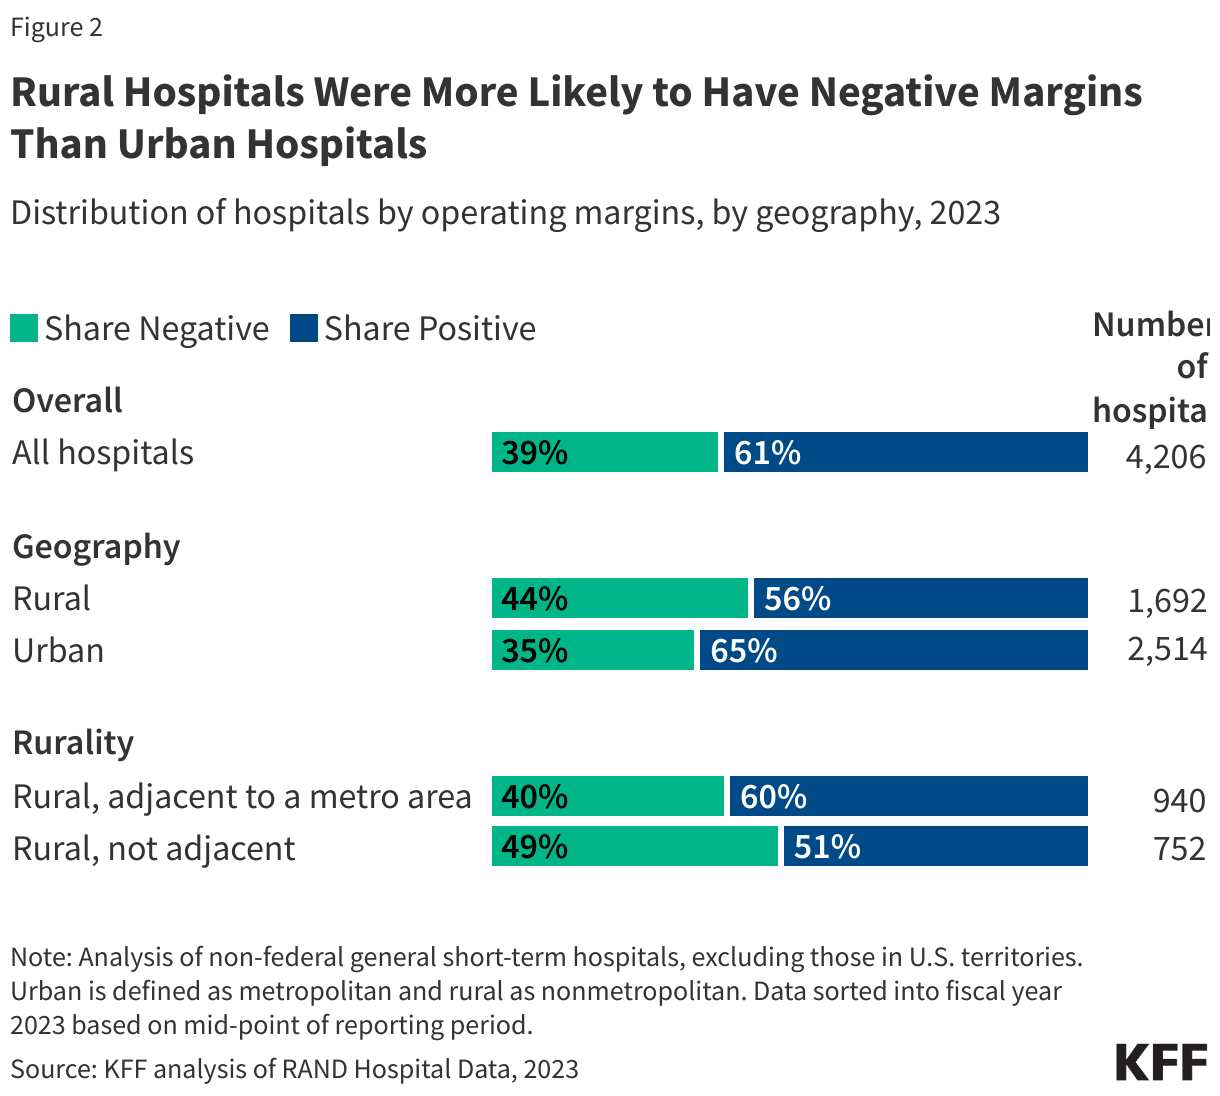
Rural hospitals have a unique set of financial challenges and could have an especially hard time adjusting to any losses resulting from the OBBBA. For example, rural hospitals tend to be smaller facilities with lower volume. Operating at a smaller scale can lead to a higher cost of providing care on average—e.g., to the extent that the fixed costs of operating a hospital, such as maintaining a minimum number of staff, are spread across fewer patients—and may limit the ability of rural hospitals to offer specialized services.
The ability to absorb any losses resulting from the reconciliation bill would likely vary across rural hospitals, as is true of hospitals overall. More than four in ten (44%) rural hospitals had negative margins, and about one in seven (15%) had margins of less than -10%. Negative margins were more common among rural hospitals in states that had not expanded Medicaid (especially those in the most rural areas) and among sole community, Medicare-dependent, and low-volume hospitals, among other differences. A major provision in the reconciliation bill – a work and reporting requirement in Medicaid – would only apply to the Medicaid expansion. However, other provisions, such as cutbacks on the ACA Marketplaces, would likely disproportionately affect states that have not expanded Medicaid.
At the same time, more than half (56%) of all rural hospitals had positive margins. Nearly a quarter (23%) of rural hospitals had relatively modest margins (less than 5%) while about one fifth (19%) had margins of at least 10%. Positive margins were more common among rural hospitals with more beds, with higher occupancy, that were affiliated with a health system, and that were not government-owned.
Hospitals that serve a large share of Medicaid patients in urban and rural areas were more likely than others to have negative margins, and they could be disproportionately affected by the House-passed bill
Hospitals where Medicaid covered a high share of stays—a group that could also have an especially hard time absorbing any losses resulting from the OBBBA—were more likely than others to have negative margins. For example, 45% of hospitals with high shares of Medicaid patients had negative margins versus 35% among hospitals with low shares. The share with negative margins was relatively high among hospitals with high Medicaid shares in both urban and rural areas (44% and 48%, respectively). Relatedly, operating margins were lower than average among hospitals with high Medicaid shares (e.g., they were 2.3% among hospitals with high shares versus 7.0% among those with low shares).
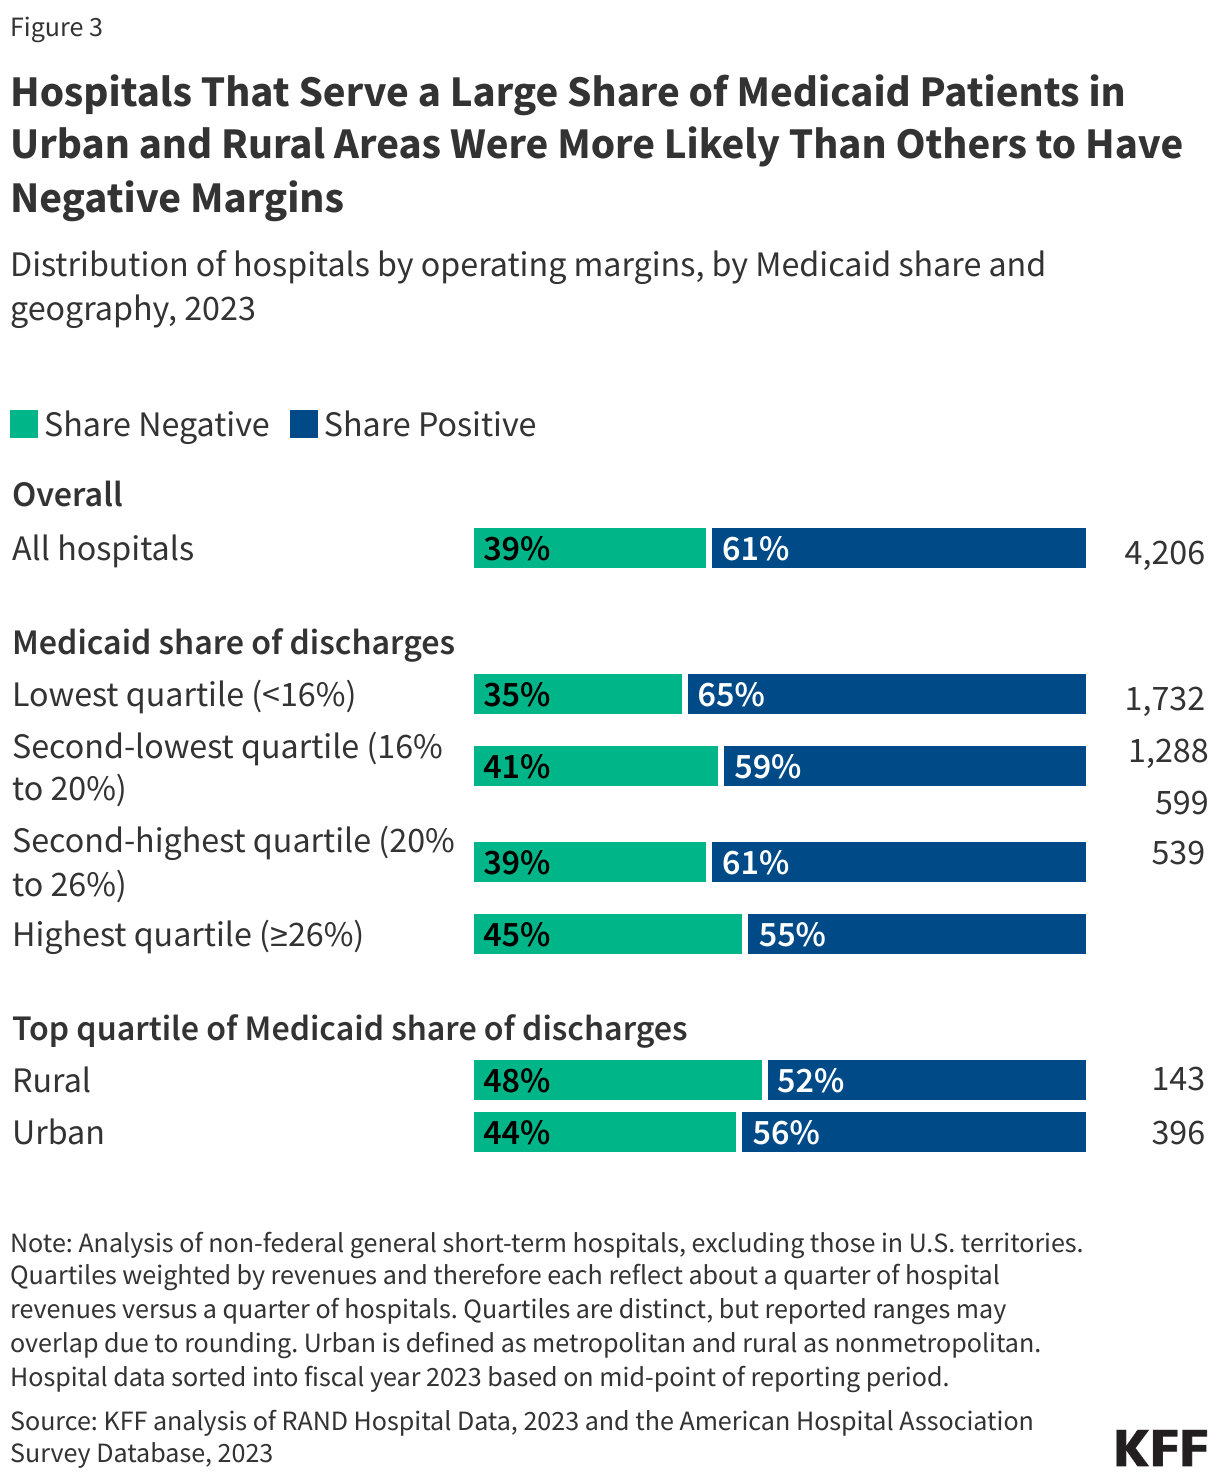
Hospitals caring for a disproportionate share of Medicaid patients and other patients with low incomes have unique financial challenges. For example, Medicaid and other public payers tend to reimburse at lower rates than private insurance, and it may be more expensive to treat patients with low incomes in ways that are not captured in reimbursement rates.
Further, it is likely that hospitals caring for a relatively large share of Medicaid patients and other patients with low incomes would take the biggest hit under the OBBBA, since the bill achieves much of its savings through Medicaid cuts along with changes to the ACA exchanges that would increase the number of uninsured individuals.
Hospitals with for-profit ownership, high commercial shares, and high commercial-to-Medicare price ratios were more likely to have positive margins than other hospitals, among other differences
While about six tenths (61%) of hospitals had negative operating margins, the share was higher among for-profit hospitals (71%), hospitals where commercial payers cover a relatively large share of stays (73%), hospitals with high commercial-to-Medicare price ratios (75%), hospitals that were part of a broader health system (66%), and hospitals with high market shares (73%) (Figure 4). These hospitals may have an easier time than others in absorbing any losses related to the OBBBA.

In most states (29), at least four in ten hospitals had negative margins in 2023
The share of hospitals with negative margins varied across states, but in more than half of all states (29 states), at least four in ten hospitals had negative margins (Figure 5). At least half of hospitals had negative margins in 14 states. This includes a mixture of red states (such as Kansas and Oklahoma) and blue states (such as Massachusetts and New York). At least 60% of hospitals had negative margins in four states: Kansas, Mississippi, Vermont, and Washington.
Differences in hospital finances across states may be attributable to variations in demographics, hospital ownership and type, commercial reimbursement rates, and state and local health and tax policy. For instance, the share of hospitals in the red may have been relatively low in Texas in part because the state has a relatively large number of for-profit hospitals (which are less likely to have negative margins) among other factors. The relatively low share of hospitals with negative margins in Florida may be at least partly due to relatively high commercial prices as a percent of Medicare rates.
Some states with a relatively large share of hospitals with negative margins may be disproportionately affected by the OBBBA and other policy changes. For instance, three fifths (60%) of hospitals in Mississippi had negative margins. If the OBBBA were enacted, the ACA enhanced tax credits expired, and the proposed rules for the ACA Marketplaces were implemented, then the share of people who are uninsured is expected to increase, putting a particular strain on hospitals in states that experience large increases in the number of uninsured. The uninsured rate in Mississippi would increase by 6 percentage points—one of the highest increases in the country—based on KFF estimates. As another example, in Washington, where more than three fifths (63%) of hospitals had negative margins, the reduction in federal Medicaid as a share of baseline spending resulting from the OBBBA would be the largest of all states (17% over ten years) according to KFF estimates.

The bill could trigger about $500 billion in mandatory Medicare cuts, including cuts in payments to hospitals and other providers, unless Congress intervenes
Because the bill is expected to increase the federal deficit, CBO projects it would trigger about $500 billion in mandatory cuts to Medicare spending between 2026 and 2034—including a 4% cut in payments to hospitals and other providers—unless Congress intervened. The automatic reductions in Medicare payments to hospitals and other health care providers and plans, known as “sequestration,” would be required under the Statutory Pay-As-You-Go (PAYGO) Act. If these cuts did go into effect, they would come at a time when the Medicare Payment Advisory Commission has recommended that Congress increase Medicare payment rates in 2026 relative to current law and could raise concerns about the adequacy of Medicare reimbursement. Historically, Congress has voted to waive automatic Medicare payment reductions due to sequestration under statutory PAYGO rules.
This work was supported in part by Arnold Ventures. KFF maintains full editorial control over all of its policy analysis, polling, and journalism activities.
Methods |
| Data: The analysis relied primarily on RAND Hospital Data, a cleaned and processed version of annual cost reports that Medicare-certified hospitals are required to submit to the federal government. The analysis relied on the American Hospital Association (AHA) Annual Survey Database to obtain data on payer mix, system membership, and hospital referral region (HRR) market shares. Data on commercial-to-Medicare price ratios were obtained from Round 5.1 of the RAND Price Transparency Study.
Sample construction: This analysis focused on non-federal general short-term hospitals, excluding those in U.S territories. It also included other sample restrictions, such as ignoring certain outlier values (see the Methods section of a prior KFF analysis of operating margins for additional details). The final analysis included 4,206 hospitals, though some analyses of hospital characteristics included fewer hospitals depending on the data available (see counts in figures). For example, data on commercial-to-Medicare price ratios were only available for 2,779 hospitals. Defining operating margins: Operating margins were approximated as (revenues minus expenses) divided by revenues after removing reported investment income and charitable contributions from revenues. The Methods section of a prior KFF analysis of operating margins includes additional details, such as the limitations of available financial data, as well as more information about the definition of hospital market shares and commercial-to-Medicare price ratios. Definition of urban and rural: Urban hospitals are defined as those operating in a metropolitan area, while rural hospitals are defined as those operating in nonmetropolitan areas. A metropolitan area is a county or group of counties that contains at least one urban area with a population of 50,000 or more people. Nonmetropolitan areas include micropolitan areas—which are counties or groups of counties that contain at least one urban area with a population of at least 10,000 but less than 50,000—and noncore areas (areas that are neither metropolitan nor micropolitan). The analysis further breaks down rural areas into those that are adjacent to metropolitan areas (defined as the “most rural” areas in this brief) and those that are not adjacent to metropolitan counties. The Methods section of a prior KFF analysis provides additional information about these definitions, limitations, and other approaches. |