A Primer on Medicare: Key Facts About the Medicare Program and the People it Covers
How is Medicare financed and what are Medicare's future financing challenges?
Funding for Medicare comes primarily from general revenues, payroll tax revenues, and premiums paid by beneficiaries. Other sources include taxes on Social Security benefits, payments from states, and interest.
Medicare is funded as follows (Figure 29):
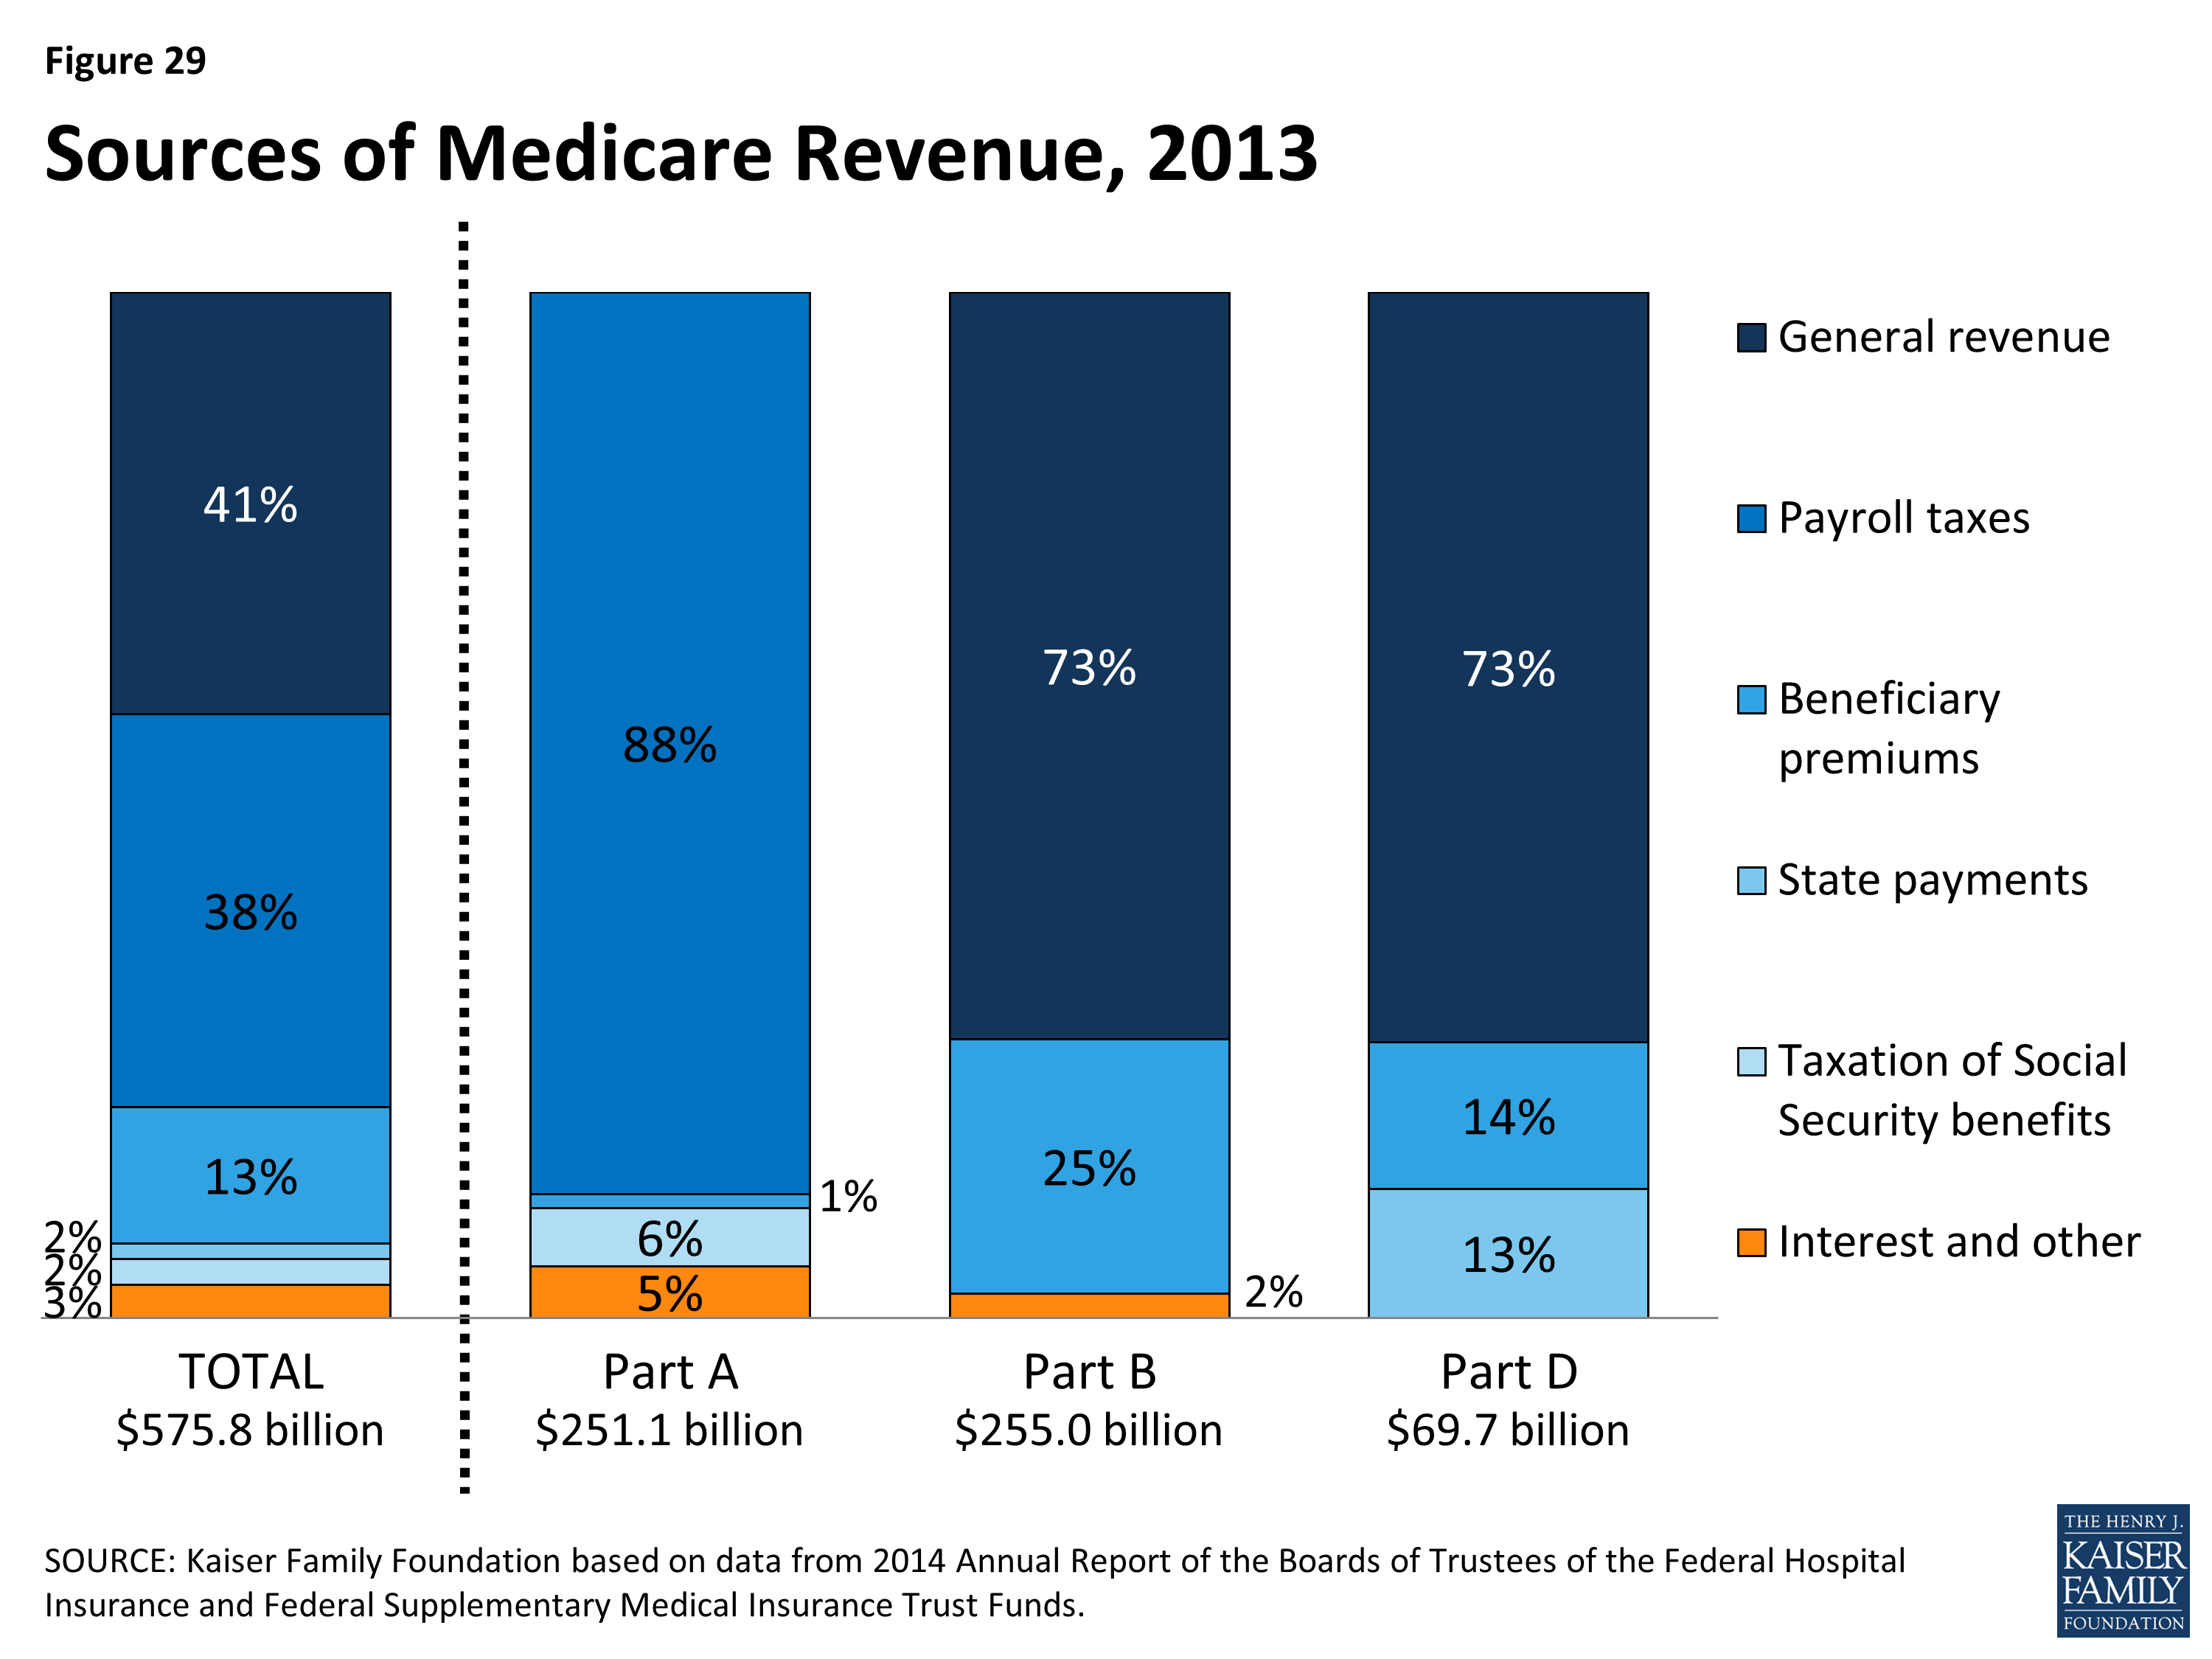
Figure 29: Sources of Medicare Revenue, 2013
- Part A, the Hospital Insurance (HI) trust fund, is financed primarily through a dedicated payroll tax of 2.9 percent of earnings paid by employers and their employees (1.45 percent each). In 2013 (the most recent year for which actual data are available), these taxes accounted for 88 percent of the $251 billion in revenue to the Part A Trust Fund. In 2013, the Medicare HI payroll tax increased by 0.9 percentage points (from 1.45 percent to 2.35 percent) for higher-income taxpayers (more than $200,000/single person and $250,000/married couple), with additional revenues deposited into the HI trust fund.
- Part B, the Supplementary Medical Insurance (SMI) trust fund, is financed through a combination of general revenues, premiums paid by beneficiaries, and interest and other sources. Premiums are automatically set to cover 25 percent of spending in the aggregate, while general revenues subsidize 73 percent. Higher-income beneficiaries pay a larger share of spending, ranging from 35 percent to 80 percent of Part B costs. Part B revenues totaled $255 billion in 2013.
- Part D is financed through general revenues, beneficiary premiums, and state payments for dual-eligible beneficiaries (who received drug coverage under Medicaid prior to 2006). The monthly premium paid by enrollees is set to cover 25.5 percent of the cost of standard drug coverage, and Medicare subsidizes the remaining 74.5 percent. Similar to Part B, higher-income beneficiaries pay a larger share of the cost of standard drug coverage. In 2013, Part D revenue totaled $70 billion, 73 percent of which was from general revenues, 14 percent from premiums, and 13 percent from state payments.
- The Medicare Advantage program (Part C) is not separately financed. Medicare Advantage plans such as HMOs and PPOs cover all Part A, Part B, and (typically) Part D benefits. Beneficiaries enrolled in Medicare Advantage plans typically pay monthly premiums for additional benefits covered by their plan in addition to the Part B premium.
The solvency of the Medicare Hospital Insurance trust fund, out of which Part A benefits are paid, is a common way of measuring Medicare’s financial status. In 2014, the Medicare Trustees projected that the Part A trust fund will be depleted in 2030.
Medicare solvency is measured by the level of assets in the Part A trust fund. In years when annual income to the trust fund exceeds benefits spending, the asset level increases, and when annual spending exceeds income, the asset level decreases. When spending exceeds income and the assets are fully depleted, Medicare will not have sufficient funds to pay all Part A benefits.
Each year, the Medicare Trustees provide an estimate of the year when the asset level is projected to be fully depleted. Because of slower growth in Medicare spending in recent years, the solvency of the trust fund has been extended. In 2014, the Trustees projected that the Part A trust fund will be depleted in 2030, four years later than was projected in the 2013 report and six years later than was projected in the 2012 report (Figure 30).
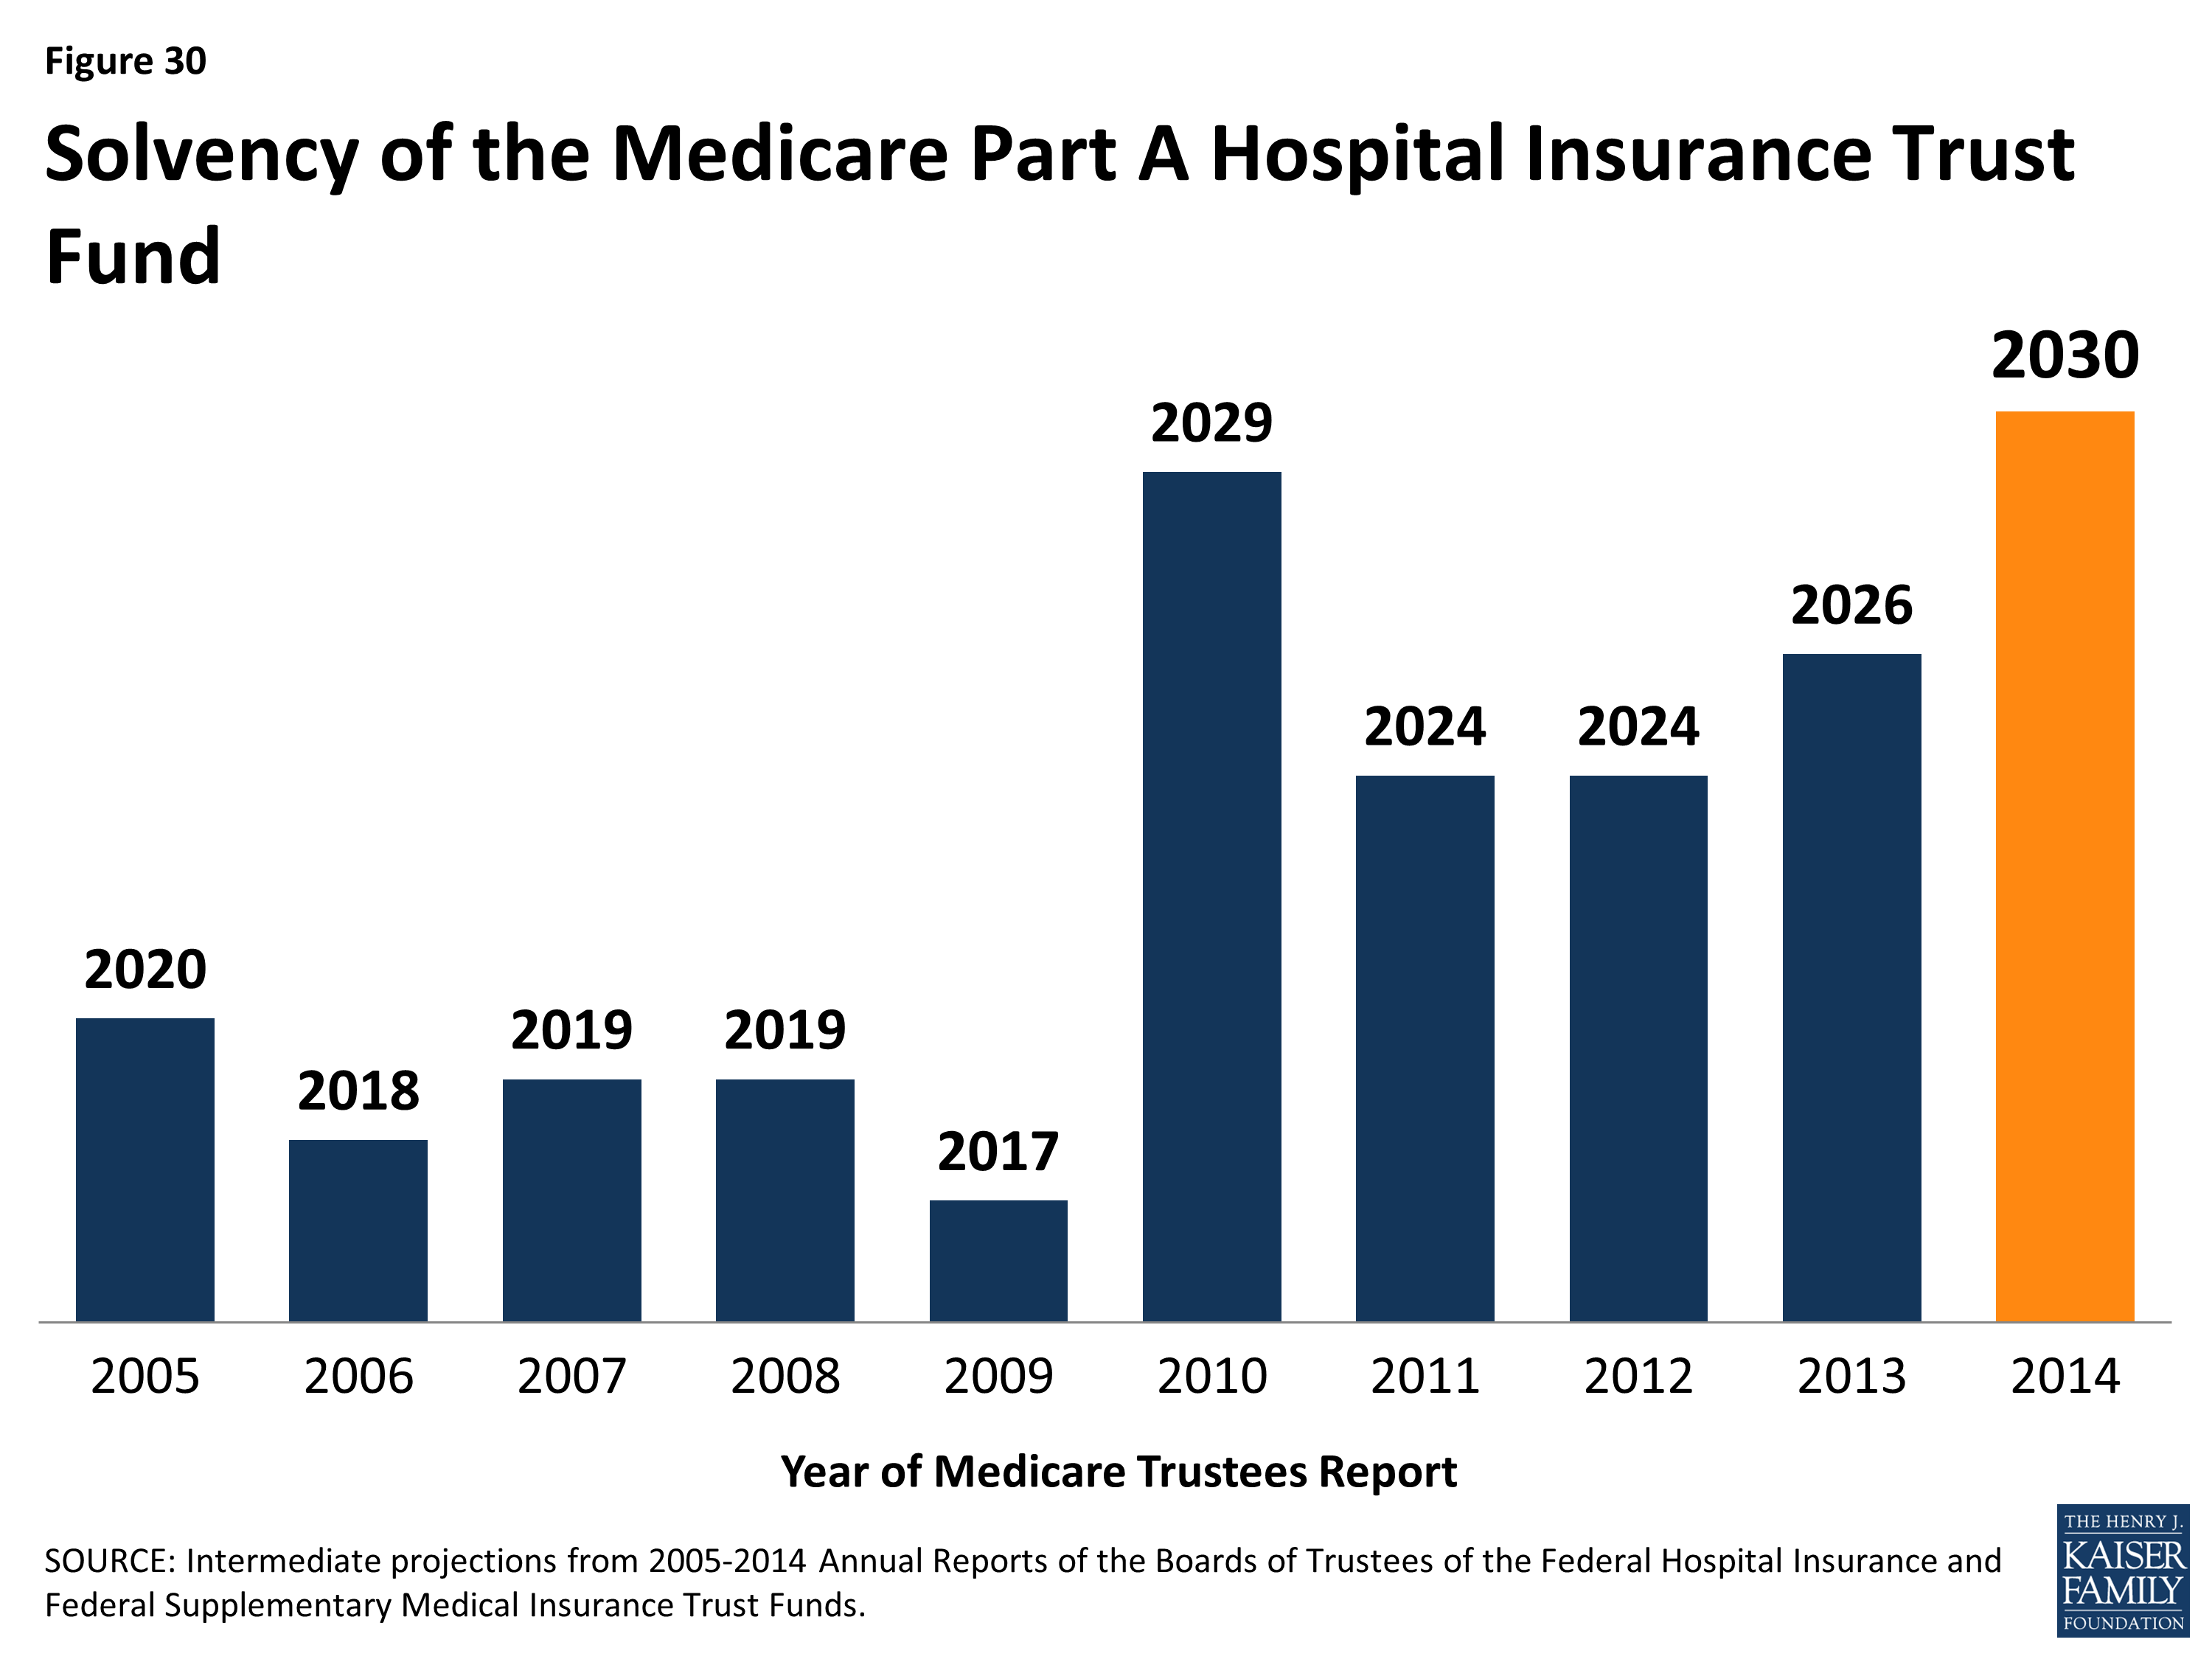
Figure 30: Solvency of the Medicare Part A Hospital Insurance Trust Fund
Part A Trust Fund solvency is affected by growth in the economy, which affects revenue from payroll tax contributions, health care spending trends, and demographic trends: an increasing number of beneficiaries, especially between 2010 and 2030 when the baby boom generation reaches Medicare eligibility age, and a declining ratio of workers per beneficiary making payroll tax contributions.
Part B and Part D do not have financing challenges similar to Part A, because both are funded by beneficiary premiums and general revenues that are set annually to match expected outlays. However, future increases in spending under Part B and Part D will require increases in general revenue funding and higher premiums paid by beneficiaries.
In addition to the solvency of the Part A trust fund, Medicare’s financial condition can be measured in other ways.
For example, the Independent Payment Advisory Board (IPAB), a 15-member board which was authorized by the ACA, is required to recommend Medicare spending reductions to Congress if projected spending growth exceeds specified target levels. IPAB is required to propose spending reductions if the 5-year average growth rate in Medicare per capita spending is projected to exceed the per capita target growth rate, based on inflation (2015-2019) or growth in the economy (2020 and beyond). The ACA required the IPAB process to begin in 2013, but CBO has estimated that spending reductions will not be triggered for several years because Medicare spending growth is expected to be below the target growth rate during the next decade. As yet, no members of the board have been nominated or appointed.
Looking to the future, Medicare is expected to face financing challenges due to the aging of the U.S. population, increasing health care costs, and the declining ratio of workers to beneficiaries.
While Medicare spending is on a slower upward trajectory now than in the past, Medicare is likely to be a focus of future policy discussions about reducing the federal budget debt, given the health care financing challenges posed by the aging of the population. From 2014 to 2050, the number of people on Medicare is projected to rise from 54 million to 93 million, while the ratio of workers per beneficiary is expected to decline from 3.2 to 2.3 (Figure 31).1
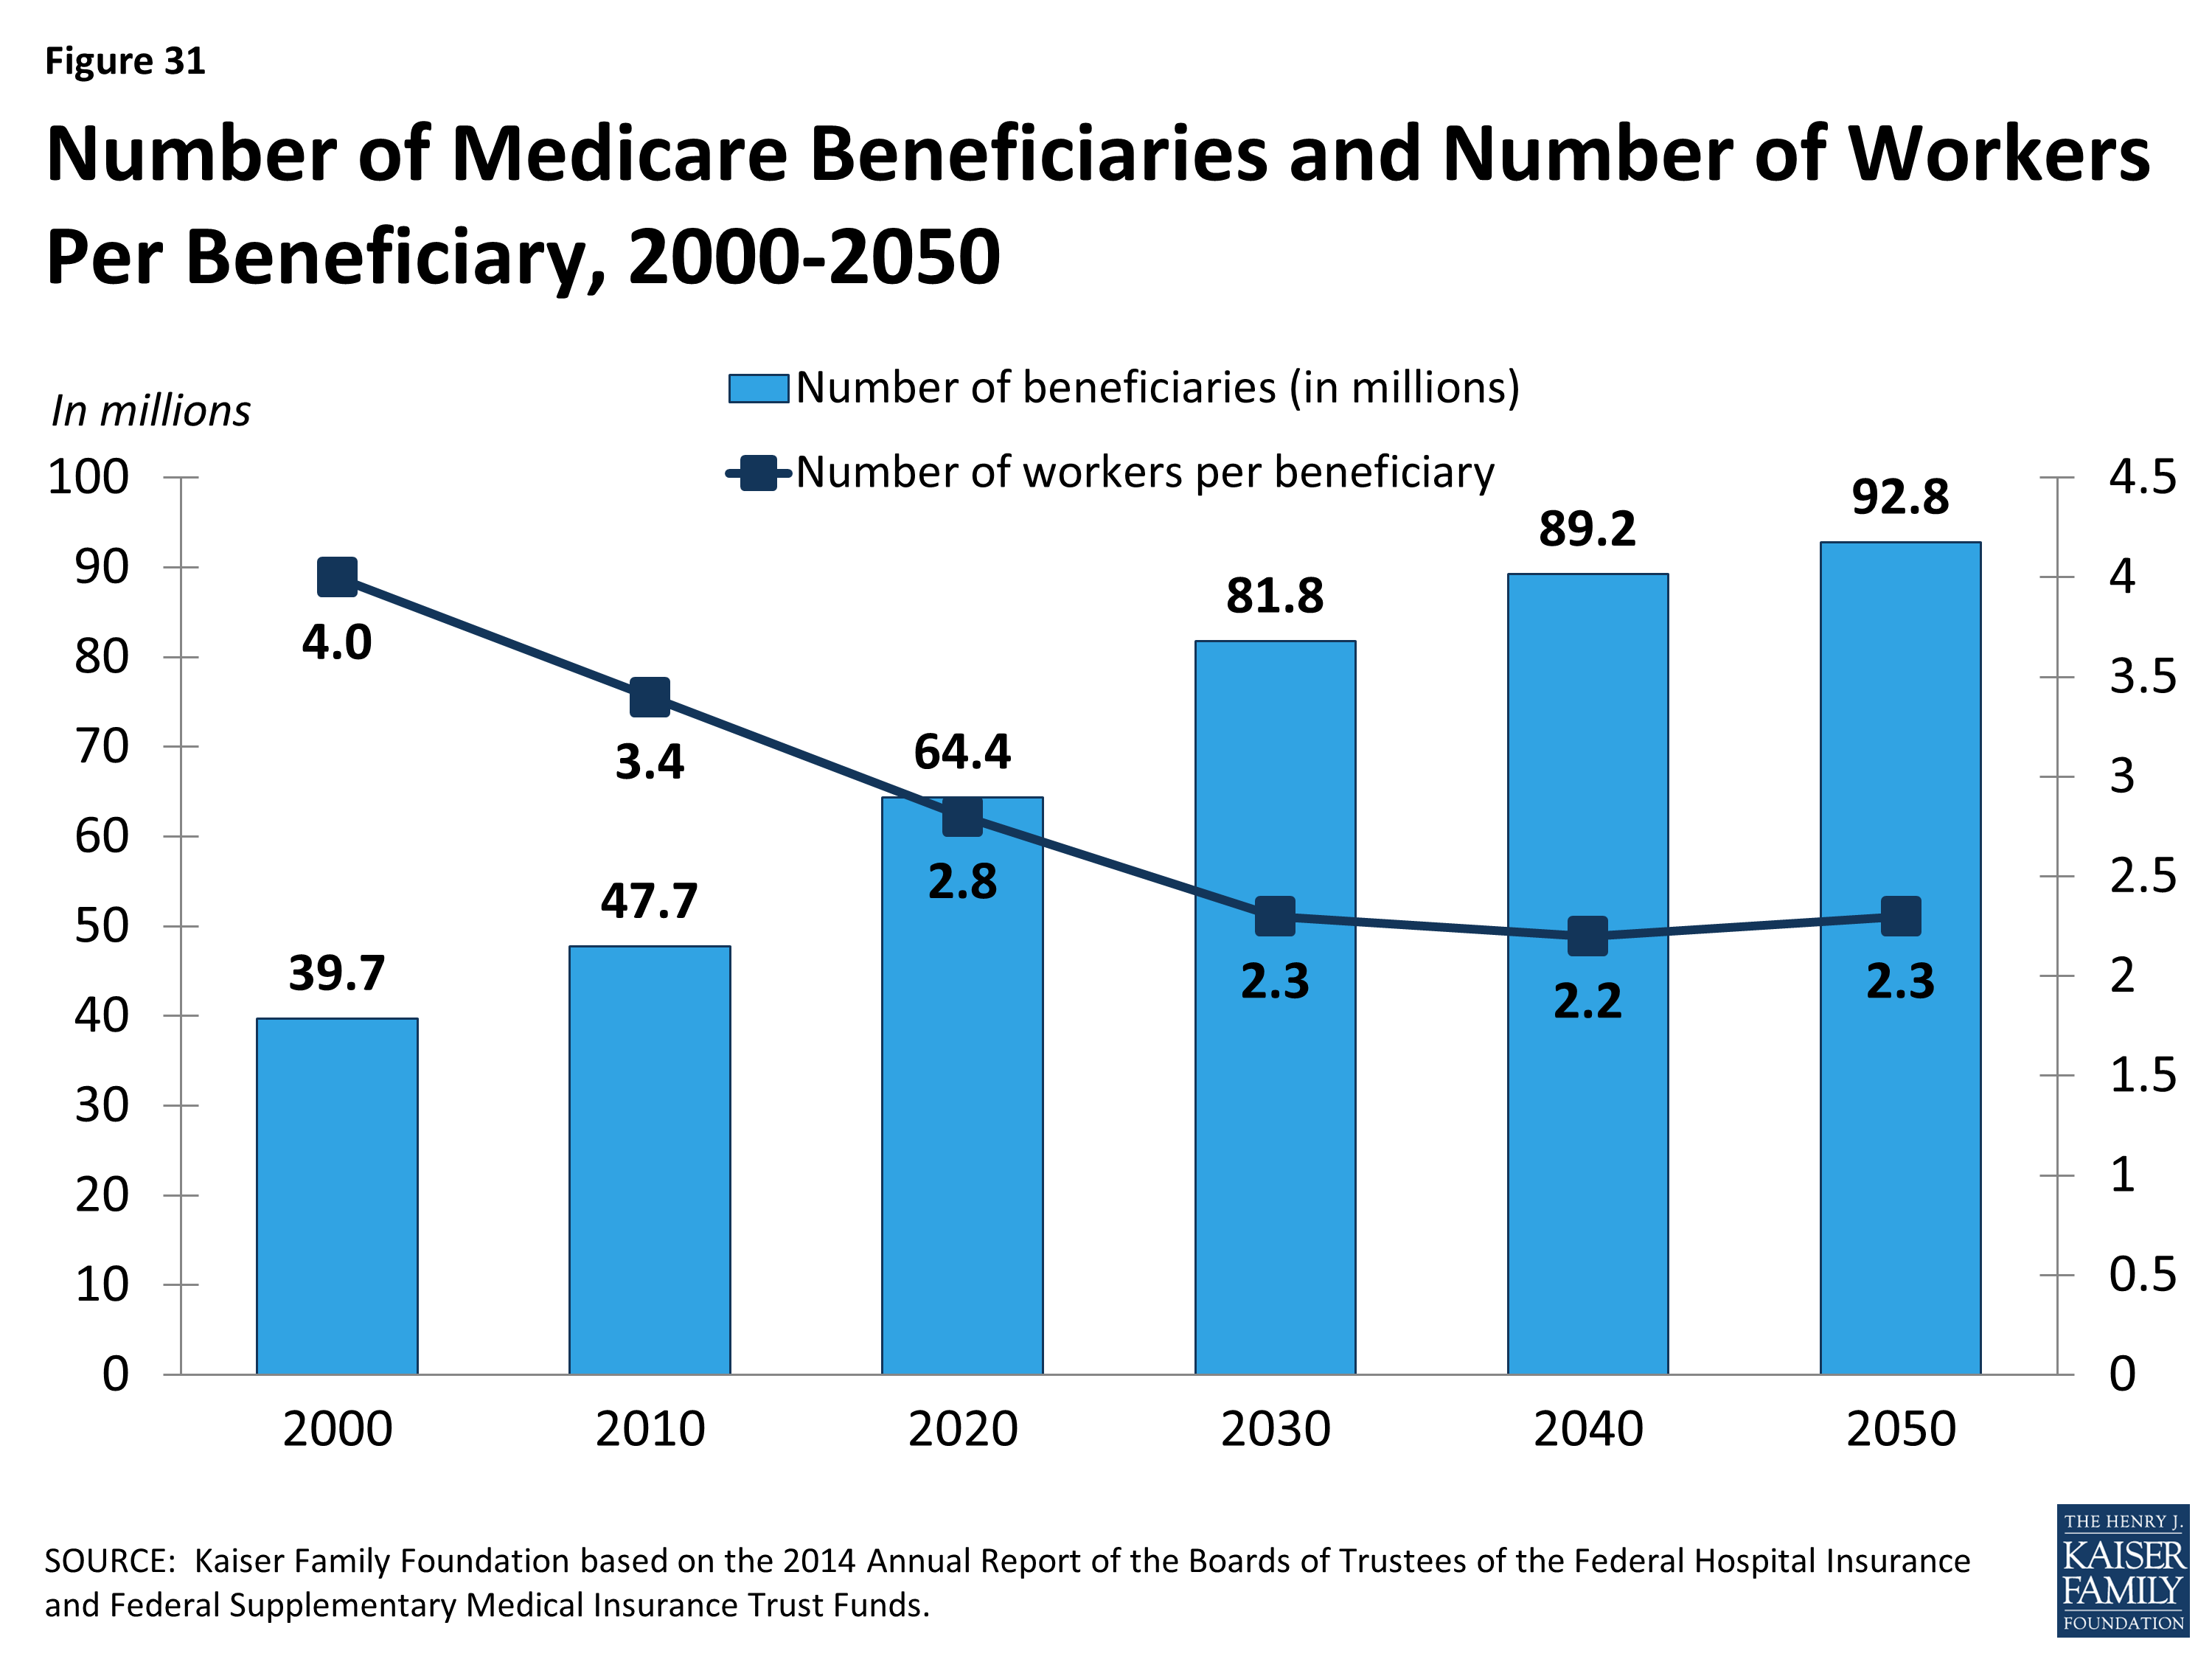
Figure 31: Number of Medicare Beneficiaries and Number of Workers Per Beneficiary, 2000-2050