Medicare Advantage 2018 Data Spotlight: First Look
Summary
More than 19 million Medicare beneficiaries (33%) are enrolled in Medicare Advantage plans in 2017, which are offered as an alternative to the traditional Medicare program. This first look at the Medicare Advantage plans available for 2018 analyzes publicly available data to review the Medicare Advantage plans offered during the Medicare Open Enrollment period. It describes the Medicare Advantage plan choices and availability, and how these have changed over time. Findings include:
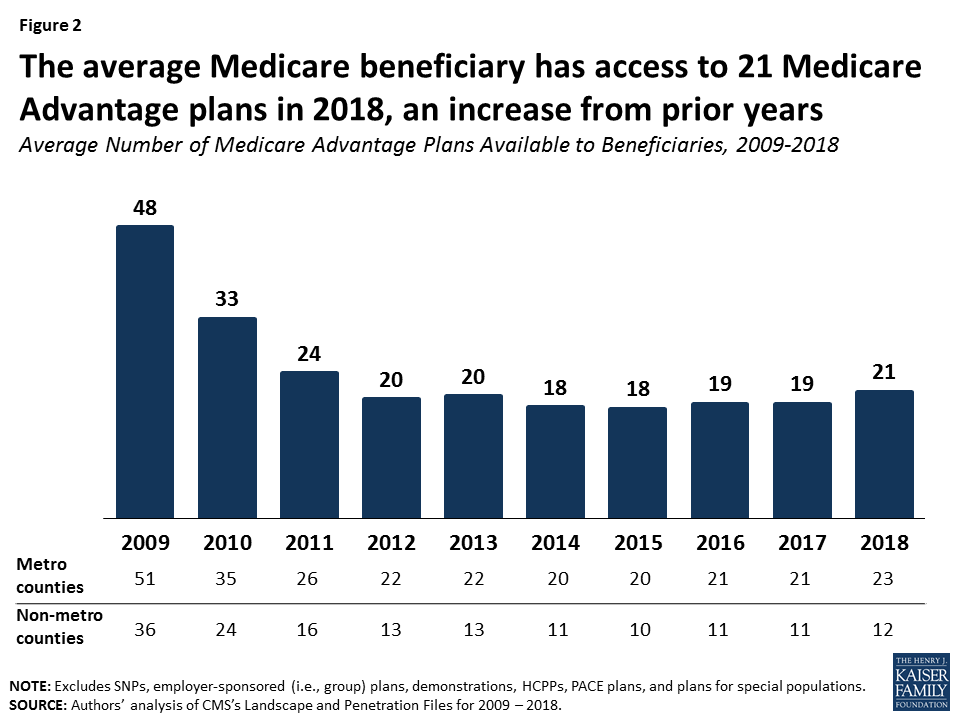
- Number of Plans. In total, 2,317 Medicare Advantage plans will be available nationwide for individual enrollment in 2018 – the largest number of plans available since 2009. The average Medicare beneficiary will be able to choose among 21 Medicare Advantage plans in 2018, an increase from 19 in 2017.
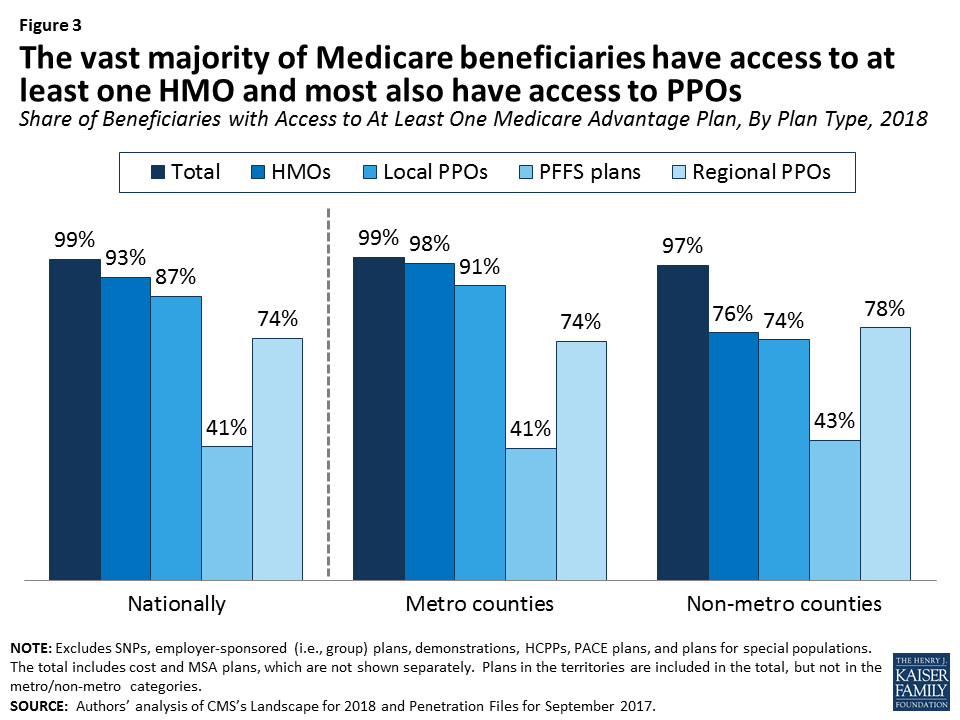
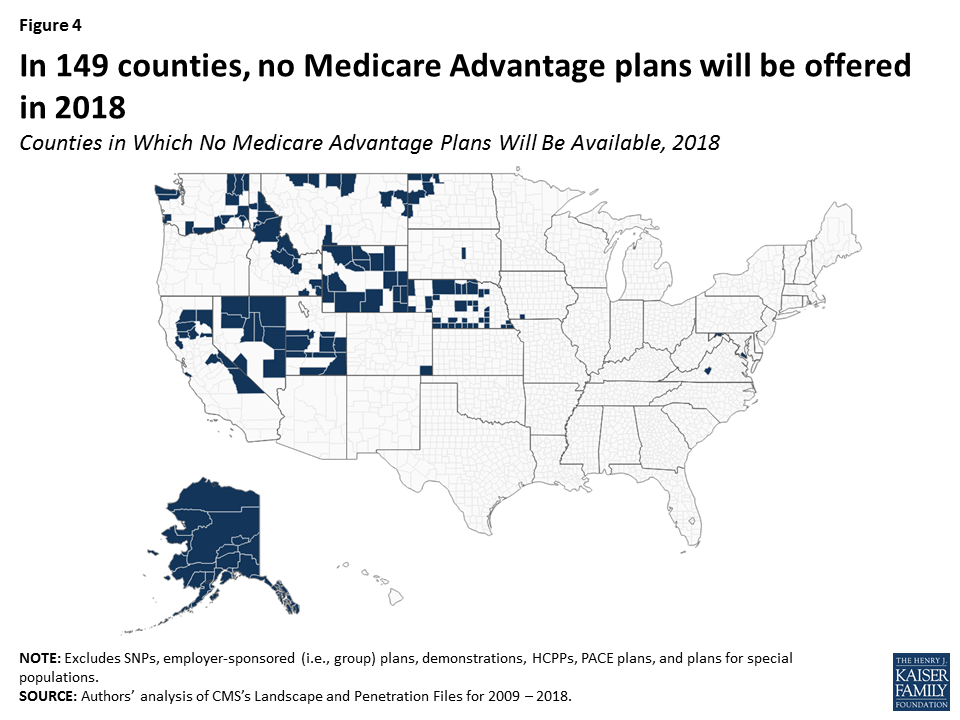
- Access to Plans. The vast majority (93%) of Medicare beneficiaries will have access to at least one Medicare Advantage HMO, and most (87%) will have access to at least one Medicare Advantage local PPO. In 2018, no Medicare Advantage plans will be available in 149 of the 3,138 counties, similar to the 2017 Medicare Advantage markets; only 1 percent of Medicare beneficiaries live in these counties where no Medicare Advantage plan is offered.
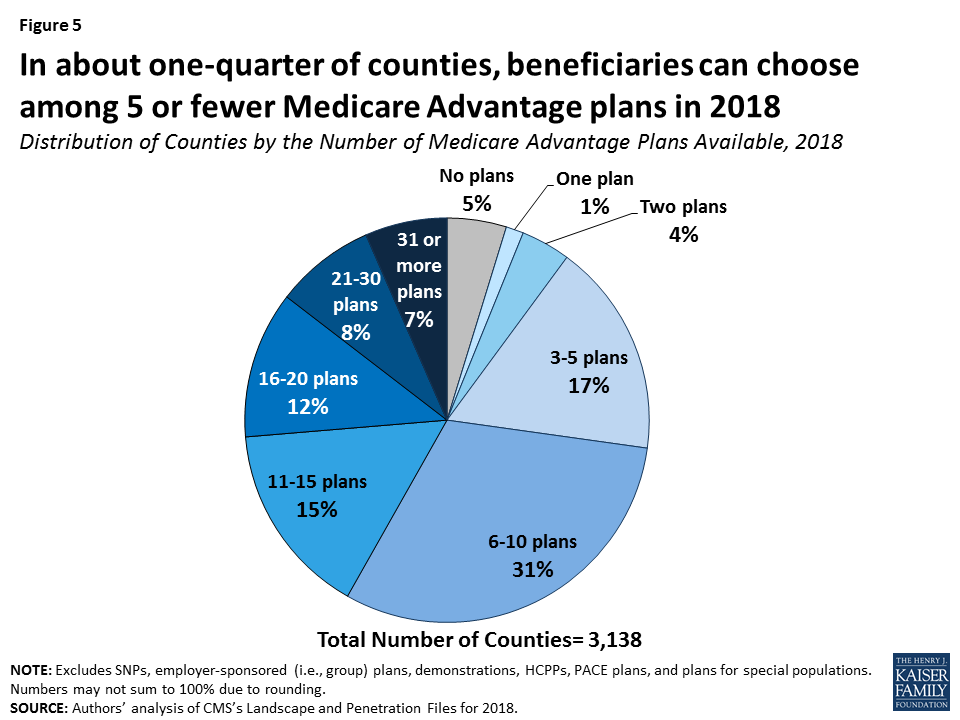
- Variation in Number of Plans. As in past years, the number of Medicare Advantage plans available will vary greatly across counties. In 206 counties, beneficiaries will be able to choose among more than 30 plans for the 2018 plan year, while in 44 counties, only one plan will be available to beneficiaries.
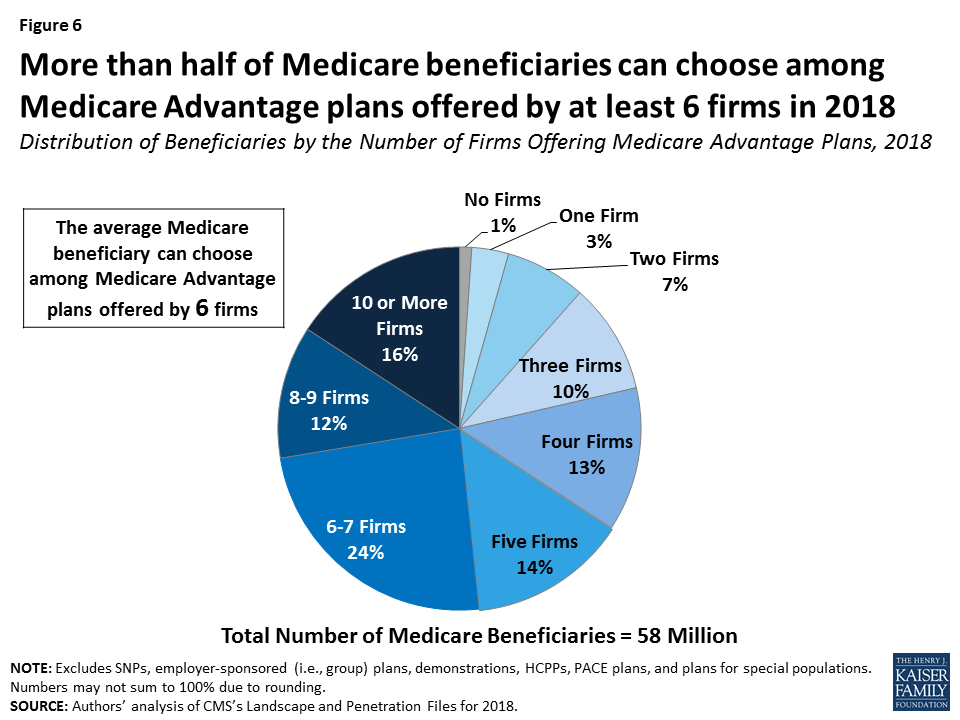
- Number of Firms. The average beneficiary will be able to choose from plans offered by 6 firms. About one in five beneficiaries (22%) nationwide will have a choice of plans offered by three or fewer firms in 2018 while 1 percent of beneficiaries will be able to choose from plans offered by 10 or more firms. In 441 counties (14% of counties), only one firm will be offering Medicare Advantage plans in 2018; about 3 percent of Medicare beneficiaries live in these counties.
- New Market Entrants and Exits. Seven insurers will be entering the Medicare Advantage market for the first time and five insurers will be exiting the market in 2018. These entries and exits account for a small number of the total plans in Medicare Advantage market with over 100 insurers offering plans nationwide.

Issue Brief
Plan Offerings in 2018
Number of Plans
Total Number of Plans. In total, 2,317 Medicare Advantage plans will be available nationwide for individual enrollment in 2018 – a 14 percent increase (283 more plans) from 2017 and the largest number of plans available since 2009 (Figure 1; Table A1). The increase in plans is predominantly among HMOs and local PPOs, with an additional 179 HMOs and 100 local PPOs. While the number of HMOs has increased each year since 2011, the size of the increase in 2018 is notable, and more HMOs and local PPOs will be offered in 2018 than any year since 2007. HMOs continue to account for the majority of plans available, and will account for about two-thirds (68%) of all plans offered in 2018.

Number of Plans Available to Beneficiaries. In 2018, the average Medicare beneficiary will have access to 21 Medicare Advantage plan, the highest number of plans per beneficiary since 2011 (Figure 2). Among the 21 Medicare Advantage plans available to the average Medicare beneficiary, 18 of the plans will include prescription drug coverage (MA-PDs). Between 2012 and 2017, the average number of plans available to Medicare beneficiaries was relatively stable. The number of plans available varies widely across the country and, as in past years, beneficiaries have more plans from which to choose in metropolitan than in non-metropolitan areas. On average, beneficiaries in metropolitan areas will be able to choose from nearly twice as many Medicare Advantage plans as beneficiaries in non-metropolitan areas (23 plans versus 12 plans, respectively).
Access to Medicare Advantage Plans
As in recent years, virtually all Medicare beneficiaries (99%) will continue to have access to a Medicare Advantage plan as an alternative to traditional Medicare (Figure 3). Almost all beneficiaries in metropolitan areas (99%) and the vast majority of beneficiaries in non-metropolitan areas (97%) will continue to have access to at least one Medicare Advantage plan, similar to percentages in 2017. Consistent with prior years, in non-metropolitan counties relative to metropolitan counties, a smaller share of beneficiaries will have access to HMOs or local PPOs, and a slightly larger share of beneficiaries will have access to private fee-for-service (PFFS) plans and regional PPOs.
Counties with No Medicare Advantage Plans.
In 149 counties, across 15 states, no Medicare Advantage plans will be available in 2018, a modest increase from 147 counties in 14 states in 2017 (Figure 4). These counties tend to be rural, and while they account for 5 percent of all counties, they account for only 1 percent of all Medicare beneficiaries. It is not entirely clear why insurers are not offering Medicare Advantage plans in these counties, but it could be because they have less leverage to negotiate rates with hospitals and other health care providers, smaller margins between the Medicare payment rates (benchmarks) and their operating costs, or other market conditions that make these counties potentially less profitable than others.
Variation in Number of Plans.
On average, 12 Medicare Advantage plans will be available per county in 2018, a slight increase from 11 plans, on average, in 2017, but this varies greatly across the country. In 15 percent of counties, beneficiaries can choose from more than 20 plans, including 7 percent of counties (206 counties) in which beneficiaries can choose from more than 30 plans in 2018, including Mahoning and Trumbull Counties in Ohio and Lancaster County, PA where more than 45 plans will be available (Figure 5). In contrast, in 27 percent of counties, beneficiaries can choose from five or fewer Medicare Advantage plans, including 45 counties in which only one plan will be available to beneficiaries; these counties with 1 or no plans account for 4 percent of Medicare beneficiaries.
Number of Firms
The average Medicare beneficiary will be able to choose from plans offered by 6 firms, on average, in 2018, the same as 2017 (Figure 6). However, about one in six beneficiaries (17%) will be able to choose from plans offered by 10 or more firms, while one in five beneficiaries (21%) will be able to choose from plans offered by three or fewer firms. The number of firms offering Medicare Advantage plans will be highest in the New York City area (Bronx, Kings, Queens, Nassau, New York, and Richmond Counties), large counties in southern California (Los Angeles, Orange, and Riverside Counties), Miami-Dade and Seminole Counties in Florida, and Butler County, Ohio where 12 or more firms will be offering Medicare Advantage plans. In contrast, in 441 counties, most of which are rural counties with few Medicare beneficiaries, only one firm will offer Medicare Advantage plans in 2018.
New Market Entrants and Exits.
Seven insurers will be entering the Medicare Advantage market for the first time and include start-ups as well as insurers that will only be offering Special Needs Plans. Five insurers will be exiting the market in 2018 – relatively few insurers in a market with over 100 insurers but evidence that not all plans in the Medicare Advantage market are profitable.
| Table A1: Availability of Medicare Advantage Plans and Firms, by State, 2018 | ||||||
| State | Total number of plans | Average number of plans available to beneficiaries | Average number of firms offering plans | Share of beneficiaries with access to at least 1 plan | ||
| All plans | HMOs | Local PPOs | ||||
| Nationwide | 2317 | 21 | 6 | 99% | 93% | 87% |
| Alabama | 36 | 11 | 4 | 100% | 92% | 100% |
| Alaska | 0 | 0 | N/A | 0% | 0% | 0% |
| Arizona | 43 | 17 | 6 | 100% | 92% | 89% |
| Arkansas | 38 | 16 | 6 | 100% | 100% | 78% |
| California | 186 | 23 | 9 | 97% | 95% | 51% |
| Colorado | 43 | 16 | 5 | 100% | 83% | 94% |
| Connecticut | 23 | 19 | 5 | 100% | 100% | 100% |
| Delaware | 8 | 8 | 3 | 100% | 100% | 100% |
| District of Columbia | 13 | 13 | 4 | 100% | 100% | 100% |
| Florida | 179 | 25 | 9 | 100% | 99% | 98% |
| Georgia | 48 | 14 | 6 | 100% | 83% | 89% |
| Hawaii | 14 | 8 | 4 | 100% | 100% | 100% |
| Idaho | 38 | 14 | 4 | 92% | 90% | 90% |
| Illinois | 83 | 23 | 6 | 100% | 98% | 93% |
| Indiana | 72 | 13 | 4 | 100% | 100% | 98% |
| Iowa | 31 | 9 | 3 | 100% | 92% | 95% |
| Kansas | 41 | 12 | 3 | 100% | 58% | 76% |
| Kentucky | 42 | 11 | 4 | 100% | 79% | 79% |
| Louisiana | 35 | 12 | 5 | 100% | 99% | 64% |
| Maine | 39 | 17 | 6 | 100% | 100% | 100% |
| Maryland | 24 | 13 | 4 | 97% | 96% | 71% |
| Massachusetts | 53 | 26 | 6 | 100% | 99% | 97% |
| Michigan | 63 | 29 | 5 | 100% | 100% | 100% |
| Minnesota | 48 | 38 | 6 | 100% | 100% | 99% |
| Mississippi | 20 | 7 | 2 | 100% | 77% | 58% |
| Missouri | 56 | 16 | 4 | 100% | 82% | 88% |
| Montana | 13 | 5 | 2 | 94% | 80% | 85% |
| Nebraska | 16 | 6 | 3 | 88% | 61% | 58% |
| Nevada | 29 | 11 | 4 | 97% | 96% | 97% |
| New Hampshire | 22 | 14 | 4 | 100% | 100% | 86% |
| New Jersey | 35 | 13 | 4 | 100% | 100% | 100% |
| New Mexico | 24 | 12 | 5 | 100% | 58% | 100% |
| New York | 162 | 33 | 11 | 100% | 100% | 100% |
| North Carolina | 49 | 12 | 4 | 100% | 94% | 92% |
| North Dakota | 16 | 9 | 2 | 96% | 0% | 50% |
| Ohio | 111 | 35 | 8 | 100% | 100% | 100% |
| Oklahoma | 33 | 13 | 4 | 100% | 77% | 82% |
| Oregon | 67 | 19 | 7 | 100% | 97% | 100% |
| Pennsylvania | 157 | 35 | 6 | 100% | 100% | 100% |
| Rhode Island | 12 | 12 | 2 | 100% | 100% | 0% |
| South Carolina | 41 | 10 | 5 | 100% | 96% | 90% |
| South Dakota | 20 | 11 | 2 | 100% | 26% | 79% |
| Tennessee | 46 | 16 | 6 | 100% | 100% | 100% |
| Texas | 136 | 24 | 7 | 100% | 89% | 92% |
| Utah | 21 | 11 | 5 | 95% | 95% | 90% |
| Vermont | 8 | 5 | 2 | 100% | 81% | 57% |
| Virginia | 78 | 12 | 4 | 100% | 91% | 86% |
| Washington | 99 | 20 | 6 | 90% | 88% | 78% |
| West Virginia | 29 | 16 | 4 | 100% | 100% | 100% |
| Wisconsin | 83 | 20 | 6 | 100% | 97% | 88% |
| Wyoming | 3 | 1 | 1 | 42% | 3% | 0% |
| NOTE: Excludes SNPs, employer-sponsored (i.e., group) plans, demonstrations, HCPPs, PACE plans, and plans for special populations. N/A indicates not applicable.SOURCE: Kaiser Family Foundation analysis of CMS Landscape File, 2018. | ||||||